Most action research in Philippine schools follows the same plan: give a pretest, try an intervention, give a posttest, and run a paired t-test. The Department of Education’s (DepEd) Action Research Toolkit calls this the one-group pretest-posttest design, a pre-experiment with “no randomization and control group”. It is easy to run, and it almost always finds a gain. That gain alone cannot show that an intervention worked.
One number from the Comprehensive Rapid Literacy Assessment (CRLA) shows why. In 6,061 public schools in five regions, the share of Grade 1 learners struggling in Mother Tongue reading fell from 72.9% at the start of SY 2025-26 to 12.6% at the end, with ordinary teaching. Any reading intervention tried in those classes, good or bad, would have looked like a success.
It is written for teachers designing an action research, for school heads and research committees who review proposals and reports, and for graduate students. Below are the two traps of the one-group design, ordinary growth and regression to the mean, shown with real CRLA results and a simulation, and the designs that avoid them.
Key points
- Learners grow anyway. In the same 6,061 schools, 96.7% raised their share of learners reading at grade level between the start and end of SY 2025-26, and the median school gained 36 percentage points. A one-group study cannot separate this growth from the intervention.
- Low scorers rise on a retest. Regression to the mean makes a group chosen for its low pretest scores rise at the posttest, even with no intervention. The fifth of CRLA schools with the lowest start-of-year share at grade level gained 42.1 points; the highest fifth gained 29.8.
- The trap is easy to fall into. In a simulation of 10,000 classes with no intervention, learners picked for the lowest pretest scores gained 8.9 points while every learner’s true growth was 5, and a paired t-test on them found a “significant” gain in 86.9% of the classes.
- A comparison group is the fix. Compare your class’s gain with that of a similar group chosen the same way and taught as usual. The toolkit’s quasi-experimental and true experimental designs do this.
- Choose with one test, measure with another. Selecting learners on one test and using a separate pretest removes much of the regression to the mean.
The one-group pretest-posttest design
The toolkit sorts experiments into three types by two features, a control group and random assignment:
| Type | Control group | Random assignment | Examples in the toolkit |
|---|---|---|---|
| Pre-experiment | No | No | One-shot case design; one-group pretest-posttest design |
| Quasi-experiment | May or may not have one | No | Non-randomized designs; time series design |
| True experiment | Yes | Yes | Pretest-posttest and posttest-only control group designs; factorial and randomized block designs |
It notes that pre-experiments and quasi-experiments “are more commonly used for Action Research because the experiments are conducted in the teachers’ classrooms”. The one-group pretest-posttest is the most common of all: one class, a pretest, the intervention, a posttest, and a paired t-test.
The paired t-test answers one question: did the scores change by more than chance would produce? It cannot answer the question a teacher cares about: did the intervention cause the change? Campbell and Stanley’s classic review of research designs listed the rival explanations a one-group design leaves open. Two of them matter most in schools: ordinary growth (which they called maturation) and regression to the mean.
Trap 1: learners grow anyway
Children learn over a school year from regular lessons, practice at home and simply growing older. The CRLA shows how much.
DepEd assessed Grade 1 to 3 learners at the start of SY 2025-26 in selected schools, and the EDCOM II dashboard reports the end-of-year results for all public schools. In the 6,061 schools covered by both, the share of Grade 1 learners struggling in Mother Tongue reading fell from 72.9% to 12.6%, and the share at Low Emerging, the lowest level, fell from 55.1% to 7.9%. 96.7% of schools raised their share of learners at grade level, and the median school gained 36 percentage points (the middle half gained 23 to 51).
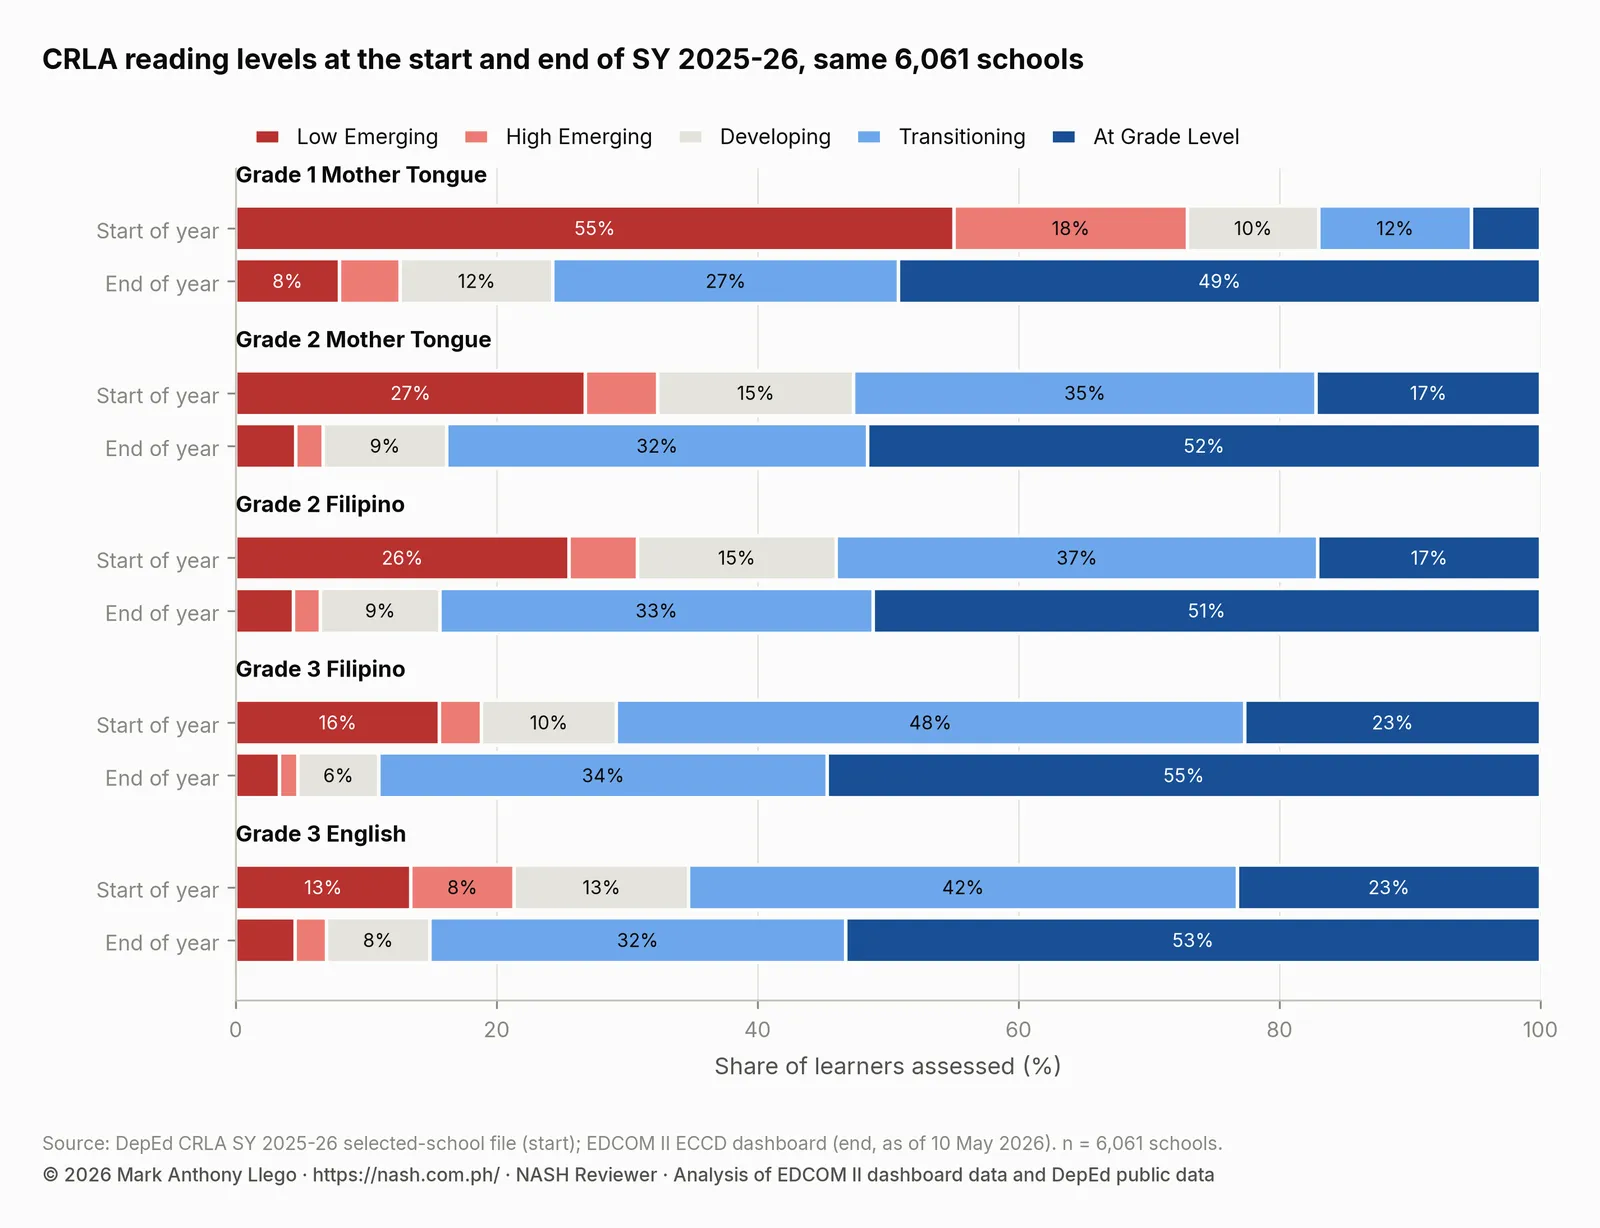
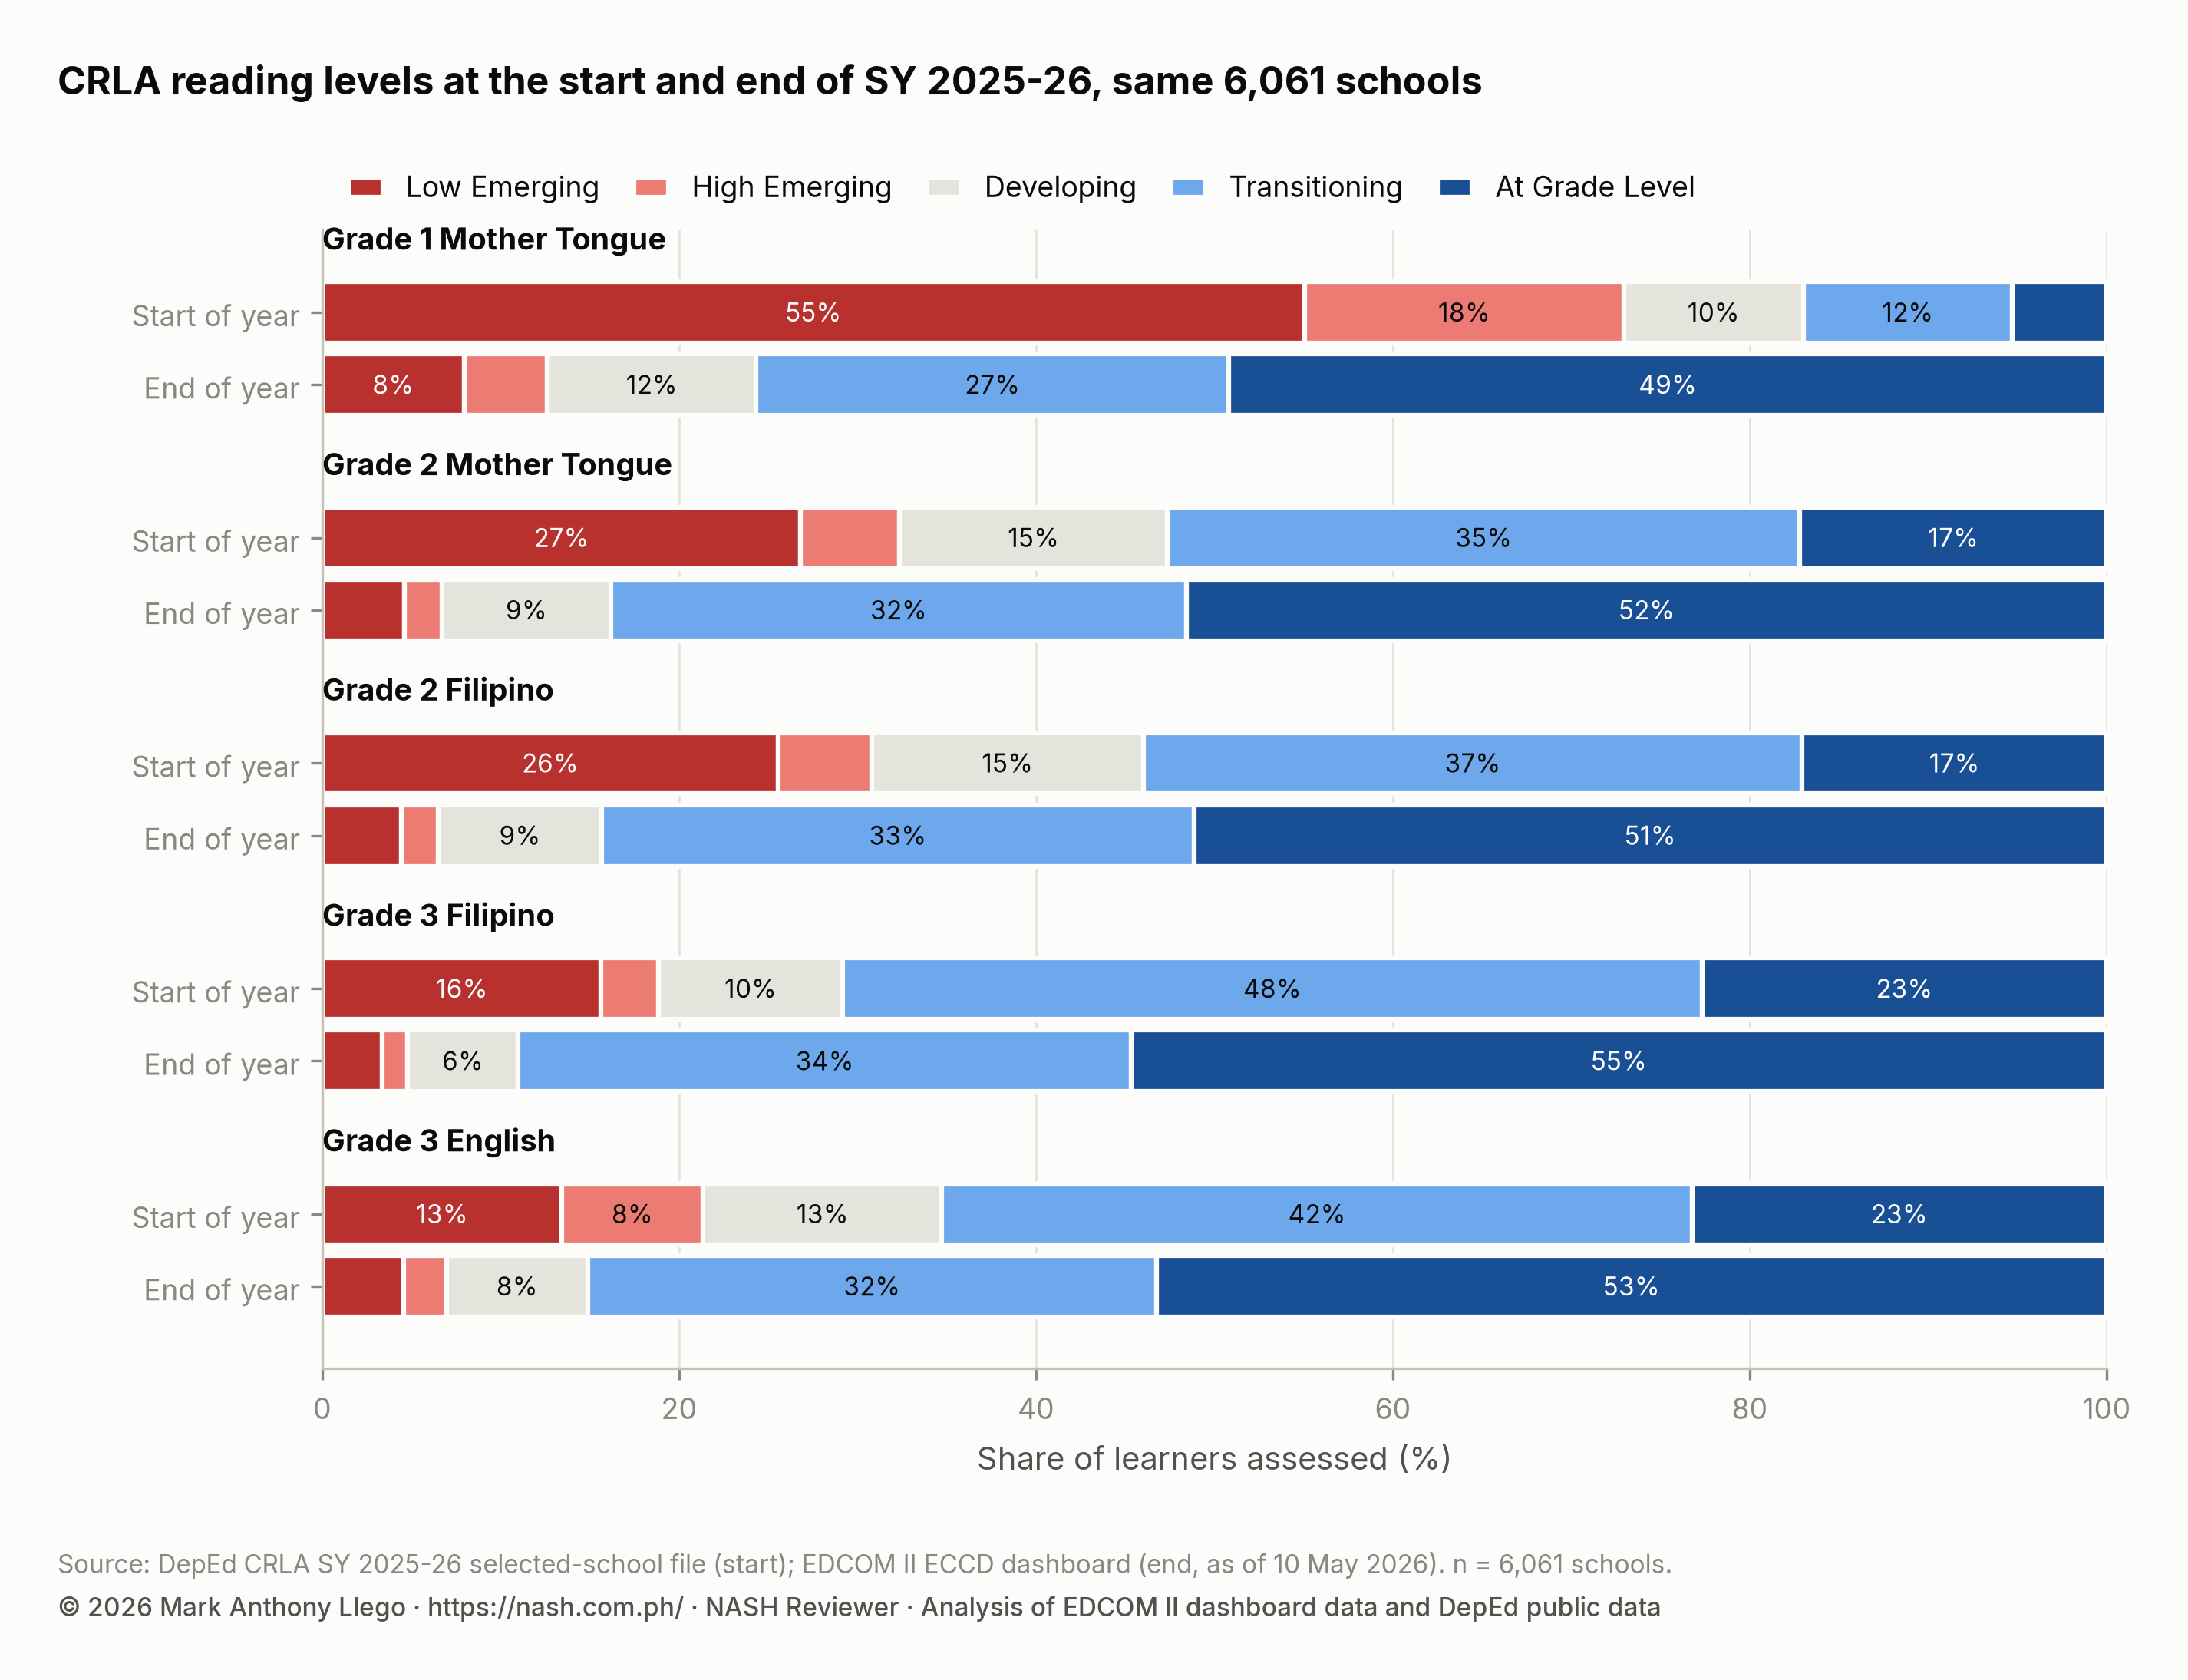
These gains came from a year of ordinary teaching, not from any one intervention. In one division, Candon City, a paired t-test on the 22 schools’ shares of Grade 1 struggling readers gives t(21) = −16.26, p < 0.001: overwhelming “evidence” of change that no action research produced. Paired and Independent t-Test in Excel for Action Research runs that test step by step.
A teacher who tried a new reading routine with a Grade 1 class from June to September would see the same growth in miniature. A paired t-test would almost certainly find a significant gain, and the gain would be real, but it would not show that the routine caused it.
Trap 2: regression to the mean
Regression to the mean is subtler. Every test score has two parts: what the learner really knows, and luck on the day, such as a lucky guess, a headache, a noisy room or an unfamiliar word. Learners with the lowest scores on one test are, on average, those whose luck was bad that day as well as those who know less. On the next test, their luck is ordinary again, so their scores rise toward their real level even if nothing else changes. Learners with the highest scores slip back for the same reason.
Action research often selects exactly the learners most affected: the lowest scorers on a pretest, the struggling readers, the frustration level in a reading inventory. Their posttest is likely to be higher, intervention or not.
What the CRLA shows
The same CRLA schools show the pattern. DepEd does not say which round its selected-school file covers, but its date and results point to the start of the year. Grouped into fifths by their start-of-year share of learners at grade level, the lowest fifth rose from 0.4% to 42.4%, a gain of 42.1 points, while the highest fifth rose from 35.1% to 64.9%, a gain of 29.8. Part of the gap between the groups at the start was noise: when the start-of-year shares are adjusted for school size, the lowest fifth starts at 3.5% instead of 0.4%, and the highest at 32.0% instead of 35.1%.
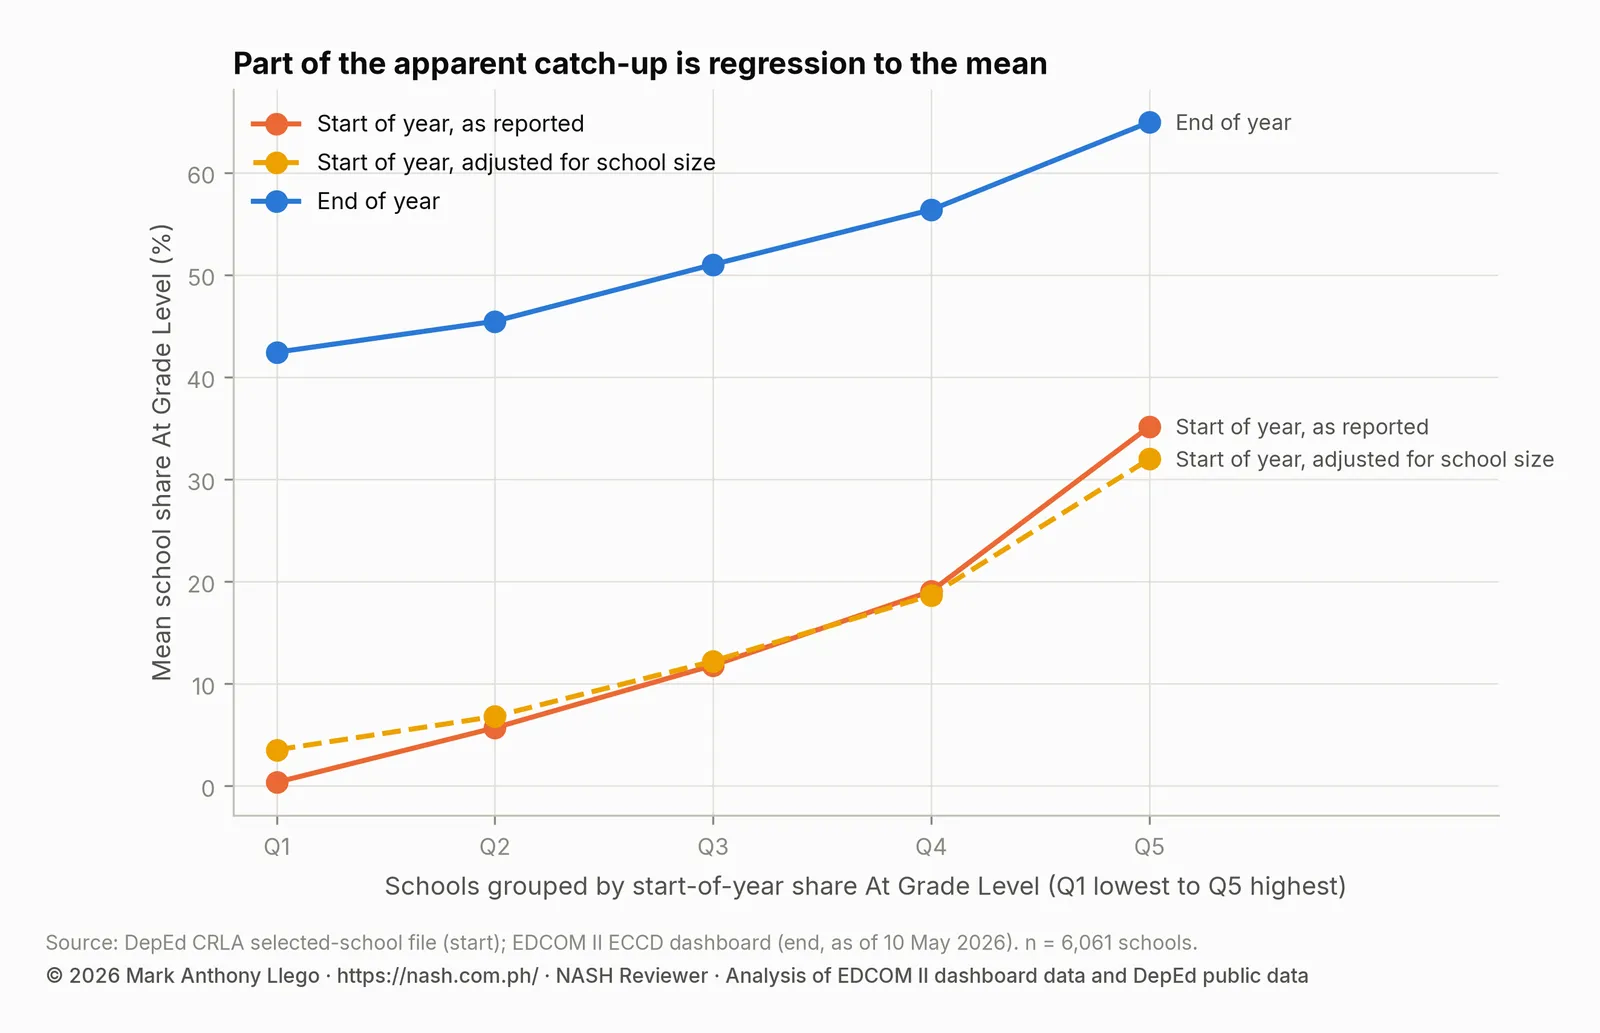
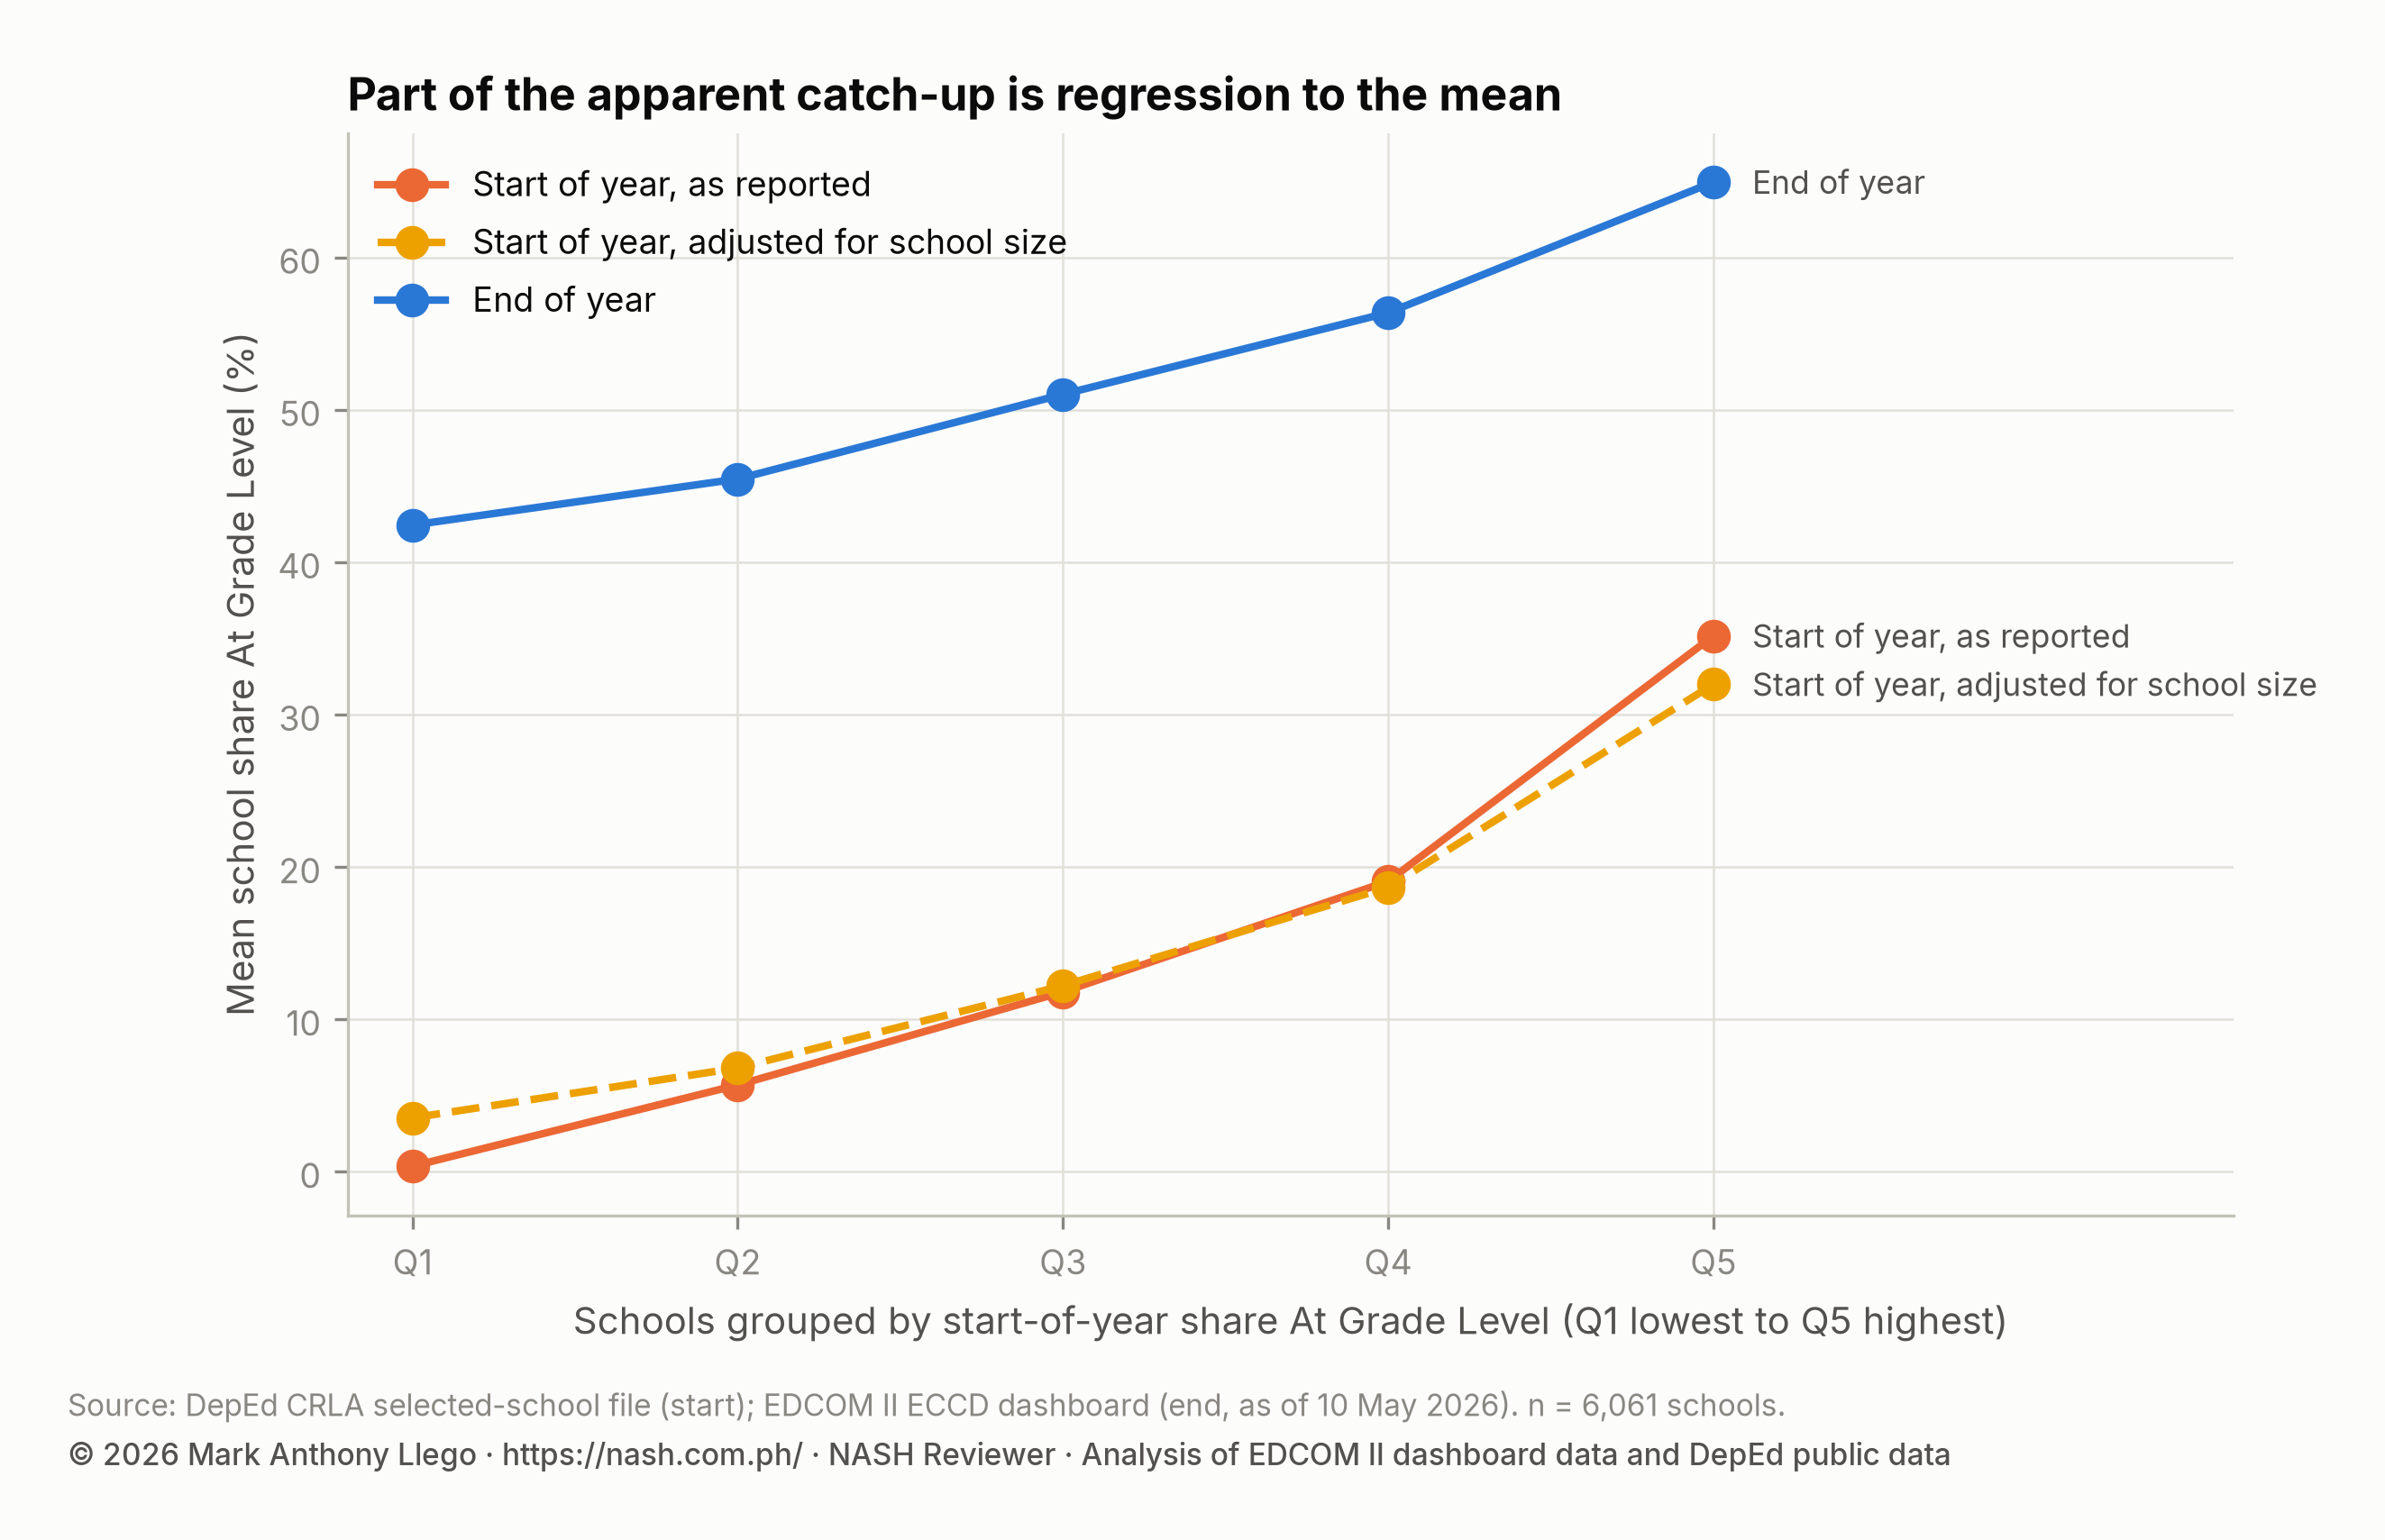
Schools that started lowest gained most. Some of that is real catching up, and some is regression to the mean; the data cannot fully separate the two, and neither can a one-group action research.
A simulation with no intervention at all
To isolate regression to the mean, we simulated 10,000 classes of 40 learners. Each learner has a true ability, and each test score adds random error, so that the test’s reliability is 0.74, typical of a short classroom test. Between the pretest and the posttest, every learner grows by exactly 5 points. There is no intervention. Learners are then grouped by their pretest score, as a teacher choosing struggling learners would group them.
| Group, by pretest | Pretest mean | Posttest mean | Gain |
|---|---|---|---|
| Lowest quarter | 35.5 | 44.4 | +8.9 |
| Second quarter | 46.2 | 52.3 | +6.0 |
| Third quarter | 53.8 | 57.8 | +4.0 |
| Highest quarter | 64.5 | 65.7 | +1.2 |
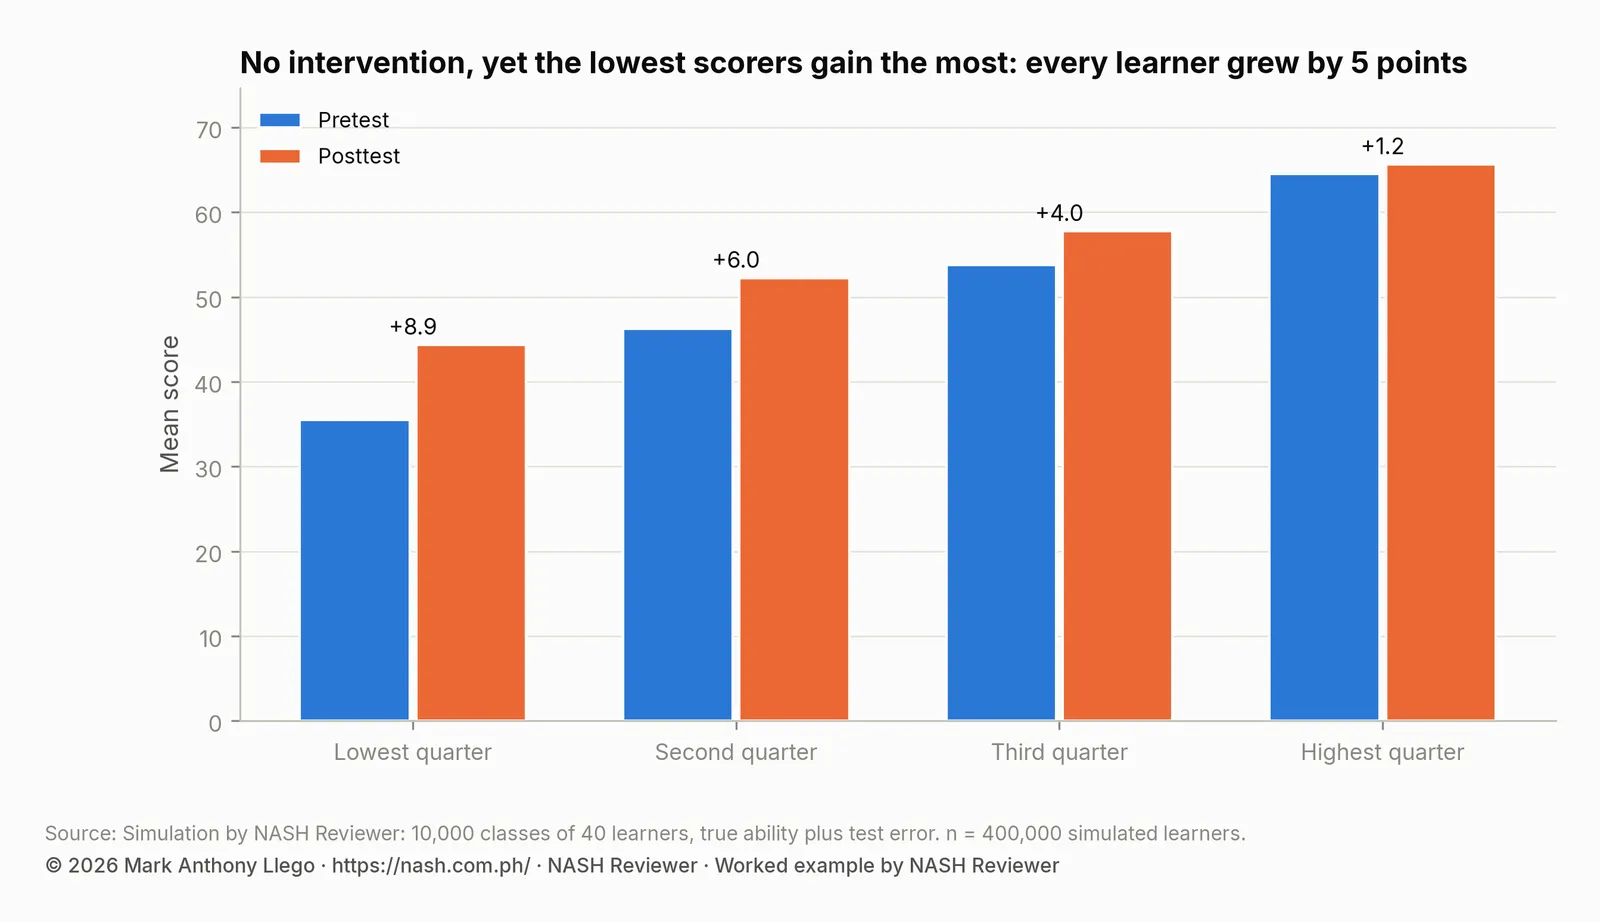
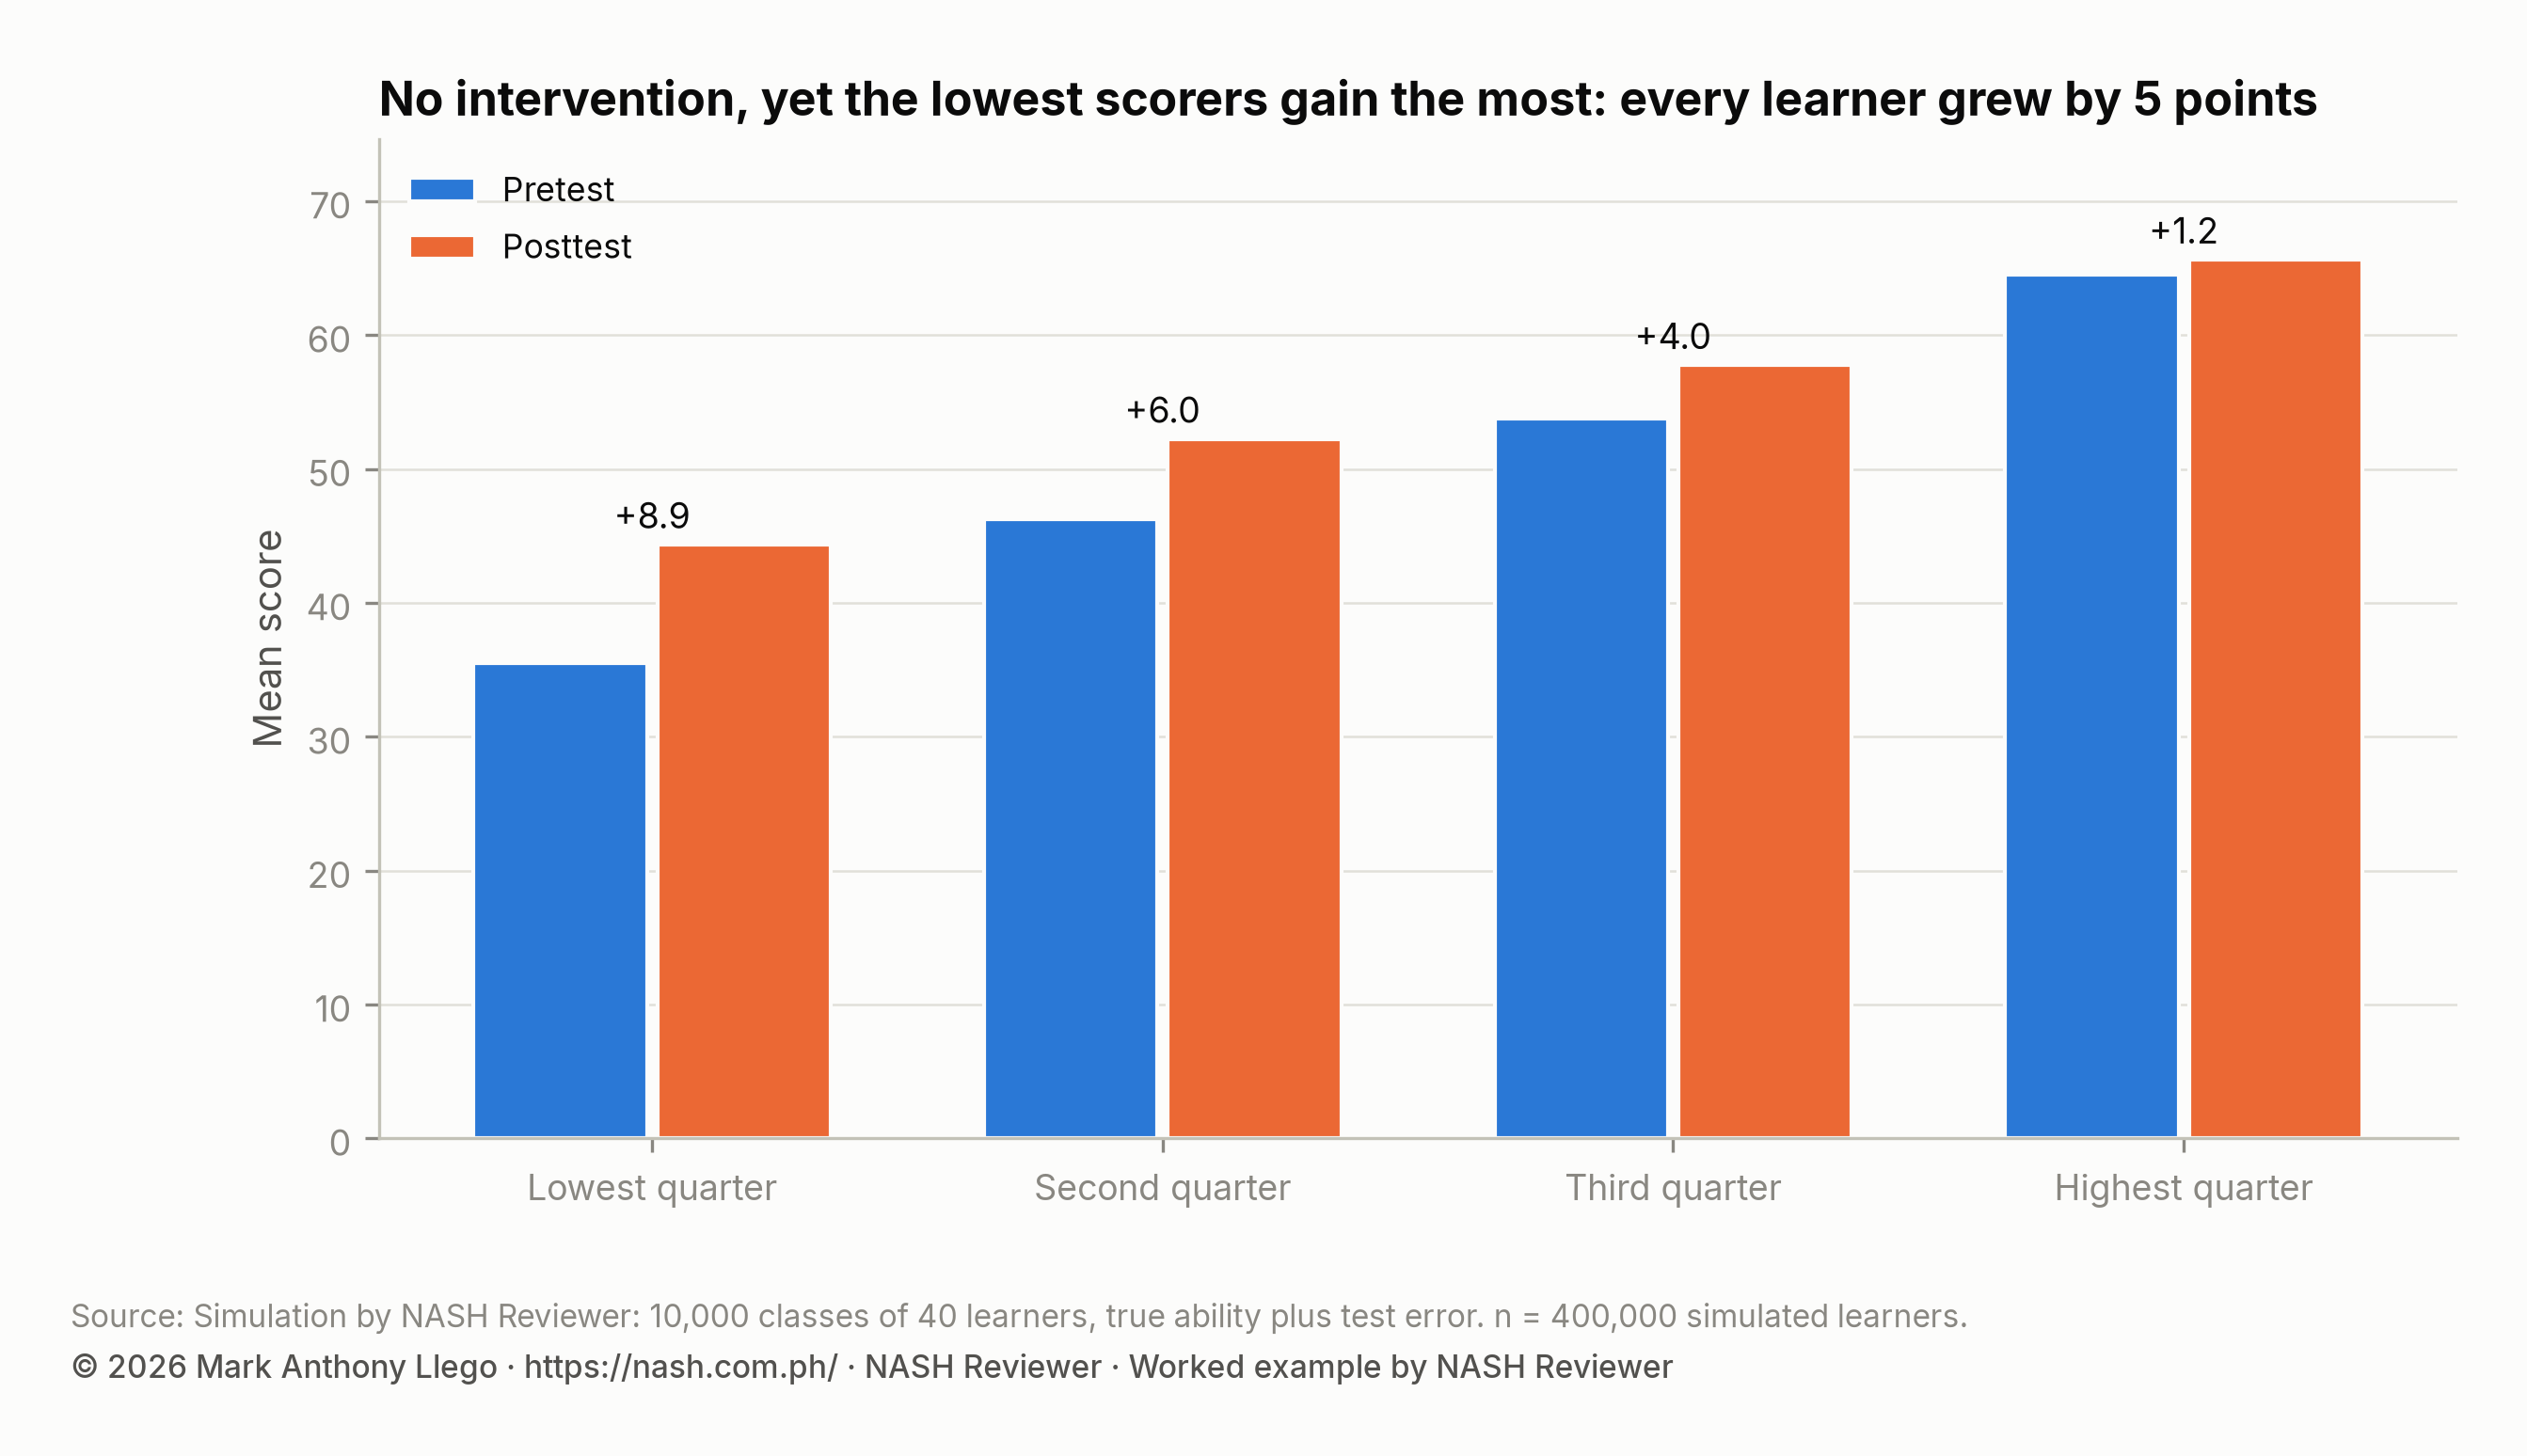
Every learner grew by 5 points, yet the lowest quarter appears to gain 8.9 and the highest only 1.2. If there were no growth at all, the lowest quarter would still gain 3.9 points on average and the highest quarter would lose 3.8. A teacher who gave an intervention to the ten lowest scorers in each class and ran a paired t-test would have found a “significant” gain in 86.9% of the classes, with nothing to credit but ordinary growth and regression to the mean.
The less reliable the test, the stronger the effect. Short teacher-made tests, single reading passages and tests given in noisy rooms are the most affected.
Other rival explanations
Campbell and Stanley listed more threats to a one-group design. In a school, look out for:
- Testing: taking the pretest can raise the posttest score by itself, through practice or familiarity with the format, especially if the two tests are the same.
- Instrumentation: a different test form, a different examiner or stricter or looser scoring at the posttest. The CRLA, for example, is given by teachers, so how it is given can differ between rounds.
- History: events between the two tests, such as a reading month, a new set of books, class suspensions or a change of teacher.
- Attrition: learners who leave or miss the posttest. If the weakest learners drop out, the posttest mean rises.
Designs that avoid the traps
Add a comparison group
The simplest fix is a second group, chosen the same way and taught as usual: for example, the struggling readers in a parallel section. Both groups grow and both regress to the mean; the difference between their gains estimates what the intervention added. This is the toolkit’s own example: an experimental and a control group, a pretest for both, and the posttests compared with an independent t-test. Compare the gains, or the posttests after checking that the pretests were similar.
Randomize who starts first
When every eligible learner should receive the intervention, randomly assign half to receive it in the first half of the quarter and the other half in the second, and test everyone at the midpoint. This waitlist design is a true experiment: random assignment makes the groups comparable, and no learner is denied the intervention. It also meets the toolkit’s ethical protocol of justice.
Select with one test, measure with another
Choose the learners with one assessment, such as the start-of-year CRLA or a screening test, then give a separate pretest. Bad luck on the selection test does not carry over to the pretest, so most of the regression happens before the study begins.
Measure more than twice
The toolkit lists the time series design among quasi-experiments: several measurements before the intervention show the usual trend, and a break in the trend after it is more convincing than a single before-and-after difference. Weekly short assessments, such as words read correctly per minute, suit this design.
Compare with the usual growth
If no comparison group is possible, compare your learners’ gain with the usual gain for similar learners in your school or division, such as the start- and end-of-year CRLA results of earlier years. This is weaker than a comparison group, but much better than no comparison at all.
Use reliable measures
Longer tests, standardized administration, and two scorers for oral reading reduce test error and therefore regression to the mean. Report the reliability of teacher-made tests when you can.
A worked design: a Grade 1 reading intervention
A teacher wants to help the Low Emerging readers in her Grade 1 section. Instead of a one-group design:
- Select all Low Emerging readers in both Grade 1 sections using the start-of-year CRLA.
- Pretest them with a separate letter-sound test given by a colleague.
- Intervene with her section’s Low Emerging readers for ten weeks; the other section’s continue with regular lessons and receive the routine afterward.
- Posttest both groups with the same test, given by the same colleague.
- Analyze the gains of the two groups with an independent t-test and an effect size, and report each group’s paired change as well.
Both groups grow and both regress to the mean; the difference between them is the routine’s estimated effect. DepEd Action Research Proposal Format, With a Sample writes this design up as a full proposal, and DepEd Action Research Report Format, With a Sample shows how to report it.
Common mistakes
- Crediting the intervention with a gain from a one-group design. Say that scores rose; do not say the intervention caused the rise.
- Choosing the lowest scorers and testing them again. They will rise anyway. Select on a separate test, and compare with a group chosen the same way.
- Comparing with a group chosen differently. A comparison section of average learners regresses less than a group of the lowest scorers, so the difference is biased.
- Changing the test between pretest and posttest. Use the same or an equivalent form, given the same way.
- Ignoring dropouts. Report how many learners were lost and how they compare with those who stayed.
Frequently asked questions
What is a one-group pretest-posttest design?
A design in which one group takes a pretest, receives an intervention, and takes a posttest. DepEd’s Action Research Toolkit classes it as a pre-experiment, with no control group and no random assignment. It shows whether scores changed, but not whether the intervention caused the change.
What is regression to the mean in simple terms?
Learners who score unusually low on one test tend to score closer to their usual level on the next, because part of a low score is bad luck that does not repeat. A group chosen for its low scores therefore rises on a retest even without any help, and a group chosen for high scores slips back.
How much do learners improve in a school year without an intervention?
In the CRLA for SY 2025-26, in 6,061 public schools in five regions, the share of Grade 1 learners struggling in Mother Tongue reading fell from 72.9% at the start of the year to 12.6% at the end, with ordinary teaching. The median school raised its share of learners at grade level by 36 percentage points.
How can I avoid regression to the mean in my action research?
Use a comparison group chosen the same way as your intervention group, select learners with one test and measure them with another, use reliable tests, and measure more than twice if you can. Random assignment, such as a waitlist design, gives the strongest answer.
Is a one-group pretest-posttest design ever acceptable?
It can describe change and is often a reasonable first study, especially with a qualitative part that explains how learners responded. Report it honestly as a pre-experiment, note that growth and regression to the mean may explain part of the gain, and plan a comparison group next time.
More on DepEd research
- Start here: DepEd Action Research Guide: From Topic to Report
- Sample Action Research in DepEd Format: A Complete Example
- Paired and Independent t-Test in Excel for Action Research
- Action Research Sample Size: Slovin, Power and Sampling
- DepEd Action Research Proposal Format, With a Sample
- DepEd Action Research Ethics: Consent, Assent and Privacy
- Action Research and Thesis Topics on Reading (CRLA)
- Related: CRLA Start vs End of SY 2025-26 in the Same Schools, How to Read a School’s CRLA Results Fairly
Sources
- Department of Education and the Basic Education Sector Transformation (BEST) Program. (2019). Action Research Toolkit: Teacher’s Guide, sections 3.1 (experimental designs) and 5.3 (inferential statistics), with support from the Australian Government.
- Campbell, D. T., & Stanley, J. C. (1963). Experimental and quasi-experimental designs for research. Rand McNally.
- Barnett, A. G., van der Pols, J. C., & Dobson, A. J. (2005). Regression to the mean: What it is and how to deal with it. International Journal of Epidemiology, 34(1), 215–220.
- CRLA results: DepEd’s selected-school CRLA file for SY 2025-26 (DepEd does not say which round it covers, but its date and results point to the start of the year) and the end-of-year results from the EDCOM II early-childhood dashboard data, cleaned by NASH Reviewer; see CRLA Start vs End of SY 2025-26 in the Same Schools for the method and the school-size adjustment.
- The simulation: 10,000 classes of 40 learners; true ability with a standard deviation of 10, test error with a standard deviation of 6 (reliability 0.74), and a uniform growth of 5 points.
Analysis and charts by Mark Anthony Llego for NASH Reviewer. NASH Reviewer is not affiliated with DepEd or EDCOM II.