From the EDCOM II classroom construction dashboard
EDCOM II classroom data: the 2023 shortage and 2026 classrooms
This report covers the data behind the classroom construction dashboard of EDCOM II, the Second Congressional Commission on Education: DepEd’s 2023 classroom shortage for 47,659 public schools, the 5,652 lines of the School Building Program (SBP) 2026 masterlist, SY 2024-25 enrollment and class shifts, and 2023 school facilities. NASH Reviewer extracted the dashboard’s workbook, cleaned it, linked 48,003 schools to their barangay, and analyzed where the shortage is and where the 2026 classrooms go. Every chart comes with a table of its numbers.
The cleaned data behind every chart is free to download in CSV, Parquet, Stata, SPSS and Excel, with the raw extract and a cleaning log, for personal study. Download the classroom data.
- Classrooms short in 2023, at 25,823 of 47,659 public schools (54.2%)
- 165,443
- Classrooms in the SBP 2026 masterlist, at 5,231 schools; 16,114 are funded under the GAA 2026
- 32,419
- Share of the 2026 classrooms that fall within the receiving school’s own 2023 shortage
- 53.0%
- Share of the uneven spread of the shortage that lies between schools in the same division
- 78.6%
What the EDCOM II classroom data cover
The dashboard is a Tableau workbook with two dashboards, School Level Classroom Construction and LGU Breakdown, built on 15 worksheets and 25 calculated fields. Its five tables, 209,142 rows in all, were extracted unfiltered and kept unchanged before any cleaning.
| Dashboard table | Rows as extracted | Columns | Cleaned table | Rows after cleaning | Used for |
|---|---|---|---|---|---|
| School coordinates 2022 | 47,689 | 18 | school_coordinates_2022 | 47,689 | Locations, PSGC codes and urban or rural |
| Facilities 2023 | 60,167 | 87 | facilities_2023 | 60,167 | Classrooms, buildings, makeshift rooms and condition |
| Enrollment and class shifts, SY 2024-25 | 47,972 | 42 | enrolment_2024 | 47,972 | Learners and class shifts by level |
| Classroom shortage 2023 | 47,662 | 19 | shortages_2023 | 47,662 | The shortage and excess by school |
| School Building Program 2026 masterlist | 5,652 | 14 | sbp_projects | 5,652 | The 2026 classrooms, line by line |
Each table comes from a different year: school coordinates from SY 2022-23, the shortage and facilities from 2023, enrollment and class shifts from SY 2024-25, and the SBP masterlist from 2026. Learners per classroom on this page divide SY 2024-25 learners by 2023 rooms.
The cleaned school table has one row for each of 48,131 public schools, in 104 columns. 48,003 schools (99.7%) take their PSGC barangay from validated school-to-barangay links; the other 128 are matched to a municipality by name.
Sulu’s 460 schools are in Region IX in every table: the Schools Division Office of Sulu moved from MBHTE-BARMM to DepEd Region IX on 20 October 2026. School IDs are the current ones; 360 schools received a new ID after 2023.
Mark Anthony Llego extracted, cleaned and analyzed the data and drew the charts for NASH Reviewer (https://nash.com.ph/). The report was published on 28 October 2026. The cleaning and every figure can be re-run from the raw extract.
The 2023 classroom shortage, school by school
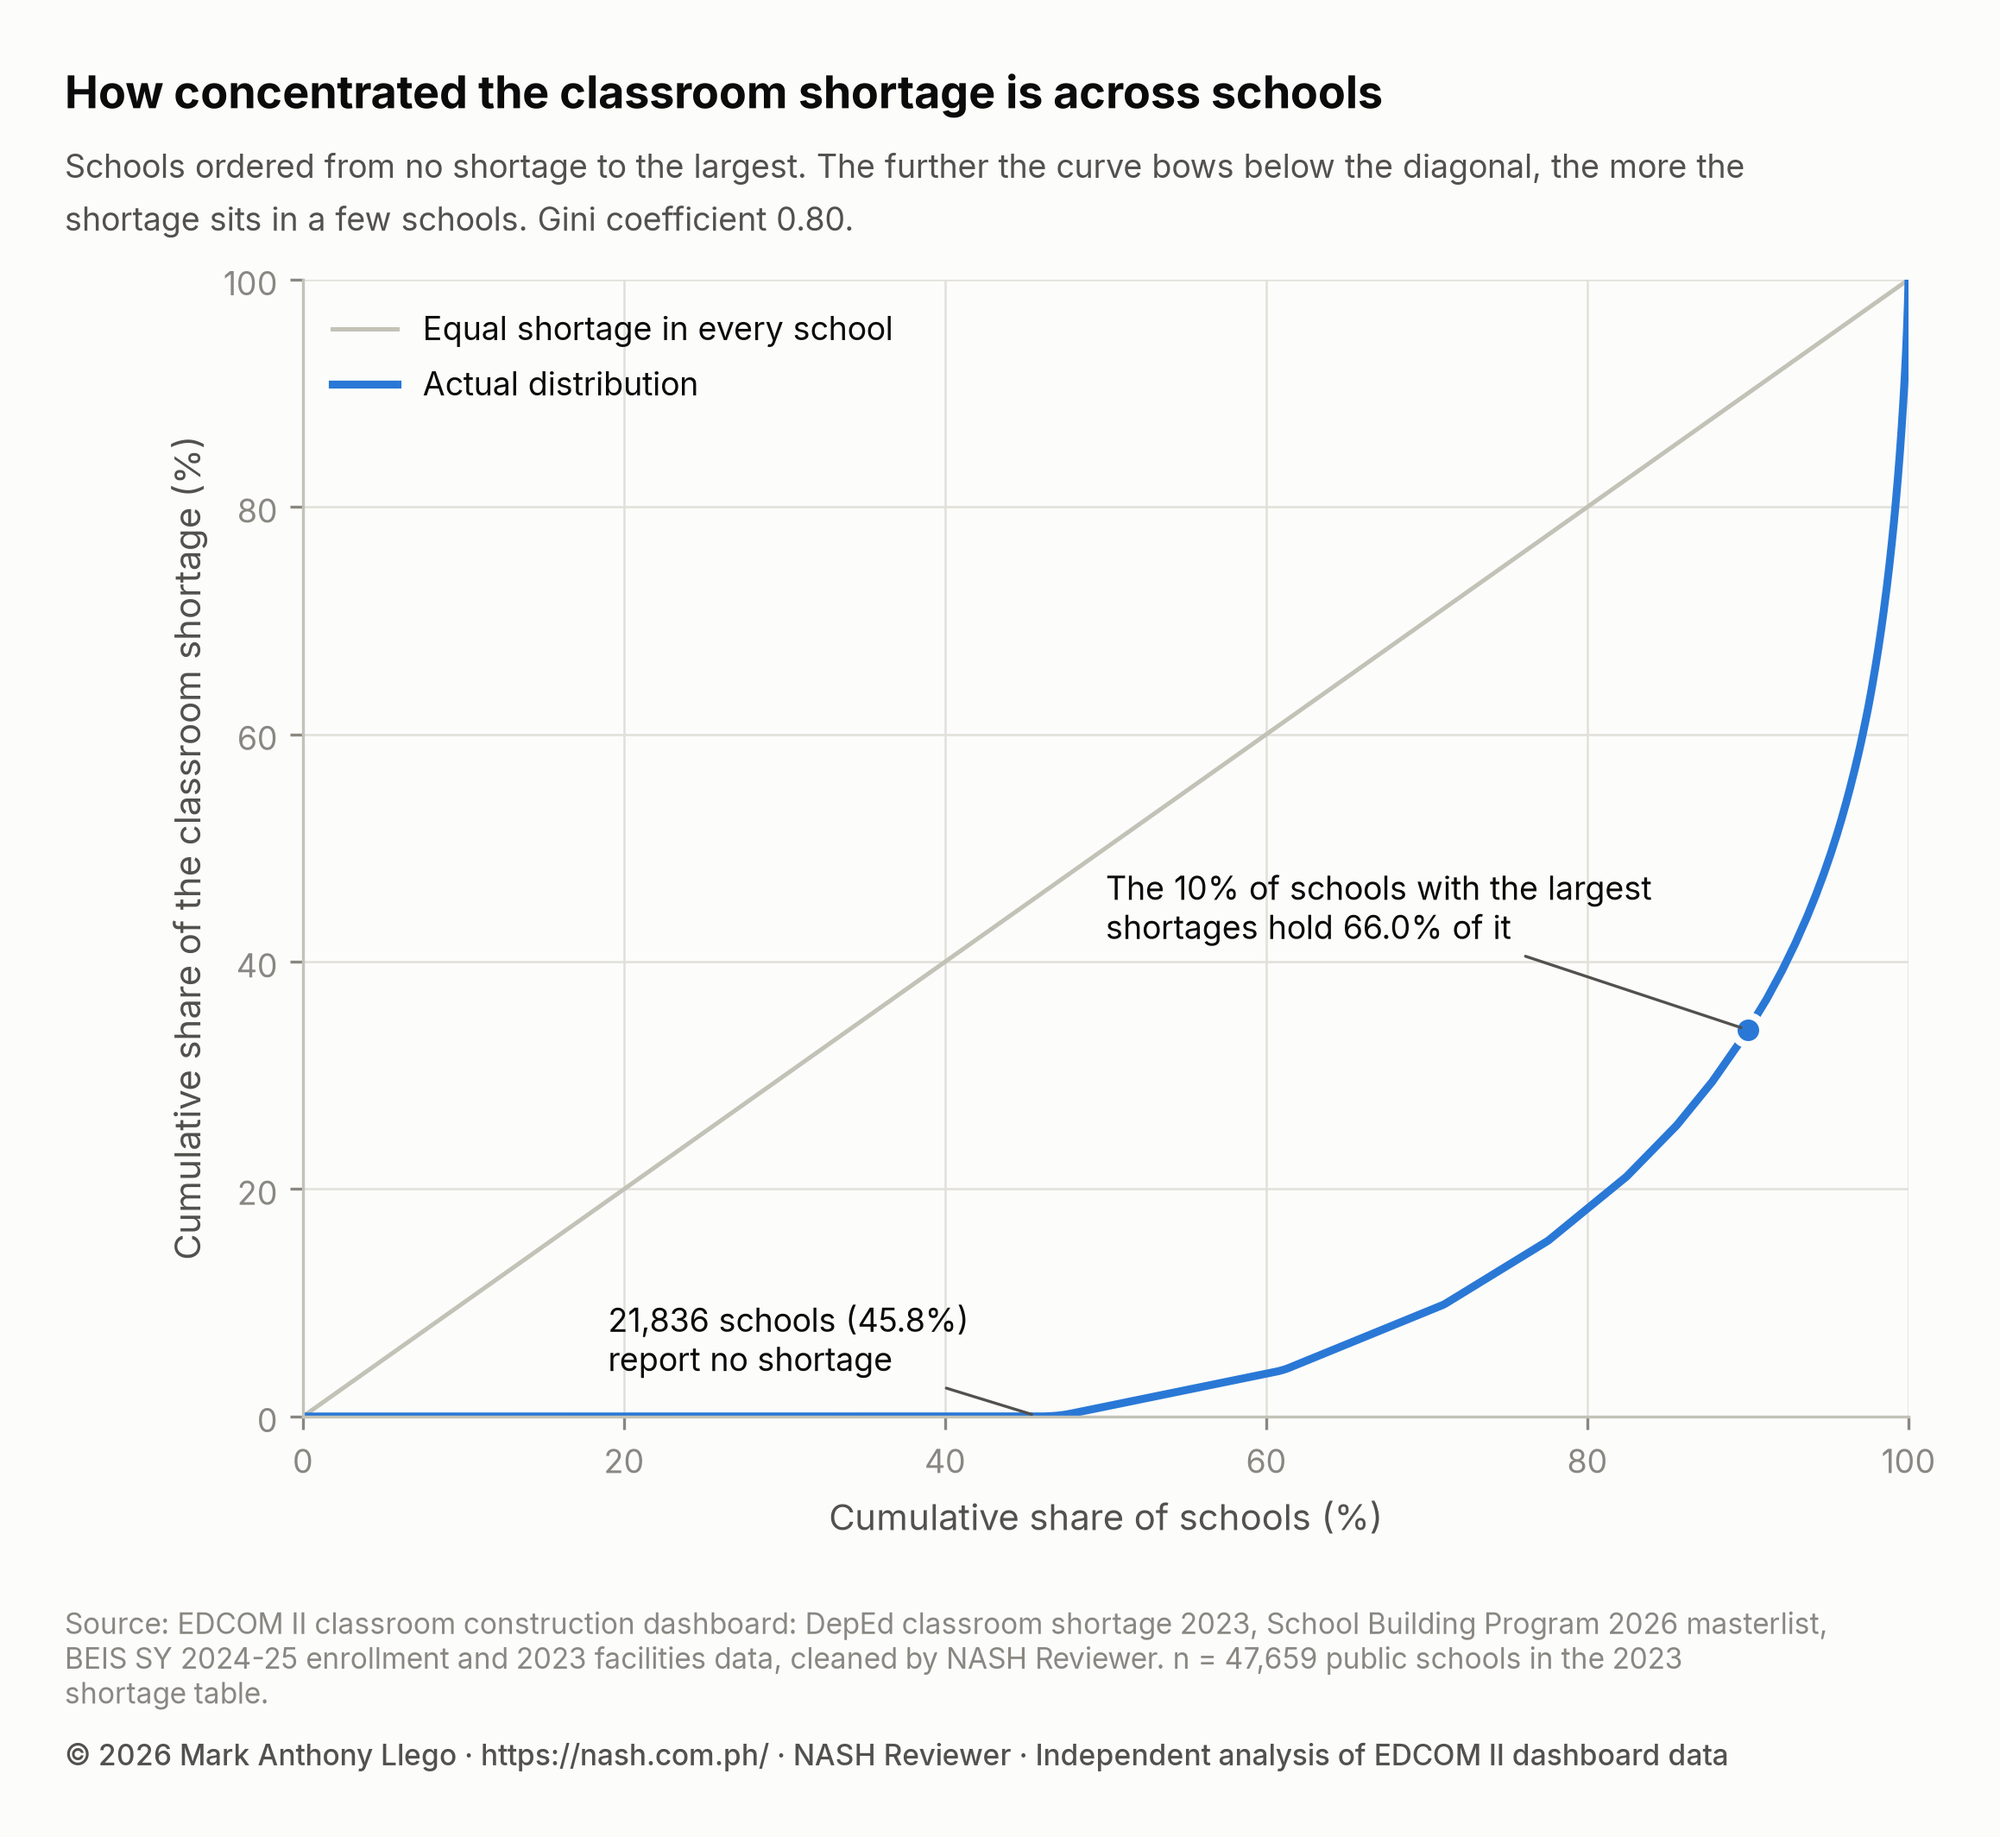
DepEd’s 2023 data put the classroom shortage at 165,443 classrooms. 25,823 of 47,659 public schools (54.2%) have one; the other 21,836 have none.
Show the data as a table
| Schools, ranked by shortage | Schools | Share of the 2023 shortage |
|---|---|---|
| Top 1% | 477 | 22.6% |
| Top 5% | 2,383 | 51.2% |
| Top 10% | 4,766 | 66.0% |
| Fewest schools holding half the shortage | 2,254 | 50% |
| Schools with no shortage | 21,836 | 0% |
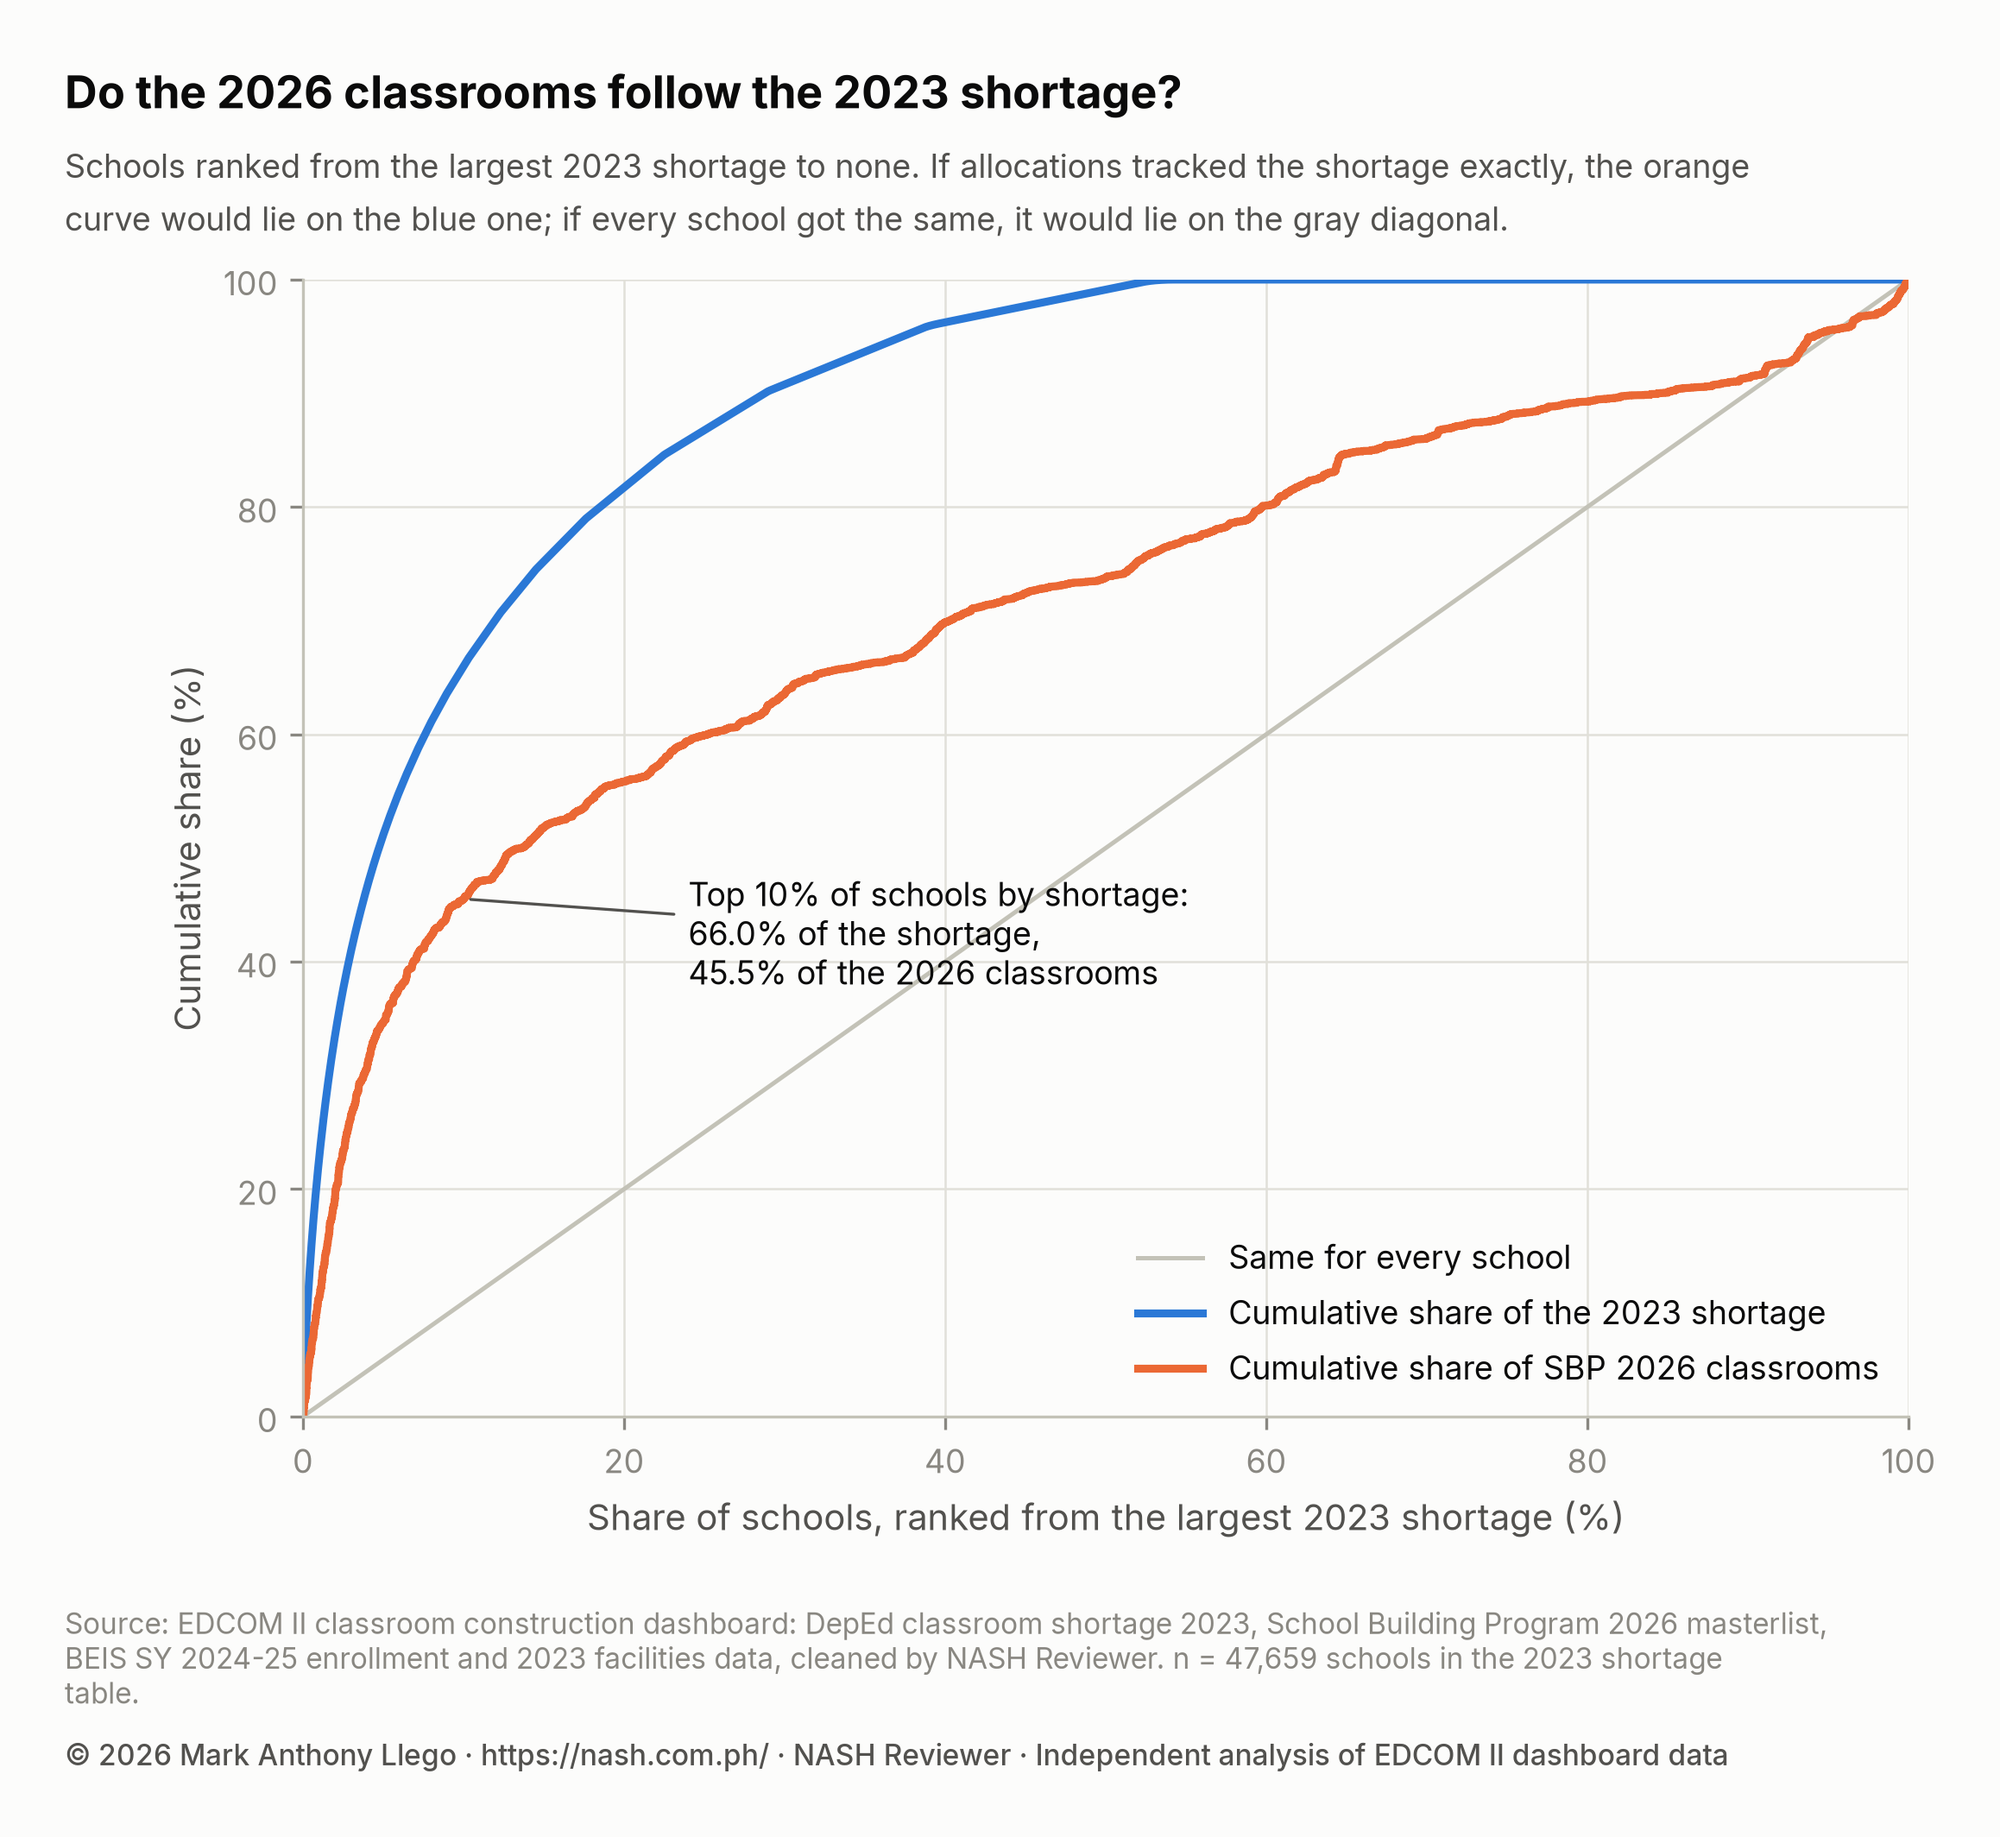
The shortage is concentrated. The tenth of schools with the largest shortages hold 66.0% of it, the top 1% (477 schools) hold 22.6%, and 2,254 schools (4.7%) hold half. The Gini coefficient across all schools is 0.80.
Among schools with a shortage, the median is 3.0 classrooms and the 90th percentile 13.0. The largest, 319 classrooms, is at Batasan Hills National HS (Quezon City, NCR).
Kindergarten to Grade 10 accounts for 89.3% of the shortage, and senior high school for 17,783 classrooms.
Against SY 2024-25 enrollment, the shortage is 7.4 classrooms per 1,000 learners: 8.4 in urban schools and 6.1 in rural ones.
Classroom shortage by region
Per 1,000 learners, the shortage ranges from 2.9 in Region I to 14.3 in BARMM, a gap of 5.0 to one. The national rate is 7.4.
Show the data as a table
| Region | Schools | Schools with a shortage | Classroom shortage | Share of national shortage | Shortage per 1,000 learners | Median shortage, schools with one |
|---|---|---|---|---|---|---|
| BARMM | 2,150 | 87.0% | 11,064 | 6.7% | 14.3 | 5.0 |
| NCR | 827 | 80.4% | 24,866 | 15.0% | 12.2 | 26.0 |
| Region IV-A | 3,552 | 63.2% | 31,010 | 18.7% | 10.1 | 5.0 |
| Region X | 2,521 | 71.4% | 10,333 | 6.2% | 9.1 | 3.0 |
| Region IX | 2,985 | 60.2% | 8,826 | 5.3% | 8.2 | 3.0 |
| Region XII | 2,139 | 70.7% | 8,281 | 5.0% | 8.0 | 4.0 |
| Region VII | 2,782 | 58.0% | 10,857 | 6.6% | 7.8 | 3.0 |
| Region XI | 2,206 | 58.2% | 8,532 | 5.2% | 7.2 | 3.0 |
| CAR | 1,844 | 48.3% | 2,301 | 1.4% | 6.7 | 2.0 |
| CARAGA | 2,096 | 58.2% | 4,410 | 2.7% | 6.4 | 2.0 |
| MIMAROPA | 2,377 | 52.5% | 4,777 | 2.9% | 6.0 | 2.0 |
| Region III | 3,705 | 49.5% | 13,119 | 7.9% | 5.5 | 3.0 |
| Region VIII | 4,188 | 49.6% | 5,990 | 3.6% | 5.4 | 2.0 |
| Region V | 3,852 | 51.5% | 7,415 | 4.5% | 4.9 | 2.0 |
| NIR | 2,211 | 48.8% | 4,579 | 2.8% | 4.2 | 2.0 |
| Region VI | 2,829 | 33.1% | 3,522 | 2.1% | 3.5 | 2.0 |
| Region II | 2,535 | 35.6% | 2,501 | 1.5% | 3.2 | 2.0 |
| Region I | 2,860 | 30.3% | 3,061 | 1.9% | 2.9 | 2.0 |
| Division | Region | Learners | Classroom shortage | Shortage per 1,000 learners |
|---|---|---|---|---|
| Tawi-Tawi | BARMM | 80,627 | 1,952 | 24.2 |
| Dinagat Island | CARAGA | 28,139 | 624 | 22.2 |
| San Pedro City | Region IV-A | 51,675 | 1,056 | 20.4 |
| Basilan | BARMM | 56,136 | 970 | 17.3 |
| Las Piñas City | NCR | 90,254 | 1,469 | 16.3 |
| Malabon City | NCR | 68,507 | 1,105 | 16.1 |
| Tayabas City | Region IV-A | 21,246 | 346 | 15.7 |
| Sulu | Region IX | 142,541 | 2,173 | 15.2 |
| Antipolo City | Region IV-A | 176,473 | 2,663 | 15.1 |
| Imus City | Region IV-A | 73,799 | 1,108 | 15.0 |
By count, the three regions with the largest shortages (Region IV-A, NCR, Region III) hold 41.7% of it. BARMM has the highest rate but a smaller count, because it has fewer learners.
Among divisions with at least 20,000 learners, Tawi-Tawi (BARMM) has the highest rate: 24.2 classrooms short per 1,000 learners.
A region’s rate averages very different divisions and schools, so it says little about any one school. The next section shows how little.
Region, division or school: where the gap sits
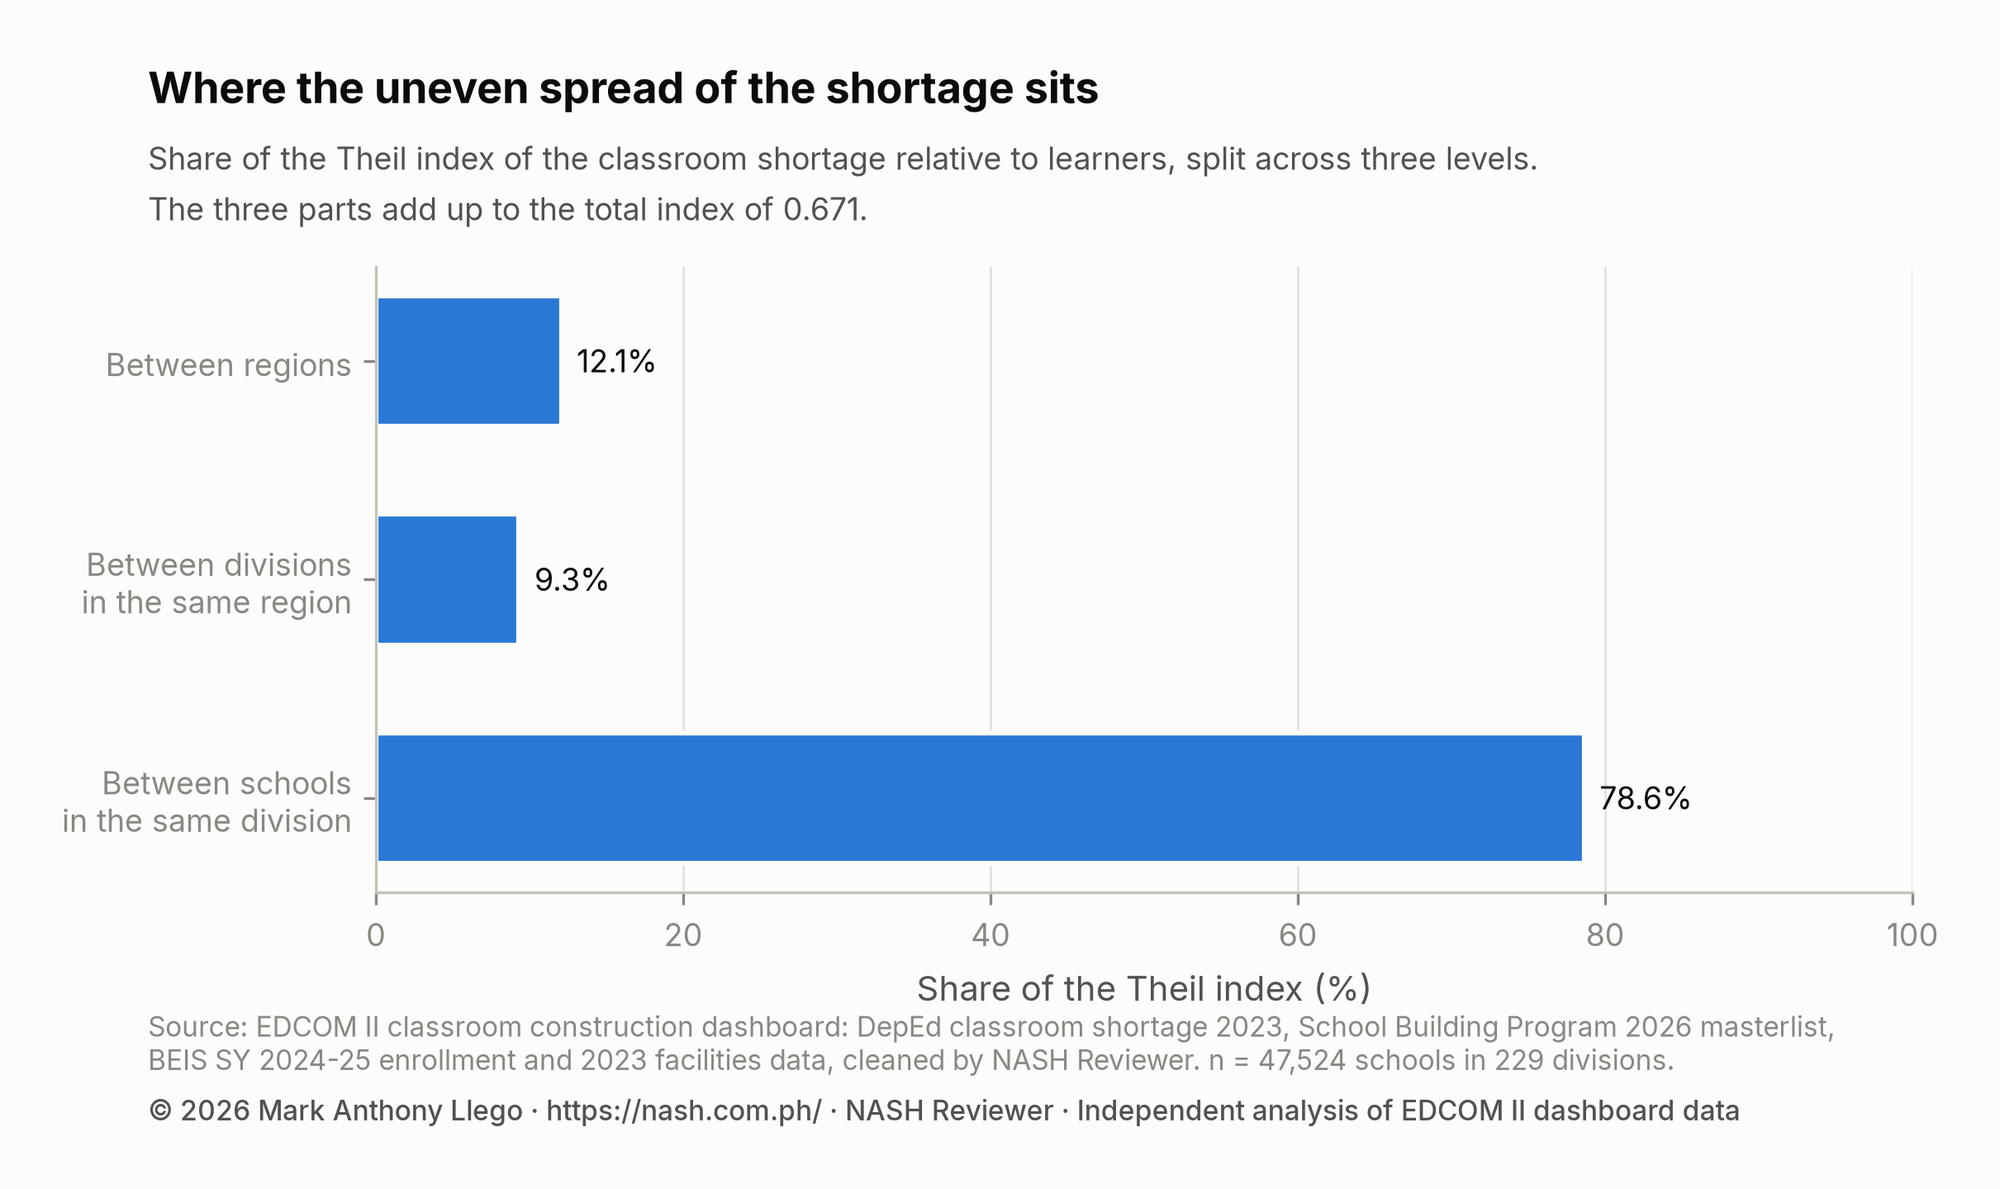
The Theil index splits the uneven spread of the shortage, relative to learners, into levels. Of the total, 78.6% lies between schools in the same division, 9.3% between divisions in a region and 12.1% between regions.
Show the data as a table
| Level | Theil index | Share of the total |
|---|---|---|
| Between regions | 0.081 | 12.1% |
| Between divisions in the same region | 0.063 | 9.3% |
| Between schools in the same division | 0.528 | 78.6% |
| Total | 0.671 | 100% |
Most of the unevenness lies between schools that share a division, not between regions or divisions. Regional and division totals hide where the need is: in particular schools.
For a school head asking for classrooms, the school’s own figure and its neighbors’ say more than the regional average.
The split describes where the differences are, not what causes them.
The School Building Program 2026
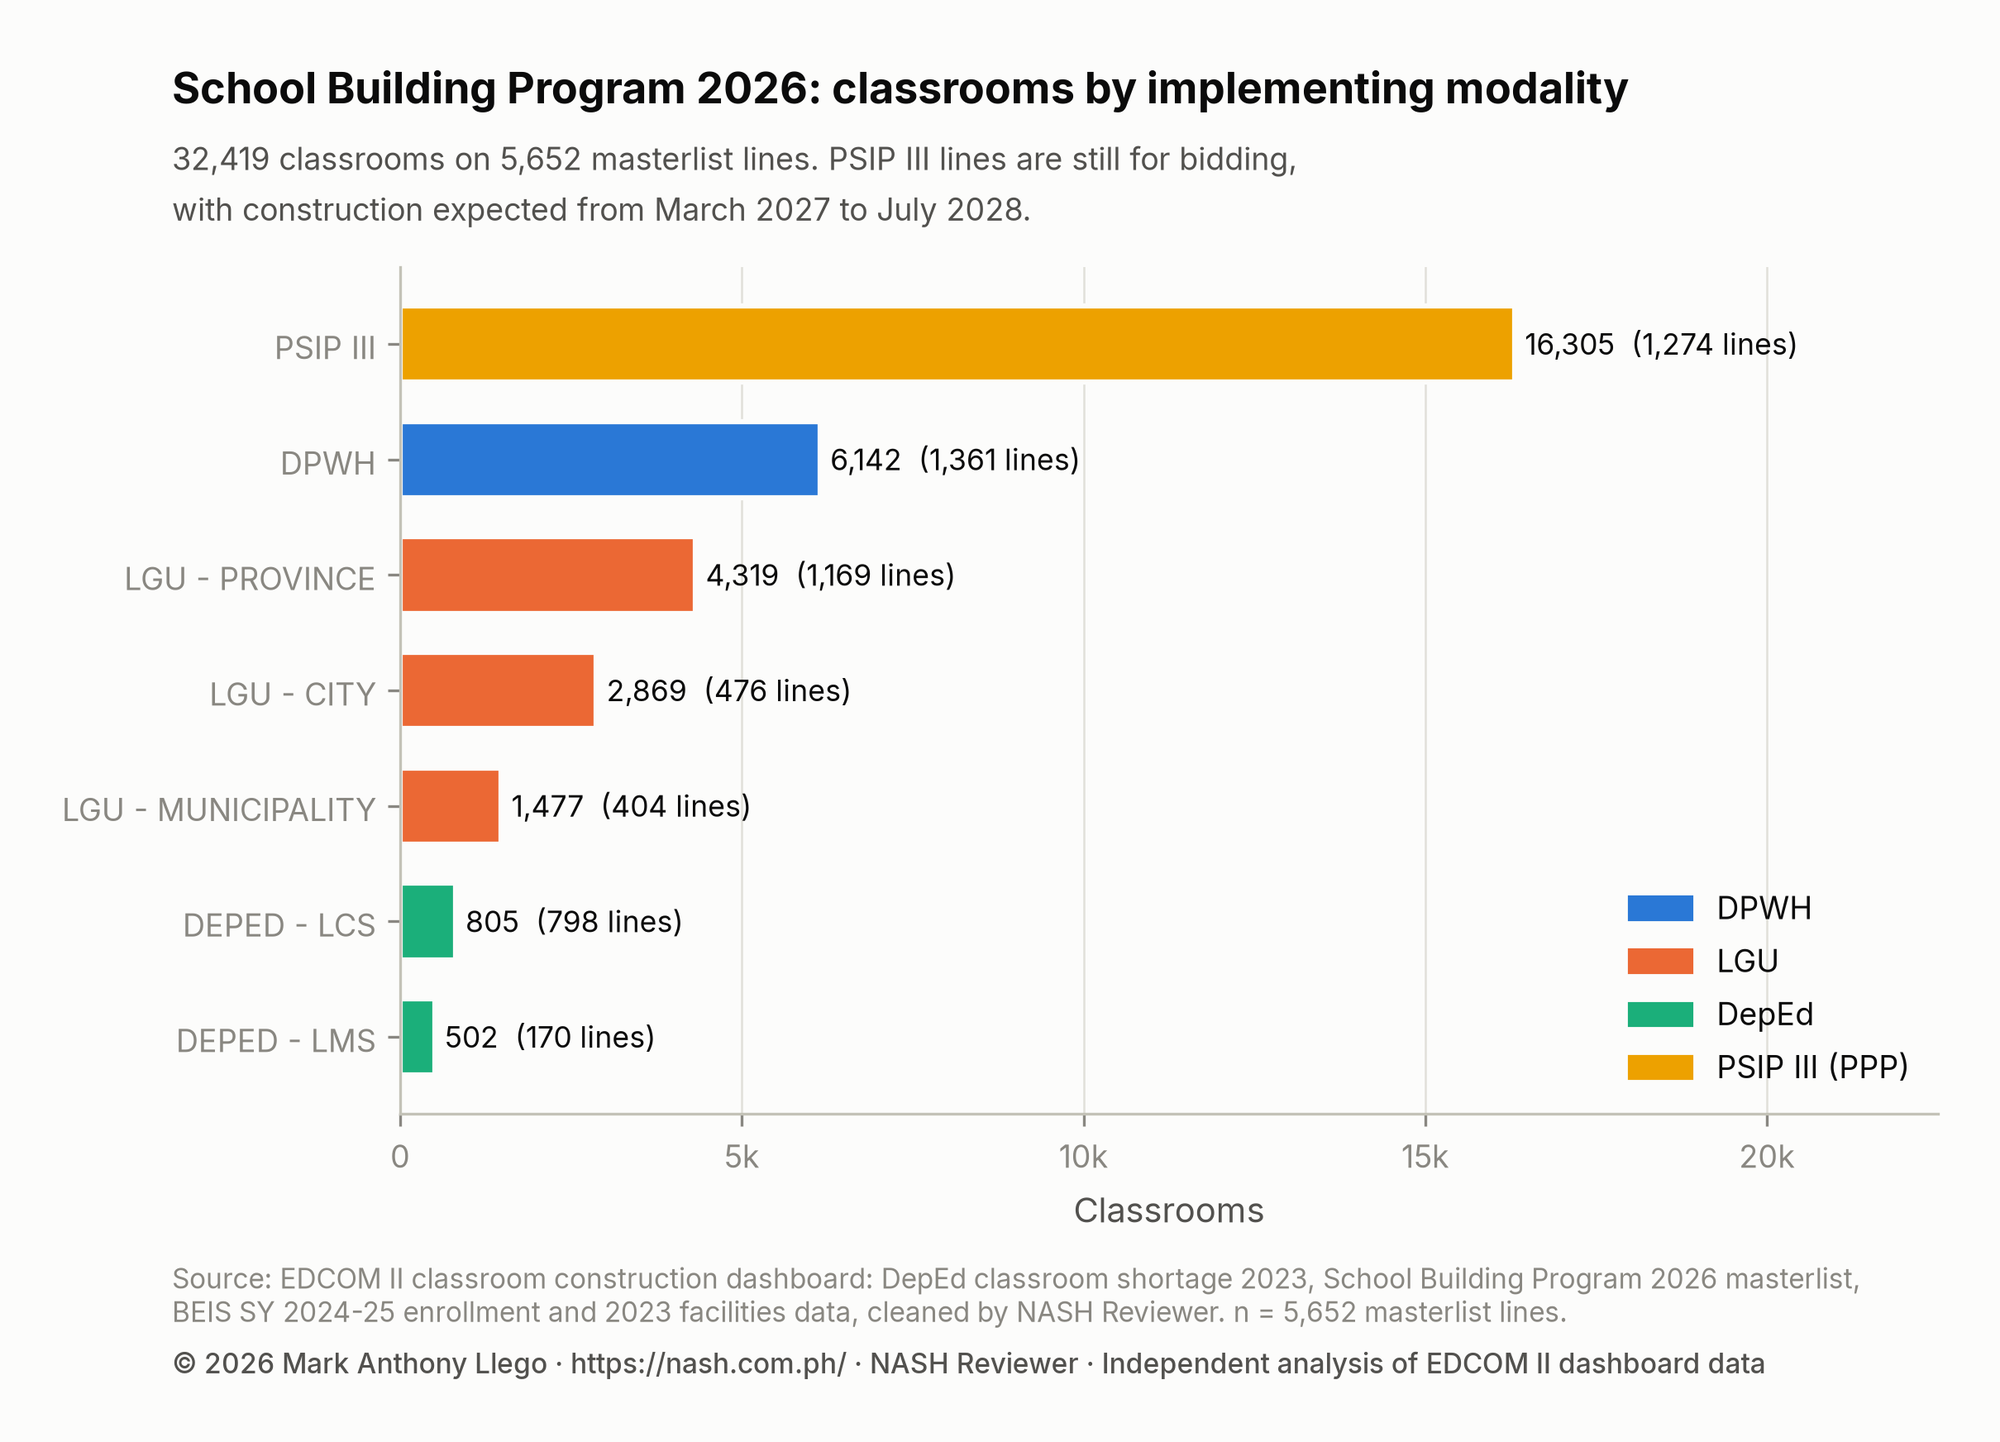
The SBP 2026 masterlist has 5,652 lines for 32,419 classrooms at 5,231 schools. 16,114 classrooms (49.7%) are funded under the General Appropriations Act (GAA) 2026 with PHP 55.47 billion; the other 16,305 (50.3%) are PSIP III public–private partnership lines, listed as for bidding.
Show the data as a table
| Implementation modality | Lines | Schools | Classrooms | Share of classrooms | Median classrooms per line | Budget allocated |
|---|---|---|---|---|---|---|
| PSIP III | 1,274 | 1,094 | 16,305 | 50.3% | 10.0 | For bidding |
| DPWH | 1,361 | 1,361 | 6,142 | 18.9% | 4.0 | PHP 20.90 billion |
| LGU - PROVINCE | 1,169 | 1,169 | 4,319 | 13.3% | 3.0 | PHP 14.38 billion |
| LGU - CITY | 476 | 476 | 2,869 | 8.8% | 4.0 | PHP 10.36 billion |
| LGU - MUNICIPALITY | 404 | 404 | 1,477 | 4.6% | 3.0 | PHP 4.66 billion |
| DEPED - LCS | 798 | 797 | 805 | 2.5% | 1.0 | PHP 2.17 billion |
| DEPED - LMS | 170 | 169 | 502 | 1.5% | 3.0 | PHP 2.98 billion |
Show the data as a table
| Modality group | Lines with a budget | Median budget per classroom | Middle half (interquartile range) |
|---|---|---|---|
| DPWH | 1,352 | PHP 3.25 million | PHP 2.63 million to PHP 3.75 million |
| LGU | 2,037 | PHP 3.00 million | PHP 3.00 million to PHP 3.50 million |
| DepEd | 170 | PHP 5.57 million | PHP 4.62 million to PHP 7.36 million |
PSIP III lines are the largest, a median of ten classrooms a line; no other modality’s median is above four.
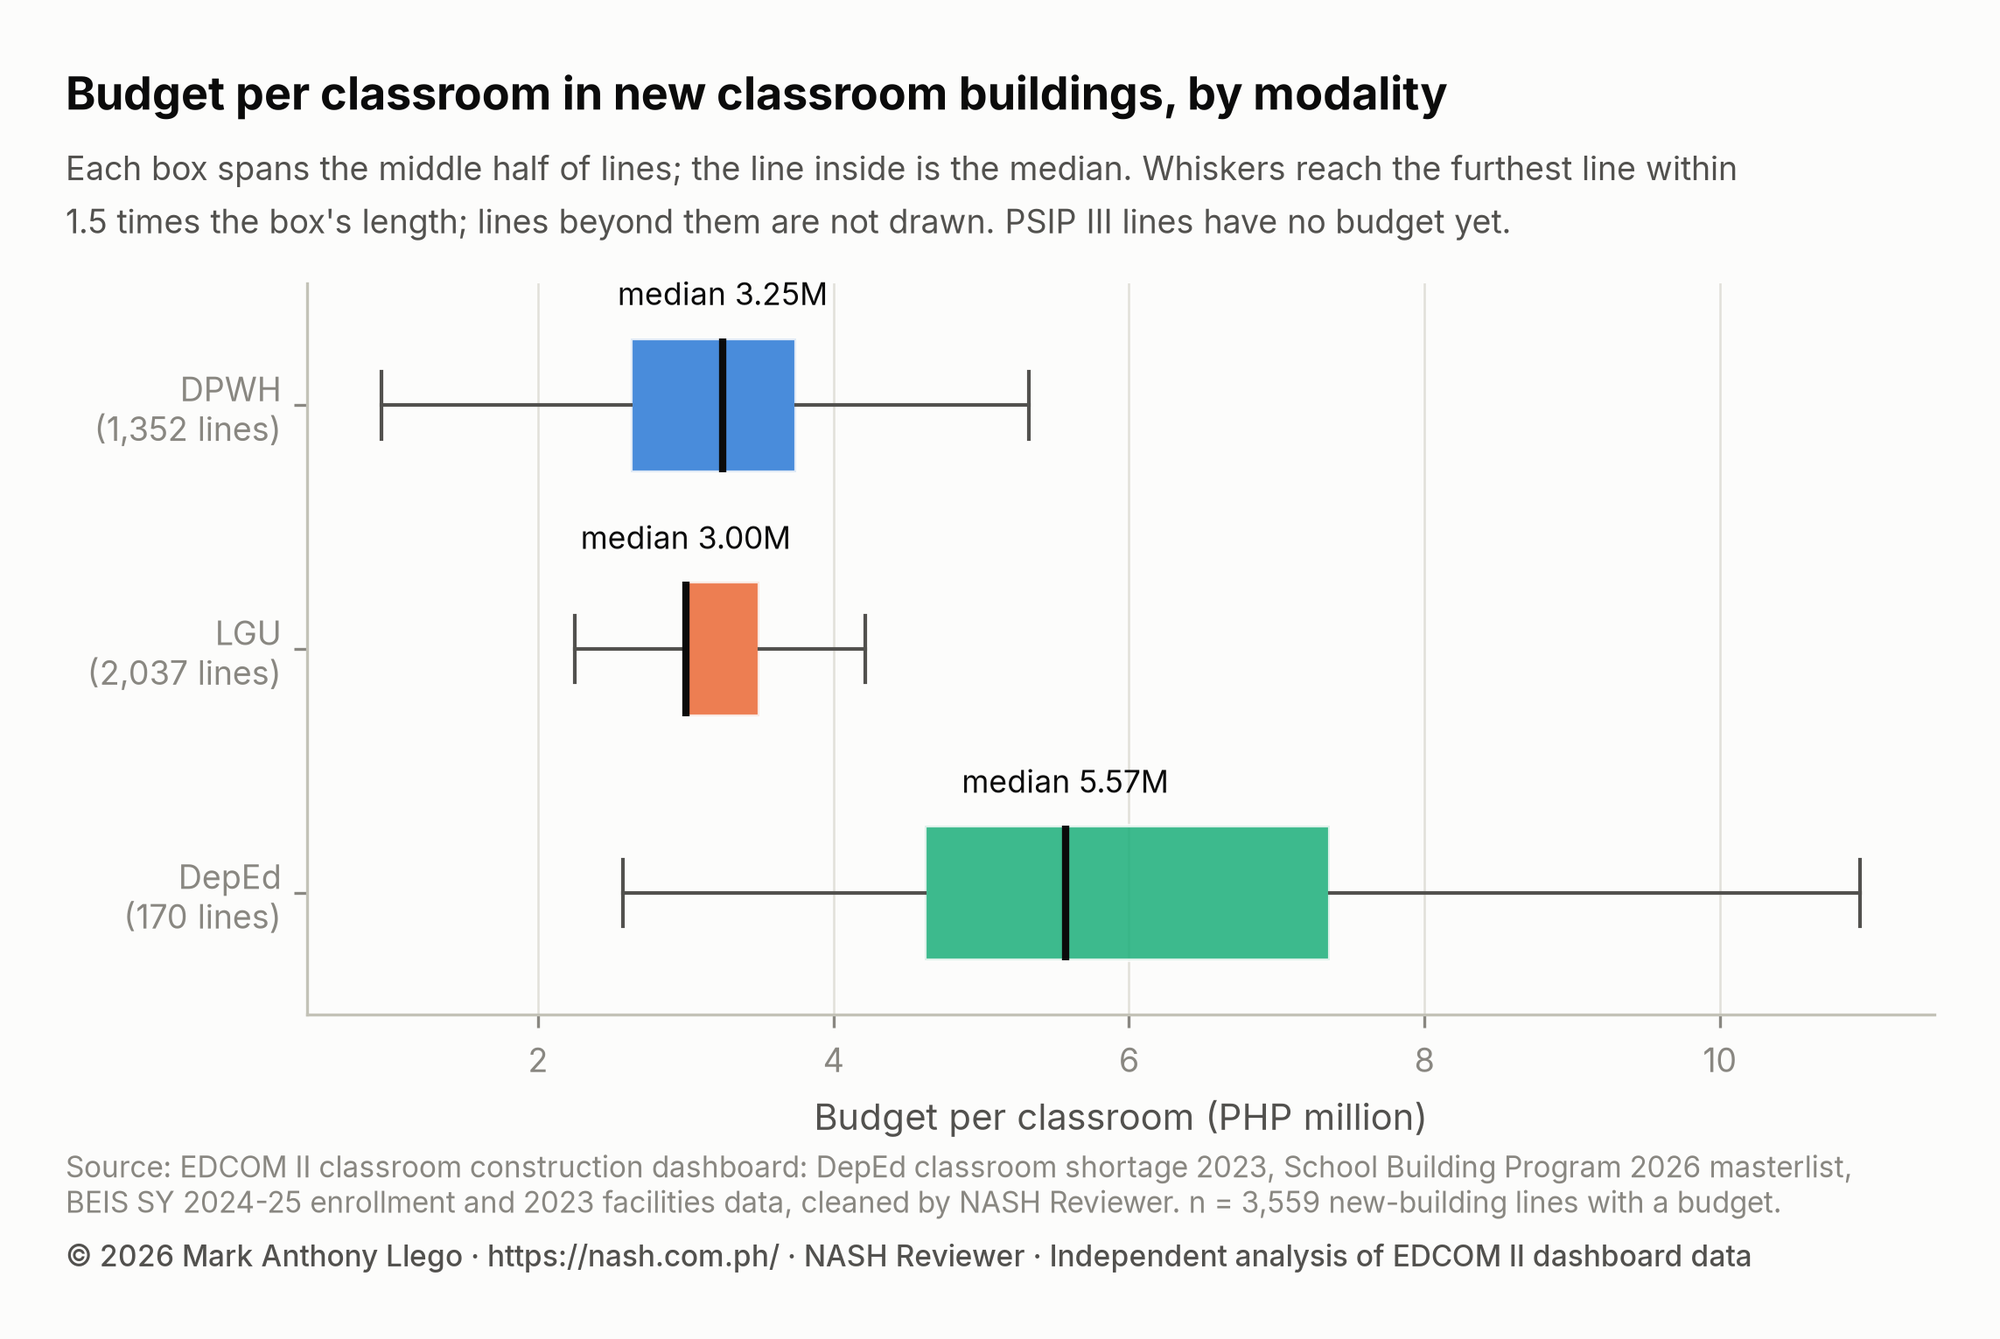
The median budget per classroom is PHP 3.25 million for DPWH lines, PHP 3.00 million for LGU lines and PHP 5.57 million for DepEd’s Last Mile School buildings. The groups differ more than chance would produce (Kruskal–Wallis H = 384.5, p < 0.001, eta-squared 0.11).
103 PSIP III lines, carrying 1,554 classrooms, are exact copies of an earlier line. They are kept, as the dashboard counts them; without them the masterlist has 30,865 classrooms.
Set against the 2023 shortage, the 2026 classrooms equal 19.6% of it, and the GAA-funded classrooms alone 9.7%.
Each region’s share of the shortage and the classrooms
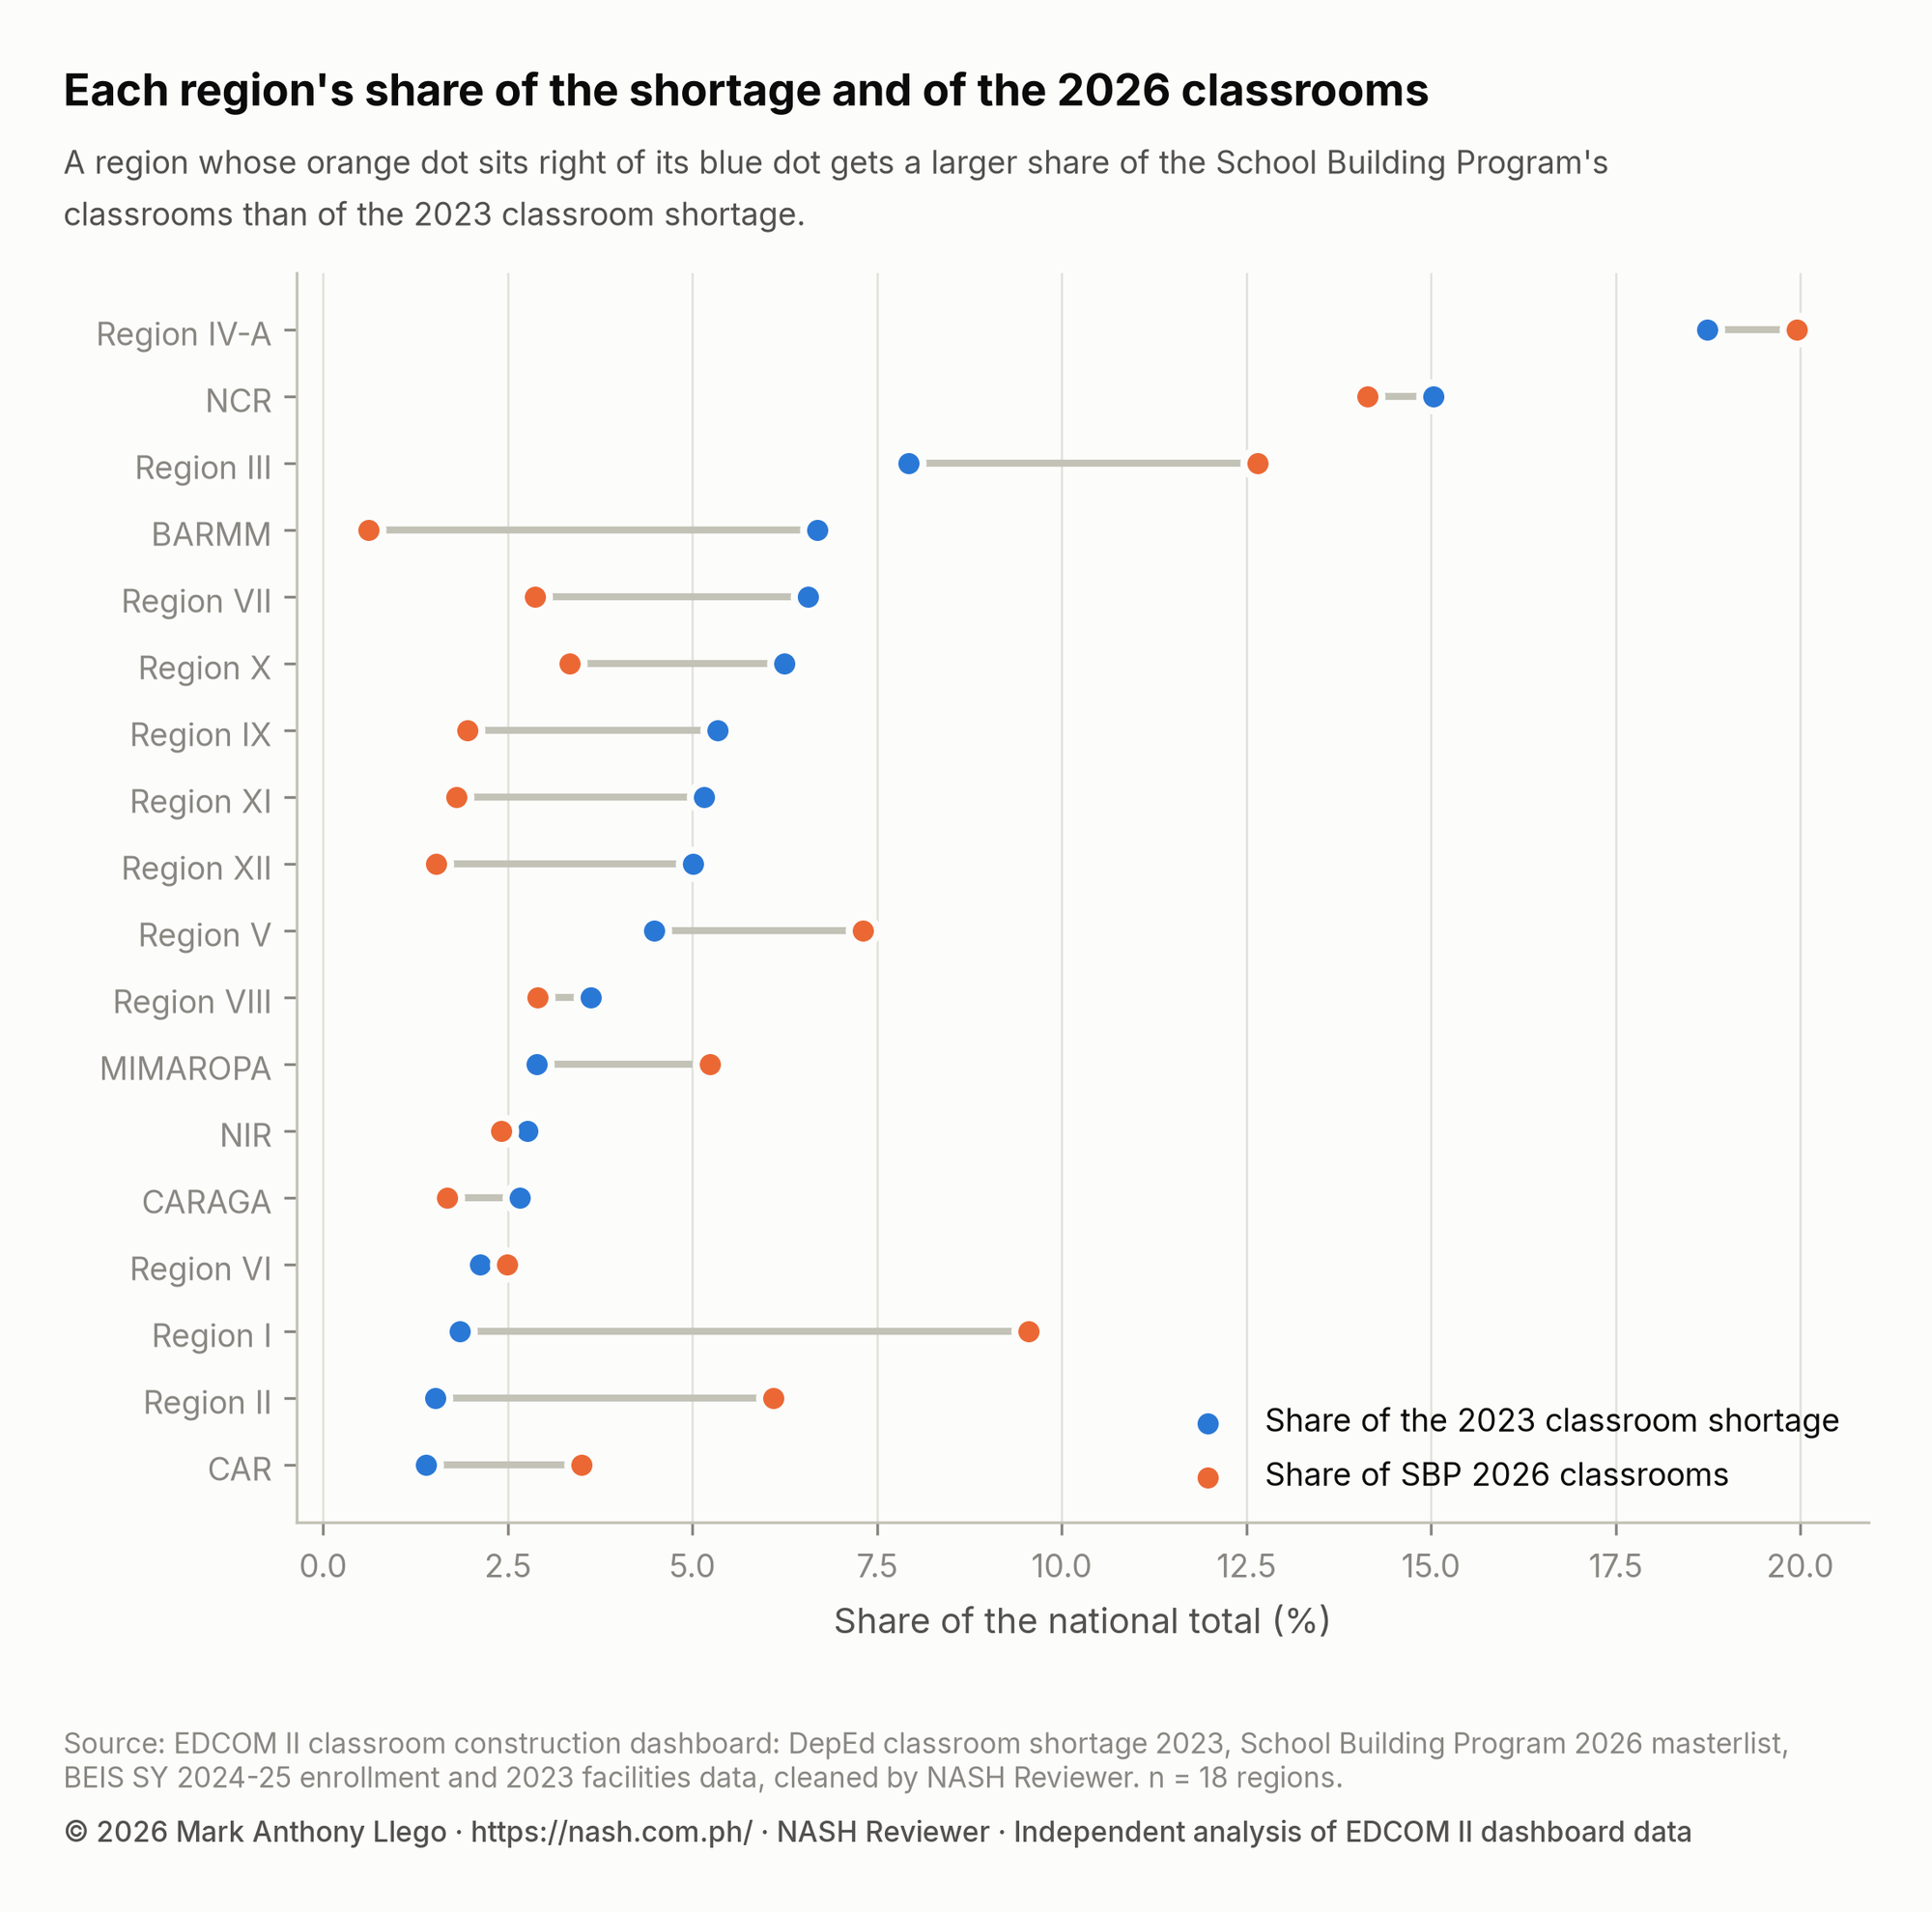
Regions’ shares of the 2026 classrooms differ from their shares of the shortage. Region I has 1.9% of the shortage and 9.6% of the classrooms; BARMM has 6.7% of the shortage and 0.6% of the classrooms.
Show the data as a table
| Region | Classroom shortage, 2023 | SBP 2026 classrooms | Share of national shortage | Share of SBP classrooms | Coverage (SBP / shortage) |
|---|---|---|---|---|---|
| Region I | 3,061 | 3,097 | 1.9% | 9.6% | 101.2% |
| Region II | 2,501 | 1,977 | 1.5% | 6.1% | 79.0% |
| CAR | 2,301 | 1,133 | 1.4% | 3.5% | 49.2% |
| MIMAROPA | 4,777 | 1,696 | 2.9% | 5.2% | 35.5% |
| Region V | 7,415 | 2,370 | 4.5% | 7.3% | 32.0% |
| Region III | 13,119 | 4,103 | 7.9% | 12.7% | 31.3% |
| Region VI | 3,522 | 806 | 2.1% | 2.5% | 22.9% |
| Region IV-A | 31,010 | 6,470 | 18.7% | 20.0% | 20.9% |
| NCR | 24,866 | 4,584 | 15.0% | 14.1% | 18.4% |
| NIR | 4,579 | 782 | 2.8% | 2.4% | 17.1% |
| Region VIII | 5,990 | 940 | 3.6% | 2.9% | 15.7% |
| CARAGA | 4,410 | 542 | 2.7% | 1.7% | 12.3% |
| Region X | 10,333 | 1,082 | 6.2% | 3.3% | 10.5% |
| Region VII | 10,857 | 929 | 6.6% | 2.9% | 8.6% |
| Region IX | 8,826 | 634 | 5.3% | 2.0% | 7.2% |
| Region XI | 8,532 | 583 | 5.2% | 1.8% | 6.8% |
| Region XII | 8,281 | 494 | 5.0% | 1.5% | 6.0% |
| BARMM | 11,064 | 197 | 6.7% | 0.6% | 1.8% |
Coverage, the 2026 classrooms as a share of the 2023 shortage, ranges from 101.2% in Region I to 1.8% in BARMM, against 19.6% nationally.
BARMM’s 197 classrooms are few beside its shortage. EDCOM II has reported that some national programs pulled back from BARMM after the Bangsamoro Organic Law because of unclear interpretation, although the law says national programs such as the School Building Program continue to be funded by the National Government.
Coverage compares totals. A region can reach high coverage while some of its schools with the largest shortages receive nothing, which the next section checks school by school.
Do the 2026 classrooms go where the shortage is?
School by school, 53.0% of the 2026 classrooms fall within the receiving school’s own 2023 shortage, 22.5% go beyond it, and 7,457 (23.0%) go to schools with no 2023 shortage. Classrooms within each school’s shortage meet 10.4% of it, leaving 148,276 classrooms unmet.
Show the data as a table
| Modality group | Classrooms at schools in the shortage table | Concentration index (95% interval) | Share at schools with no 2023 shortage |
|---|---|---|---|
| DPWH | 5,979 | 0.27 (0.18 to 0.35) | 30.6% |
| LGU | 8,449 | 0.26 (0.20 to 0.33) | 31.2% |
| DepEd | 1,285 | 0.09 (0.03 to 0.14) | 34.7% |
| PSIP III (PPP) | 16,194 | 0.61 (0.53 to 0.67) | 15.8% |
Show the data as a table
| 2023 classroom shortage | Schools | Schools with SBP 2026 classrooms | Share (95% interval) | SBP classrooms |
|---|---|---|---|---|
| None | 21,836 | 1,708 | 7.8% (7.5% to 8.2%) | 7,457 |
| Up to 1 | 6,868 | 662 | 9.6% (9.0% to 10.4%) | 2,235 |
| Over 1 to 3 | 8,112 | 915 | 11.3% (10.6% to 12.0%) | 3,681 |
| Over 3 to 5 | 3,893 | 487 | 12.5% (11.5% to 13.6%) | 2,205 |
| Over 5 to 10 | 3,536 | 505 | 14.3% (13.2% to 15.5%) | 3,339 |
| Over 10 to 20 | 1,854 | 406 | 21.9% (20.1% to 23.8%) | 4,183 |
| Over 20 | 1,560 | 455 | 29.2% (27.0% to 31.5%) | 8,807 |
The 2026 classrooms lean toward schools with larger shortages, but much less than the shortage itself. Their concentration index is 0.43 (95% interval 0.36 to 0.49), against 0.80 for the shortage. PSIP III lines follow the shortage most closely (0.61) and DepEd’s own lines least (0.09).
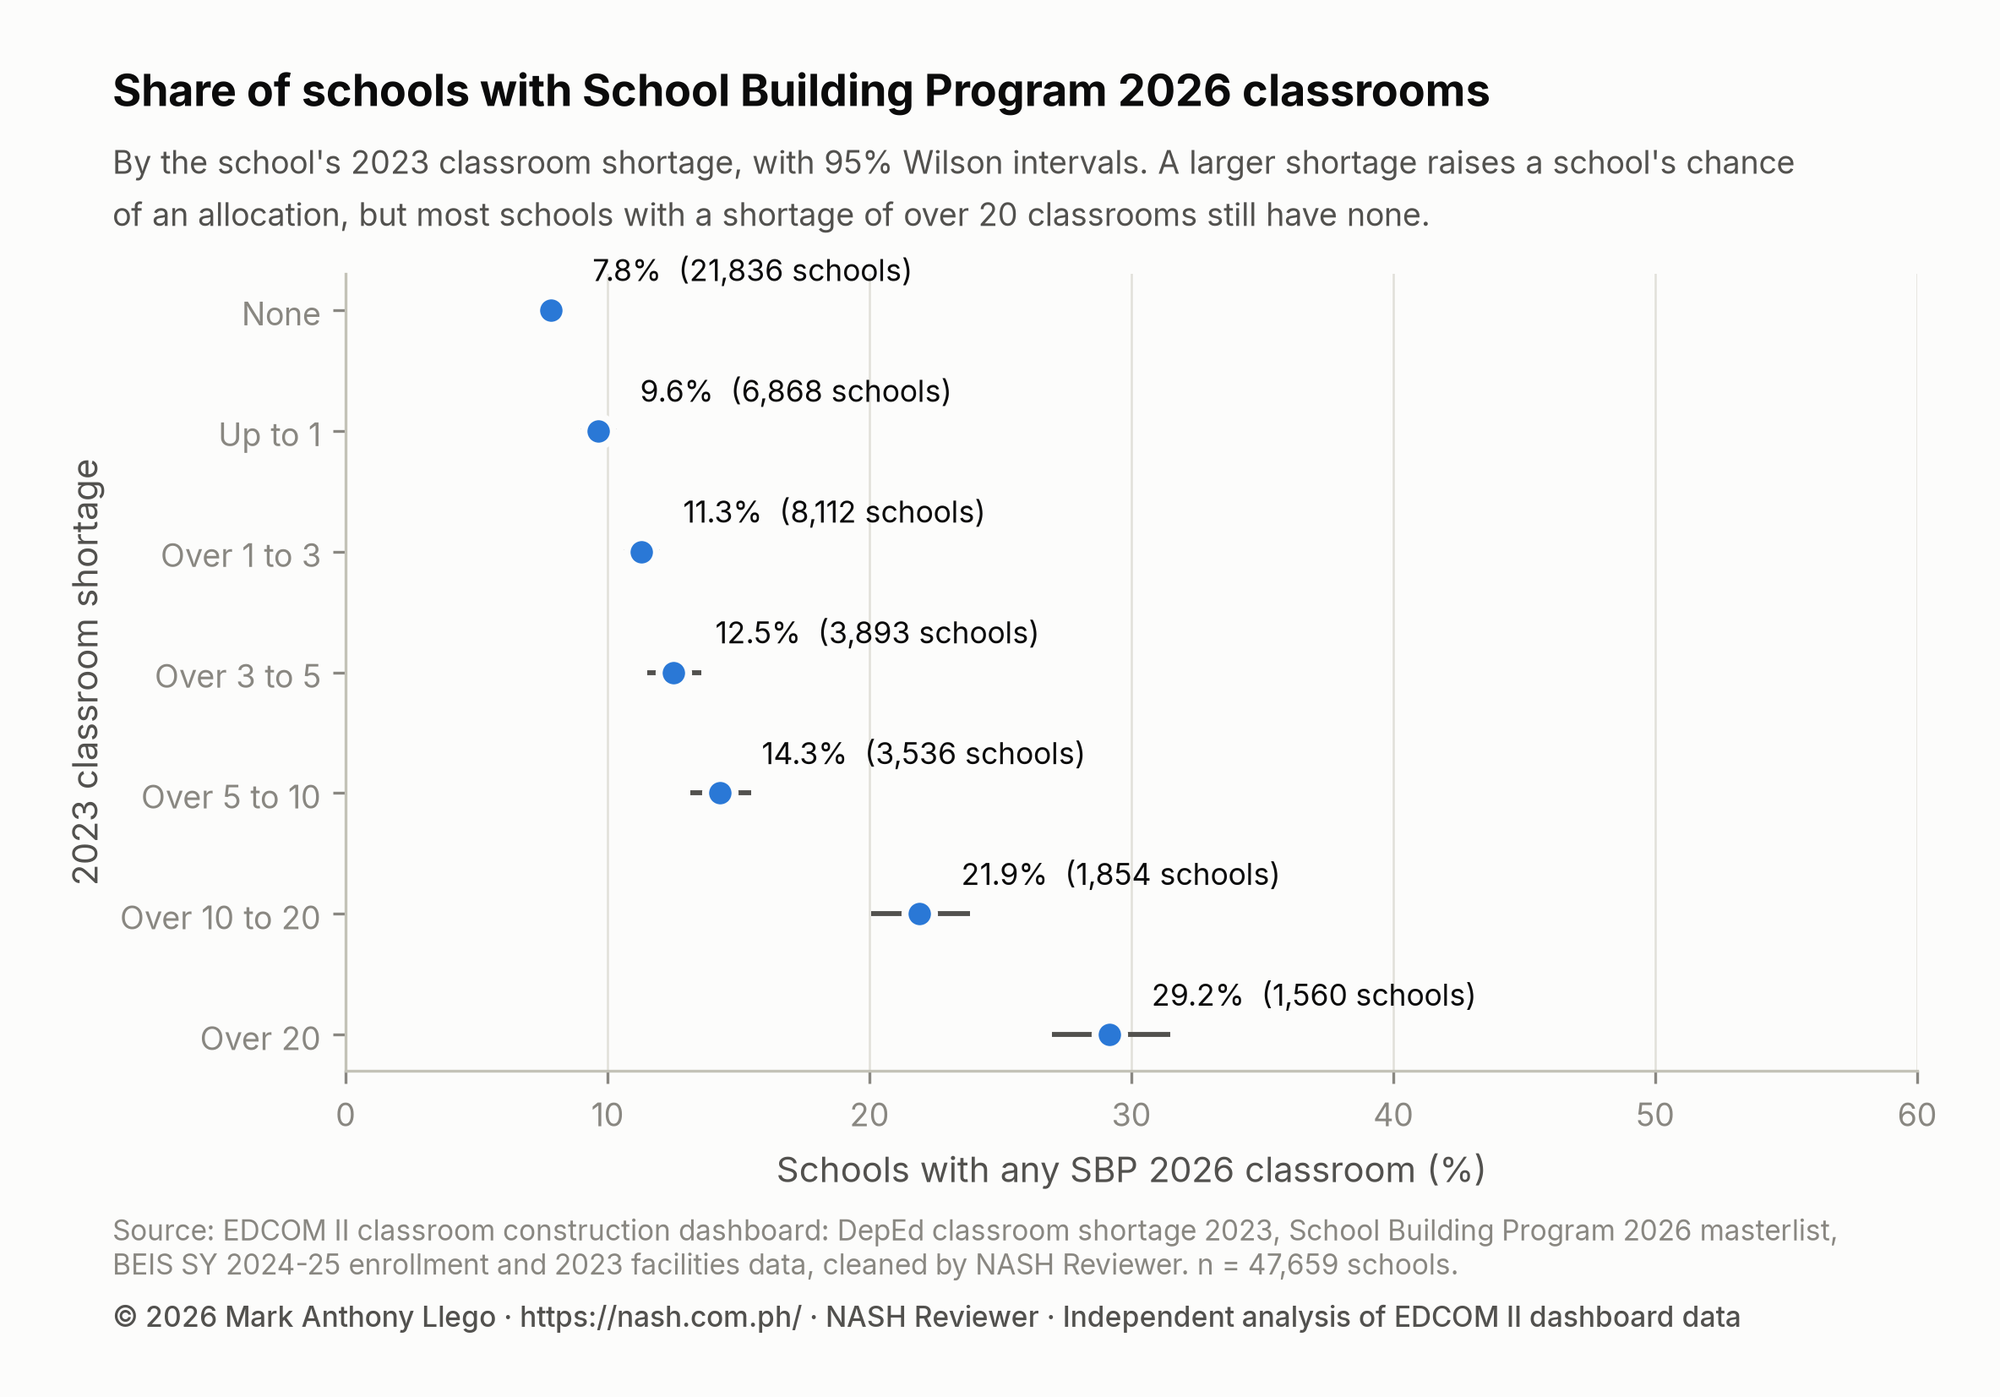
The share of schools with any 2026 classroom rises from 7.8% of schools with no shortage to 29.2% of those short by more than 20. Against schools with the same enrollment, setting, shifts, Last Mile status and region, those short by more than 20 have 2.87 times the odds of an allocation (95% interval 2.24 to 3.68).
Only 13.3% of schools with a shortage receive any 2026 classroom.
The dashboard reports 133,024 classrooms remaining, the whole shortage less every 2026 classroom. Counted school by school, 148,276 remain unmet, because classrooms beyond a school’s own shortage meet no other school’s need.
Without the 103 duplicate PSIP III lines, 53.4% of the classrooms fall within the receiving school’s shortage and the concentration index is 0.41, so the result does not rest on them.
Cities and municipalities
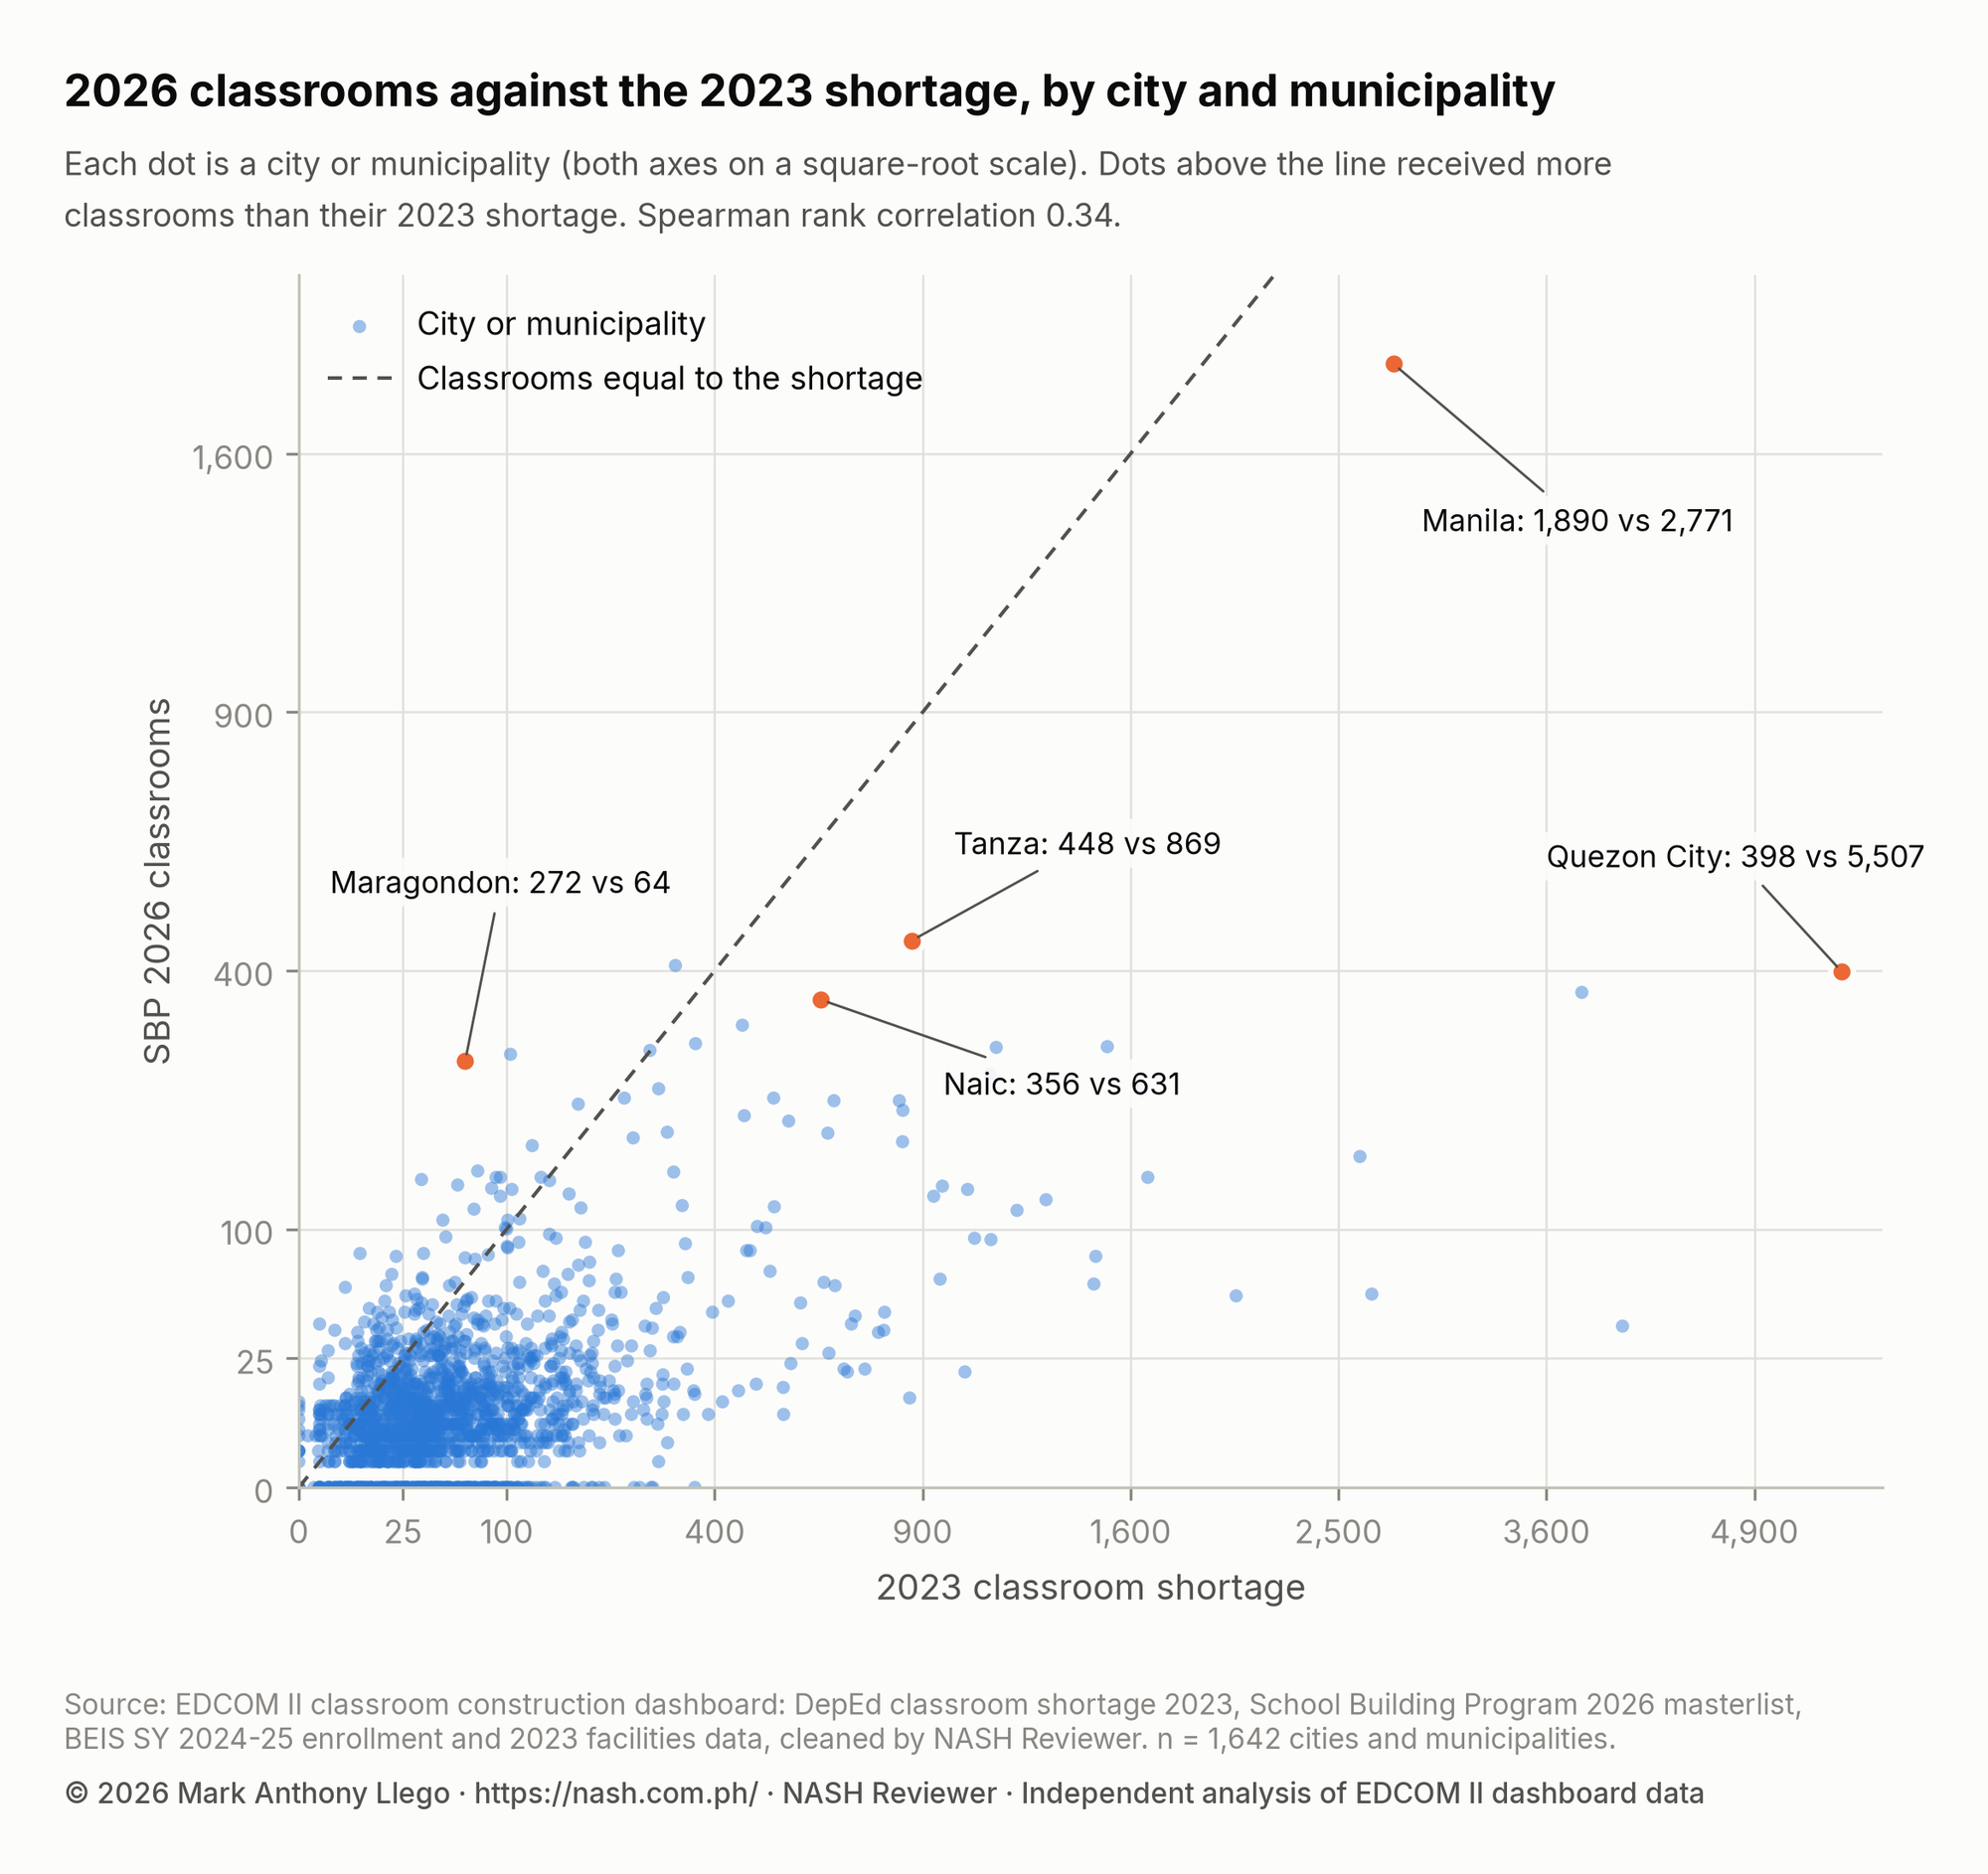
Across 1,642 cities and municipalities, the 2026 classrooms and the 2023 shortage are only moderately related: Spearman’s rho is 0.34 (95% interval 0.29 to 0.38). 183 places receive more classrooms than their shortage, 3,101 beyond it in all.
Show the data as a table
| City or municipality | Province | SBP 2026 classrooms | 2023 classroom shortage | Coverage |
|---|---|---|---|---|
| City of Manila | City of Manila | 1,890 | 2,771 | 68.2% |
| Tanza | Cavite | 448 | 869 | 51.6% |
| Gen. Mariano Alvarez | Cavite | 408 | 328 | 124.4% |
| Quezon City | Quezon City | 398 | 5,507 | 7.2% |
| City of Caloocan | City of Caloocan | 367 | 3,807 | 9.6% |
| City of Trece Martires | Cavite | 362 | 622 | 58.2% |
| Naic | Cavite | 356 | 631 | 56.4% |
| Silang | Cavite | 320 | 455 | 70.3% |
| City of San Pablo | Laguna | 295 | 364 | 81.0% |
| City of San Jose Del Monte | Bulacan | 291 | 1,512 | 19.2% |
| City or municipality | Province | Region | 2023 classroom shortage | Schools |
|---|---|---|---|---|
| Datu Odin Sinsuat | Maguindanao del Norte | BARMM | 363 | 49 |
| South Upi | Maguindanao del Sur | BARMM | 290 | 43 |
| Panglima Sugala | Tawi-Tawi | BARMM | 287 | 34 |
| City of Makati | City of Makati | NCR | 269 | 24 |
| Upi | Maguindanao del Norte | BARMM | 260 | 43 |
Of the 332 cities and municipalities with the largest shortages, 147 (44.3%) are among the 332 with the most 2026 classrooms. EDCOM II reported 45.2% on DepEd’s list as of 20 August 2026.
273 cities and municipalities receive no 2026 classroom, with 13,613 classrooms of shortage between them.
Maragondon, Cavite, receives 272 classrooms against a shortage of 64, one of the cases EDCOM II cited; the cleaned data reproduce its figures.
LGU income class and the 2026 classrooms
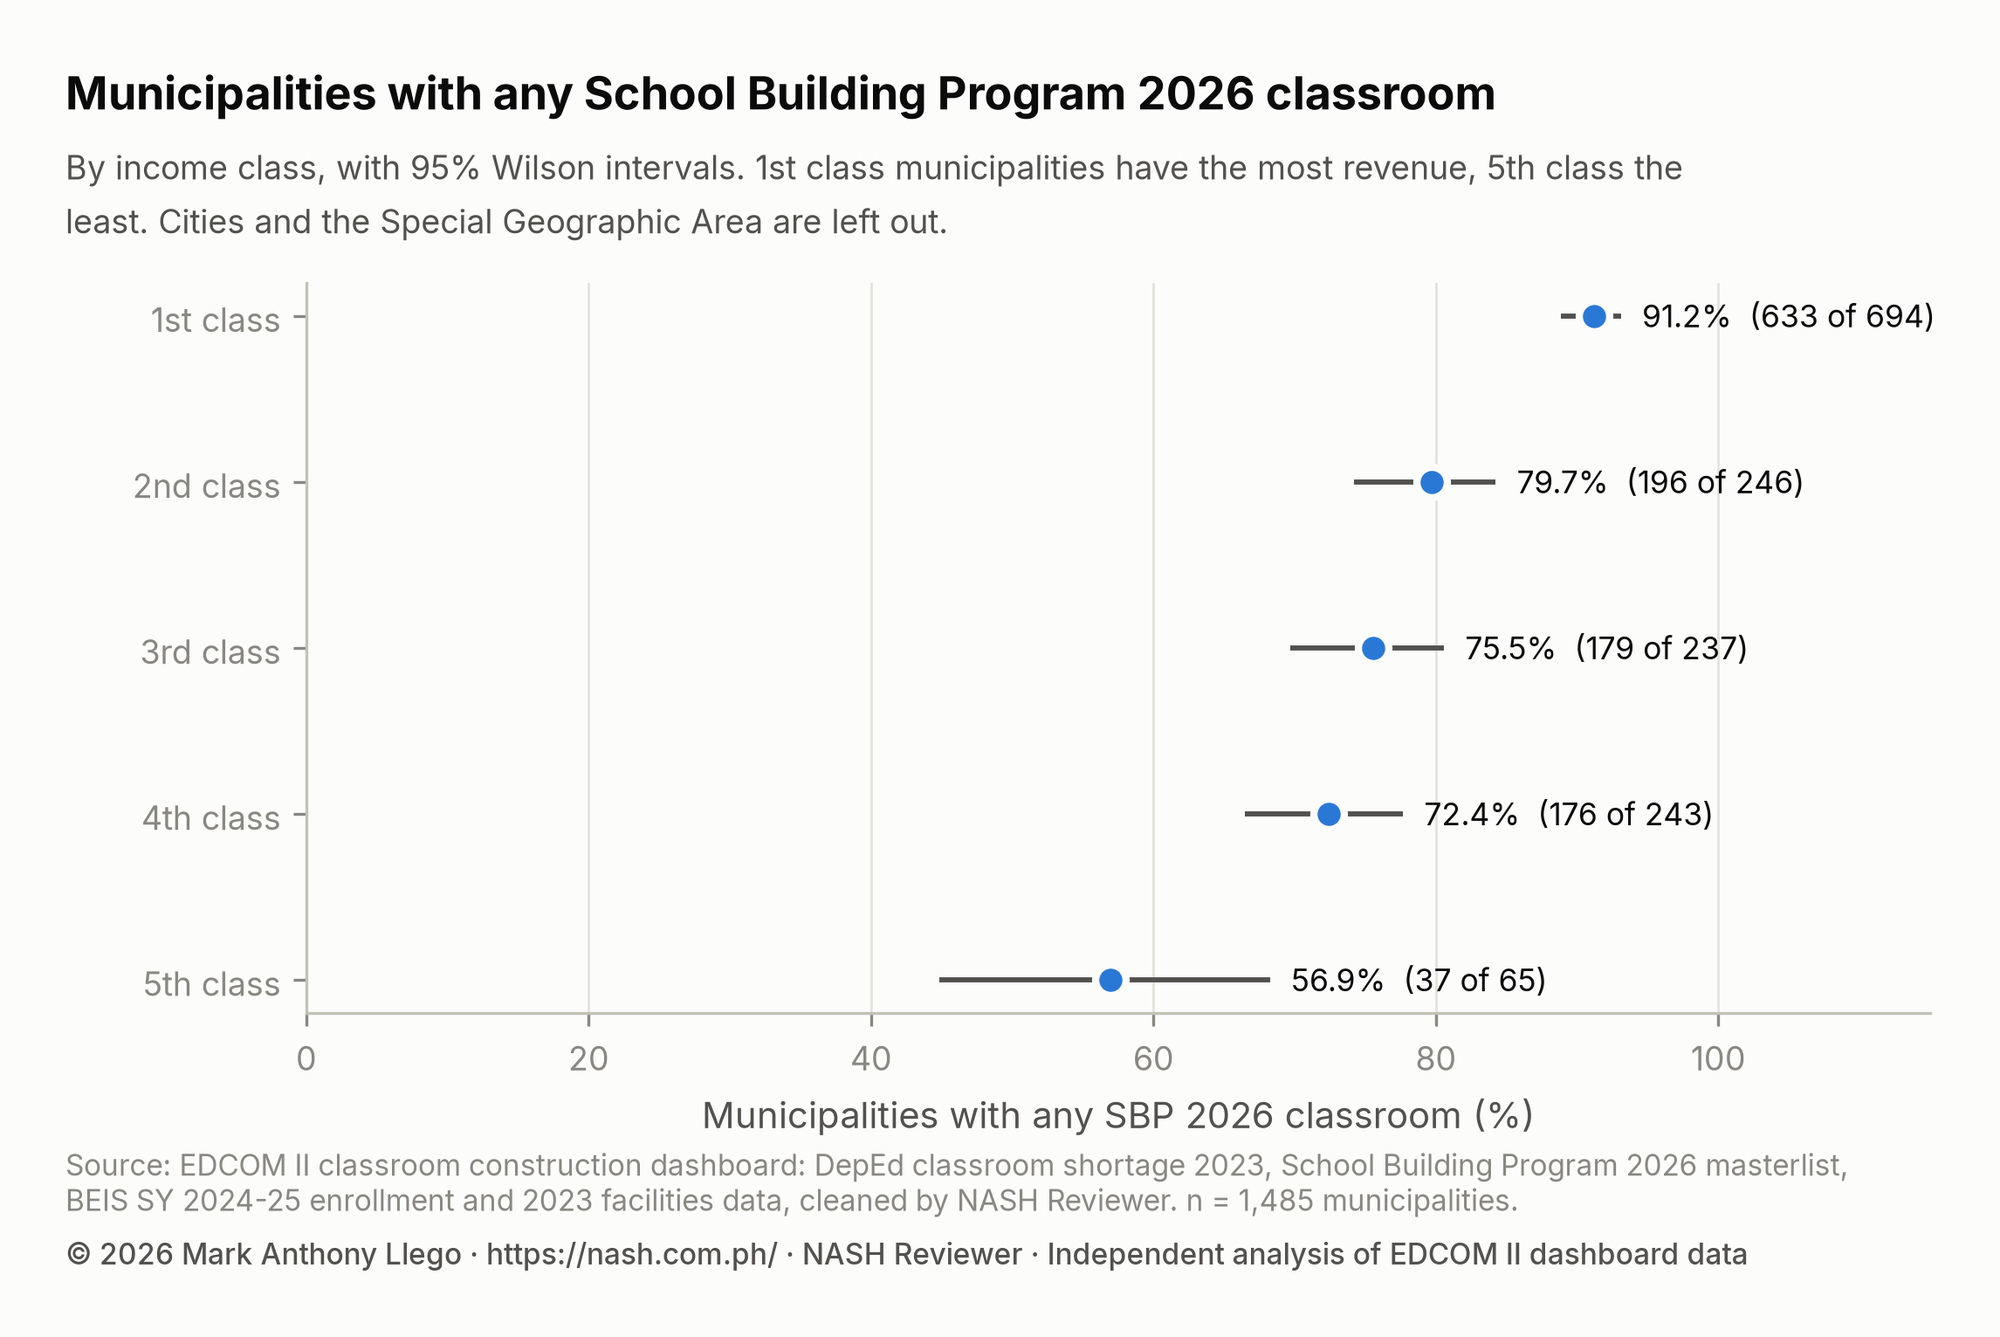
91.2% of first-class municipalities (633 of 694) have at least one 2026 classroom, against 56.9% of fifth-class municipalities (37 of 65). The share falls with each income class (Cochran–Armitage z = -9.25, p < 0.001).
Show the data as a table
| Income class (municipalities) | LGUs | With SBP 2026 classrooms | Share with any (95% interval) | With none | Shortage in LGUs with none | 2023 classroom shortage | Shortage per 1,000 learners | SBP 2026 classrooms | Coverage (SBP / shortage) | Shortage met within schools |
|---|---|---|---|---|---|---|---|---|---|---|
| 1st class | 694 | 633 | 91.2% (88.9% to 93.1%) | 61 | 4,195 | 64,567 | 6.5 | 13,163 | 20.4% | 10.9% |
| 2nd class | 246 | 196 | 79.7% (74.2% to 84.2%) | 50 | 3,061 | 11,236 | 6.2 | 2,388 | 21.3% | 7.9% |
| 3rd class | 237 | 179 | 75.5% (69.7% to 80.6%) | 58 | 2,729 | 8,305 | 6.4 | 1,482 | 17.8% | 7.0% |
| 4th class | 243 | 176 | 72.4% (66.5% to 77.7%) | 67 | 2,501 | 5,791 | 6.4 | 1,207 | 20.8% | 6.2% |
| 5th class | 65 | 37 | 56.9% (44.8% to 68.2%) | 28 | 356 | 850 | 6.6 | 157 | 18.5% | 7.0% |
Show the data as a table
| Income class | DPWH | LGU | DepEd | PSIP III (PPP) | Classrooms |
|---|---|---|---|---|---|
| 1st class | 19.1% | 23.2% | 3.2% | 54.5% | 23,836 |
| 2nd class | 16.2% | 30.6% | 4.6% | 48.6% | 4,490 |
| 3rd class | 23.2% | 40.6% | 6.6% | 29.6% | 2,442 |
| 4th class | 18.7% | 44.5% | 10.4% | 26.4% | 1,494 |
| 5th class | 18.5% | 63.7% | 15.3% | 2.5% | 157 |
The 28 fifth-class municipalities with none share a 2023 shortage of 356 classrooms, the figure EDCOM II reports for the 30 of 66 it counted.
Poorer municipalities are smaller. With enrollment, the shortage per 1,000 learners and the region held equal in 1,377 municipalities, no income class differs clearly from first class: the fifth-class odds ratio is 2.13 (95% interval 0.72 to 6.33, p = 0.172). Each doubling of enrollment multiplies the odds by 2.87 (2.05 to 4.02).
Only 21 of 97 BARMM municipalities (21.6%) receive any, but without BARMM the gap remains: 93.0% of first-class against 60.7% of fifth-class municipalities. None of the 8 Special Geographic Area municipalities, with a shortage of 502, receives any.
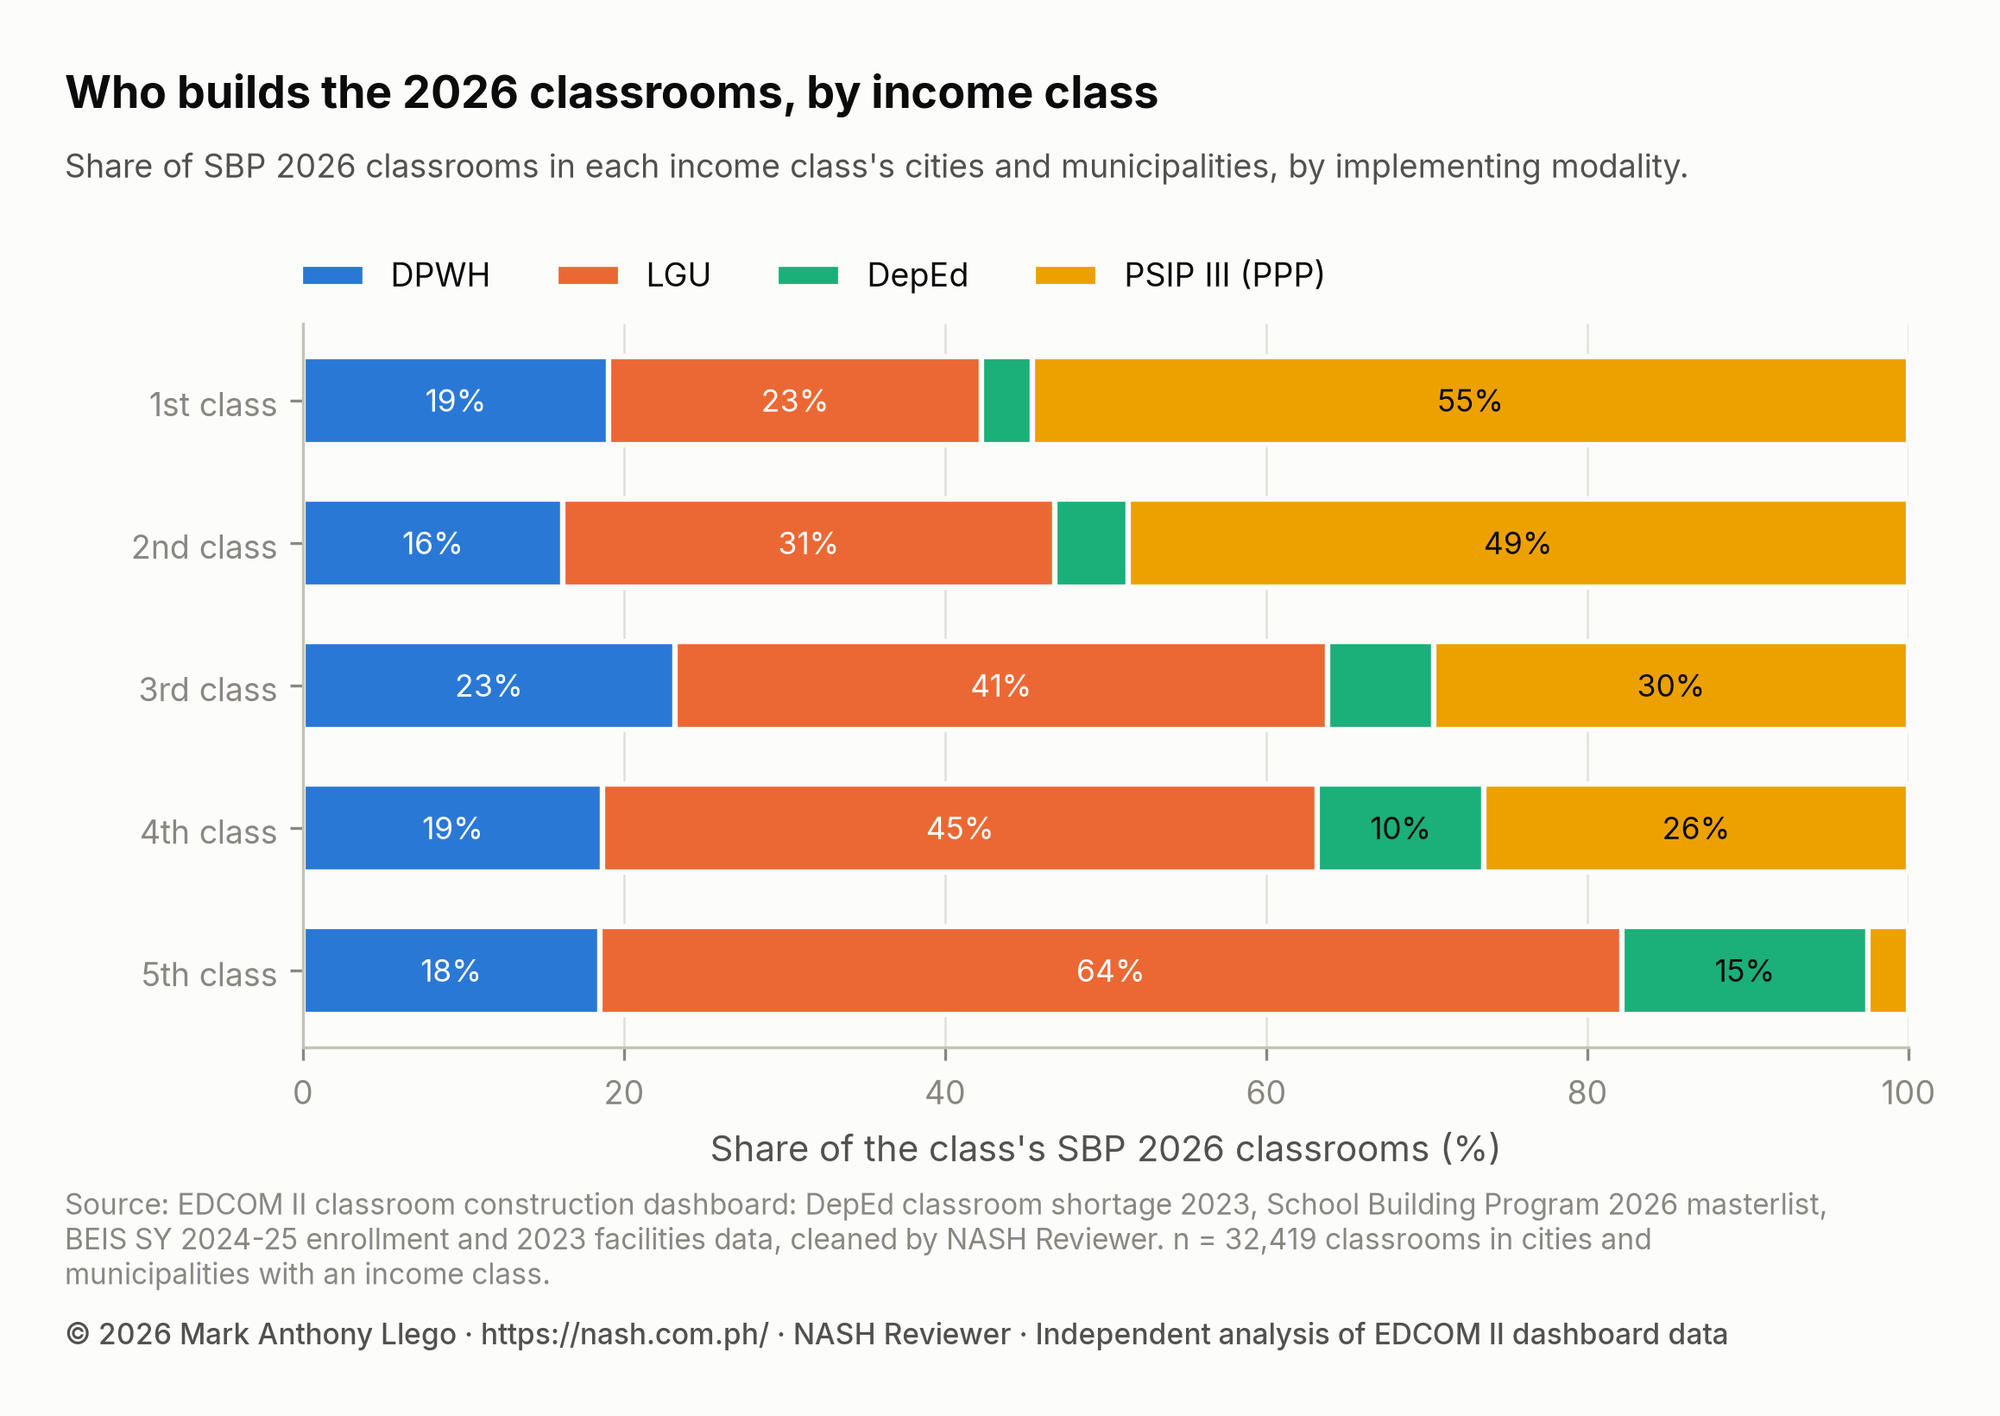
Who builds differs by class. PSIP III makes up 54.5% of first-class classrooms and 2.5% of fifth-class ones, where LGU-implemented lines make up 63.7%.
Class shifts and crowded classrooms
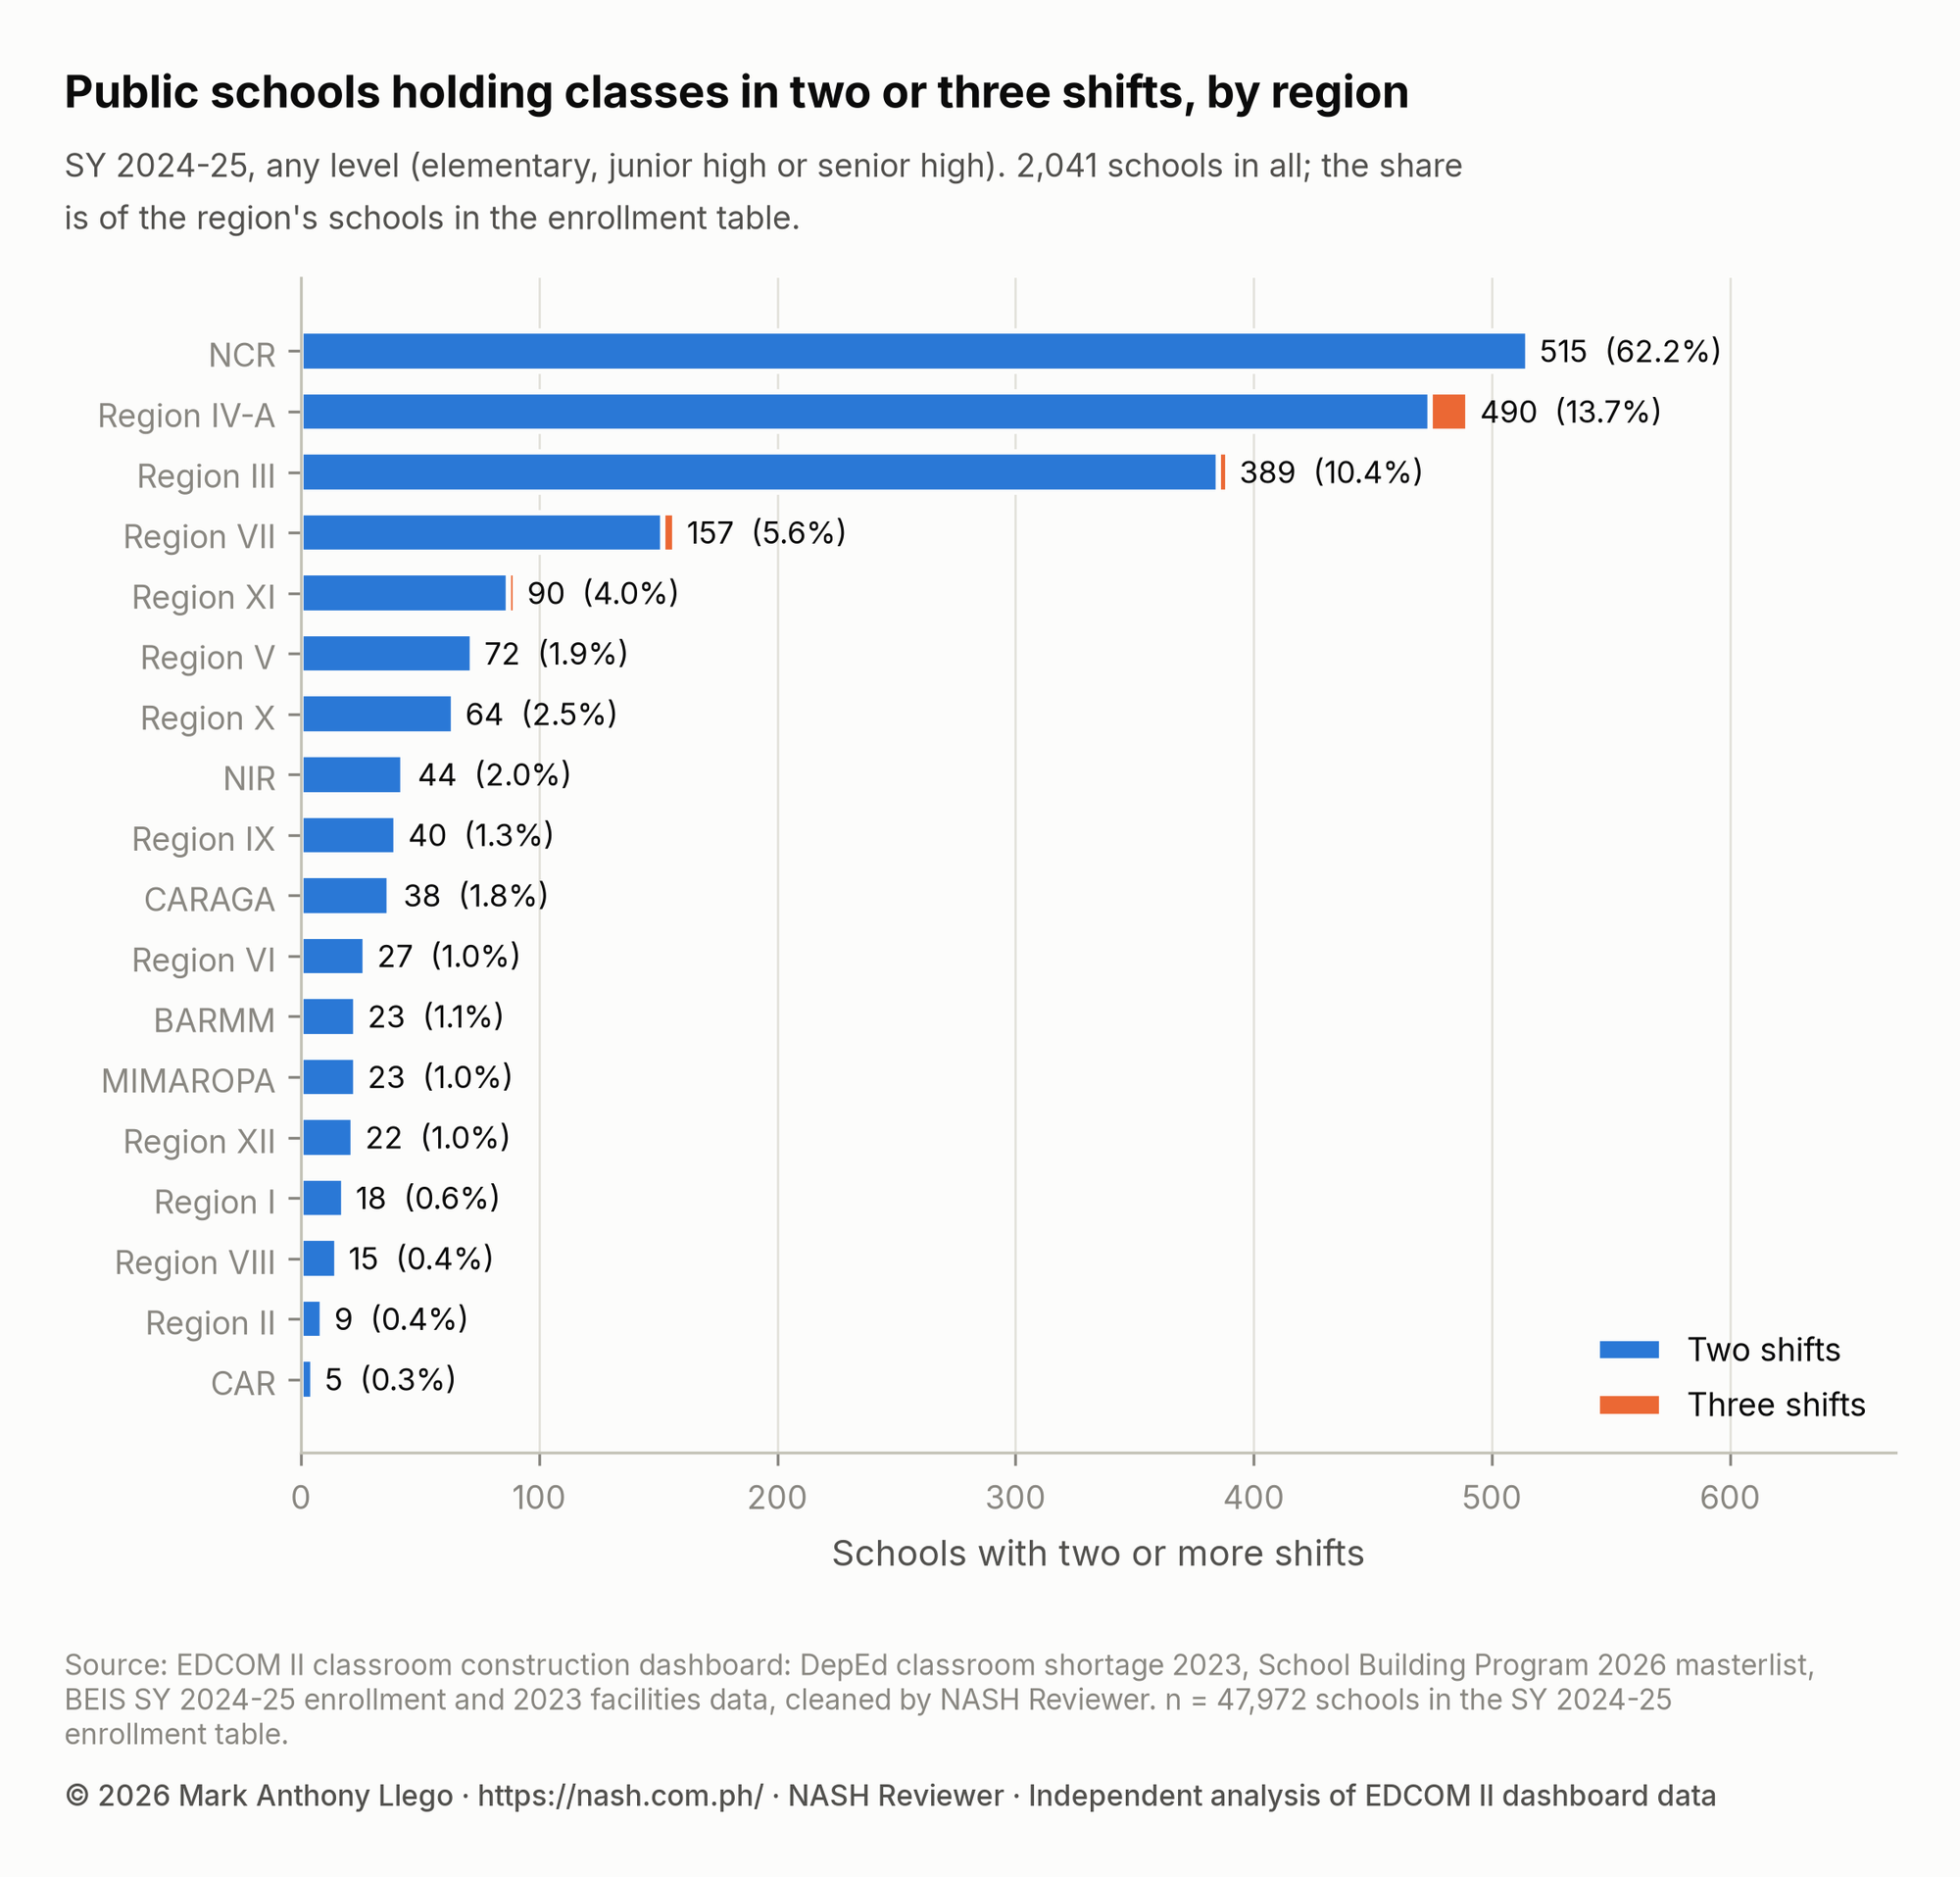
In SY 2024-25, 2,041 public schools (4.3%) held classes in two or more shifts, 30 of them in three. They enroll 4,596,527 learners, 20.4% of the total. NCR alone has 515 schools on shifts, 62.2% of its schools.
Show the data as a table
| Region | Schools | Two shifts | Three shifts | Schools with two or more shifts | Share of the region's schools |
|---|---|---|---|---|---|
| NCR | 828 | 515 | 0 | 515 | 62.2% |
| Region IV-A | 3,575 | 474 | 16 | 490 | 13.7% |
| Region III | 3,743 | 385 | 4 | 389 | 10.4% |
| Region VII | 2,828 | 152 | 5 | 157 | 5.6% |
| Region XI | 2,227 | 87 | 3 | 90 | 4.0% |
| Region V | 3,874 | 72 | 0 | 72 | 1.9% |
| Region X | 2,536 | 64 | 0 | 64 | 2.5% |
| NIR | 2,242 | 43 | 1 | 44 | 2.0% |
| Region IX | 3,010 | 40 | 0 | 40 | 1.3% |
| CARAGA | 2,104 | 37 | 1 | 38 | 1.8% |
| Region VI | 2,836 | 27 | 0 | 27 | 1.0% |
| MIMAROPA | 2,393 | 23 | 0 | 23 | 1.0% |
| BARMM | 2,169 | 23 | 0 | 23 | 1.1% |
| Region XII | 2,164 | 22 | 0 | 22 | 1.0% |
| Region I | 2,865 | 18 | 0 | 18 | 0.6% |
| Region VIII | 4,191 | 15 | 0 | 15 | 0.4% |
| Region II | 2,544 | 9 | 0 | 9 | 0.4% |
| CAR | 1,843 | 5 | 0 | 5 | 0.3% |
Show the data as a table
| Level | Schools | Median | Middle half | 90th percentile | Share over 45 | Schools over 50 |
|---|---|---|---|---|---|---|
| Elementary | 38,627 | 24.9 | 18.0 to 34.0 | 49.8 | 12.7% | 3,804 |
| Junior high | 9,526 | 32.1 | 23.9 to 43.7 | 66.5 | 23.3% | 1,762 |
| Senior high | 7,454 | 30.6 | 23.0 to 41.3 | 57.0 | 19.4% | 1,066 |
| All levels | 46,888 | 26.1 | 18.9 to 35.8 | 52.2 | 14.3% | 5,177 |
The three regions with the most schools on shifts (NCR, Region IV-A, Region III) hold 68.3% of them.
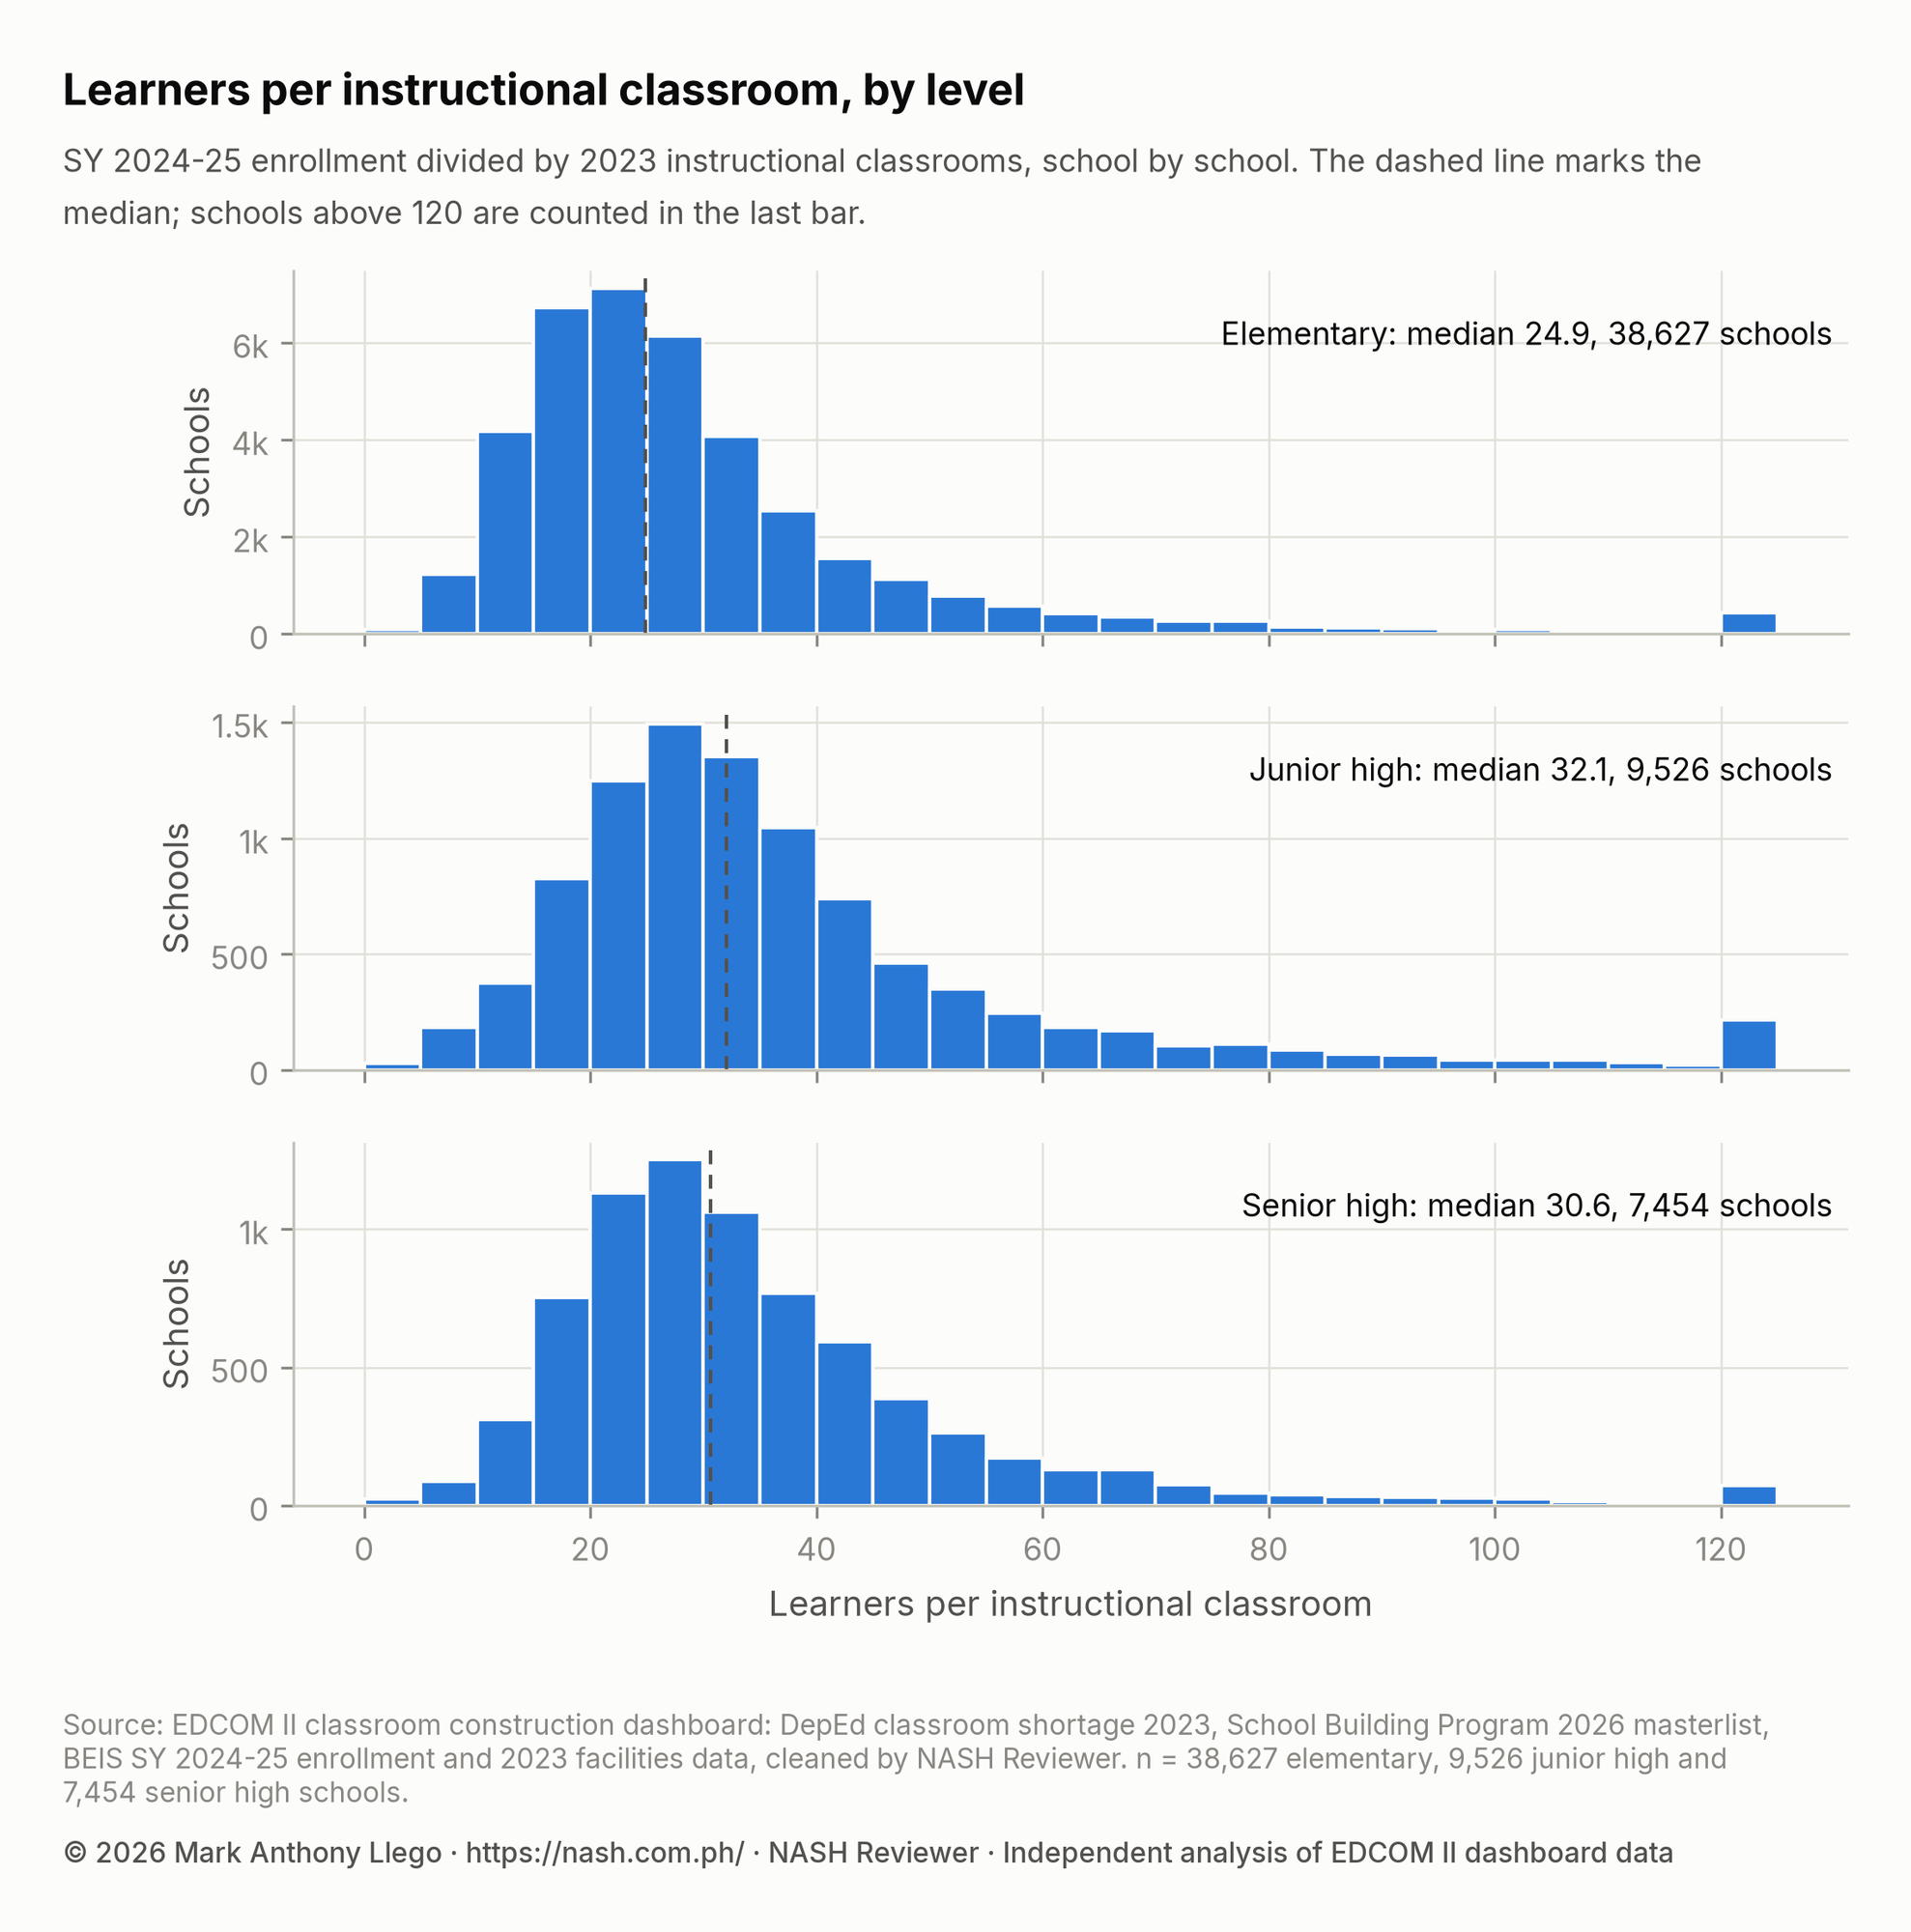
The median school has 24.9 learners per classroom in elementary, 32.1 in junior high and 30.6 in senior high. 5,177 schools have more than 50, with 26.2% of the learners counted; bringing each down to 50 would take at least 36,387 classrooms.
Schools on shifts have a median of 55.0 learners per classroom against 25.5 in single-session schools, a large difference (rank-biserial correlation 0.76). Of those in the shortage data, 93.0% have a shortage.
Schools on shifts are 2.59 times as likely as others to receive 2026 classrooms (95% interval 2.40 to 2.80): 26.2% do, against 10.1%. Still, 1,491 receive none, with 38,384 classrooms of shortage.
Last Mile Schools
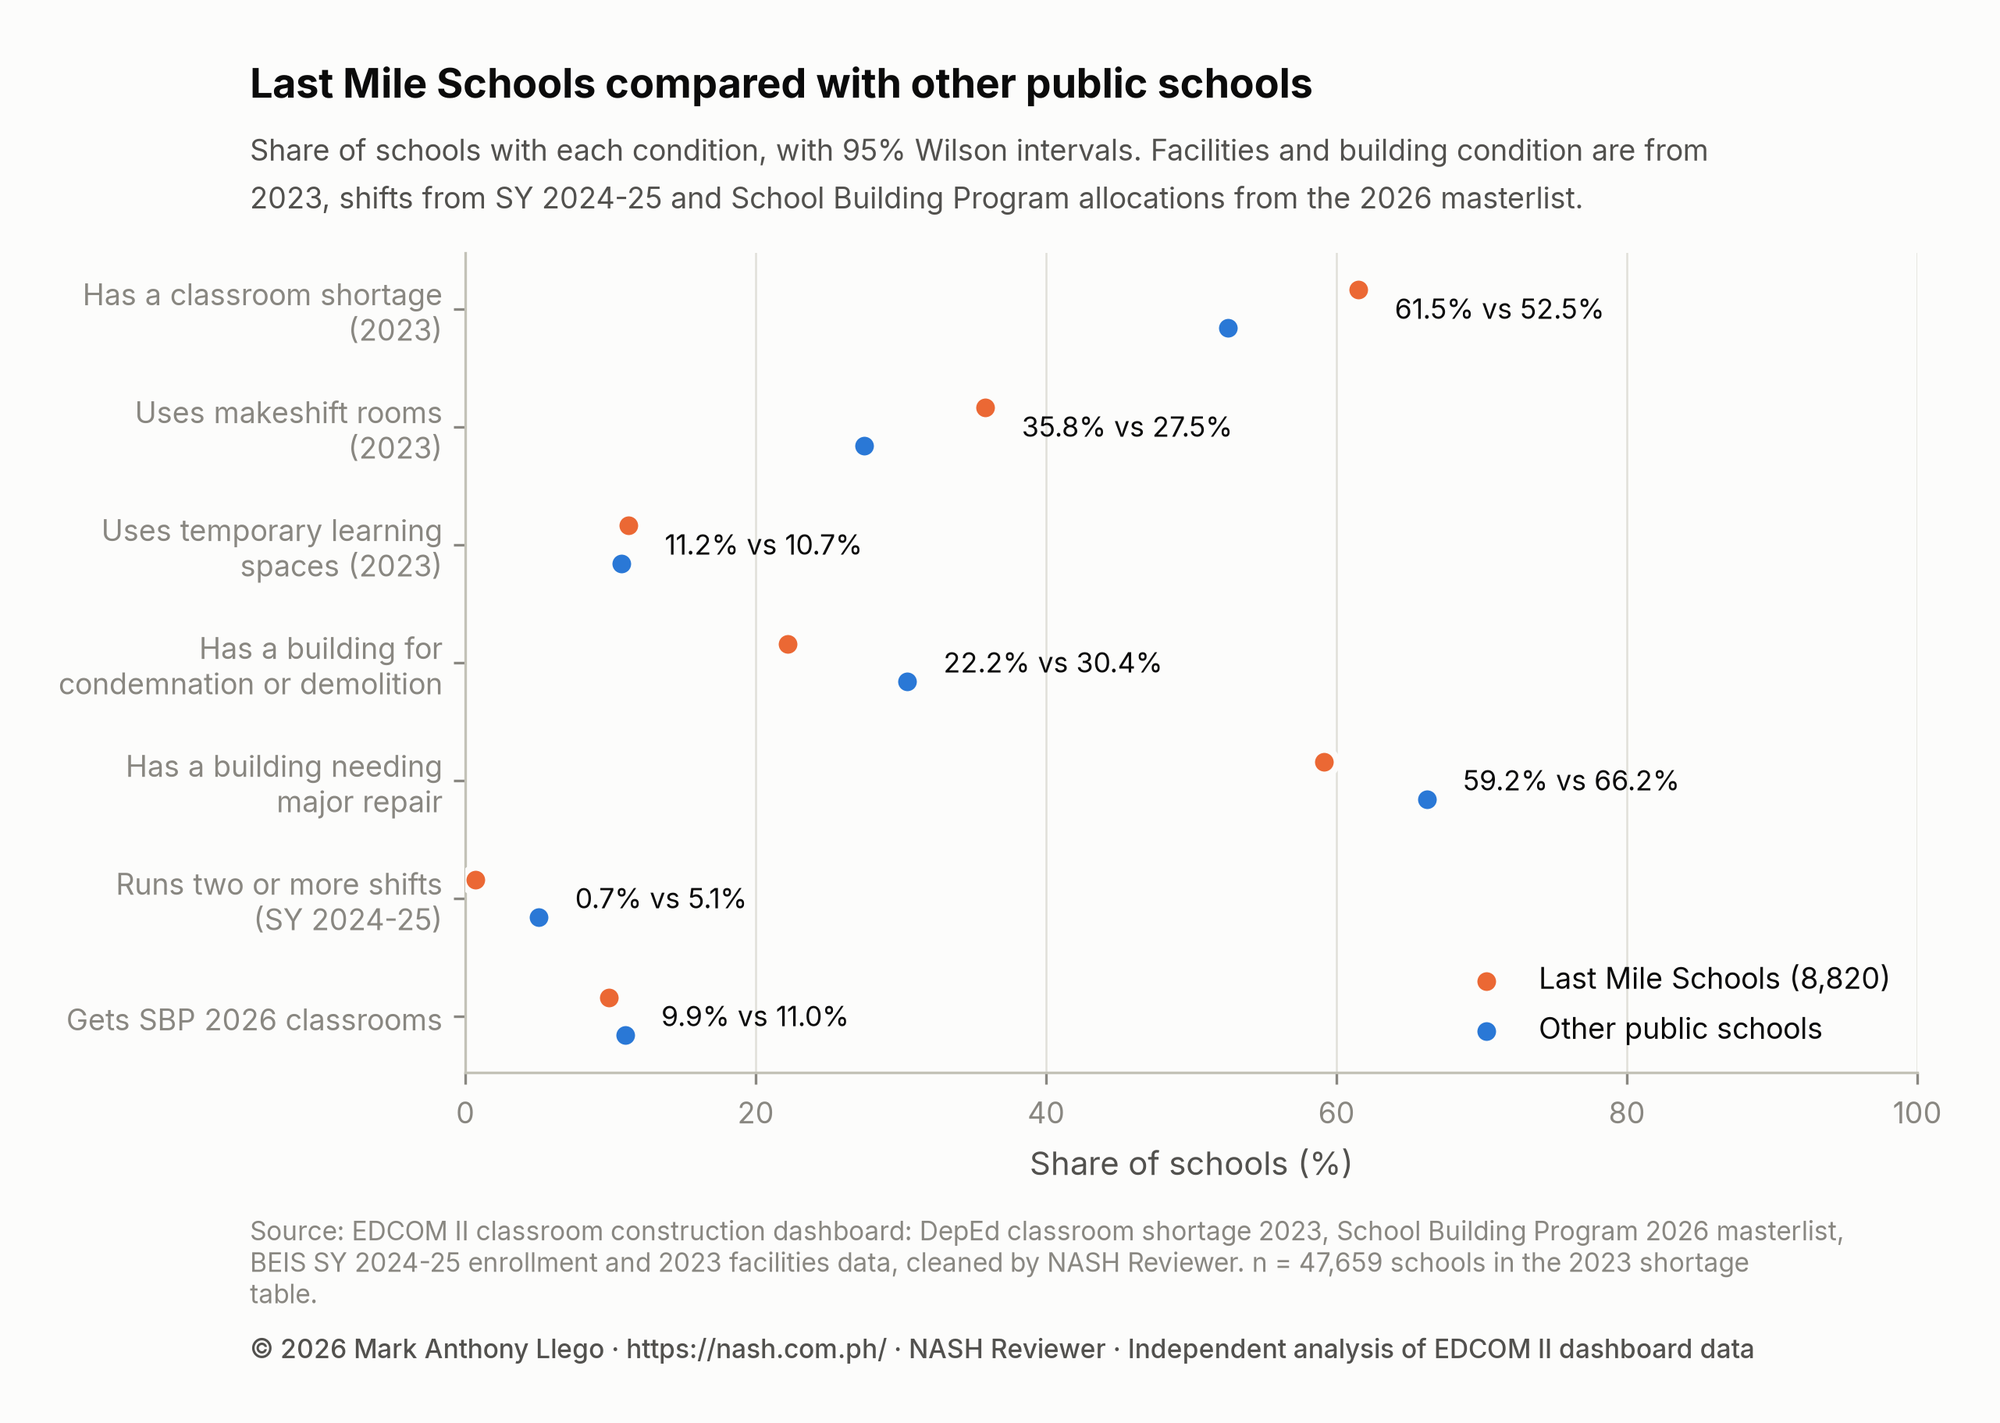
Of the 47,659 schools in the shortage data, 8,820 (18.5%) are flagged as Last Mile Schools, in geographically isolated, disadvantaged and conflict-affected areas and hardship posts. They enroll 6.6% of learners, with a median of 94 learners against 267 elsewhere.
Show the data as a table
| Indicator | Last Mile Schools | Other schools | Risk ratio (95% interval) |
|---|---|---|---|
| Has a classroom shortage (2023) | 61.5% (5,425 of 8,820) | 52.5% (20,398 of 38,839) | 1.17 (1.15 to 1.19) |
| Uses makeshift rooms (2023) | 35.8% (3,155 of 8,808) | 27.5% (10,651 of 38,773) | 1.30 (1.26 to 1.35) |
| Uses temporary learning spaces (2023) | 11.2% (989 of 8,808) | 10.7% (4,168 of 38,773) | 1.04 (0.98 to 1.12) |
| Has a building for condemnation or demolition | 22.2% (1,953 of 8,808) | 30.4% (11,797 of 38,772) | 0.73 (0.70 to 0.76) |
| Has a building needing major repair | 59.2% (5,210 of 8,808) | 66.2% (25,670 of 38,772) | 0.89 (0.88 to 0.91) |
| Runs two or more shifts (SY 2024-25) | 0.7% (62 of 8,794) | 5.1% (1,959 of 38,730) | 0.14 (0.11 to 0.18) |
| Gets SBP 2026 classrooms | 9.9% (870 of 8,820) | 11.0% (4,268 of 38,839) | 0.90 (0.84 to 0.96) |
61.5% of Last Mile Schools have a 2023 shortage, against 52.5% of other schools (risk ratio 1.17, 95% interval 1.15 to 1.19), and 35.8% use makeshift rooms, against 27.5%.
9.9% receive a 2026 classroom, against 11.0% of other schools (risk ratio 0.90, 0.84 to 0.96). Against schools with the same shortage, enrollment, setting and region they are slightly more likely to receive one (odds ratio 1.24, 1.04 to 1.47): as a group they receive less because they are small schools with small shortages.
4,793 Last Mile Schools with a shortage, 13,152 classrooms in all, receive no 2026 classroom. DepEd’s Last Mile School modality has 170 lines with 502 classrooms and PHP 2.98 billion; 70.6% of its lines are at schools flagged as Last Mile Schools.
1,171 of CAR’s schools (63.5%) are Last Mile Schools, the highest share of any region. The three regions with the most Last Mile Schools (CAR, Region VIII, NIR) hold 35.3% of them.
How the dashboard data were cleaned
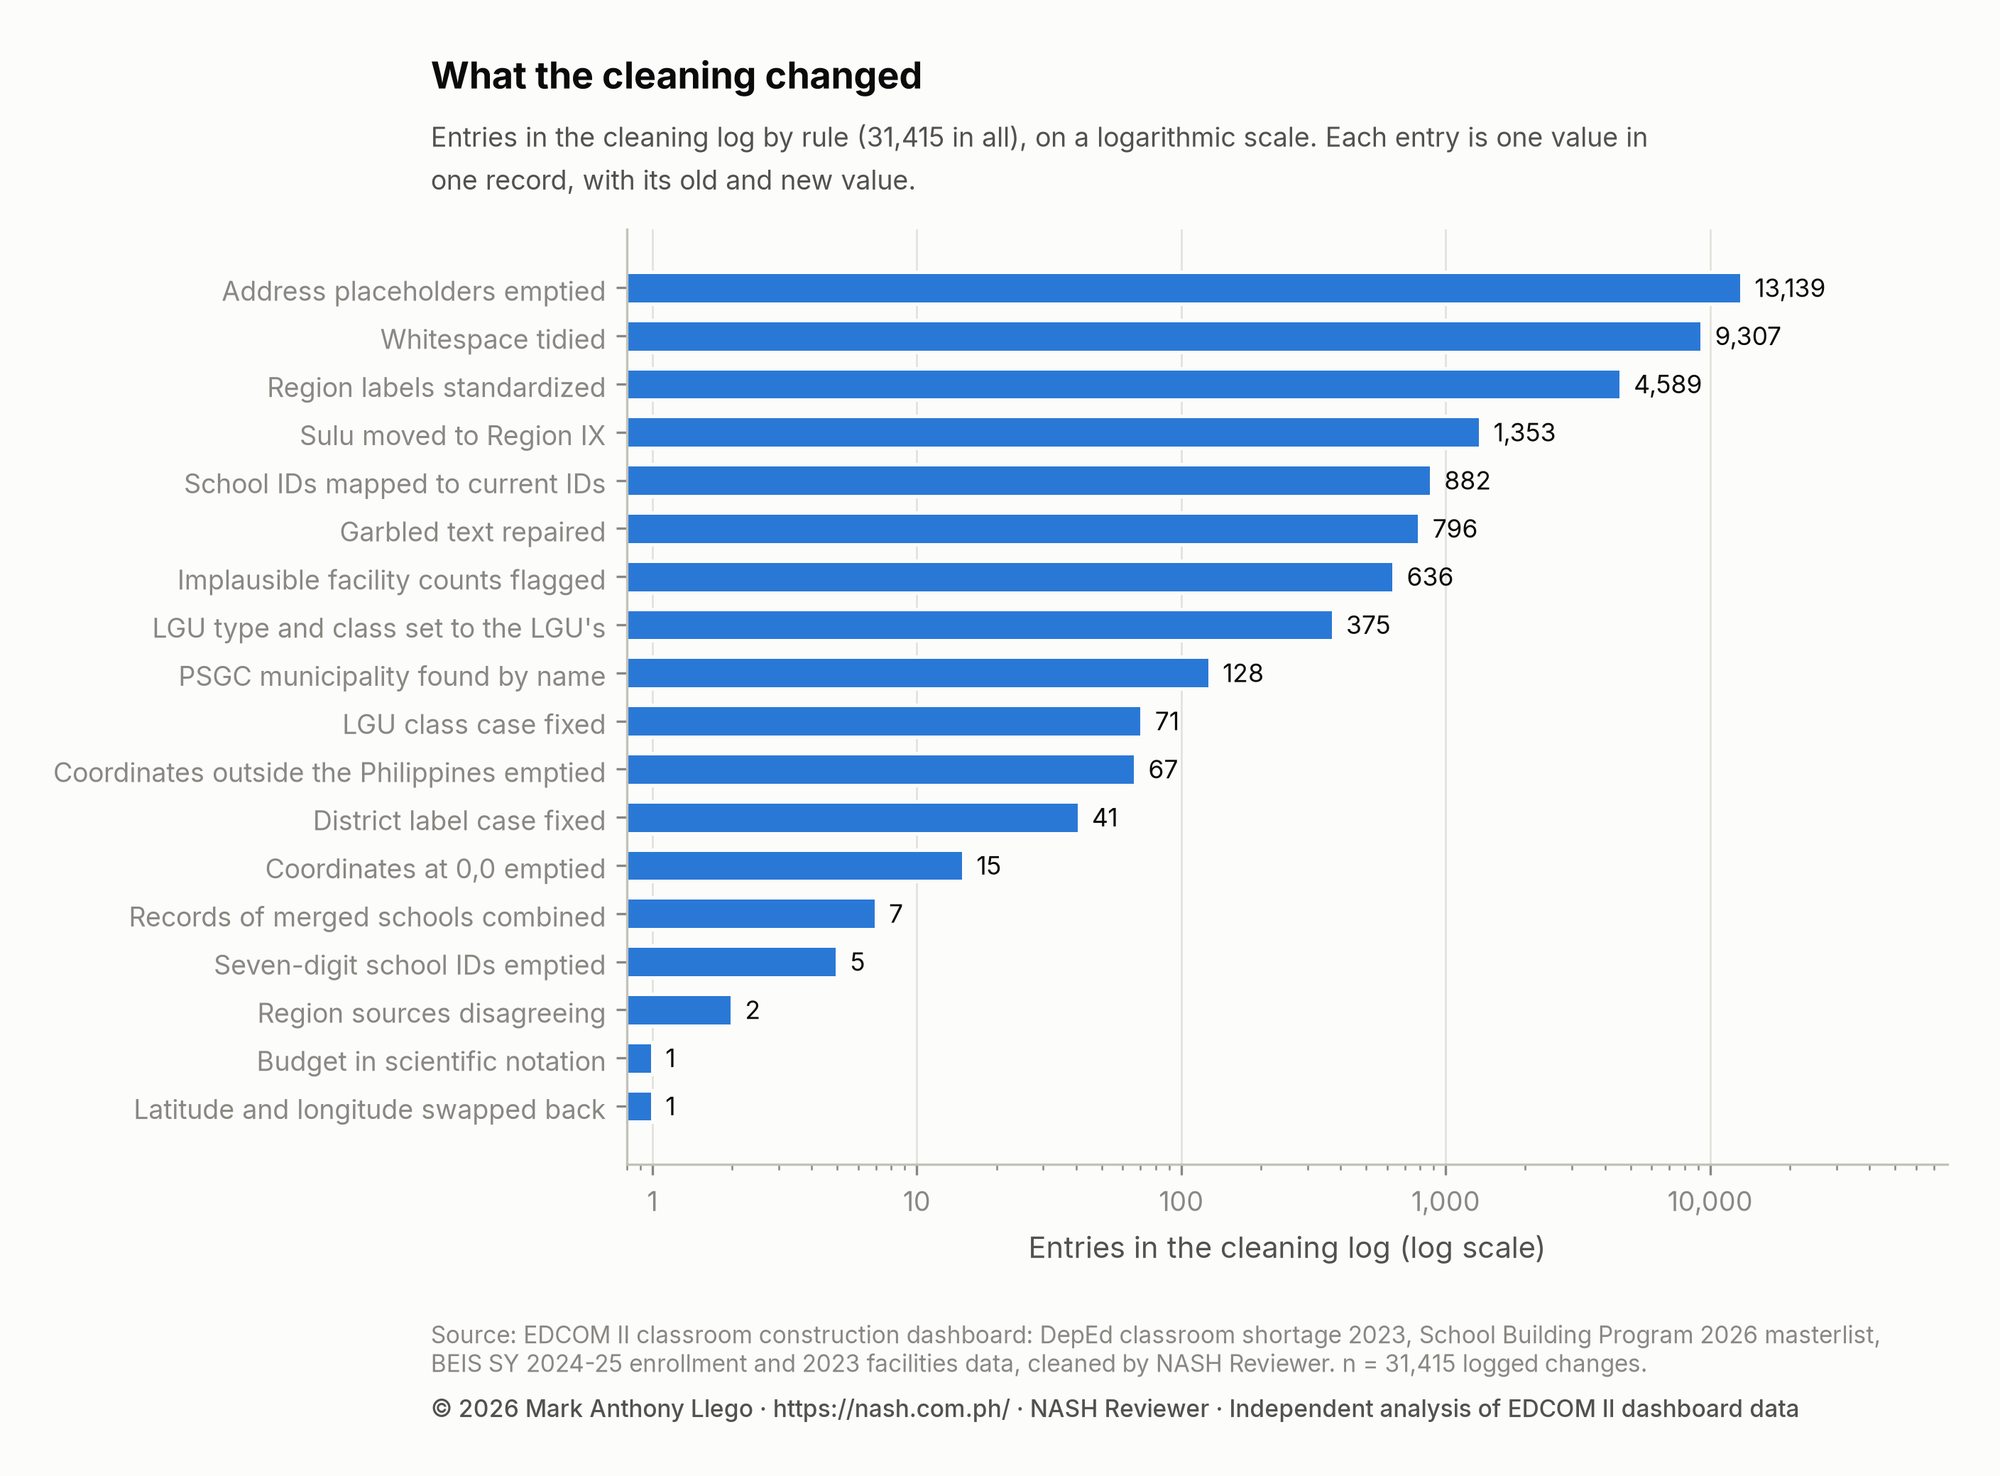
Every change is in a cleaning log of 31,415 entries, each with the table, the record, the rule, the field, and the old and new values. The cleaned data pass all 19 checks and reproduce every figure the dashboard shows.
Show the data as a table
| Cleaning rule | Entries in the log |
|---|---|
| Address placeholders emptied | 13,139 |
| Whitespace tidied | 9,307 |
| Region labels standardized | 4,589 |
| Sulu moved to Region IX | 1,353 |
| School IDs mapped to current IDs | 882 |
| Garbled text repaired | 796 |
| Implausible facility counts flagged | 636 |
| LGU type and class set to the LGU's | 375 |
| PSGC municipality found by name | 128 |
| LGU class case fixed | 71 |
| Coordinates outside the Philippines emptied | 67 |
| District label case fixed | 41 |
| Coordinates at 0,0 emptied | 15 |
| Records of merged schools combined | 7 |
| Seven-digit school IDs emptied | 5 |
| Region sources disagreeing | 2 |
| Latitude and longitude swapped back | 1 |
| Budget in scientific notation | 1 |
Most entries are tidying: 13,139 address placeholders such as “-” and “n/a” emptied, and repeated spaces removed. The changes that move figures are 4,589 region labels standardized, 1,353 Sulu records moved to Region IX and 882 rows mapped to a school’s current ID.
38 school-to-barangay links were corrected on 28 October 2026, 20 of them to a barangay in another town.
46,456 schools have valid coordinates; 1,147 are missing and 445 are absent from the 2022 table. Coordinates outside the Philippines were emptied in 67 records, and 1,416 schools more than 10 km from the center of their barangay are flagged.
The dashboard places schools through its 2022 coordinate table, so 938 SBP classrooms at schools missing from that table land in no region there. The cleaned tables place them.
What the data mean for a school head
Six points from the data for a school head, or for someone preparing to become one.
Read your school’s own figure
Most of the uneven spread of the shortage (78.6%) lies between schools in the same division. Find your school in the school table and read its shortage, learners per classroom and 2026 allocation, not only the division’s totals.
Read the shortage with enrollment
A shortage of three classrooms weighs more in a school of 200 learners than in one of 3,000. Learners per classroom and the shortage per 1,000 learners put schools of different sizes on one scale.
Check whether your school is on the 2026 list
Only 13.3% of schools with a shortage receive any 2026 classroom. The SBP lines file shows each school’s lines, modality, scope and budget.
Put the numbers in the SIP
Cite your school’s shortage, enrollment and shifts, with their years and sources, in the School Improvement Plan and in any request to the division or the LGU.
Talk to the LGU as well as the division
LGU-implemented lines make up 63.7% of the 2026 classrooms in fifth-class municipalities. The city and municipality table sets your town beside others of its income class.
Treat the figures as dated estimates
The shortage is from 2023, enrollment from SY 2024-25 and the allocations from 2026. Check the quality flags, and confirm a school’s figures with the division before they are used for planning.
How the figures were computed
The cleaning and the analysis can be re-run from the raw extract. These are the choices that determine what the charts show.
- The workbook’s five tables were read from its Hyper extract, unfiltered, with Hyper’s own CSV export. The raw extract is published unchanged, and 19 validation checks, among them row counts and every dashboard figure, pass on the cleaned tables.
- Schools are joined across the five tables by their current school ID, with old IDs mapped through a crosswalk. Regions follow the PSGC, with Sulu in Region IX and the Negros Island Region as its own region. Schools are linked to barangays through validated school-to-barangay links, then to municipalities by name.
- The shortage is DepEd’s 2023 figure, Kindergarten to Grade 10 plus senior high school, counted where a school lacks classrooms. Rates divide it by SY 2024-25 enrollment; learners per classroom divide SY 2024-25 learners by 2023 instructional classrooms.
- Concentration is measured with the Lorenz curve, the Gini coefficient and the Theil index, split between regions, divisions in the same region and schools in the same division. The concentration index of the 2026 classrooms ranks schools by their shortage, with 95% intervals from a bootstrap that resamples divisions.
- Allocation is compared with need school by school: a school’s 2026 classrooms count within its shortage up to the size of that shortage, and beyond it after that.
- Shares come with 95% Wilson intervals, the trend across income classes uses the Cochran–Armitage test, and group differences use Kruskal–Wallis with Dunn–Holm comparisons or Mann–Whitney with the rank-biserial correlation. Risk ratios use the Katz interval.
- Logistic regressions with a separate baseline for each region estimate the odds of receiving classrooms, with standard errors clustered by division for schools and by province for municipalities.
- Every number on this page and in the blog series comes from the same analysis outputs, so the two agree. All results are associations.
Limits of the data
What these files cannot say, and the patterns in them worth checking before use.
- The data are one snapshot of the dashboard, with tables from 2022 to 2026. The dashboard and DepEd’s lists may be updated; the files of this release will not change.
- The shortage is DepEd’s 2023 estimate. Schools opened, merged or renumbered since then may be missing or counted under a new ID.
- The SBP masterlist shows planned classrooms, not finished ones. EDCOM II reported that by its 16 October 2026 hearing only PHP 1.87 billion of the PHP 21.45 billion for DPWH-led classrooms had reached the award or near-award stage.
- Learners per classroom combine SY 2024-25 enrollment with 2023 rooms, so rooms built in between are not counted.
- Only public schools are covered.
- Associations between a school’s traits and its allocation do not show how allocations were decided.
About these numbers
- 103 PSIP III lines with 1,554 classrooms are exact copies of an earlier line. They are kept, as the dashboard counts them, and flagged in duplicate_of_line.
- The dashboard’s Remaining Unfunded subtracts every 2026 classroom from the whole shortage (133,024); counted school by school, 148,276 classrooms of shortage remain unmet.
- 636 facility counts that cannot be right are flagged, not changed.
- Version 1.1 of the files, released on 28 October 2026, types the City of Manila as a city, gives each school its city’s or municipality’s LGU type and income class, and merges congressional district labels that differed only in capitalization. No other value changed; version 1 stays online, and the release README lists the changes.
Download the EDCOM II classroom data
The cleaned tables in five formats, the documentation, the analysis tables and the raw extract, free to download with a README and checksums. Reusing them needs our written permission: email support@nash.com.ph.
School, project and city tables
The three tables most analyses start from: one row per school, one per School Building Program 2026 line and one per city or municipality.
- Schools (Parquet)The same table, typed (nullable integers, booleans, text codes with leading zeros)
- Schools (CSV)One row per public school: geography and PSGC codes, SY 2024-25 enrollment and shifts, 2023 classrooms and buildings, 2023 classroom shortage, SBP 2026 allocation, derived ratios and quality flags
- School Building Program 2026 lines (Parquet)The same table, typed (nullable integers, booleans, text codes with leading zeros)
- School Building Program 2026 lines (CSV)Every School Building Program 2026 masterlist line: modality, scope, classrooms, budget, timeline, school geography
- Cities and municipalities (Parquet)The same table, typed (nullable integers, booleans, text codes with leading zeros)
- Cities and municipalities (CSV)One row per city or municipality (PSGC code): schools, enrollment, shortage, SBP classrooms, coverage
Source tables, cleaned
The dashboard's five source tables after cleaning, with the ID crosswalk, the dashboard's own figures and the regional reconciliation.
- Classroom shortage, 2023Source table, cleaned: classroom shortage and excess by school, 2023
- Enrollment and class shifts, SY 2024-25Source table, cleaned: enrollment and class shifts by level, SY 2024-25
- Facilities, 2023Source table, cleaned: classrooms, buildings and amenities, all sectors, 2023
- School coordinates, 2022Source table, cleaned: school coordinates and geography (NSBI SY 2022-23)
- School ID crosswalkOld school IDs and the new IDs that replaced them
- Dashboard figuresThe dashboard's figures computed the dashboard's way, beside the cleaned figures
- Region reconciliationShortage, SBP classrooms and coverage by region: dashboard placement and cleaned
Stata, SPSS and Excel
Every cleaned table in the formats most used for theses and action research, with variable labels.
- Stata filesAll ten tables as Stata .dta files with variable labels
- SPSS filesAll ten tables as SPSS .sav files with variable labels
- Excel workbookAll tables as Excel sheets, with the data dictionary
Dictionary, log and checks
What every column means, every value the cleaning changed and the checks the build passed.
- Data dictionaryLabel, type, source, notes, missing count and range for every column
- Cleaning logEvery changed value: table, record, rule, field, old value, new value
- Validation summaryRow counts, log counts by rule and the checks the build passed
Analysis tables and raw extract
The figures and chart data behind the blog series, and the five tables as extracted from the dashboard, unchanged.
- Analysis tablesThe tables, chart data and every quoted figure behind the NASH Reviewer classroom series
- Raw dashboard extractThe five tables as extracted from the dashboard workbook, unchanged, with the table manifest and the dashboard's formulas
Version 1.1, released October 28, 2026: 23 files, 86.2 MB in total. The folder name carries the version number, so the file at a given URL never changes. The blog post on the cleaning documents every table and rule.
Common questions about the classroom data
Short answers about the files, the definitions and fair use of the results.
Every file is listed in the downloads section of this page with its rows, columns, size and checksum. The files are served from data.nash.com.ph/edcom-classroom-data/v1.1, starting with the README, and Stata, SPSS and Excel versions are included. They are free to download for personal study; any other use, such as republishing them or using them in research, reports or apps, needs NASH Reviewer’s written permission first (email support@nash.com.ph).
It is DepEd’s 2023 estimate of the classrooms a school lacks for its learners, for Kindergarten to Grade 10 and for senior high school, counted only where a school has fewer rooms than it needs. A school with more rooms than it needs has an excess instead, which does not offset another school’s shortage.
No. NASH Reviewer extracted and cleaned the data from the public EDCOM II dashboard and is not affiliated with EDCOM II or DepEd. The raw extract is published unchanged beside the cleaned files, and the dashboard’s own figures are kept beside the cleaned ones, so every change can be checked.
The dashboard subtracts all 2026 classrooms from the whole shortage. Counted school by school, a classroom built at a school with no shortage, or beyond its own shortage, does not reduce another school’s, so more of the shortage remains unmet. Both figures are in the dashboard figures file.
Yes, with care. The sources span several years, from 2022 coordinates to 2026 allocations, and learners per classroom divide SY 2024-25 learners by 2023 rooms. Compare a school with others of similar size and level in its division, and check the quality flags in the school table before citing a single school’s figure.
Llego, M. A. (2026). EDCOM II classroom construction dashboard data, cleaned, version 1.1. NASH Reviewer. https://nash.com.ph/edcom-classroom-data. Name the EDCOM II dashboard and DepEd as the original sources of the data.
The classroom series on the blog
The analysis continues on the blog in 22 articles and 18 regional reports. The articles read each question in depth, and each regional report covers one region’s divisions, provinces and cities, the schools with the largest shortages, its SBP 2026 classrooms, class shifts and Last Mile Schools.
- The shortage
- The 2026 classrooms
- Schools under pressure
- The data
- Rankings and deep dives
- Classroom Shortage by Congressional District, 2023–2026
- Top 20 Cities and Municipalities by Classroom Shortage
- Classroom Shortage in Rizal and Antipolo, 2023–2026
- Quezon City Classroom Shortage: Districts and Schools
- Manila Classroom Shortage: Districts, Schools and PSIP III
- Classroom Shortage in Tawi-Tawi: Highest Rate in the Country
- Classroom Shortage in Cavite: Maragondon, Tanza and Naic
- How Much Does a Classroom Cost in the Philippines?
- Explainers
- What Is PSIP III? DepEd's PPP Classrooms Explained
- Senior High School Classroom Shortage: A Guide for SHS Heads
- Junior High School Classroom Shortage: Highest per Learner
- DepEd Schools With More Classrooms Than They Need
- DepEd Learning Continuity Spaces in the SBP 2026 List
- How Learners Reach Public High Schools: Boat, Habal-Habal
- For teachers and school heads
- Regional reports
- Classroom Shortage in NCR, 2023–2026: Shifts and Crowding
- Classroom Shortage in CAR, 2023–2026: Last Mile Schools
- Classroom Shortage in Region I, 2023–2026: Pangasinan
- Classroom Shortage in Region II, 2023–2026: High Coverage
- Classroom Shortage in Region III, 2023–2026: Class Shifts
- Classroom Shortage in Region IV-A, 2023–2026: Rizal, Cavite
- Classroom Shortage in MIMAROPA, 2023–2026: Palawan, Mindoro
- Classroom Shortage in Region V, 2023–2026: Albay and Legazpi
- Classroom Shortage in Region VI, 2023–2026: Iloilo and Roxas
- Classroom Shortage in NIR, 2023–2026: Guihulngan and Canlaon
- Classroom Shortage in Region VII, 2023–2026: Metro Cebu
- Classroom Shortage in Region VIII, 2023–2026: Samar Island
- Classroom Shortage in Region IX, 2023–2026: Sulu at the Top
- Classroom Shortage in Region X, 2023–2026: Bukidnon
- Classroom Shortage in Region XI, 2023–2026: Davao City
- Classroom Shortage in Region XII, 2023–2026: Rural Schools
- Classroom Shortage in Caraga, 2023–2026: Dinagat Islands
- Classroom Shortage in BARMM, 2023–2026: Highest Rate
How to cite this page
Use APA style (7th edition). The date is the day the page was last updated. Where you use a figure or a rule, also cite the law, issuance, or report the page names for it.
Llego, M. A. (2026, October 30). EDCOM II classroom data: the 2023 shortage and 2026 classrooms. NASH Reviewer. https://nash.com.ph/edcom-classroom-data
In-text citation: (Llego, 2026). To cite the cleaned data files rather than this page, use the data citation under Common questions about the classroom data.
Sources
The EDCOM II dashboard compiles DepEd data. Each table was checked against the dashboard before any analysis.
- EDCOM II classroom construction dashboard (School Level Classroom Construction and LGU Breakdown), Tableau workbookThe workbook’s two dashboards, 15 worksheets, 25 calculated fields and five embedded tables, extracted unfiltered.
- DepEd classroom shortage by school, 2023, Kindergarten to Grade 10 and senior high school (compiled in the EDCOM II dashboard)The classroom shortage and excess by school.
- DepEd School Building Program 2026 masterlist, one line per project (compiled in the EDCOM II dashboard)Each line’s school, modality, scope, classrooms, storeys, budget and timeline.
- DepEd BEIS enrollment and class shifts, SY 2024-25, and school facilities, 2023 (compiled in the EDCOM II dashboard)Learners and class shifts by school and level; classrooms, buildings, makeshift rooms and their condition by school.
- DepEd school coordinates, National School Building Inventory SY 2022-23 (compiled in the EDCOM II dashboard)School locations, with region, division, province, municipality and barangay names.
- PSA Philippine Standard Geographic Code (PSGC): barangay, municipal and regional codesThe codes that link schools to their barangay, municipality and region.
- EDCOM II news releases, 13 November 2025 and 20 October 2026EDCOM II’s own analysis of the 2026 classroom allocations, the BARMM hearing and the 16 October 2026 hearing on DPWH-led classrooms, quoted where this page compares with them.
- Analysis pipelinePython scripts in the edcom_data repository (extract_tables.py, clean_data.py and analysis scripts a1 to a7) that extract and clean the workbook, compute every figure, draw the charts, build the release and write this page’s tables.
For aspiring school heads
Make the case for classrooms with data
The NASH asks how you would run a school: how to argue for resources, how to work with the LGU and what to do when rooms run short. Practice the PPSSH strands with situational questions that ask you to decide as a school head would.