PSIP III is DepEd’s third Public-Private Partnership for School Infrastructure Project. It is a build-lease-and-transfer arrangement: as Inquirer.net reported on 24 February 2026, private partners finance and build the classrooms and maintain them through the concession period, and DepEd pays through availability payments from its annual budget (Escosio, 2026, February 24). The Economy and Development (ED) Council approved it in January 2026. Both Philstar and Inquirer.net put the project cost at PHP 105.7 billion and reported 16,459 classrooms; Philstar placed them in 1,095 schools and reported expected government savings of PHP 40.15 billion (Cariaso, 2026; Escosio, 2026, January 13). EDCOM II reported that DepEd launched a portal, Project Bukas, to keep the project transparent (EDCOM II, 2026, February 9).
PSIP III is also half of the School Building Program (SBP) 2026. In the SBP 2026 masterlist, as published in the EDCOM II classroom construction dashboard, it has 1,274 lines with 16,305 classrooms at 1,094 schools, 50.3% of the list’s 32,419 classrooms. These counts are close to the news figures but not the same, and the dates differ too: every PSIP III line in the masterlist is marked for bidding, has no budget yet, and runs from March 2027 to July 2028, while the news reports said all classrooms would be completed by March 2028.
The post is written for teachers, school heads and aspiring school heads who want to know whether a PSIP III building is coming to their school or town, and for anyone citing the project in a school improvement plan, a thesis or an action research paper. Every file behind it is listed on the EDCOM II classroom data page.
Key findings
- PSIP III is a build-lease-and-transfer PPP approved by the ED Council in January 2026, which Philstar and Inquirer.net reported as 16,459 classrooms; Philstar placed them in 1,095 schools.
- In the SBP 2026 masterlist, PSIP III has 16,305 classrooms on 1,274 lines at 1,094 schools, 50.3% of the list’s 32,419 classrooms.
- All 1,274 PSIP III lines are marked for bidding with no budget and run from March 2027 to July 2028 in the masterlist, while the news reports gave completion by March 2028.
- The lines are in eight regions, led by Region IV-A with 4,878 classrooms (29.9%), and Region V (Bicol) has 1,492 although Philstar’s list of regions does not name it.
- PSIP III lines are large, a median of 10.0 classrooms against 3.0 on GAA-funded lines, and 50.4% of them name four-story buildings.
- 103 PSIP III lines, with 1,554 classrooms, exactly copy an earlier line, and without them PSIP III has 14,751 classrooms.
- Schools on PSIP III lines have a median 2023 shortage of 6.0 classrooms and 941 learners, against 1.0 and 282 at schools on GAA lines only (rank-biserial correlation 0.36, p < 0.001).
What PSIP III is: DepEd’s classroom PPP
PSIP is DepEd’s Public-Private Partnership for School Infrastructure Project. In a public-private partnership (PPP), a private company takes on the building and financing of a public facility, and the government pays for it under a long contract. PSIP III, the third phase, uses a build-lease-and-transfer (BLT) arrangement; the name describes the sequence, in which the partner builds the classrooms, leases them to the government, and then transfers them. Inquirer.net described the terms on 24 February 2026:
“Under a Build-Lease-and-Transfer (BLT) modality, private partners will finance and construct the classrooms, ensuring on-time delivery and proper maintenance throughout the concession period. Payments will be made through availability payments sourced from DepEd’s annual budget.” (Escosio, 2026, February 24)
In plain words, the partner pays to build the classrooms and keeps them in repair, and DepEd pays over the years of the concession out of its yearly budget. EDCOM II summed up the model in its 9 February 2026 news release, which also named DepEd’s transparency portal for the project:
“Aiming to start the construction of 26,000 classrooms in 2026, DepEd has launched the ‘Project Bukas’ portal to ensure transparency for the upcoming PPP School Infrastructure Project (PSIP) 3, which targets over 16,000 classrooms using an ‘availability payment’ model to ensure delivery before payment.” (EDCOM II, 2026, February 9)
Philstar reported on 14 January 2026 that the Economic Development Council, chaired by the President, had approved Phase 3 of the PSIP, as the Education Secretary announced on 13 January; Inquirer.net named the body the Economy and Development (ED) Council (Cariaso, 2026; Escosio, 2026, January 13). Philstar quoted the plan as follows: “The DepEd will initially build and maintain 16,459 classrooms in 1,095 schools across Regions 1, 2, 3, 4-A, 4-B, the National Capital Region and the Cordillera Administrative Region.” It also reported that “The DepEd plans to build 105,000 classrooms from 2026 to 2031 under a build-lease-and-transfer PPP scheme.” Inquirer.net reported that PSIP III is set to become the largest classroom PPP in the country’s history.
Both outlets gave the same timeline: bidding by March 2026, contract signing targeted by August 2026, and construction starting by March 2027. Philstar wrote that all classrooms would be completed within 19 months, or by March 2028; Inquirer.net, that they would be built within 19 months after contract signing, with full completion expected by March 2028, and that the start is in line with the PPP Code. Inquirer.net also reported that a presidential directive, PBBM-2025-1355 of 21 January 2025, set up a Green Lane for education PPPs that shortens approval, bidding and review periods by an average of two months per project stage (Escosio, 2026, February 24).
PSIP III follows two earlier phases. Philstar and Inquirer.net reported that PSIP I and II together delivered 13,391 classrooms, and Philstar split them into 9,296 under PSIP 1 and 4,095 under PSIP 2. EDCOM II’s National Education Plan 2026–2035 gives 9,296 for PSIP I and 4,367 for PSIP II, citing DepEd, and sets a target of 15,000 classrooms under PSIP III by 2028 (EDCOM II, 2026). The two sources differ on PSIP II; National Education Plan 2026-2035: Guide for School Heads explains the plan.
PSIP III in the SBP 2026 masterlist, beside the news figures
The SBP 2026 masterlist in the EDCOM II dashboard has 5,652 lines with 32,419 classrooms. Of these, 4,378 lines, with 16,114 classrooms, are funded under the General Appropriations Act (GAA) 2026 and implemented by the Department of Public Works and Highways (DPWH), by provinces, cities and municipalities, or by DepEd. The other 1,274 lines, with 16,305 classrooms, 50.3% of the list, are PSIP III. Their budget column reads “N/A (For Bidding)”, and all 1,274 give the same expected dates: a start in March 2027 and an end in July 2028. DepEd School Building Program 2026 in Numbers describes the whole list.
The sources describe PSIP III with different figures. The table lists each as published, with its date.
| Source | Date | What it reports for PSIP III |
|---|---|---|
| Philstar | 14 January 2026 | 16,459 classrooms in 1,095 schools across Regions 1, 2, 3, 4-A, 4-B, NCR and CAR; construction to start by March 2027 and all classrooms completed within 19 months, or by March 2028 |
| Inquirer.net | 13 January 2026 | A total of 16,459 new classrooms in high-need areas; construction to start by March 2027 and full completion expected by March 2028 |
| EDCOM II news release | 9 February 2026 | PSIP III “targets over 16,000 classrooms” |
| Inquirer.net | 24 February 2026 | More than 16,000 new classrooms |
| EDCOM II, National Education Plan 2026–2035 | 2026 | A target of 15,000 classrooms under PSIP III by 2028 |
| SBP 2026 masterlist, EDCOM II dashboard | As published in the dashboard | 16,305 classrooms on 1,274 lines at 1,094 schools in eight regions; every line for bidding, from March 2027 to July 2028 |
The masterlist’s 16,305 classrooms and 1,094 schools are close to the 16,459 classrooms and 1,095 schools in the news, but not the same, and its July 2028 end date is later than the March 2028 completion in the news. For PSIP III as an approved project, cite the news reports or DepEd; for the classrooms named school by school, cite the masterlist, with its source. The masterlist records the status of every line as for bidding.
One more feature of the masterlist matters for anyone counting. 103 lines are exact copies of an earlier line, and they carry 1,554 classrooms. All of them are PSIP III. The masterlist has no project ID, so a second identical building at the same school cannot be told apart from a double entry, and the cleaned data keep them, as the dashboard does. Without them, PSIP III has 14,751 classrooms and the whole list 30,865. Where this post gives 16,305, the duplicates are included.
PSIP III classrooms by region
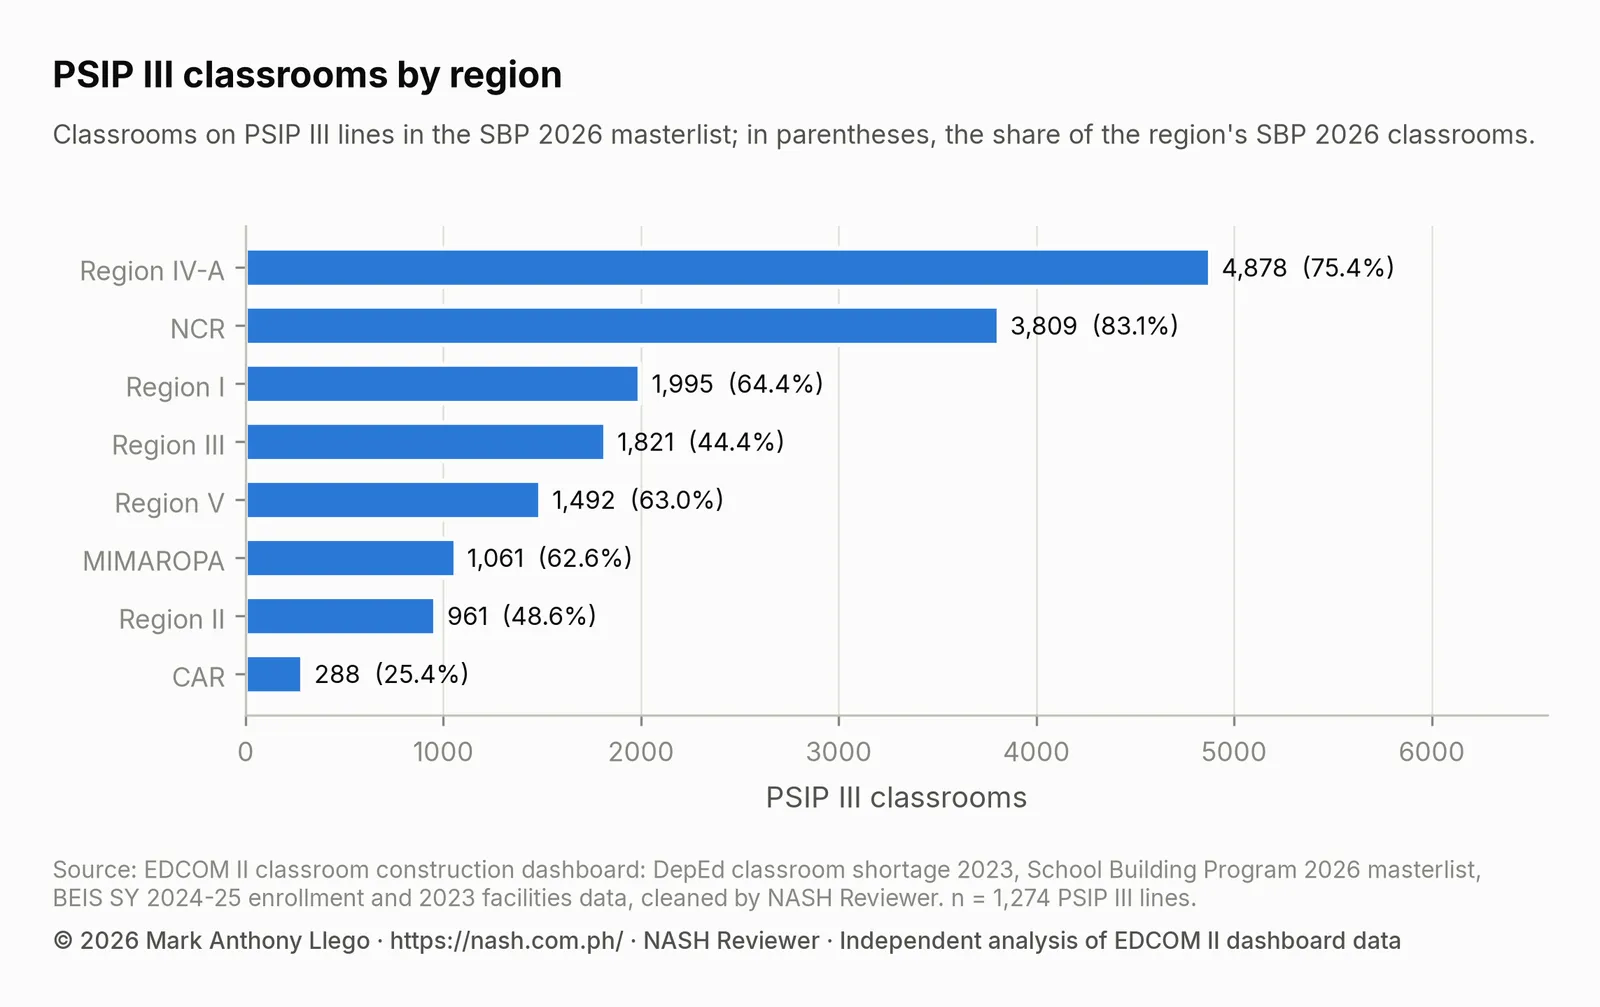
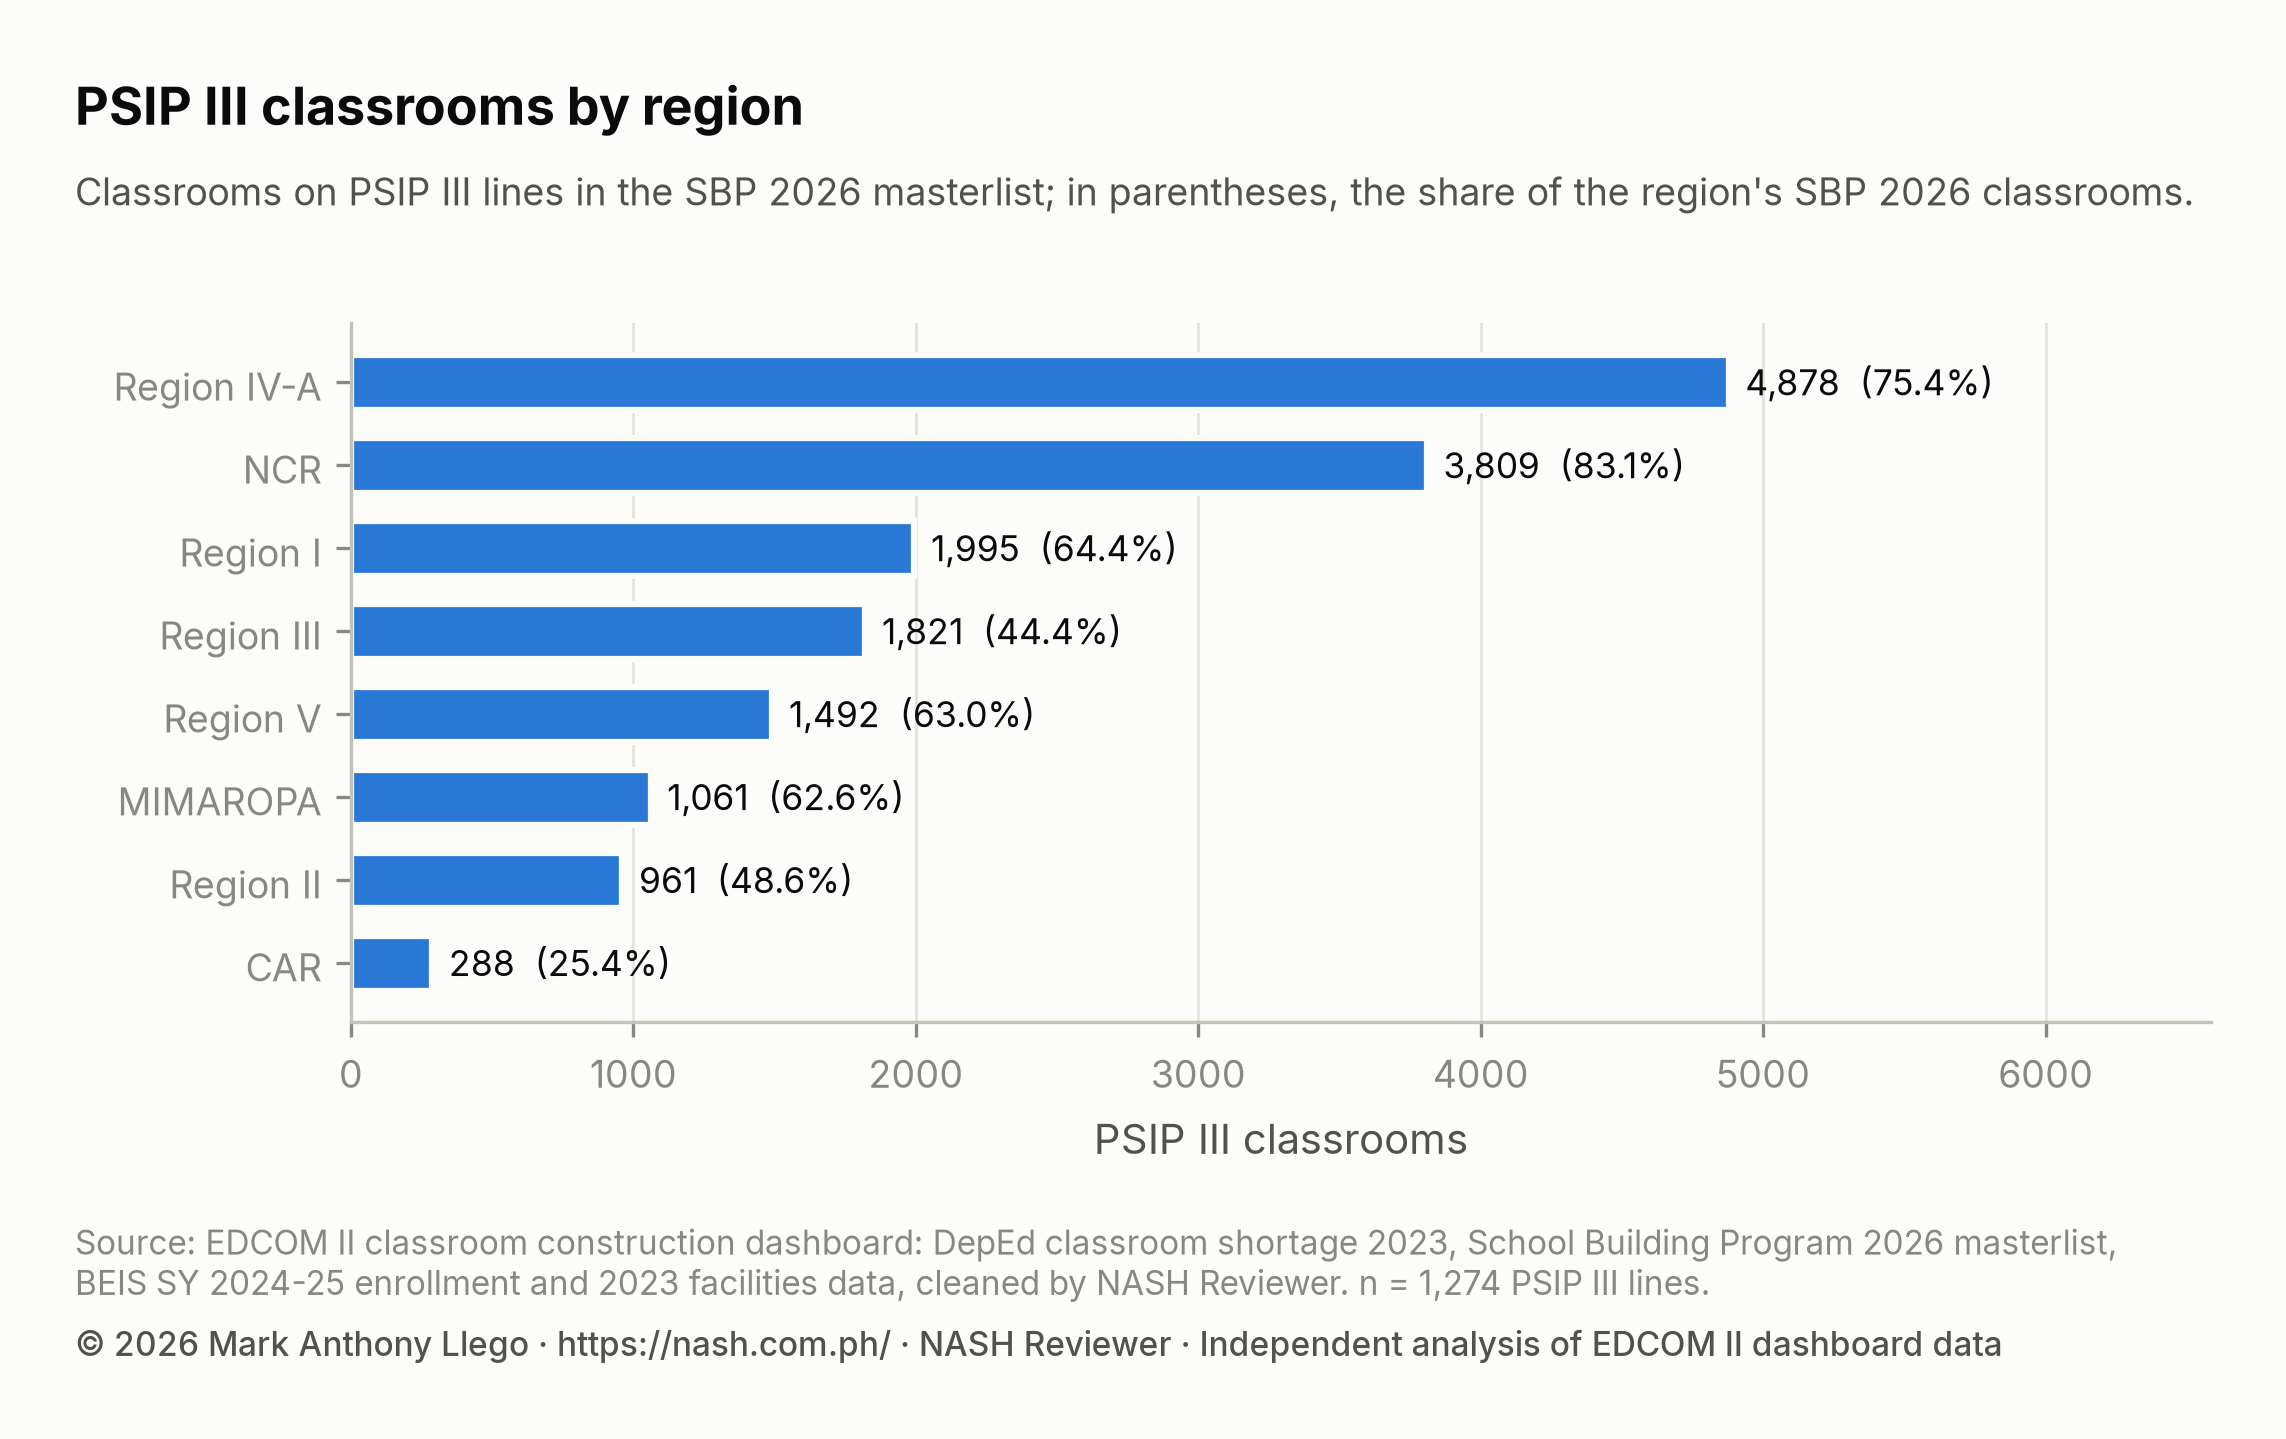
PSIP III lines are in eight regions, all in the Luzon island group. Region IV-A has the most, 4,878 classrooms on 340 lines, which is 29.9% of all PSIP III classrooms and 75.4% of the region’s SBP 2026 classrooms. NCR follows with 3,809, and there PSIP III makes up 83.1% of the SBP classrooms, the highest share of any region. In five of the eight regions, PSIP III is more than half of the region’s SBP 2026 classrooms; CAR has the fewest PSIP III classrooms, 288, a quarter of its list. The other 10 regions, in the Visayas and Mindanao, have no PSIP III lines, so their SBP 2026 classrooms are all GAA-funded.
| Region | Lines | Schools | PSIP III classrooms | Share of the region’s SBP 2026 classrooms | Region’s 2023 classroom shortage | PSIP III classrooms as a share of the shortage |
|---|---|---|---|---|---|---|
| NCR | 142 | 125 | 3,809 | 83.1% | 24,866 | 15.3% |
| CAR | 34 | 31 | 288 | 25.4% | 2,301 | 12.5% |
| Region I | 180 | 164 | 1,995 | 64.4% | 3,061 | 65.2% |
| Region II | 127 | 115 | 961 | 48.6% | 2,501 | 38.4% |
| Region III | 158 | 148 | 1,821 | 44.4% | 13,119 | 13.9% |
| Region IV-A | 340 | 259 | 4,878 | 75.4% | 31,010 | 15.7% |
| MIMAROPA | 101 | 83 | 1,061 | 62.6% | 4,777 | 22.2% |
| Region V | 192 | 169 | 1,492 | 63.0% | 7,415 | 20.1% |
Set against each region’s 2023 classroom shortage, PSIP III classrooms equal 65.2% of Region I’s shortage and 38.4% of Region II’s, but 15.7% of Region IV-A’s, 15.3% of NCR’s and 13.9% of Region III’s, the three largest shortages among the eight. A region’s PSIP III classrooms and its shortage need not sit at the same schools; Do 2026 Classrooms Go Where the Shortage Is? matches them school by school.
Philstar’s report listed the regions as Regions 1, 2, 3, 4-A, 4-B (MIMAROPA), the National Capital Region and the Cordillera Administrative Region (Cariaso, 2026). The masterlist has PSIP III lines in all seven and also in Region V (Bicol): 192 lines with 1,492 classrooms at 169 schools, 63.0% of Region V’s SBP 2026 classrooms. The two sources differ here as well. Region V’s report reads the region’s schools in detail. (Regions here are DepEd’s; Sulu, whose schools division moved to DepEd Region IX on 20 October 2026, is counted in Region IX, which has no PSIP III lines.)
How big PSIP III buildings are: classrooms per line and stories
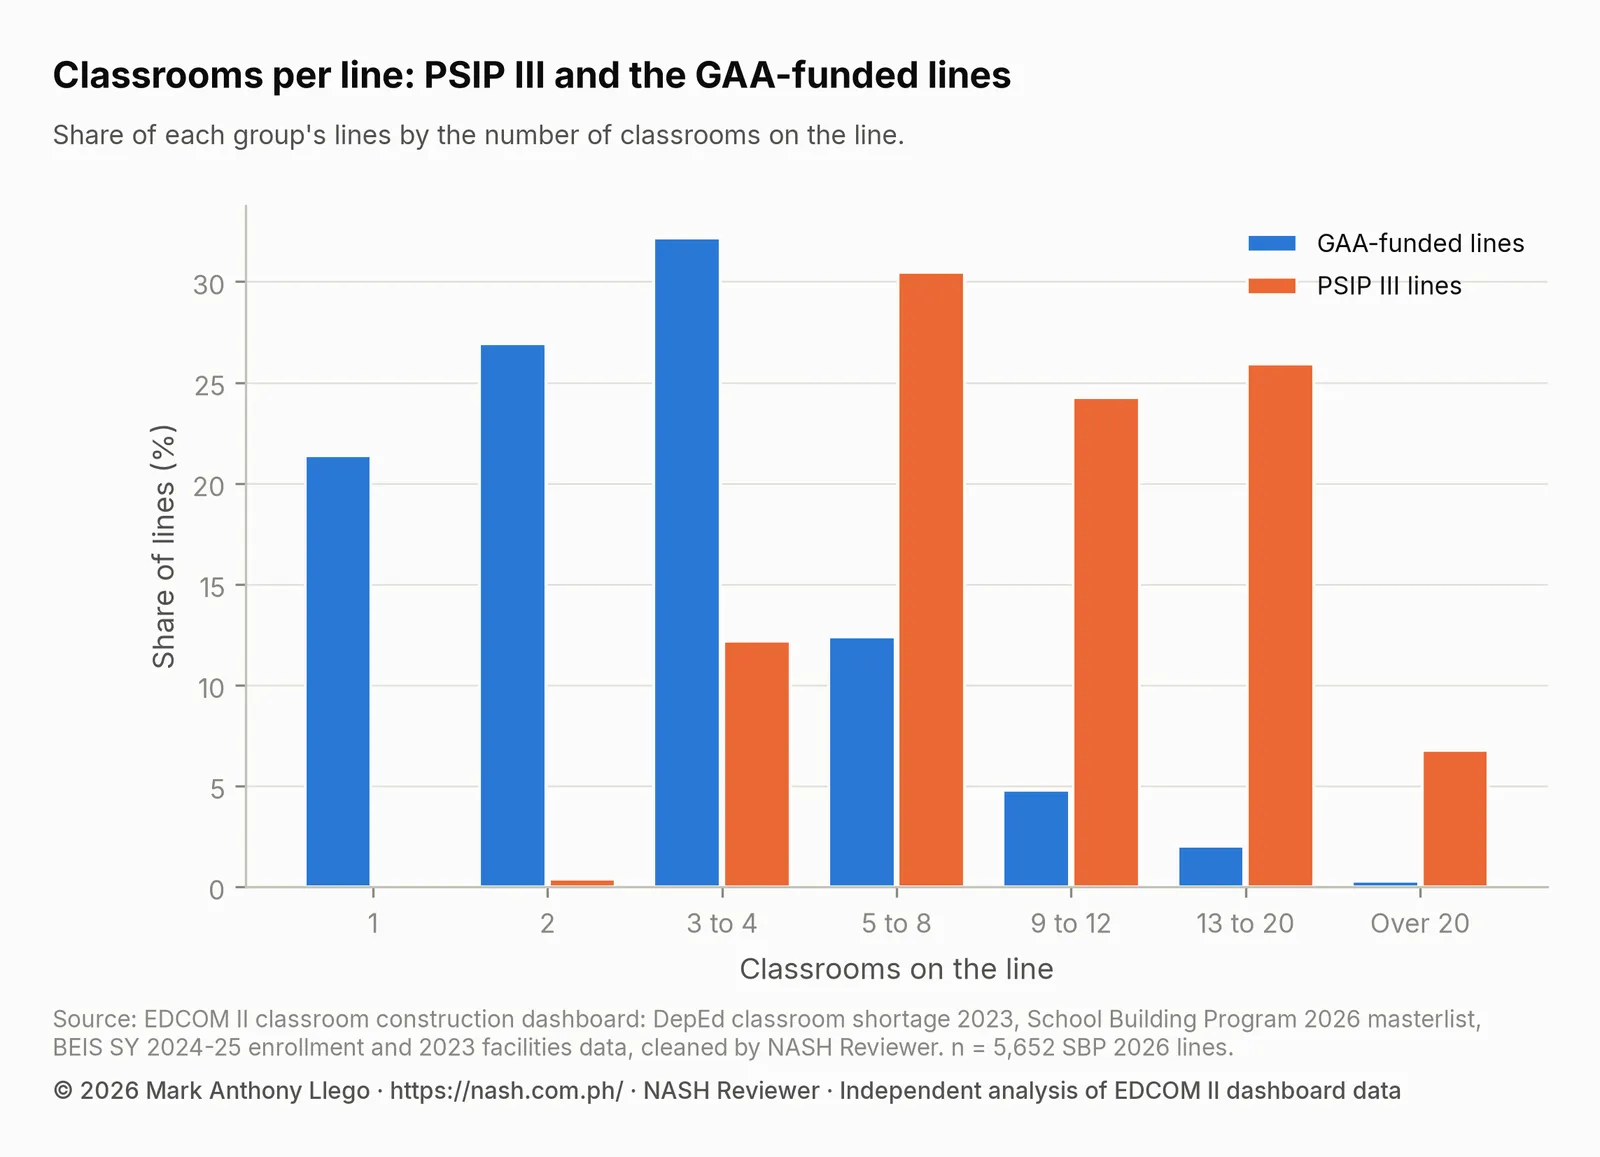
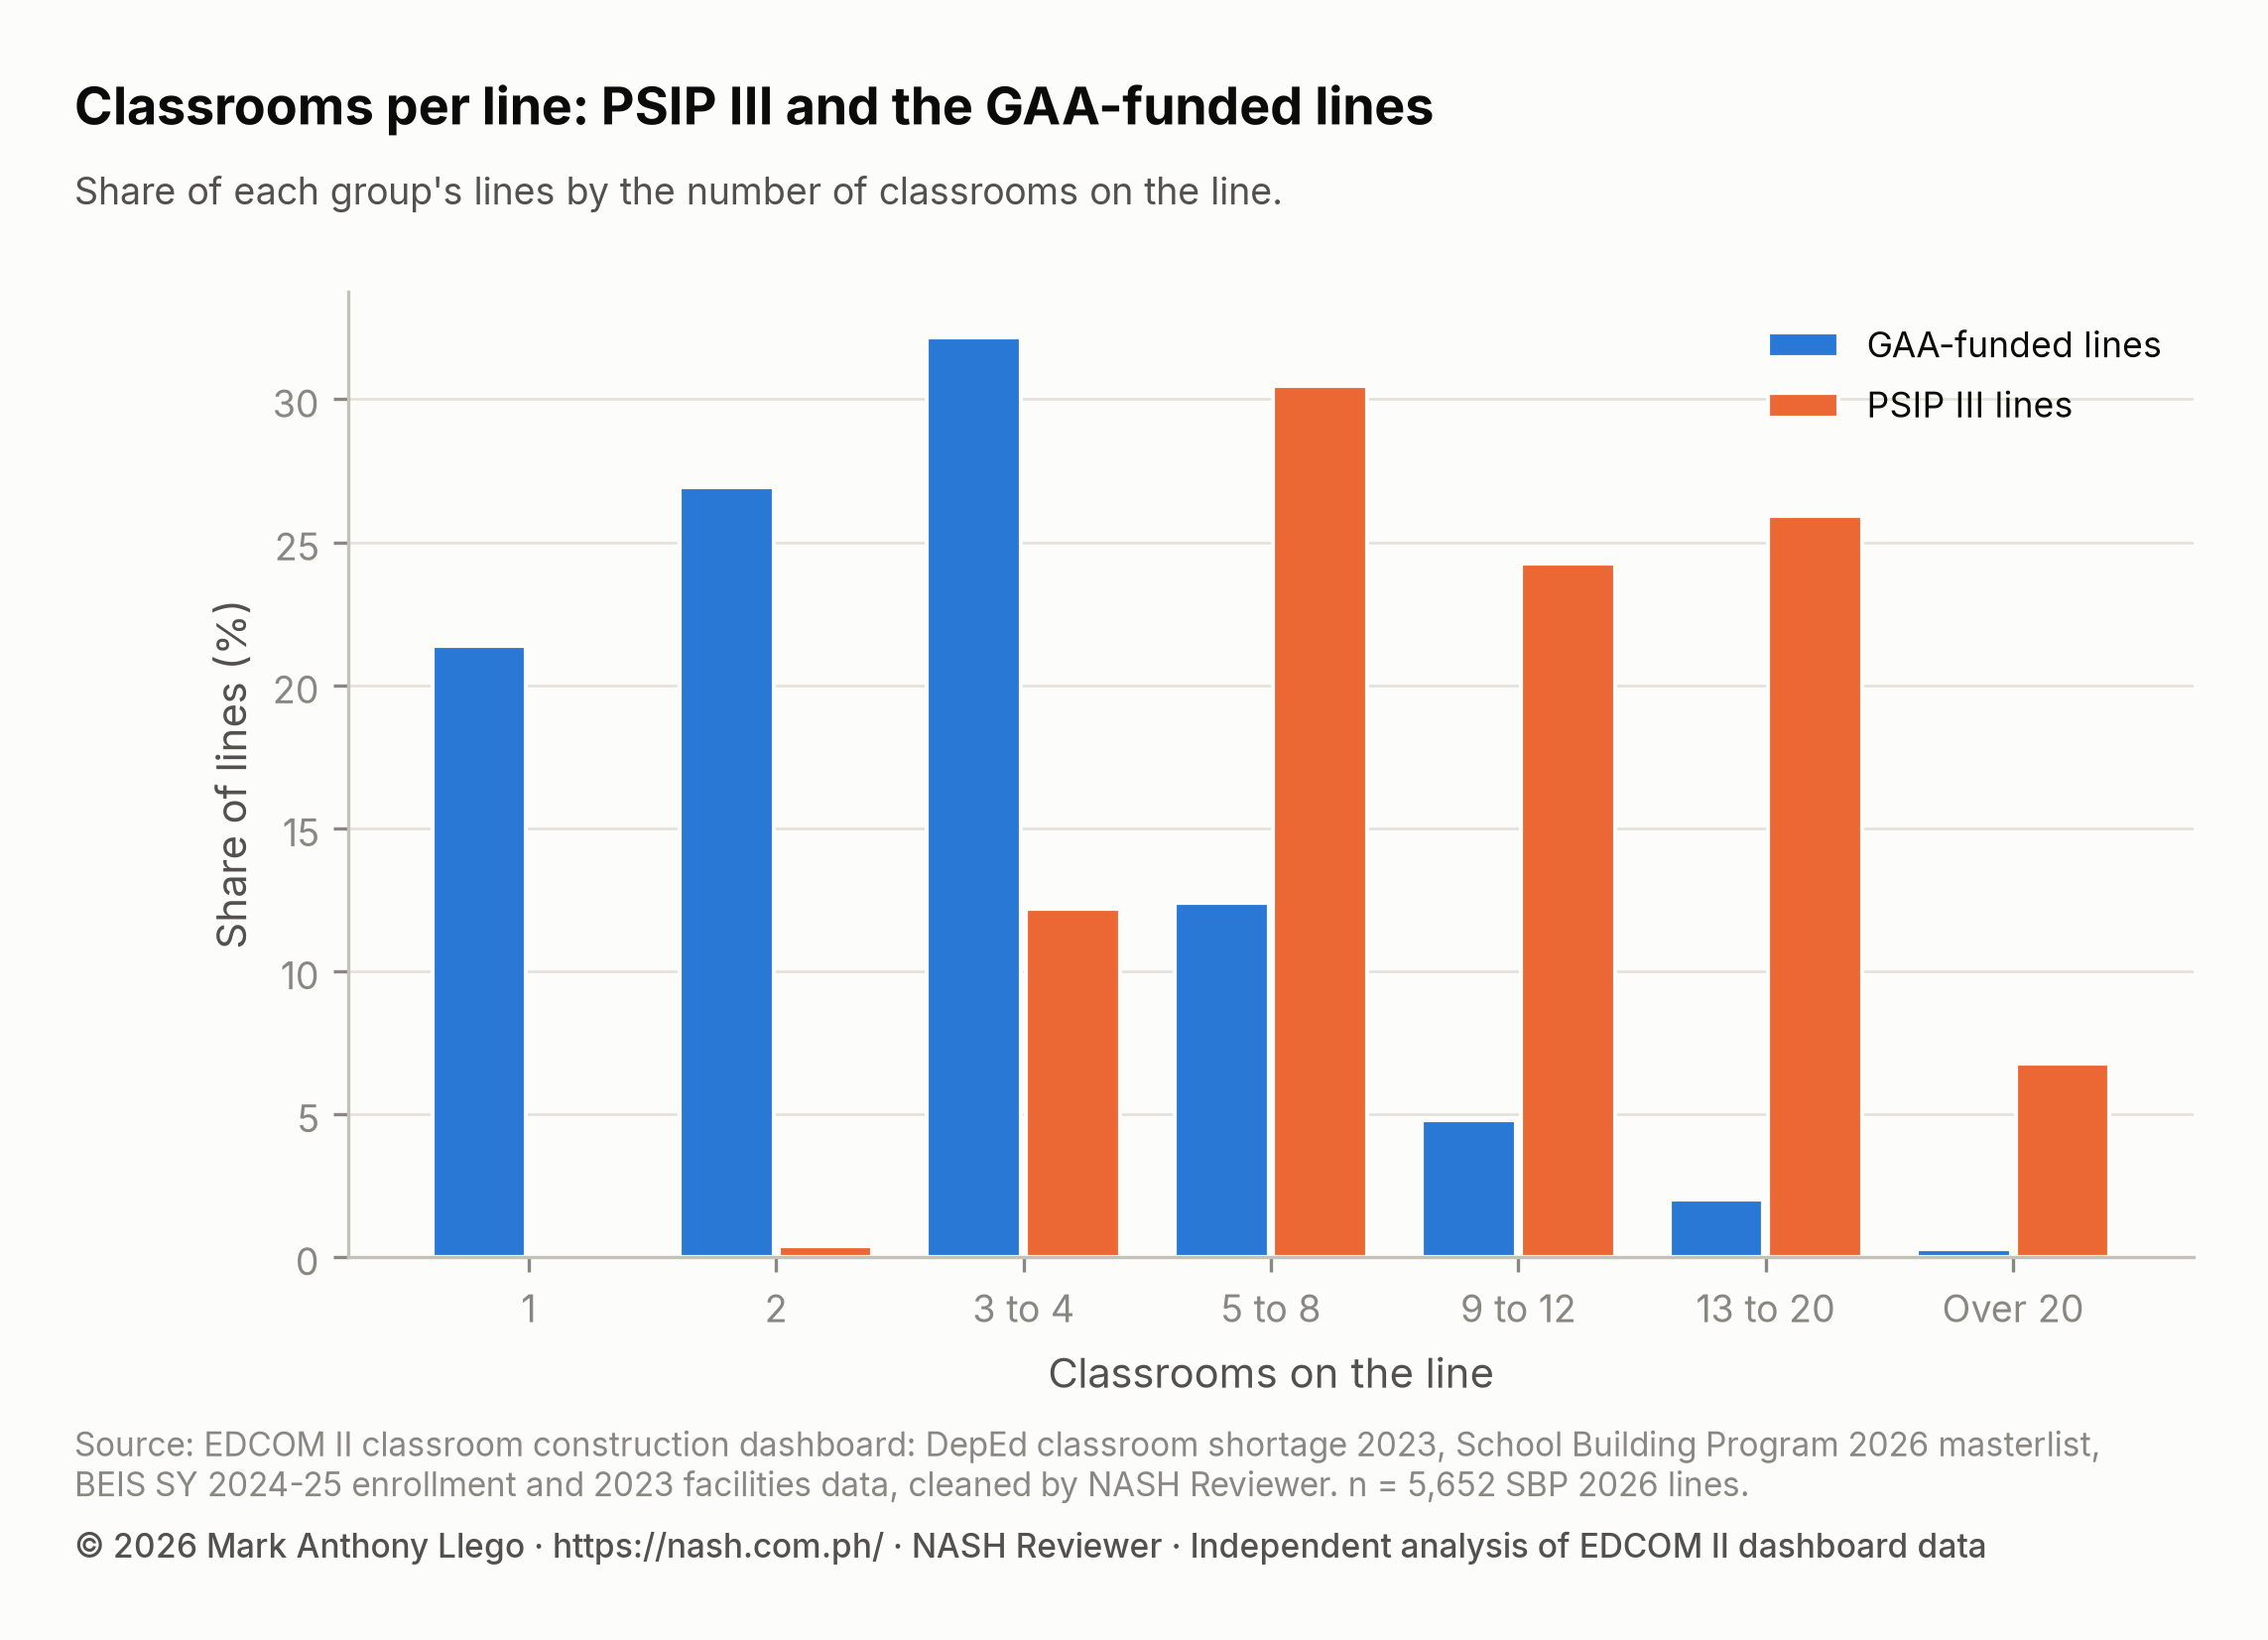
The chart compares how many classrooms each line carries. GAA-funded lines are mostly small: the tallest blue bar is at three to four classrooms, and about a fifth of lines carry a single classroom, many of them DepEd’s Learning Continuity Spaces, which the masterlist nearly always counts as one classroom each. PSIP III lines start where most GAA-funded lines stop. Almost none carry fewer than three classrooms, the largest group carries five to eight, and about a quarter each carry 9 to 12 and 13 to 20.
The median PSIP III line has 10.0 classrooms and the mean 12.8, against a median of 3.0 on GAA-funded lines; 658 PSIP III lines, 51.7%, carry 10 classrooms or more. The largest, 160 classrooms, is at F.G Calderon Integrated School in the City of Manila, the largest single line on the whole list. Because a few lines are this large, a count of lines says little about a place’s PSIP III classrooms; count classrooms instead.
The buildings are also tall. Each line names its building with a code such as 4STY20CL, a four-story building with 20 classrooms, and every PSIP III line names a building of two stories or more:
- 642 lines (50.4%) name four-story buildings;
- 387 lines (30.4%) name two-story buildings;
- 168 lines (13.2%) name three-story buildings;
- 77 lines name buildings of five stories or more, up to 13.
Across the whole list, 44.2% of lines with a known height name one-story buildings, as DepEd School Building Program 2026 in Numbers reports; no PSIP III line does. PSIP III lines have no budget yet, which is why How Much Does a Classroom Cost in the Philippines? leaves them out of its costs per classroom.
Cities and municipalities with the most PSIP III classrooms
PSIP III lines reach 322 cities and municipalities. The ten with the most PSIP III classrooms hold 28.6% of them.
| City or municipality | Lines | PSIP III classrooms | 2023 classroom shortage |
|---|---|---|---|
| City of Manila | 36 | 1,813 | 2,771 |
| Tanza, Cavite | 22 | 420 | 869 |
| Gen. Mariano Alvarez, Cavite | 20 | 408 | 328 |
| City of Trece Martires, Cavite | 20 | 356 | 622 |
| Naic, Cavite | 22 | 332 | 631 |
| City of Caloocan | 14 | 282 | 3,807 |
| Maragondon, Cavite | 17 | 272 | 64 |
| City of San Pablo, Laguna | 22 | 271 | 364 |
| City of Ilagan, Isabela | 36 | 260 | 104 |
| Silang, Cavite | 15 | 254 | 455 |
The City of Manila leads with 1,813 PSIP III classrooms on 36 lines, against a 2023 shortage of 2,771; the City of Manila deep dive reads them school by school. Six of the ten are in Cavite. In three of the ten, the PSIP III classrooms exceed the place’s 2023 shortage: Gen. Mariano Alvarez (408 against 328), Maragondon (272 against 64) and the City of Ilagan (260 against 104). In the City of Caloocan, 282 PSIP III classrooms meet a shortage of 3,807. The shortage column counts all of a place’s schools, not only those on PSIP III lines.
Maragondon’s 272 classrooms are the figure EDCOM II cited in its 20 October 2026 news release, 272 classrooms against a shortage of 64 (EDCOM II, 2026, October 20), and all of them are PSIP III. The Cavite deep dive found that 80 of them are on duplicate lines; the cleaned data reproduce EDCOM II’s figure, duplicates included. The data show where the classrooms are listed, not why they were listed there.
Which schools are on PSIP III lines
Of the 1,094 schools on PSIP III lines, 1,083 are in DepEd’s 2023 shortage table. The table sets them beside the 4,062 schools on GAA-funded lines only, with no PSIP III line, and the 42,514 schools in the shortage table that are not on the SBP 2026 list.
| Schools | Number | Median learners (SY 2024-25) | Median 2023 shortage | With a shortage | On shifts | Urban | Median learners per classroom |
|---|---|---|---|---|---|---|---|
| PSIP III | 1,083 | 941 | 6.0 | 78.2% | 28.9% | 51.9% | 40.3 |
| GAA lines only | 4,062 | 282 | 1.0 | 63.7% | 5.4% | 25.8% | 29.8 |
| Not on the list | 42,514 | 216 | 1.0 | 52.7% | 3.5% | 21.9% | 25.5 |
PSIP III schools are larger, more urban and more crowded than other schools. The median PSIP III school has 941 learners in SY 2024-25, against 282 at schools on GAA lines only and 216 at schools not on the list. Of the PSIP III schools, 51.9% are urban, against 25.8% and 21.9%; 28.9% run two or more class shifts, against 5.4% and 3.5%; and the median school has 40.3 learners per classroom, against 29.8 and 25.5. They are also more often short of rooms: 78.2% had a 2023 shortage, with a median of 6.0 classrooms, against 63.7% and a median of 1.0 at schools on GAA lines only. Counting every line, these schools receive 16,795 SBP 2026 classrooms, so some of them also have a GAA-funded line.
Is the gap in shortage between PSIP III schools and schools on GAA lines only larger than chance would give? Shortages are skewed, with many schools at zero and a few very large, so the comparison uses a rank test. The Mann–Whitney test (Mann & Whitney, 1947) ranks the schools of both groups together by their 2023 shortage and asks whether PSIP III schools sit higher in that ranking than chance alone would put them. Its effect size, the rank-biserial correlation (Kerby, 2014), pairs every PSIP III school with every school on GAA lines only and takes the share of pairs in which the PSIP III school has the larger shortage, minus the share in which it has the smaller. It runs from 1, every PSIP III school short more than every other, through 0, no tilt either way, to −1, the reverse.
Here the rank-biserial correlation is 0.36, with p < 0.001: a clear, moderate tilt toward larger shortages at PSIP III schools. The test does not hold school size equal, and larger schools tend to have larger shortages, so it shows that PSIP III lines went to schools with larger shortages, not that the shortage alone decided which schools were chosen. The masterlist does not record how schools were selected.
Do 2026 Classrooms Go Where the Shortage Is? reaches the same conclusion by another route. With schools ranked by their shortage, PSIP III has a concentration index of 0.61 (95% interval 0.53 to 0.67), the highest of the four groups of implementers (Wagstaff et al., 1991). There, 56.1% of PSIP III classrooms fall within the receiving school’s 2023 shortage, 27.6% go beyond it, and 15.7% go to schools that reported no shortage.
What this means for school heads
- Check your school’s line. Download the SBP lines file and filter it by your school ID. A PSIP III line has
modality_group“PSIP III (PPP)” and gives the classrooms, the building code with its stories, and the expected start and end. Ifduplicate_of_lineis filled, the line copies another; ask your division whether both buildings are meant. - Plan for the years before the building. In the masterlist, every PSIP III line runs from March 2027 to July 2028, and the news reports gave completion by March 2028. Your school improvement plan and AIP need a plan for shifts, makeshift rooms and crowding until the rooms are in use.
- Ask early what the project needs from the school. Half of PSIP III lines name four-story buildings. Ask the division about the site, access during construction, and where classes will be held while the building goes up.
- Follow Project Bukas. EDCOM II reported that DepEd launched the Project Bukas portal for PSIP III’s transparency. Use it, with the masterlist, to follow your school’s project.
- Cite both sources, with their dates. In a thesis, an action research paper or the SIP, give the news figures (16,459 classrooms in 1,095 schools) and the masterlist’s (16,305 classrooms at 1,094 schools) with their sources, rather than mixing them.
- If your school is not on the list, document the need. PSIP III covers eight regions. Elsewhere, and for schools left off, record enrollment, shifts, makeshift rooms and condemned rooms during Brigada Eskwela, and bring them to the division and the local school board. How to Read DepEd Data: A Guide for Aspiring School Heads shows how to read such tables.
How these numbers were made
The data are the SBP 2026 masterlist and the school table from the EDCOM II classroom construction dashboard, cleaned for this series; How the EDCOM Classroom Data Was Cleaned documents every cleaning rule. The analysis was done in Python with pandas and SciPy, and the charts drawn with Matplotlib.
- PSIP III lines. Lines with
modality_group“PSIP III (PPP)”: 1,274. Schools are distinct school IDs; classrooms are the sum of theclassroomscolumn. GAA-funded lines are all other lines: 4,378, implemented by DPWH, LGUs or DepEd, including DepEd’s Learning Continuity Spaces and Last Mile School lines. - Share of the list. PSIP III classrooms divided by all 32,419 SBP 2026 classrooms.
- Line size. The median and mean of
classroomsper line, and the share of lines in each size band, for PSIP III lines and for GAA-funded lines. - Stories. The tallest building a line names, read from codes such as 2STY4CL or from spelled-out text (
scope_max_storeys). - Dates. The expected start and end month and year of each line (
expected_start_month,expected_start_year,expected_end_month,expected_end_year). - Duplicates. Lines that exactly copy an earlier line (
duplicate_of_line), kept in every total; the count without them is given beside it. - Regions and places. Lines are placed by the school’s DepEd region and its city or municipality (PSGC code). A region’s or place’s 2023 shortage is the sum of its schools’ shortages in DepEd’s 2023 table, as published in the dashboard.
- School groups. The 47,659 schools in the 2023 shortage table are split into those with a PSIP III line, those with only GAA-funded lines, and those not on the list. Learners are SY 2024-25 enrollment; “on shifts” means two or more class shifts in SY 2024-25; learners per classroom divide SY 2024-25 learners by 2023 classrooms, the dashboard’s overall ratio.
- Mann–Whitney test. A two-sided Mann–Whitney U test on the 2023 shortage of PSIP III schools against schools on GAA lines only, with zeros included. The rank-biserial correlation is 2U/(n₁n₂) − 1, where U counts the pairs in which the PSIP III school has the larger shortage, ties counting half (Kerby, 2014).
Limits
The news reports and the masterlist give different counts of classrooms and schools and different end dates, and they come from different sources at different times, so neither should be read as a correction of the other. The masterlist marks every PSIP III line as for bidding with no budget: these are planned classrooms, not contracts or buildings, and the expected dates are plans.
The 103 duplicate lines are kept in every total, as in the dashboard; whether each is a second building or a double entry cannot be told from the masterlist. A PSIP III line whose text gives no classroom count is counted among the 1,274 lines but adds nothing to the classroom totals. The years differ by source: the shortage and classrooms are DepEd’s 2023 figures, enrollment and shifts SY 2024-25, and the allocations 2026, so a school’s need may have changed. The shortage is DepEd’s own estimate. The comparison of schools shows associations, not the reasons a school was chosen, which the masterlist does not record.
Frequently asked questions
What is PSIP III?
PSIP III is DepEd’s third Public-Private Partnership for School Infrastructure Project. Under a build-lease-and-transfer arrangement, private partners finance and build classrooms and maintain them, and DepEd pays through availability payments from its annual budget, as Inquirer.net reported on 24 February 2026. The Economy and Development Council approved it in January 2026.
How many classrooms will PSIP III build?
Philstar and Inquirer.net reported 16,459 classrooms in January 2026, and Philstar placed them in 1,095 schools; EDCOM II’s 9 February 2026 release said it “targets over 16,000 classrooms”. The SBP 2026 masterlist in the EDCOM II dashboard has 16,305 PSIP III classrooms on 1,274 lines at 1,094 schools, including 1,554 classrooms on 103 duplicate lines. Each figure should be cited with its source.
When will PSIP III classrooms be built?
The news reports in January 2026 said construction would start by March 2027 and all classrooms would be completed by March 2028. In the SBP 2026 masterlist, every PSIP III line runs from March 2027 to July 2028. These are planned dates; the masterlist marks every line as for bidding.
Why do PSIP III lines have no budget in the SBP 2026 list?
Their budget column reads “N/A (For Bidding)”. As Inquirer.net and EDCOM II reported, PSIP III is paid for through availability payments from DepEd’s annual budget over the concession period, rather than through a construction budget for each line. Philstar’s headline described the project as a “P105.7 billion PPP scheme”.
Download the data and cite this post
The cleaned EDCOM II classroom data behind this series are free to download for personal study; to reuse them, email support@nash.com.ph for written permission first. How the EDCOM Classroom Data Was Cleaned explains every table and cleaning rule. The files are at data.nash.com.ph: start with the README, then the school table (Parquet, or CSV), the School Building Program lines (CSV), the city and municipality table (CSV), and every table for Stata and SPSS. Every masterlist figure in this post can be computed from the School Building Program lines, using modality_group, classrooms, scope_max_storeys, expected_start_year, expected_end_year, duplicate_of_line and deped_region, and the comparison of schools from the school table, using sbp_classrooms_for_bidding, shortage_total, enrol_total, multi_shift, urban_rural and learners_per_classroom_all.
Every file, with its rows, columns and checksum, is listed on the EDCOM II classroom data page. To cite the data: Llego, M. A. (2026). EDCOM II classroom construction dashboard data, cleaned, version 1.1. NASH Reviewer. https://nash.com.ph/edcom-classroom-data
To cite this post: Llego, M. A. (2026, October 28). What is PSIP III? DepEd’s PPP classrooms explained. NASH Reviewer Blog. https://nash.com.ph/blog/psip-iii-classrooms-explained
References
- Cariaso, B. (2026, January 14). P105.7 billion PPP scheme OK’d to ease classroom shortage. Philstar. https://www.philstar.com/headlines/2026/01/14/2500829/p1057-billion-ppp-scheme-okd-ease-classroom-shortage
- Escosio, J. (2026, January 13). More classrooms for students as DepEd rolls out public-private partnership. Inquirer.net. https://newsinfo.inquirer.net/2167493/more-classrooms-for-students-as-deped-rolls-out-public-private-partnership
- Escosio, J. (2026, February 24). Angara joins Asean forum, backs PPPs to address classroom gap. Inquirer.net. https://newsinfo.inquirer.net/2187040/angara-joins-asean-forum-backs-ppps-to-address-classroom-gap
- Kerby, D. S. (2014). The simple difference formula: An approach to teaching nonparametric correlation. Comprehensive Psychology, 3.
- Llego, M. A. (2026). EDCOM II classroom construction dashboard data, cleaned, version 1.1 [Data set]. NASH Reviewer. https://nash.com.ph/edcom-classroom-data
- Mann, H. B., & Whitney, D. R. (1947). On a test of whether one of two random variables is stochastically larger than the other. Annals of Mathematical Statistics, 18(1), 50–60.
- Second Congressional Commission on Education (EDCOM II). (2026). National Education Plan 2026–2035 (Year Three report).
- Second Congressional Commission on Education (EDCOM II). (2026, February 9). EDCOM II: 51,000 classrooms likely to be condemned by 2028 [News release]. https://edcom2.gov.ph/edcom-ii-51000-classrooms-likely-to-be-condemned-by-2028/
- Second Congressional Commission on Education (EDCOM II). (2026, October 20). Put classrooms where they’re needed most, EDCOM 2 tells DepEd [News release]. https://edcom2.gov.ph/put-classrooms-where-theyre-needed-most-edcom-2-tells-deped/
- Wagstaff, A., Paci, P., & van Doorslaer, E. (1991). On the measurement of inequalities in health. Social Science & Medicine, 33(5), 545–557.
More in this series
- How the EDCOM Classroom Data Was Cleaned
- Philippine Classroom Shortage 2023: Where the Gap Is
- DepEd School Building Program 2026 in Numbers
- Do 2026 Classrooms Go Where the Shortage Is?
- Classroom Allocation by LGU Income Class, 2026
- Class Shifts and Crowded Classrooms in DepEd Schools
- Last Mile Schools: Classroom Need and 2026 Allocation
- Regional reports: NCR, CAR, Region I, Region II, Region III, Region IV-A, MIMAROPA, Region V, Region VI, NIR, Region VII, Region VIII, Region IX, Region X, Region XI, Region XII, Caraga, BARMM
- Rankings and deep dives: Congressional districts, Top 20 cities and municipalities, Rizal, Quezon City, City of Manila, Tawi-Tawi, Cavite, Cost of a classroom
- Explainers: PSIP III, Senior high shortage, Junior high shortage, Excess classrooms, Learning Continuity Spaces, How learners reach school
- For teachers and school heads: Action research and thesis topics
- Related: EDCOM II Final Report: Guide for Aspiring School Heads, National Education Plan 2026-2035: Guide for School Heads, DepEd School Improvement Plan (SIP): Steps, AIP and SRC, How to Read DepEd Data: A Guide for Aspiring School Heads, PPSSH Domain 2: Managing School Operations With DepEd Data
Analysis and charts by Mark Anthony Llego for NASH Reviewer. Data: EDCOM II classroom construction dashboard and Department of Education data. NASH Reviewer is not affiliated with EDCOM II or DepEd. Charts may be reused only with written permission from support@nash.com.ph.