From the EDCOM II early-childhood dashboard
EDCOM II CRLA data: reading results for SY 2025-26
This report covers the data that EDCOM II, the Second Congressional Commission on Education, publishes in its early childhood care and development (ECCD) dashboard: the end-of-year results of the Comprehensive Rapid Literacy Assessment (CRLA) for 5,127,670 Grade 1–3 learners in 38,679 public schools in SY 2025-26, as of 10 May 2026, with the dashboard’s tables on stunting, day care centers and literacy programs. NASH Reviewer extracted the dashboard, cleaned it, linked 38,678 schools to their barangay, and analyzed the results with methods that allow for school size and chance. Every chart comes with a table of its numbers.
The cleaned data behind every chart is free to download in CSV and Parquet, with the raw extract and a cleaning log, for personal study. Download the EDCOM data.
- Grade 1–3 learners with an end-of-year CRLA result in SY 2025-26, in 38,679 public schools
- 5,127,670
- Share who are struggling readers (Low or High Emerging): 511,753 learners
- 9.98%
- Gap between the regions with the highest and lowest shares: BARMM (23.4%) and NCR (5.3%)
- 4.4×
- Share of the variation between schools that lies between schools in the same division
- 65%
What the EDCOM II dashboard data cover
The dashboard holds 6 tables: CRLA results by school, school locations, a barangay reference, barangays without a child development center, stunting among children aged 0–2, and program records. They were recovered from the dashboard’s public workbook, 135,406 rows in 27 worksheets, and kept unchanged before any cleaning.
| Dashboard table | Rows as published | Rows after cleaning | Source | Used for |
|---|---|---|---|---|
| Barangay matching | 42,025 | 42,010 | PSGC barangay reference with match keys | The PSGC barangay reference for the links |
| Barangays without a CDC | 4,604 | 4,604 | DILG CBMS, as of 17 Sep 2025 | Day care center gaps by municipality |
| Programs | 100 | 100 | Intervention program records | Literacy, nutrition and childcare programs compared with need |
| Stunting 2025 | 1,743 | 1,742 | DOH/NNC OPT Plus 2025, as of 2 Mar 2026 | Stunting among children aged 0–2 by municipality |
| School locations | 48,255 | 48,254 | School coordinates and geography | Linking schools to barangays and municipalities |
| Reading assessments | 38,679 | 38,679 | DepEd CRLA, end of SY 2025-26, as of 10 May 2026 | CRLA levels by school, grade and language |
Each learner is counted once: Grade 1 by the Mother Tongue result, Grade 2 by Filipino and Grade 3 by English. A struggling reader is a learner at Low Emerging or High Emerging, the two lowest of the CRLA’s five levels. The CRLA covers almost every public-school learner in these grades, so national and regional shares are population values and carry no sampling intervals.
The data follow the 18 regions of the Philippine Standard Geographic Code (PSGC), with Sulu in Region IX and the Negros Island Region (NIR) as its own region. School inputs such as teachers, classrooms and internet come from DepEd’s SY 2023-24 school files, two school years earlier, joined by school ID.
Of the 38,679 schools, 38,678 (99.997%) are linked to a barangay and its municipality. The dashboard’s own names linked most of them; 299 links were added from validated PSGC codes, research and normalized names. One school stays unlinked because its barangay has no PSGC code yet.
Mark Anthony Llego extracted, cleaned and analyzed the data and drew the charts for NASH Reviewer (https://nash.com.ph/). The report was published on 28 October 2026 from the dashboard as of 10 May 2026. The cleaning and every figure can be re-run from the raw extract.
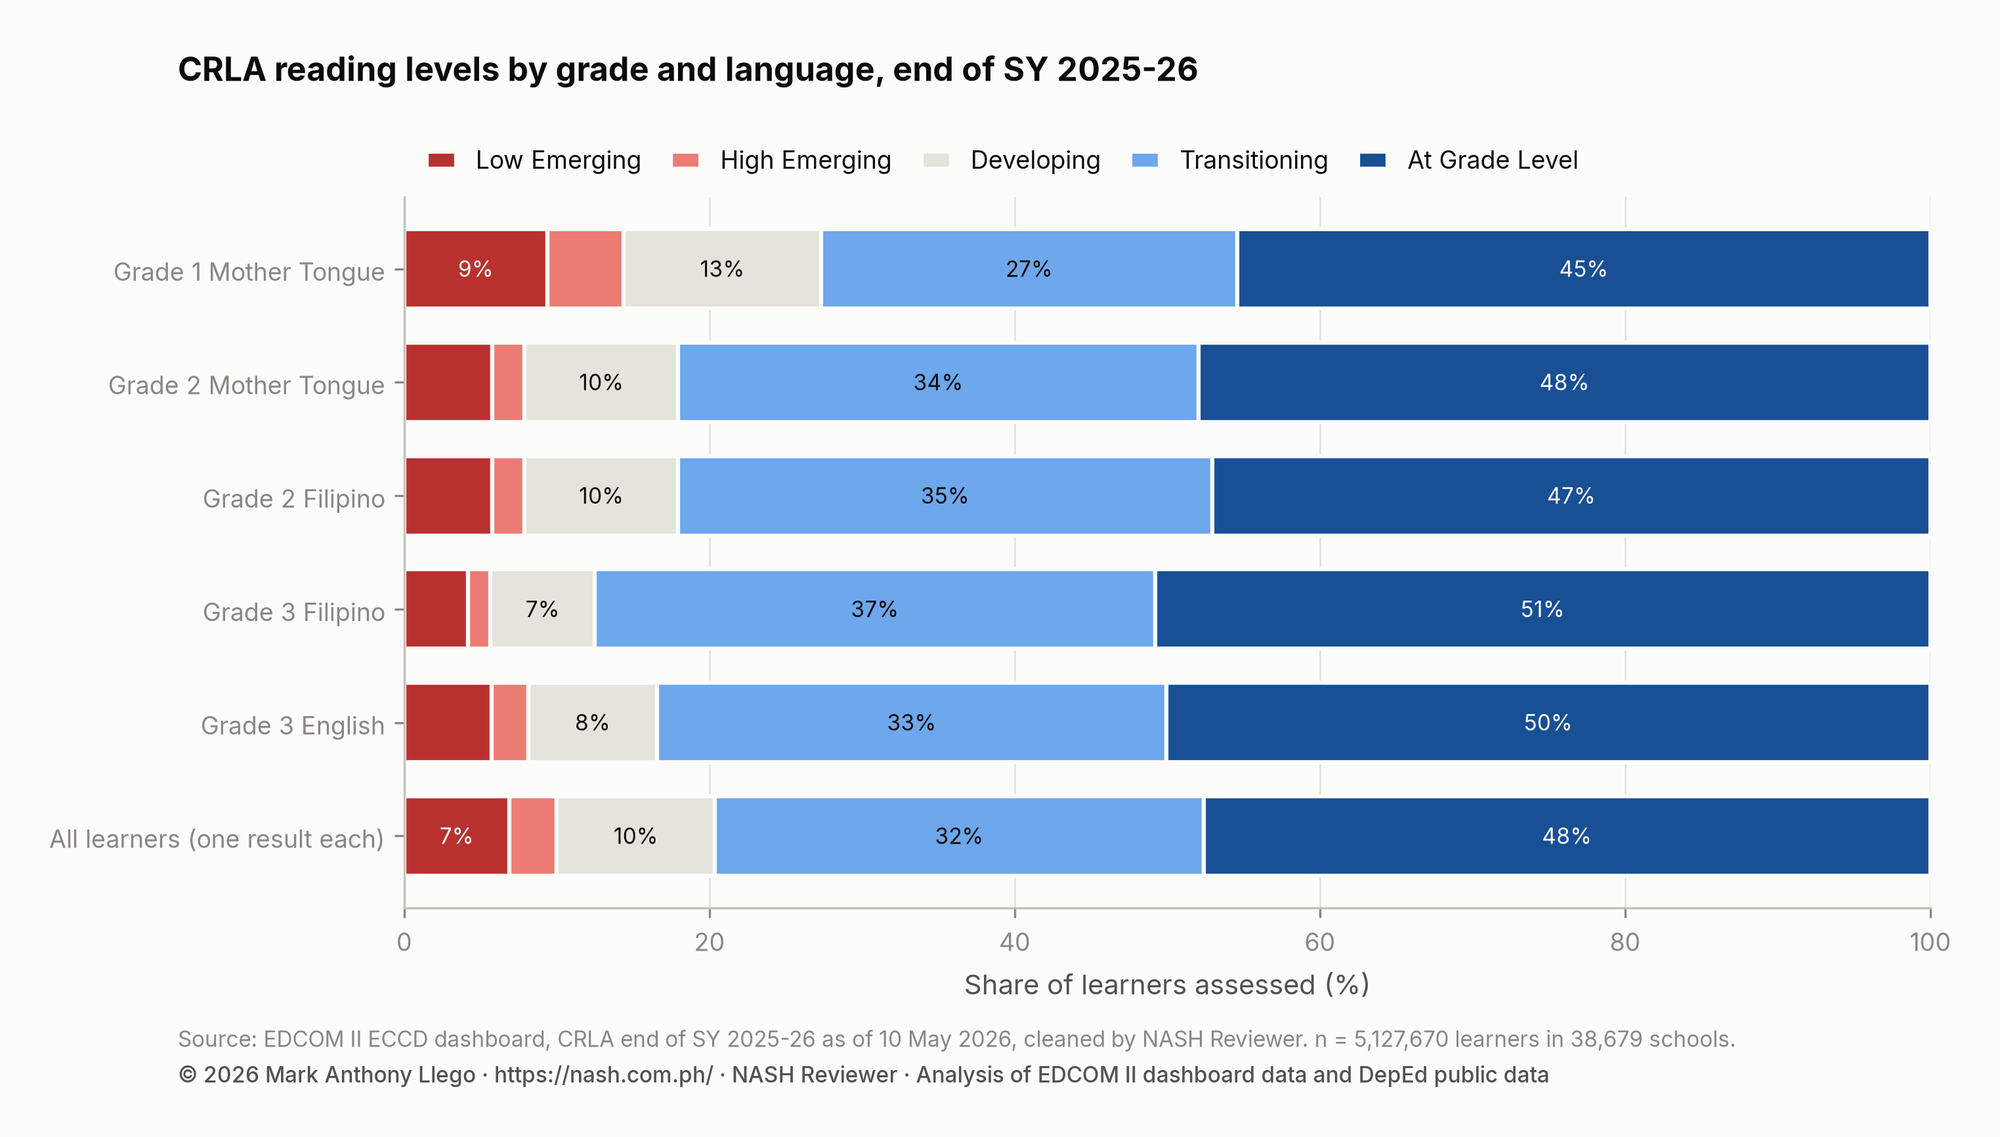
CRLA reading levels by grade and language, SY 2025-26
At the end of SY 2025-26, 47.6% of learners read at grade level and 9.98% are struggling readers: 511,753 children, about one in 10.
Show the data as a table
| Grade and language | Learners assessed | Low Emerging | High Emerging | Developing | Transitioning | At Grade Level | Struggling (Low + High Emerging) |
|---|---|---|---|---|---|---|---|
| Grade 1 Mother Tongue | 1,594,608 | 9.4% | 5.0% | 13.0% | 27.3% | 45.4% | 14.4% |
| Grade 2 Mother Tongue | 1,634,270 | 5.8% | 2.1% | 10.0% | 34.1% | 47.9% | 7.9% |
| Grade 2 Filipino | 1,693,777 | 5.8% | 2.1% | 10.1% | 35.0% | 47.1% | 7.9% |
| Grade 3 Filipino | 1,826,546 | 4.2% | 1.5% | 6.8% | 36.7% | 50.8% | 5.6% |
| Grade 3 English | 1,839,285 | 5.7% | 2.4% | 8.5% | 33.4% | 50.1% | 8.1% |
| All learners (one result each) | 5,127,670 | 6.9% | 3.1% | 10.4% | 32.0% | 47.6% | 10.0% |
Grade 1 Mother Tongue has the largest share of struggling readers, 14.4%, and the smallest share at grade level, 45.4%. By Grade 3, 5.6% struggle in Filipino and 8.1% in English.
Most learners who are not yet at grade level are Developing or Transitioning, the two middle levels: they read, but below the level expected for their grade.
These are end-of-year results. DepEd’s selected-school CRLA file is a start-of-year round, so its shares at grade level are far lower; the section on the start and end of the school year compares the two in the 6,061 schools found in both.
Struggling readers by region
Shares of struggling readers range from NCR (5.3%) to BARMM (23.4%), a gap of 4.4 to one. Of the 18 regions, 9 are above the national share of 10.0%.
Show the data as a table
| Region | Schools | Learners assessed | Struggling readers | Share struggling | Share of the country's struggling readers | At Grade Level |
|---|---|---|---|---|---|---|
| NCR | 520 | 469,125 | 24,884 | 5.3% | 4.9% | 55.5% |
| CAR | 1,500 | 75,844 | 4,112 | 5.4% | 0.8% | 55.8% |
| Region IV-A | 2,754 | 724,571 | 48,777 | 6.7% | 9.5% | 50.0% |
| Region VIII | 3,656 | 245,652 | 17,765 | 7.2% | 3.5% | 55.6% |
| Region III | 3,024 | 520,994 | 41,175 | 7.9% | 8.0% | 54.7% |
| Region VI | 2,433 | 199,208 | 16,243 | 8.2% | 3.2% | 53.4% |
| Region II | 2,212 | 164,618 | 14,237 | 8.6% | 2.8% | 48.9% |
| Region X | 2,176 | 273,425 | 25,563 | 9.3% | 5.0% | 49.3% |
| Region I | 2,409 | 218,318 | 20,669 | 9.5% | 4.0% | 46.5% |
| Caraga | 1,706 | 159,091 | 16,044 | 10.1% | 3.1% | 48.3% |
| NIR | 1,742 | 254,077 | 26,444 | 10.4% | 5.2% | 44.4% |
| Region VII | 2,189 | 320,467 | 33,390 | 10.4% | 6.5% | 44.6% |
| MIMAROPA | 1,924 | 186,639 | 21,230 | 11.4% | 4.1% | 44.4% |
| Region XI | 1,749 | 274,481 | 32,147 | 11.7% | 6.3% | 42.1% |
| Region V | 3,162 | 346,762 | 41,812 | 12.1% | 8.2% | 41.0% |
| Region IX | 2,310 | 250,036 | 36,716 | 14.7% | 7.2% | 43.3% |
| Region XII | 1,744 | 236,985 | 41,972 | 17.7% | 8.2% | 37.2% |
| BARMM | 1,469 | 207,377 | 48,573 | 23.4% | 9.5% | 30.7% |
BARMM has the highest share, followed by Region XII and Region IX. NCR and CAR have the lowest, about half the national share.
By count, the three regions with the most struggling readers (Region IV-A, BARMM, Region XII) hold 27.2% of the country’s total. Region IV-A is among them because it is the largest region, although its share is among the lowest.
A region’s share averages very different divisions and schools, so a regional figure says little about any one school. The regional reports on the blog break each region down by division, language and municipality.
Division results with 95% intervals
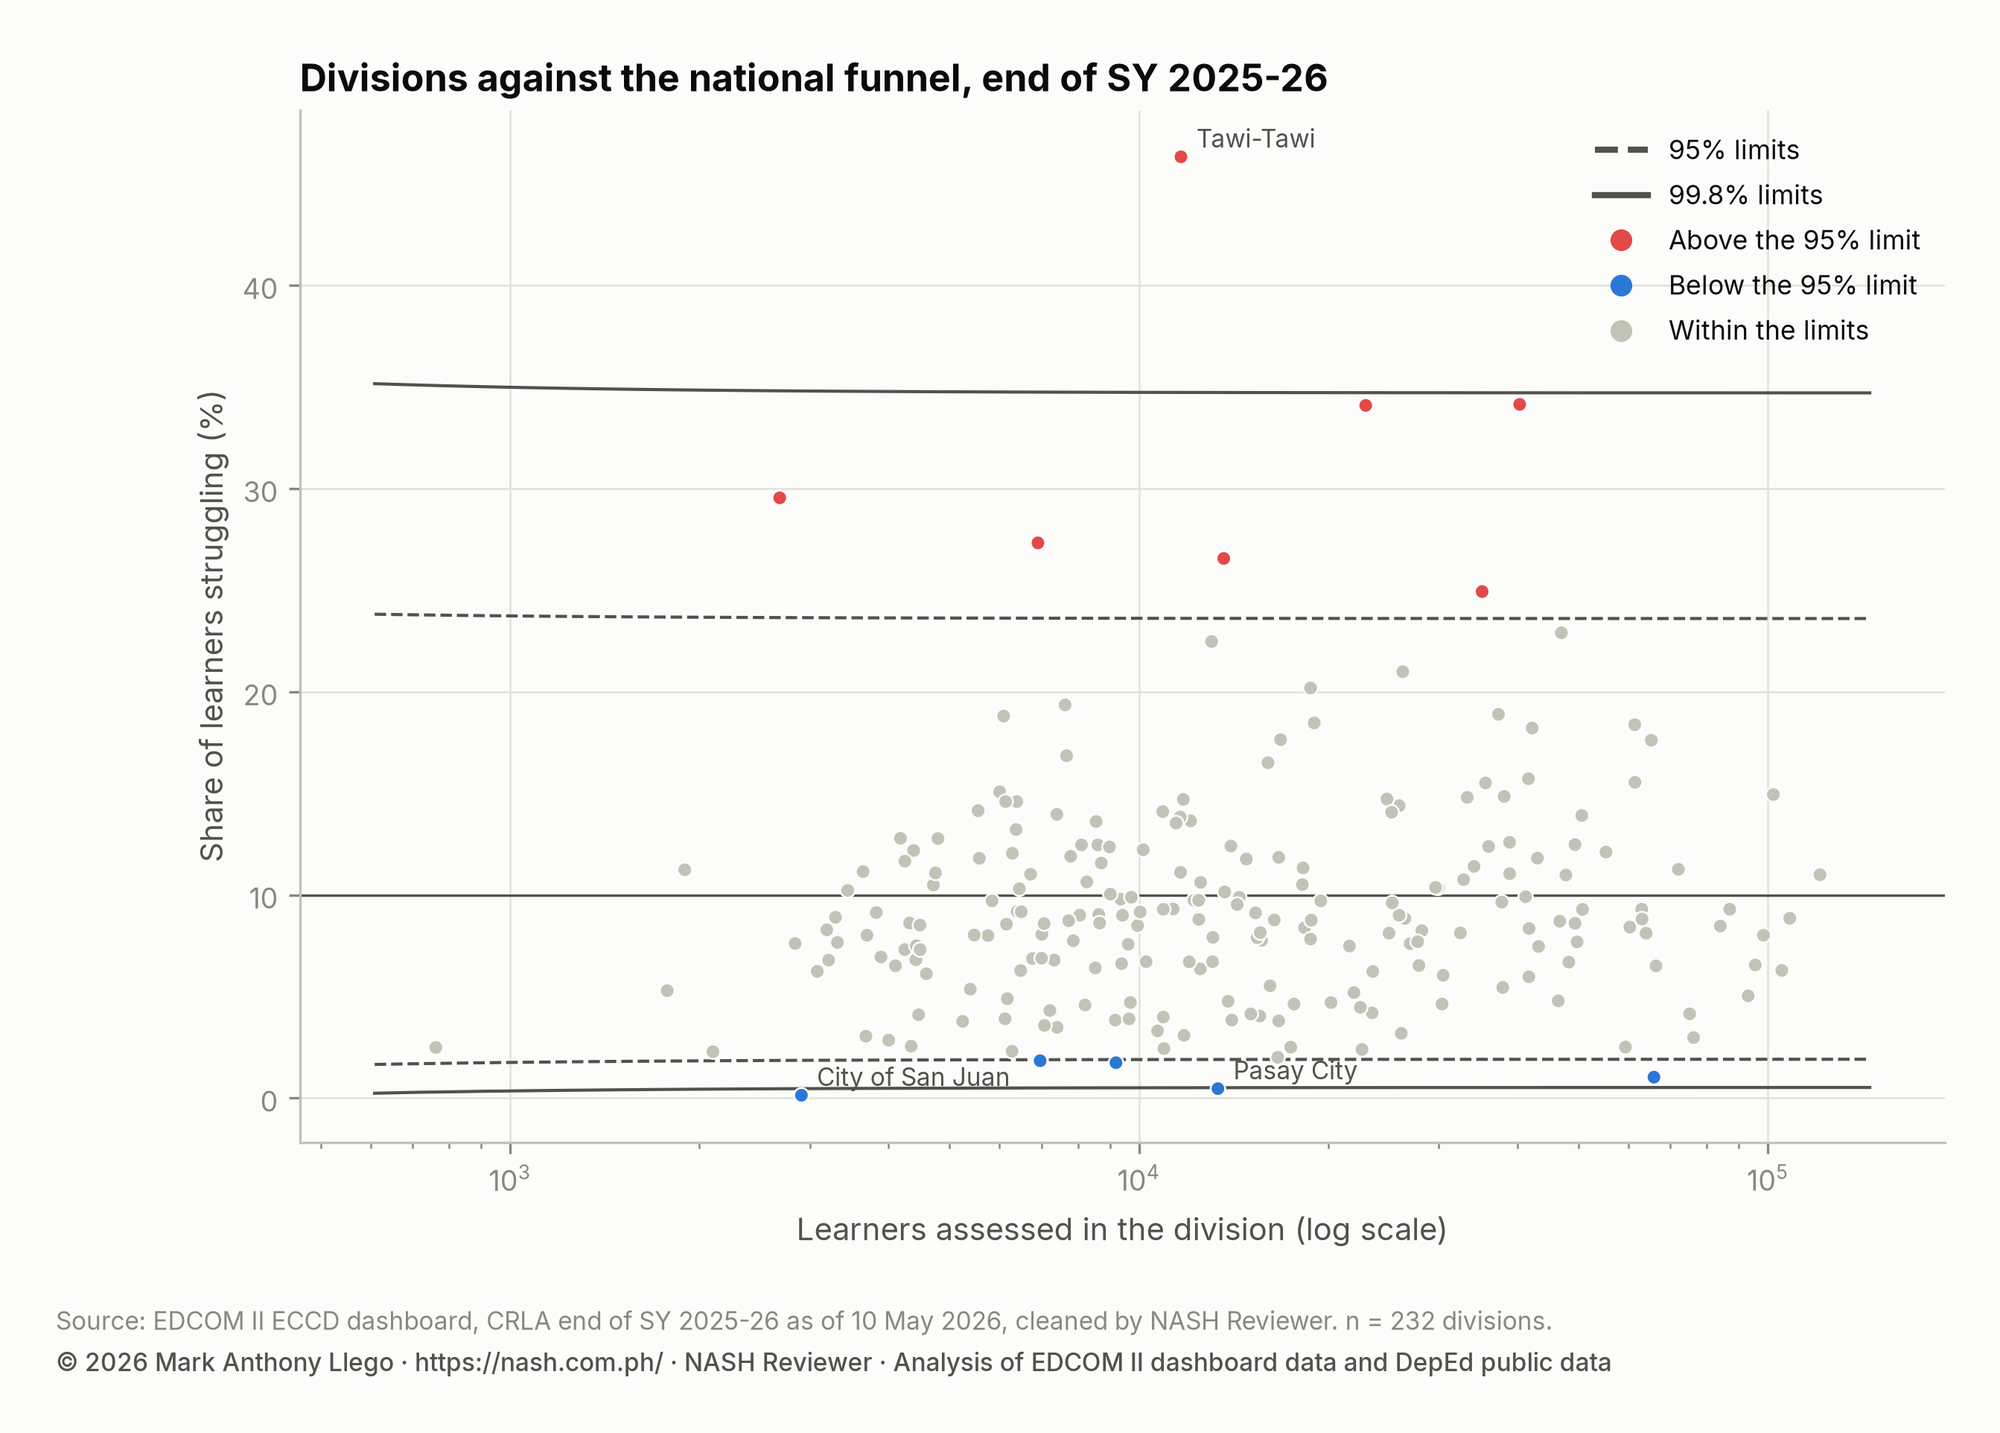
Division shares of struggling readers range from 0.1% in City of San Juan (NCR) to 46.3% in Tawi-Tawi (BARMM).
Show the data as a table
| Division | Region | Learners | Share struggling | Estimate (95% interval) | Rank of 232 (95% interval) | Funnel | Flagged at FDR 5% |
|---|---|---|---|---|---|---|---|
| Tawi-Tawi | BARMM | 11,664 | 46.3% | 46.2% (45.3%–47.2%) | 232 (232–232) | above 99.8% limit | yes |
| Maguindanao del Norte | BARMM | 40,320 | 34.1% | 34.1% (33.7%–34.6%) | 231 (230–231) | above 95% limit | no |
| Sulu | Region IX | 22,946 | 34.1% | 34.1% (33.5%–34.7%) | 230 (230–231) | above 95% limit | no |
| Special Geographic Area | BARMM | 2,684 | 29.5% | 29.4% (27.6%–31.1%) | 229 (229–229) | above 95% limit | no |
| Lamitan City | BARMM | 6,909 | 27.3% | 27.3% (26.2%–28.3%) | 228 (227–228) | above 95% limit | no |
| Cotabato City | BARMM | 13,644 | 26.6% | 26.5% (25.8%–27.3%) | 227 (227–228) | above 95% limit | no |
| Sarangani | Region XII | 35,143 | 24.9% | 24.9% (24.5%–25.4%) | 226 (226–226) | above 95% limit | no |
| Mt. Province | CAR | 6,965 | 1.8% | 1.9% (1.6%–2.2%) | 5 (4–7) | below 95% limit | no |
| Sto. Tomas City | Region IV-A | 9,194 | 1.7% | 1.8% (1.5%–2.0%) | 4 (4–6) | below 95% limit | no |
| Caloocan City | NCR | 65,928 | 1.0% | 1.0% (1.0%–1.1%) | 3 (3–3) | below 95% limit | no |
| Pasay City | NCR | 13,354 | 0.5% | 0.5% (0.4%–0.6%) | 2 (2–2) | below 99.8% limit | no |
| City of San Juan | NCR | 2,906 | 0.1% | 0.2% (0.1%–0.4%) | 1 (1–1) | below 99.8% limit | yes |
Of the 232 divisions, 12 lie outside the funnel’s 95% limits, listed in the table, and 2 remain flagged after the Benjamini–Hochberg adjustment at a 5% false discovery rate. The division estimates file has all 232.
Each division also has a rank with a 95% interval. The median interval spans 14 places, so most divisions cannot be placed in a precise league table.
Division estimates use empirical Bayes: each division’s share is pulled toward its region’s, more for small divisions. Every division assessed several hundred learners or more, so the pull is small.
School, division or region: where the variation sits
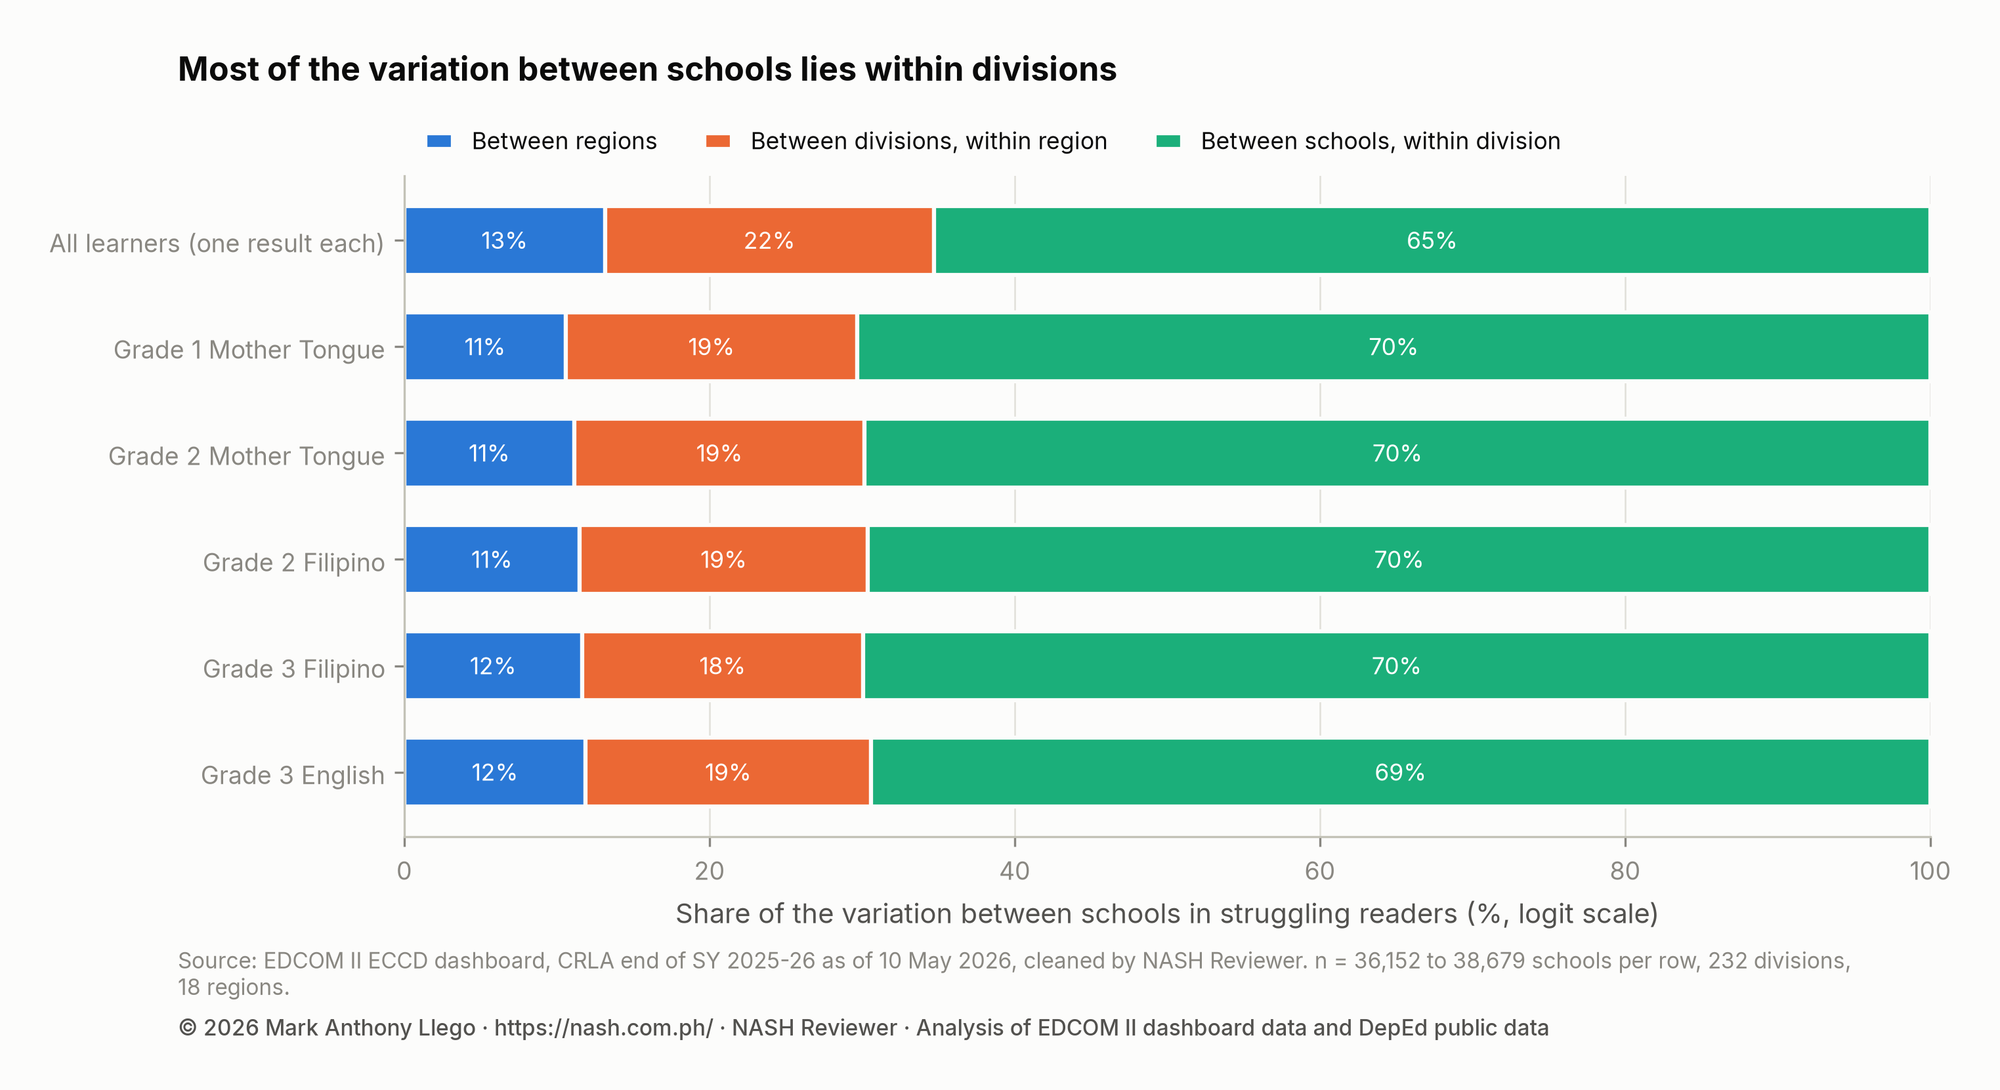
Of the variation between schools in the share of struggling readers, 65% lies between schools in the same division, 22% between divisions in a region and 13% between regions.
Show the data as a table
| Grade and language | Schools | Region: share of between-school variation (95% interval) | Division: share of between-school variation (95% interval) | School: share of between-school variation (95% interval) | Between-school share of all variation (latent scale) |
|---|---|---|---|---|---|
| All learners (one result each) | 38,679 | 13% (6%–25%) | 22% (17%–26%) | 65% (57%–71%) | 41% |
| Grade 1 Mother Tongue | 38,234 | 11% (5%–21%) | 19% (16%–23%) | 70% (62%–76%) | 45% |
| Grade 2 Mother Tongue | 36,152 | 11% (5%–21%) | 19% (15%–23%) | 70% (62%–75%) | 46% |
| Grade 2 Filipino | 37,227 | 11% (5%–23%) | 19% (15%–23%) | 70% (61%–75%) | 46% |
| Grade 3 Filipino | 37,589 | 12% (5%–22%) | 18% (15%–22%) | 70% (61%–76%) | 46% |
| Grade 3 English | 37,860 | 12% (5%–22%) | 19% (15%–22%) | 69% (61%–75%) | 47% |
Two schools picked at random from the same division differ in the odds that a learner is struggling by a median factor of 3.19, against 1.95 for two divisions in a region and 1.68 for two regions.
The division and region intervals overlap (17% to 26% and 6% to 25%), so the data cannot firmly rank those two levels; the probability that divisions vary more than regions is 0.90.
A division’s average is therefore a poor guide to its schools. Support has to be aimed at schools, using their estimates and intervals, rather than spread evenly across a division.
The split is the same in every grade and language. It describes where differences sit, not what causes them: the school level includes learners’ backgrounds and how the screen was given, as well as teaching.
Where struggling readers are concentrated
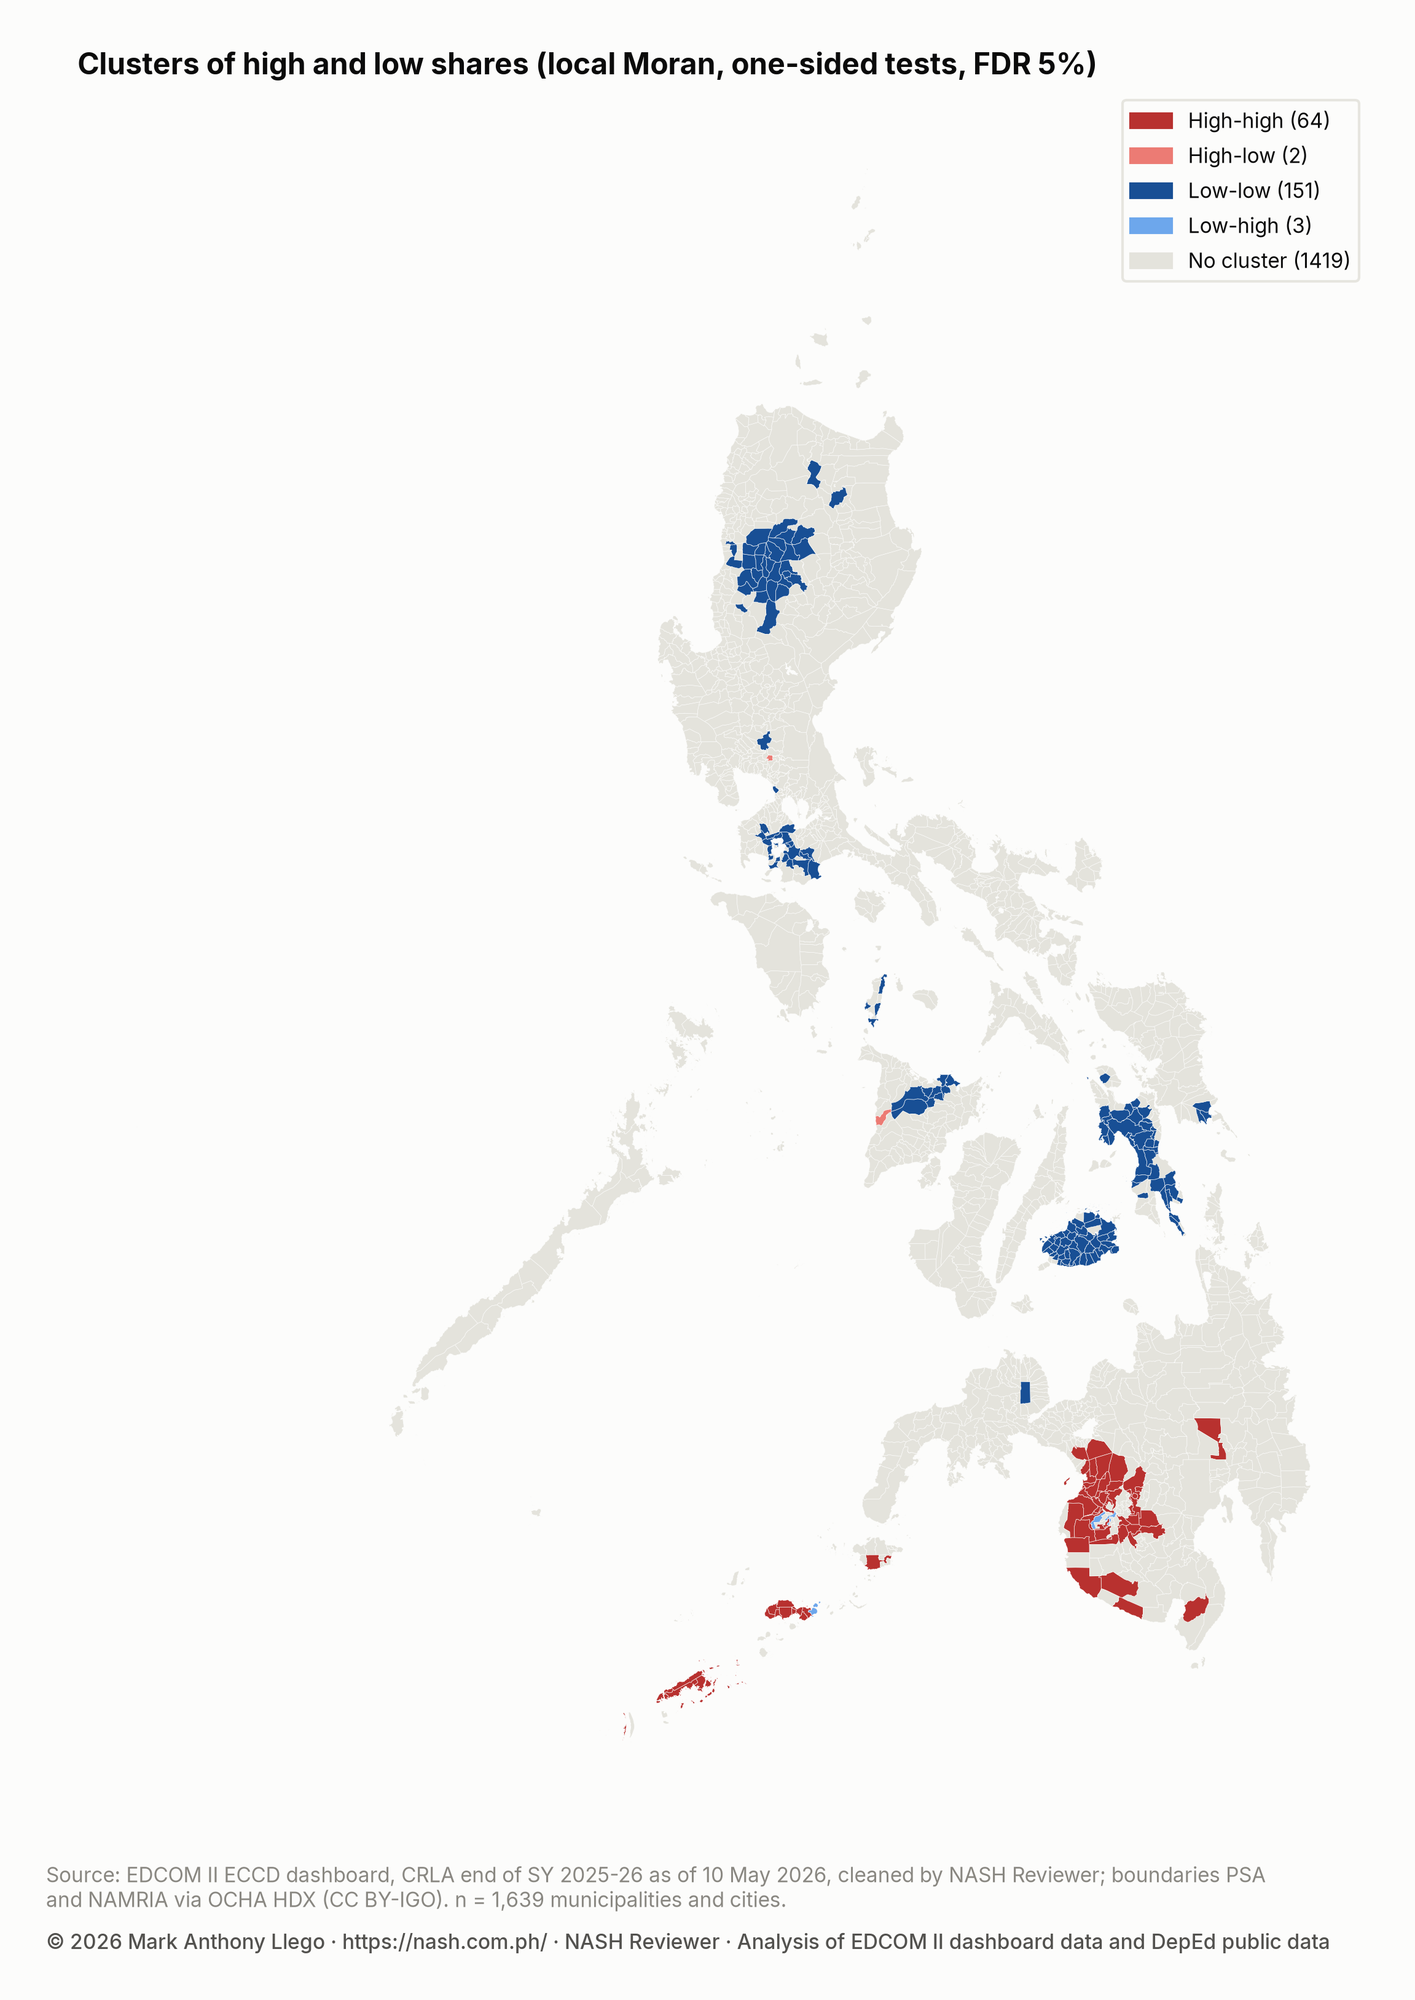
Struggling readers cluster in place. Among 1,639 municipalities and cities, 64 form high-high clusters, places with high shares surrounded by places with high shares. They hold 9.6% of the country’s struggling readers but only 3.5% of its learners.
Show the data as a table
| Region | Municipalities and cities | High-high | Low-low | High-low | Low-high | Gi* hot spots |
|---|---|---|---|---|---|---|
| BARMM | 107 | 38 | 0 | 0 | 2 | 40 |
| Region XII | 49 | 15 | 0 | 0 | 0 | 15 |
| Region IX | 89 | 10 | 0 | 0 | 1 | 10 |
| Region XI | 49 | 1 | 0 | 0 | 0 | 1 |
| CAR | 77 | 0 | 26 | 0 | 0 | 0 |
| MIMAROPA | 73 | 0 | 4 | 0 | 0 | 0 |
| Region I | 125 | 0 | 5 | 0 | 0 | 0 |
| Region II | 93 | 0 | 3 | 0 | 0 | 0 |
| NIR | 63 | 0 | 0 | 0 | 0 | 0 |
| NCR | 17 | 0 | 1 | 0 | 0 | 0 |
| Region IV-A | 142 | 0 | 20 | 0 | 0 | 0 |
| Region III | 130 | 0 | 1 | 1 | 0 | 0 |
| Region V | 114 | 0 | 0 | 0 | 0 | 0 |
| Region VI | 101 | 0 | 9 | 1 | 0 | 0 |
| Region VIII | 143 | 0 | 40 | 0 | 0 | 0 |
| Region VII | 101 | 0 | 41 | 0 | 0 | 0 |
| Region X | 93 | 0 | 1 | 0 | 0 | 0 |
| Caraga | 73 | 0 | 0 | 0 | 0 | 0 |
The high-high clusters are in BARMM (38), Region XII (15), Region IX (10), Region XI (1). Their pooled share of struggling readers is 27.3%, against 4.3% in the 151 low-low clusters.
Global Moran’s I is 0.65: neighboring municipalities have similar shares far more often than chance would produce.
Need is concentrated among schools too. The tenth of schools with the most struggling readers hold 52.7% of them, with 33.7% of the learners assessed, and 3,475 schools (9.0%) hold half of all struggling readers.
These results describe places, not children. A high-high municipality also has many learners who read well, and a low-low one has learners who struggle.
School inputs, school heads and reading
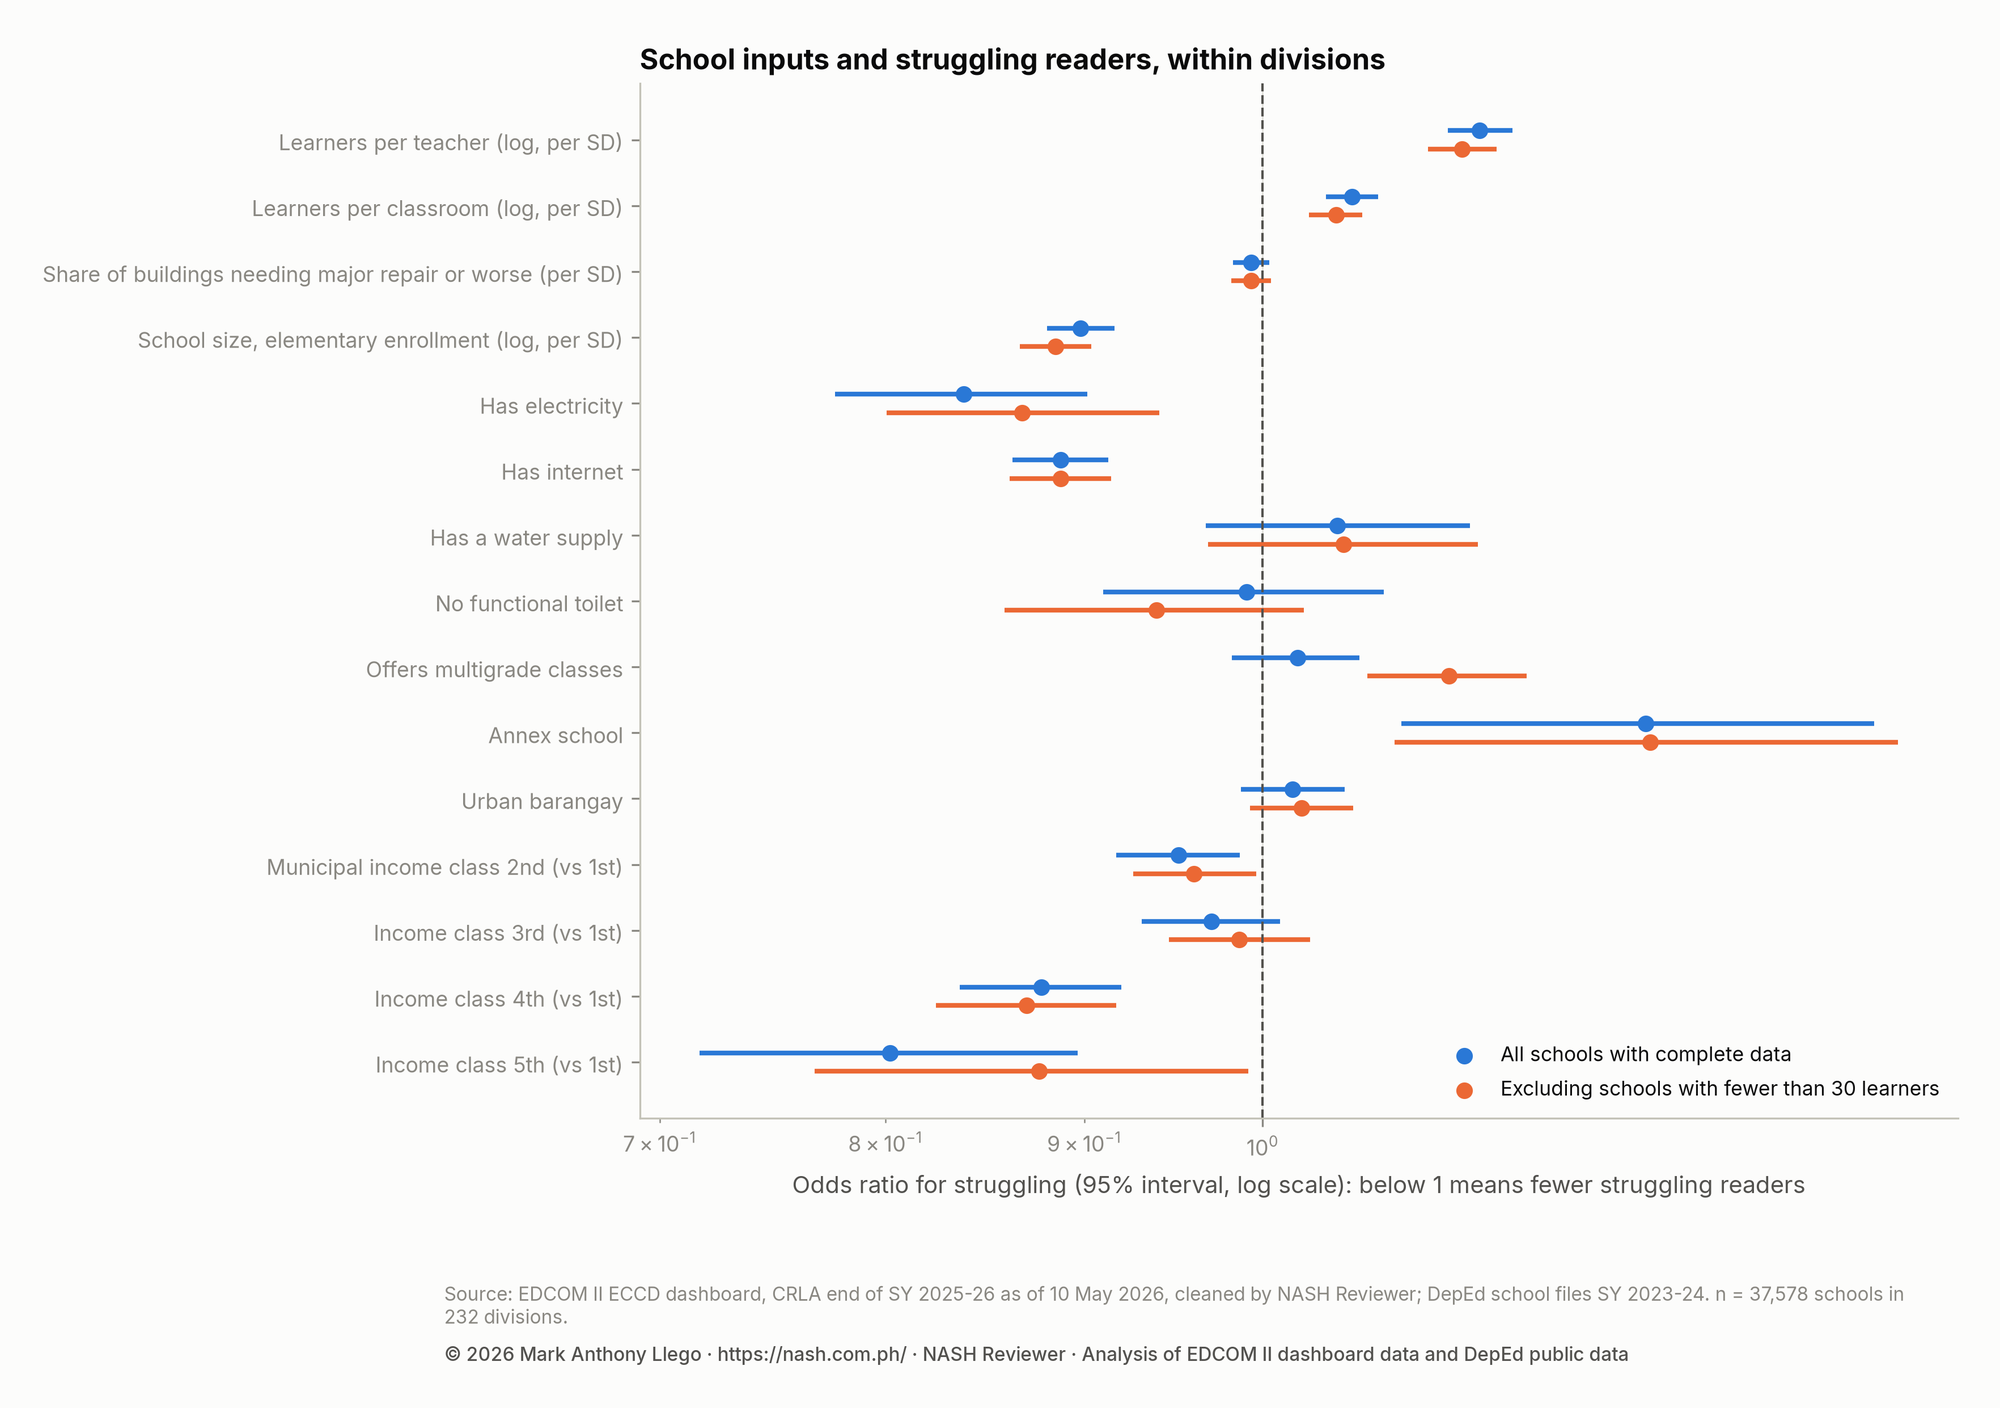
Within the same division, schools with internet, electricity and fewer learners per teacher have fewer struggling readers. The inputs come from SY 2023-24 school files, two years before the assessment, and the results are associations, not measured effects.
Show the data as a table
| School input | Odds ratio, Bayesian model (95% interval) | Excluding schools under 30 learners | Frequentist check, division fixed effects | VIF |
|---|---|---|---|---|
| Learners per teacher (log, per SD) | 1.14 (1.12–1.16) | 1.13 (1.10–1.15) | 1.20 (1.15–1.25) | 2.8 |
| Learners per classroom (log, per SD) | 1.05 (1.04–1.07) | 1.04 (1.03–1.06) | 1.05 (1.03–1.07) | 2 |
| Share of buildings needing major repair or worse (per SD) | 0.99 (0.98–1.00) | 0.99 (0.98–1.01) | 0.98 (0.97–1.00) | 1 |
| School size, elementary enrollment (log, per SD) | 0.90 (0.88–0.92) | 0.88 (0.87–0.90) | 0.78 (0.75–0.81) | 3.5 |
| Has electricity | 0.84 (0.78–0.90) | 0.87 (0.80–0.94) | 0.88 (0.79–0.98) | 1.1 |
| Has internet | 0.89 (0.86–0.91) | 0.89 (0.86–0.91) | 0.86 (0.82–0.91) | 1.1 |
| Has a water supply | 1.05 (0.97–1.13) | 1.05 (0.97–1.14) | 1.06 (0.95–1.17) | 1.1 |
| No functional toilet | 0.99 (0.91–1.07) | 0.94 (0.86–1.02) | 0.95 (0.80–1.12) | 1 |
| Offers multigrade classes | 1.02 (0.98–1.06) | 1.12 (1.06–1.17) | 1.02 (0.94–1.11) | 1.3 |
| Annex school | 1.25 (1.09–1.44) | 1.26 (1.08–1.46) | 1.15 (0.95–1.39) | 1 |
| Urban barangay | 1.02 (0.99–1.05) | 1.02 (0.99–1.05) | 1.02 (0.97–1.06) | 1.4 |
| Municipal income class 2nd (vs 1st) | 0.95 (0.92–0.99) | 0.96 (0.93–1.00) | 0.94 (0.85–1.04) | 1.1 |
| Income class 3rd (vs 1st) | 0.97 (0.93–1.01) | 0.99 (0.95–1.03) | 0.94 (0.87–1.03) | 1.1 |
| Income class 4th (vs 1st) | 0.88 (0.84–0.92) | 0.87 (0.82–0.92) | 0.86 (0.76–0.97) | 1.1 |
| Income class 5th (vs 1st) | 0.80 (0.72–0.90) | 0.88 (0.77–0.99) | 0.89 (0.69–1.15) | 1 |
| Comparison | Schools | Struggling, with principal | Struggling, without | Difference (points, 95% interval) | Risk ratio |
|---|---|---|---|---|---|
| Unadjusted | 37,578 | 9.2% | 11.3% | -2.1 (-2.8 to -1.5) | 0.81 |
| Overlap weights, division indicators (main) | 37,578 | 9.7% | 10.9% | -1.2 (-1.6 to -0.8) | 0.89 |
| Region instead of division indicators | 37,578 | 9.6% | 11.2% | -1.6 (-2.0 to -1.0) | 0.86 |
| Schools with 30 or more learners | 31,655 | 9.8% | 11.1% | -1.3 (-1.6 to -0.8) | 0.89 |
| Principal vs no head position only | 26,034 | 10.2% | 12.2% | -2.1 (-2.5 to -1.5) | 0.83 |
| Learner-weighted | 37,578 | 10.3% | 11.9% | -1.7 (-2.3 to -1.1) | 0.86 |
Internet goes with 0.89 times the odds of struggling (95% interval 0.86 to 0.91) and electricity with 0.84 (0.78 to 0.90). One standard deviation more learners per teacher goes with 1.14 times the odds (1.12 to 1.16), and larger schools have lower odds (0.90, 0.88 to 0.92).
Annex schools have higher odds of struggling readers than other schools in the same division: 1.25 (1.09 to 1.44).
Of the 37,578 schools with input data, 41.1% are led by a School Principal. Their share of struggling readers is 9.2%, against 11.3% elsewhere. Compared with similar schools, the difference is -1.2 percentage points (95% interval -1.6 to -0.8).
An unmeasured difference between the two groups would have to go with both having a principal and struggling readers by a risk ratio of 1.50 to explain that difference away (the E-value).
Stunting, day care centers and programs
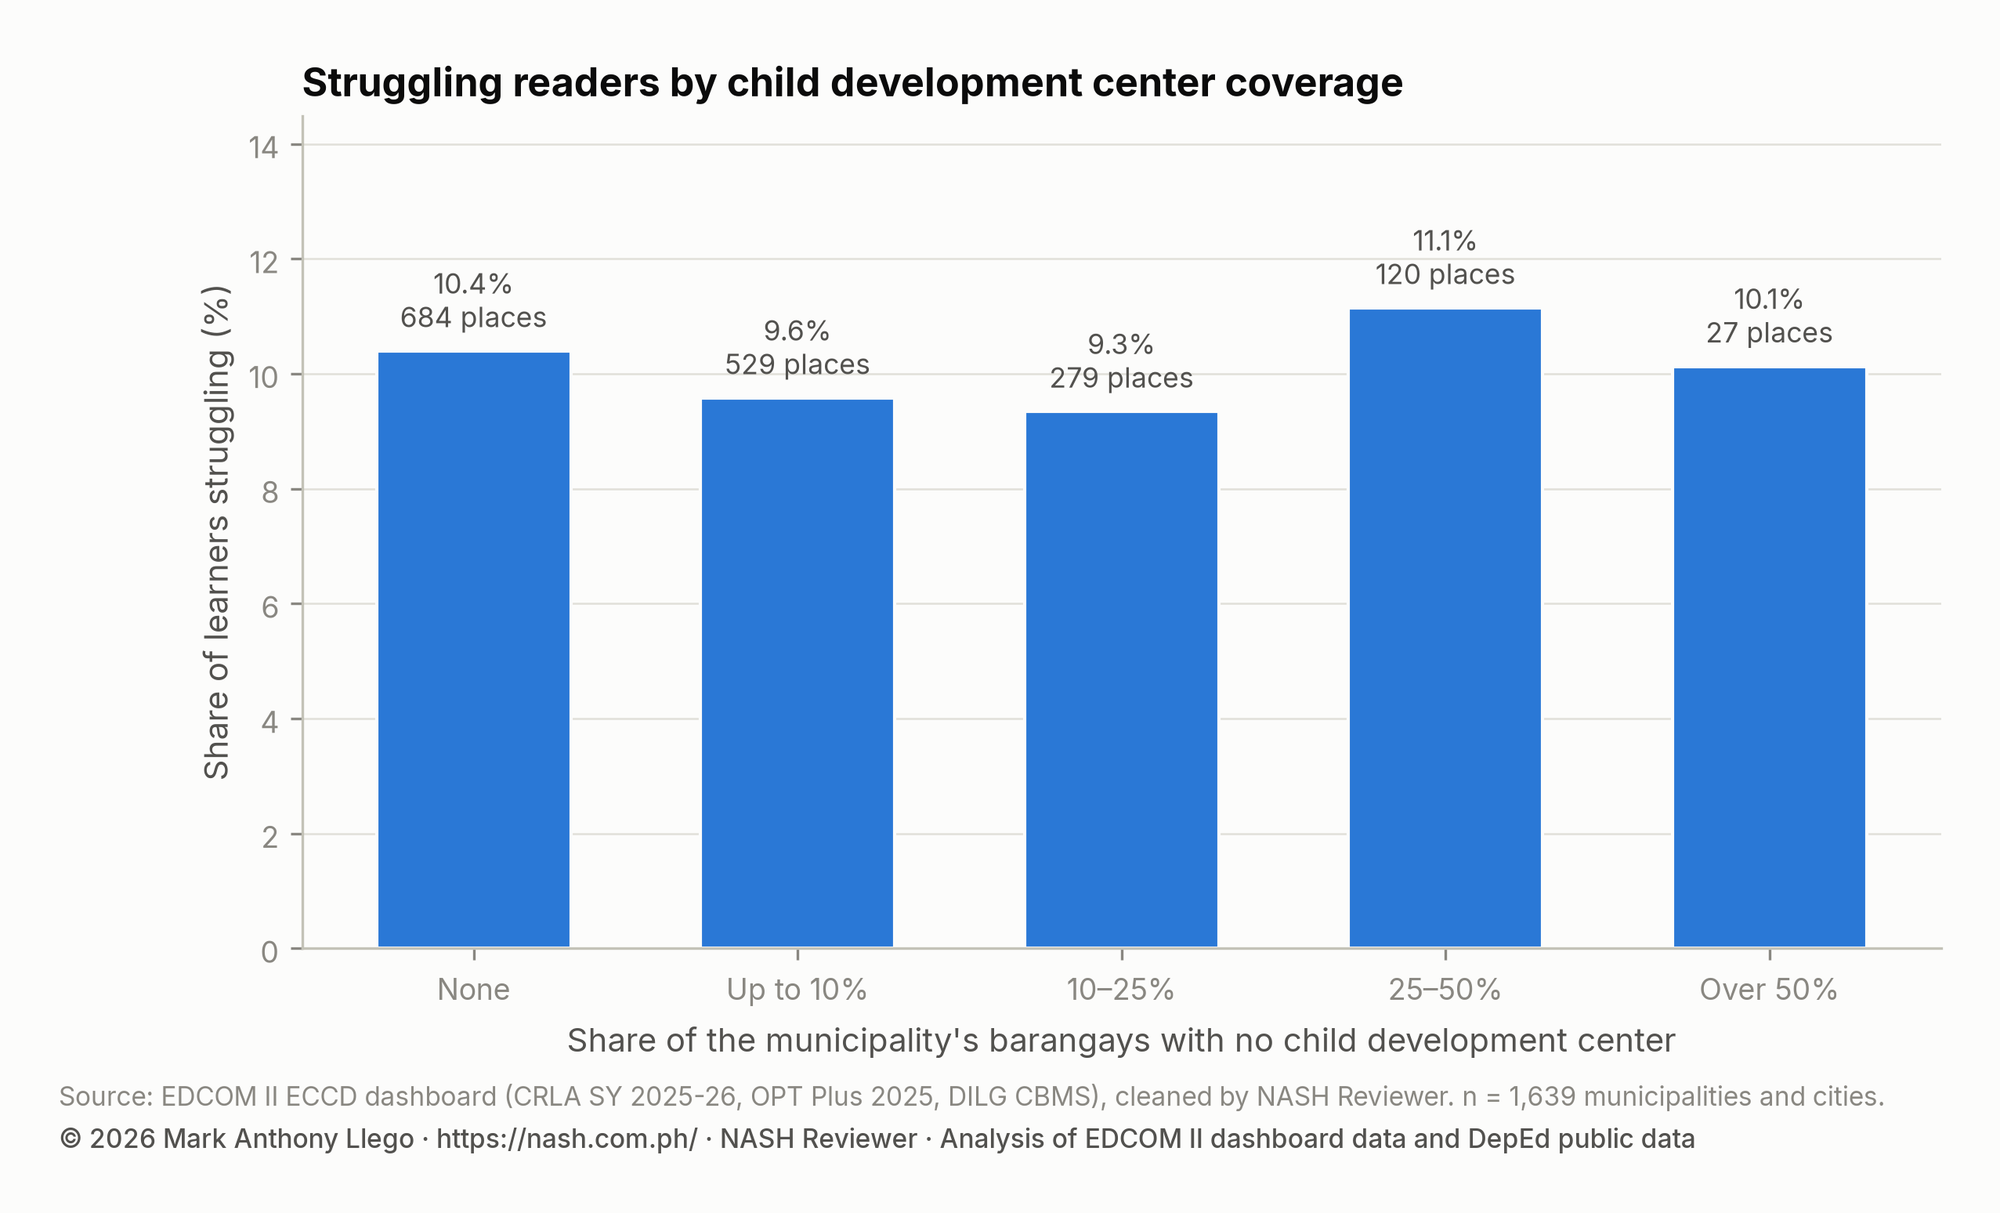
In 2025, 4.3% of the 3,007,695 children aged 0–2 measured in Operation Timbang Plus were stunted: 129,690 children. Of the country’s barangays, 10.9% have no child development center (CDC).
Show the data as a table
| Barangays without a CDC | Municipalities and cities | Learners assessed | Share struggling |
|---|---|---|---|
| None | 684 | 1,706,534 | 10.4% |
| Up to 10% | 529 | 1,830,691 | 9.6% |
| 10–25% | 279 | 928,474 | 9.3% |
| 25–50% | 120 | 518,559 | 11.1% |
| Over 50% | 27 | 143,397 | 10.1% |
Stunting varies widely between places: a tenth of municipalities have shares above 14.5%. In 684 municipalities and cities (41.7%), every barangay has a CDC.
Across municipalities, stunting and the share of struggling readers are barely correlated: Spearman’s rho is 0.05 (95% interval -0.06 to 0.17), and 0.01 (-0.10 to 0.12) for the share of barangays without a CDC. The share of struggling readers moves little across the CDC bands.
Stunting describes children aged 0–2 in 2025 and the CRLA describes Grades 1–3 in SY 2025-26: different children. Comparisons between them are about places, not individual children.
The dashboard also lists 100 literacy, nutrition and childcare program records from 24 organizations, reporting 12,210 beneficiaries. The three regions with the most struggling readers (Region IV-A, BARMM, Region XII) hold 27.2% of the need but 5.0% of the recorded programs. The list is not a census of programs.
Start and end of the school year in the same schools
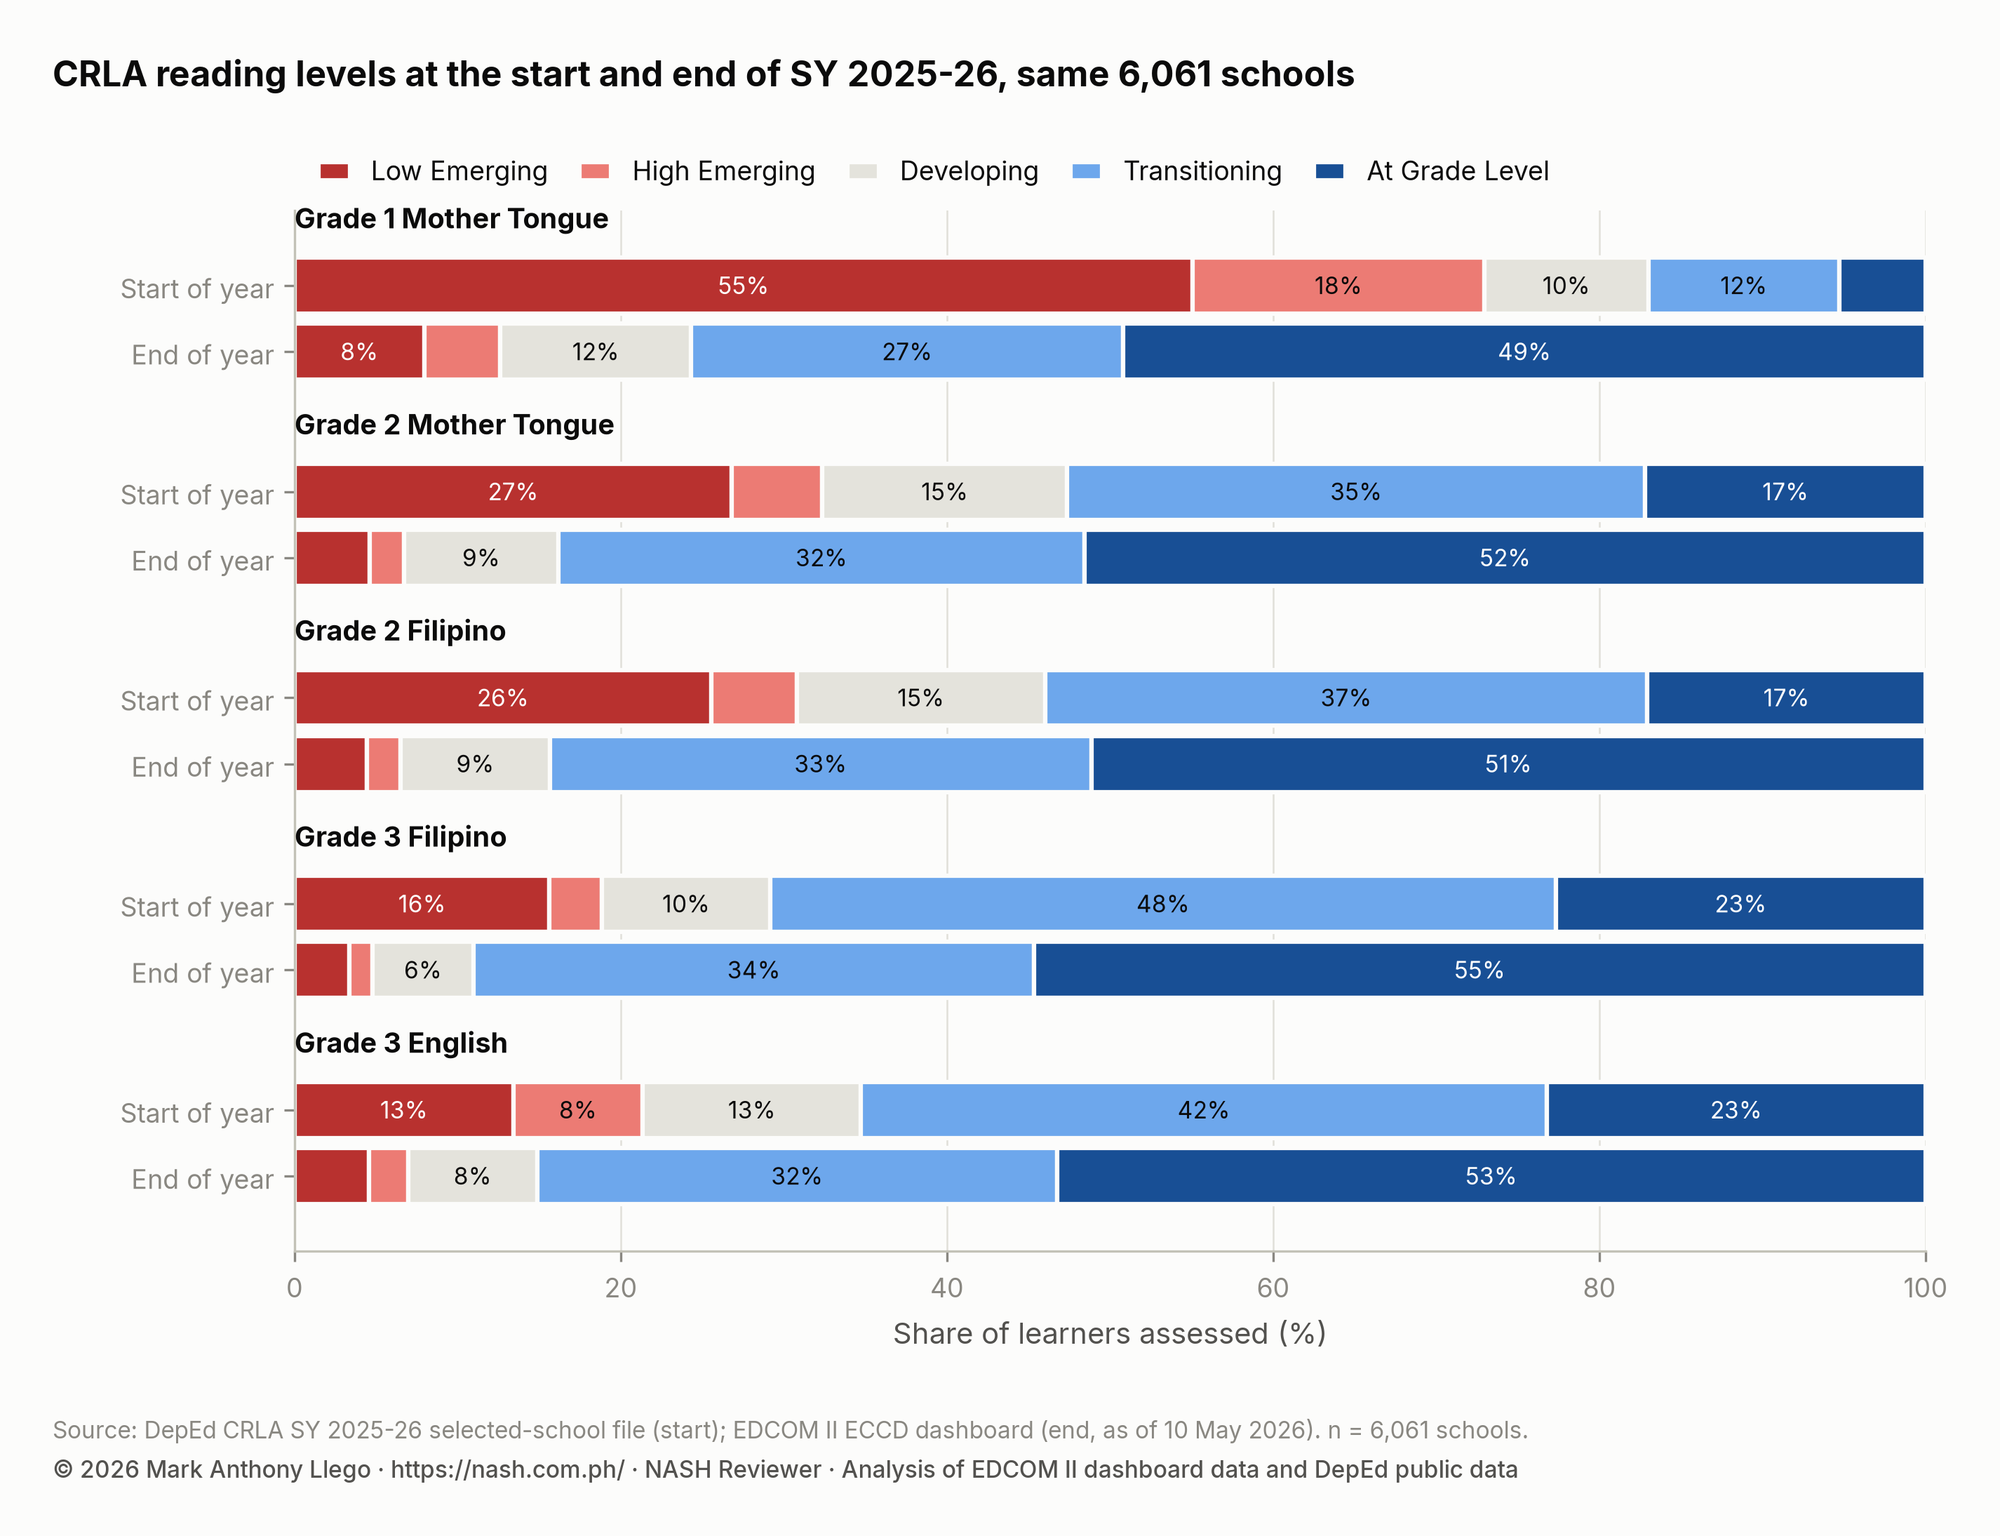
DepEd’s own CRLA file is dated 28 September 2025, before the mid-year assessment window. In the 6,061 schools found in both files, the share of struggling readers fell from 40.5% at the start of the year to 8.6% at the end, and the share at grade level rose from 15.6% to 51.3%.
Show the data as a table
| Grade and language | Round | Learners | Low Emerging | High Emerging | Developing | Transitioning | At Grade Level | Struggling (Low + High Emerging) |
|---|---|---|---|---|---|---|---|---|
| Grade 1 Mother Tongue | Start of year | 197,476 | 55.1% | 17.9% | 10.1% | 11.7% | 5.3% | 72.9% |
| Grade 1 Mother Tongue | End of year | 191,363 | 7.9% | 4.7% | 11.7% | 26.5% | 49.2% | 12.6% |
| Grade 2 Mother Tongue | Start of year | 218,841 | 26.8% | 5.5% | 15.0% | 35.4% | 17.2% | 32.4% |
| Grade 2 Mother Tongue | End of year | 196,223 | 4.6% | 2.1% | 9.4% | 32.3% | 51.6% | 6.7% |
| Grade 2 Filipino | Start of year | 217,418 | 25.5% | 5.2% | 15.2% | 36.9% | 17.1% | 30.8% |
| Grade 2 Filipino | End of year | 196,905 | 4.4% | 2.1% | 9.2% | 33.2% | 51.2% | 6.5% |
| Grade 3 Filipino | Start of year | 229,468 | 15.6% | 3.2% | 10.3% | 48.2% | 22.7% | 18.8% |
| Grade 3 Filipino | End of year | 214,961 | 3.3% | 1.4% | 6.2% | 34.3% | 54.7% | 4.8% |
| Grade 3 English | Start of year | 224,986 | 13.4% | 7.9% | 13.4% | 42.0% | 23.2% | 21.3% |
| Grade 3 English | End of year | 219,074 | 4.6% | 2.4% | 7.9% | 31.9% | 53.3% | 7.0% |
| All learners (G1 MT + G2 Fil + G3 Eng) | Start of year | 639,880 | 30.4% | 10.1% | 13.0% | 30.9% | 15.6% | 40.5% |
| All learners (G1 MT + G2 Fil + G3 Eng) | End of year | 607,342 | 5.6% | 3.0% | 9.5% | 30.6% | 51.3% | 8.6% |
The comparison was set up before the results were seen. DepEd’s file counts as an earlier round only if its counts are within ±15% of EDCOM II’s for most schools, its shares are lower in every block, and its date fits the start of the year. All three hold; the counts agree within ±15% in 89.5% of schools.
The median school’s share at grade level rose by +36 percentage points, and 96.7% of schools improved.
The two files are two rounds of a screen given by teachers, not a controlled test. The gain combines a year of teaching with familiarity with the format and differences in how the rounds were given.
How the dashboard data were cleaned
Every change is in a cleaning log of 1,486 rows, each with the record, the rule, the old and new values and the reason. No CRLA count was changed.
| Change | Records |
|---|---|
| Sulu moved to Region IX | 547 |
| Garbled text repaired | 226 |
| Barangay link confirmed by research | 149 |
| Coordinates from research | 114 |
| Barangay link by validated PSGC code | 110 |
| Location from a predecessor school | 98 |
| Region relabeled from the PSGC code (NIR and Sulu) | 86 |
| Region filled from the province | 68 |
| Region filled from the municipality | 30 |
| Barangay link by normalized name | 26 |
| Duplicate barangay code dropped | 15 |
| Two-way name match resolved by code | 14 |
| Header row dropped | 2 |
| Region filled from the barangay | 1 |
| How the school was linked to its barangay | Schools | Share |
|---|---|---|
| Dashboard's exact name match | 38,379 | 99.22% |
| Confirmed by research | 149 | 0.39% |
| Validated PSGC code | 110 | 0.28% |
| Normalized name | 26 | 0.07% |
| Name match resolved by code | 14 | 0.04% |
| Not linked | 1 | 0.00% |
Garbled text from a character-encoding error, such as ñ shown as two symbols, was repaired in 226 records. Region labels were filled or corrected from the PSGC codes, and Sulu schools were moved to Region IX.
Coordinates for 114 schools come from research, not DepEd. They are less precise: a median of 5.2 km from the barangay center, against 0.73 km for DepEd’s coordinates, and 26 lie more than 10 km away.
A school with no location of its own took its predecessor school’s location in 98 cases; 2 proposed predecessors were rejected and 1 awaits confirmation.
Among the 38,679 assessed schools, 769 have coordinates flagged as suspect, 368 lie far from their barangay and 324 have none. The flags are in the school locations file.
What the data mean for a school head
Six points from the data for a school head, or for someone preparing to become one.
Read your school’s estimate and its interval
A small school’s share swings by chance. In schools with fewer than 30 learners, the 95% interval of the estimated share is typically 17 percentage points wide; in the largest schools it is about 4. The school estimates file gives every school’s estimate and interval.
Compare your school within its division
Most of the variation between schools (65%) lies inside divisions, so a division’s average says little about any one school. Compare with similar schools in your division and with your own earlier results.
Start with Grade 1
Grade 1 Mother Tongue has the most struggling readers, 14.4% of learners. Those still at Low or High Emerging at the end of Grade 1 need support before Grade 2 begins.
Know where your municipality stands
Struggling readers cluster in place. If your school sits in a high-high cluster, its results reflect the area as well as the school, so plan with the municipality, the barangay and neighboring schools.
Treat school inputs as clues, not causes
Internet, electricity and fewer learners per teacher go with fewer struggling readers within a division. They are reasons to look closer at your own school, not proof that one purchase will change its results.
Check your data before you report it
22.1% of schools report no struggling reader, more than chance predicts, and many report identical Grade 2 Mother Tongue and Filipino results. Check that your school’s CRLA entries are complete and consistent before they are used for planning.
How the figures were computed
The cleaning and the analysis can be re-run from the raw extract. These are the choices that determine what the charts show.
- The dashboard’s workbook was extracted table by table. The raw extract is kept unchanged and published, and 11 validation checks (row counts, totals and reconciliation with the dashboard’s national and regional figures) pass on the cleaned tables.
- Each learner is counted once (Grade 1 Mother Tongue, Grade 2 Filipino, Grade 3 English), and struggling readers are Low Emerging plus High Emerging. National and regional shares are population values.
- Regions follow the PSGC, with Sulu in Region IX and the Negros Island Region as its own region. Schools are linked to barangays by the dashboard’s names, then validated PSGC codes, research and normalized names, and every added link is logged.
- School and division estimates use a beta-binomial empirical Bayes model with a concentration fitted for each region, and each comes with a 95% interval. Funnel plots mark the 95% and 99.8% limits, and the Benjamini–Hochberg procedure holds the false discovery rate at 5%.
- The variance split, the language model and the school-input model are Bayesian multilevel models fitted in PyMC with the No-U-Turn Sampler. Every fit passed the convergence checks: R-hat at most 1.01 and an effective sample size of at least 400.
- Clusters use queen contiguity between municipal boundaries, local Moran’s I and Getis–Ord Gi* with 9,999 permutations, and a 5% false discovery rate.
- The principal comparison weights schools by overlap propensity scores built from size, location and resources within divisions, and is repeated under five other specifications.
- Every number on this page and in the blog series comes from the same pipeline outputs, so the two agree. All results are associations.
Limits of the data
What these files cannot say, and the patterns in them worth checking before use.
- The data are one snapshot of the dashboard, as of 10 May 2026, for one school year. The dashboard may be updated; the files of this release will not change.
- The CRLA is a screen given by teachers, not a test under identical conditions. Differences in how and when it was given are part of every school’s result.
- Only public schools are covered.
- School inputs are from SY 2023-24, two school years before the assessment, and some schools have no input record.
- Stunting (ages 0–2, 2025) and reading (Grades 1–3, SY 2025-26) describe different children, so comparisons between them are about places.
- The program records are a list compiled for the dashboard, not a census of programs.
- Associations between school inputs or school heads and reading do not show what causes what.
About these numbers
- 8,543 schools (22.1%) report no struggling reader, against about 7,490 expected by chance under a model that lets schools differ, and 29 report only struggling readers, against about 4 expected. These are data checks, not findings about the schools.
- In 14,765 schools (49.8% of those with both Grade 2 results), the Mother Tongue and Filipino results are identical level by level; 64.9% of them teach in Tagalog, where the two languages are the same.
- The dashboard’s region labels for NIR and Sulu schools differed from their PSGC codes; they were relabeled from the codes, as the cleaning rules table shows.
Download the EDCOM II CRLA data
The cleaned dashboard tables, the analysis tables and the raw extract, free to download with a README and checksums. Reusing them needs our written permission: email support@nash.com.ph.
Cleaned dashboard tables
The dashboard's tables after cleaning, with the log of every change and the validation summary.
- Schools and CRLA resultsOne row per school: CRLA results by grade and language, barangay link, coordinates, flags
- School locationsAll school location records with geography and coordinate quality
- Barangay referencePSGC barangay reference with match keys and centroids
- Barangays without a child development centerBarangays with no child development center (DILG CBMS, 17 Sep 2025)
- Stunting, ages 0–2, 2025OPT Plus 2025 stunting, ages 0-2, by region, province and municipality (DOH/NNC, 2 Mar 2026)
- Literacy, nutrition and childcare programsLiteracy, nutrition and childcare program records (100)
- Regional overviewThe dashboard's regional overview
- Region crosswalkRegion labels to PSGC regions
- Regional reconciliationRegional totals reconciled with the national totals
- Cleaning logEvery change the cleaning made: table, record, rule, old and new value, reason
- Validation summaryRow counts, reconciliation checks and link summary
Analysis tables
The tables behind the series: one row per school with its CRLA results and SY 2023-24 school inputs, and the school, division, municipal and regional estimates.
- School analysis tableAnalysis table: one row per school, CRLA blocks and totals, barangay and municipality codes, SY 2023-24 school inputs (in_ columns), head type
- School estimatesEvery school: share struggling, empirical Bayes and hierarchical Bayes estimates with 95% intervals, funnel flag (read the guide before ranking schools)
- Division estimates232 divisions: share struggling, empirical Bayes estimate and 95% interval, rank interval, funnel and FDR flags
- School inputs by regionSchool inputs and struggling readers: odds ratios with 95% intervals from a separate model for each region
- Municipalities and citiesMunicipality or city: learners, struggling readers, estimate, LISA and Gi* results, stunting and CDC gaps
Raw extract
The six tables as recovered from the dashboard's workbook, unchanged, with the field dictionary and metadata.
- Raw dashboard extractThe six tables as recovered from the dashboard workbook, unchanged, with the field dictionary and metadata
Version 1, released October 27, 2026: 19 files, 30.2 MB in total. The folder name carries the version number, so the file at a given URL never changes. The blog post on the cleaning documents every table and rule.
Common questions about the EDCOM data
Short answers about the files, the definitions and fair use of the results.
Every file is listed in the downloads section of this page with its rows, columns, size and checksum. The files are served from data.nash.com.ph/edcom-data/v1, starting with the README. They are free to download for personal study; any other use, such as republishing them or using them in research, reports or apps, needs NASH Reviewer’s written permission first (email support@nash.com.ph).
A learner whose CRLA result is Low Emerging or High Emerging, the two lowest of the assessment’s five reading levels. The others are Developing, Transitioning and At Grade Level. In these data each learner is counted once: Grade 1 by the Mother Tongue result, Grade 2 by Filipino and Grade 3 by English.
No. NASH Reviewer extracted and cleaned the data from the public EDCOM II dashboard and is not affiliated with EDCOM II or DepEd. The raw extract is published unchanged beside the cleaned files, so every change can be checked against the dashboard.
DepEd’s file covers a selected set of schools in five regions and is dated before the mid-year assessment window, so it is a start-of-year round. The EDCOM II dashboard holds end-of-year results for public schools in all 18 regions. In the schools found in both, the end-of-year shares at grade level are far higher.
Not on their own. A small school’s share swings by chance, so each estimate comes with a 95% interval, and for many schools the data cannot tell whether the share is above or below the national share. Use the estimates to read a school’s result fairly, compare schools of similar size, and look at several years before drawing conclusions.
Llego, M. A. (2026). EDCOM II early-childhood dashboard data, cleaned, version 1. NASH Reviewer. https://nash.com.ph/edcom-data. Name the EDCOM II dashboard as the original source of the data.
The EDCOM CRLA series on the blog
The analysis continues on the blog in 14 articles and 18 regional reports. The articles read each question in depth, and each regional report covers one region’s divisions, languages, municipalities and school resources.
- Start here
- Reading results
- Where support is needed
- Schools and school heads
- For teachers and school heads
- Regional reports
- CRLA Results SY 2025-26 in NCR: Low Shares, Large Schools
- CRLA Results SY 2025-26 in CAR: Abra to Mountain Province
- CRLA Results SY 2025-26 in Region I: Pangasinan and Grade 1
- CRLA Results SY 2025-26 in Region II: Isabela in Focus
- CRLA Results SY 2025-26 in Region III: Ahead in Every Grade
- CRLA Results SY 2025-26 in Region IV-A: Counts vs Rates
- CRLA Results SY 2025-26 in MIMAROPA: From Palawan to Romblon
- CRLA Results SY 2025-26 in Region V: A Gap in Every Grade
- CRLA Results SY 2025-26 in Region VI: Iloilo City Stands Out
- CRLA Results SY 2025-26 in NIR: Negros and Siquijor
- CRLA Results SY 2025-26 in Region VII: Bohol and Metro Cebu
- CRLA Results SY 2025-26 in Region VIII: Strong but Uneven
- CRLA Results SY 2025-26 in Region IX: Sulu and Its Hotspots
- CRLA Results SY 2025-26 in Region X: Near the National Mark
- CRLA Results SY 2025-26 in Region XI: Fewer at Grade Level
- CRLA Results SY 2025-26 in Region XII: Hotspots by Division
- CRLA Results SY 2025-26 in Caraga: Day Care and School Heads
- CRLA Results SY 2025-26 in BARMM: Where Need Is Greatest
How to cite this page
Use APA style (7th edition). The date is the day the page was last updated. Where you use a figure or a rule, also cite the law, issuance, or report the page names for it.
Llego, M. A. (2026, October 30). EDCOM II CRLA data: reading results for SY 2025-26. NASH Reviewer. https://nash.com.ph/edcom-data
In-text citation: (Llego, 2026). To cite the cleaned data files rather than this page, use the data citation under Common questions about the EDCOM data.
Sources
The EDCOM II dashboard compiles data from DepEd, DOH and the National Nutrition Council, and DILG. Each table was checked against the dashboard before any analysis.
- EDCOM II early childhood care and development (ECCD) dashboard: CRLA results at the end of SY 2025-26, as of 10 May 2026CRLA reading levels by school, grade and language for public schools, with school locations, a barangay reference and the dashboard’s regional overview.
- DOH and National Nutrition Council, Operation Timbang Plus 2025, as of 2 March 2026 (compiled in the EDCOM II dashboard)Children aged 0–2 weighed and measured, and those stunted, by region, province and municipality.
- DILG Community-Based Monitoring System: barangays without a child development center, as of 17 September 2025 (compiled in the EDCOM II dashboard)Barangays that report no child development center.
- DepEd school data, SY 2023-24: personnel, facilities, ICT and WASH (BEIS and NSBI)Teachers, classrooms, buildings, electricity, water, toilets, internet and school head positions, joined to the CRLA results by school ID.
- PSA Philippine Standard Geographic Code, and PSA and NAMRIA municipal boundaries via OCHA HDX (CC BY-IGO)Barangay, municipal and regional codes for the links, and municipal boundaries for the maps and cluster tests.
- Analysis pipelineNumbered Python scripts (32–48 in the deped_data repository) that clean the extract, fit the models, draw the charts, build the release and write this page’s tables.
For aspiring school heads
Lead with the reading data in hand
The NASH asks how you would run a school: where to aim reading support, how to read a result fairly and what to do with too few teachers. Practice the PPSSH strands with situational questions that ask you to decide as a school head would.