The CRLA results for SY 2025-26 in the Bangsamoro Autonomous Region in Muslim Mindanao (BARMM) show the greatest reading need of any region. At the end of the school year, 23.4% of the 207,377 public school learners assessed in Grades 1–3 were struggling readers on the Comprehensive Rapid Literacy Assessment (CRLA), against 10.0% nationally, and 30.7% read at grade level, against 47.6%. Its 48,573 struggling readers make up 9.5% of all struggling readers in the country.
These figures exclude Sulu: after the Supreme Court ruled in 2024 that Sulu is not part of BARMM, its schools are counted in Region IX. Need within BARMM is uneven. Tawi-Tawi has the highest share of all 232 divisions, at 46.3%, while Lanao del Sur - I (10.8%) is close to the national figure. Many schools also work with crowded classrooms and without a functional toilet.
Key findings
- 23.4% of BARMM’s learners were struggling readers, the highest share of the 18 regions, against 10.0% nationally (+13.4 percentage points).
- Every grade-and-language block is far below the national share at grade level, from -15.8 points in Grade 2 Filipino to -19.0 in Grade 3 English; in Grade 1 Mother Tongue, 29.0% of learners are struggling.
- 5 of the region’s 10 divisions lie above the national funnel’s 95% limits (Tawi-Tawi, Maguindanao del Norte, Special Geographic Area, Lamitan City, Cotabato City), and the most struggling readers are in Maguindanao del Norte (13,767 struggling readers).
- 38 municipalities form high-high clusters, the most of any region (BARMM (38), Region XII (15), Region IX (10), Region XI (1)), and 0 form low-low clusters.
- Basilan (13.9%); Tawi-Tawi (15.1%) have the region’s highest stunting among children aged 0–2, against 5.5% for BARMM and 4.3% nationally, and 35.9% of barangays have no child development center, against 10.9%.
- The median elementary school has 44.7 learners per classroom (national 25.8), and 18.9% of schools have no functional toilet (national 2.3%).
- Only 27.4% of schools report a principal, against 40.7% nationally, and the EDCOM II list records 3 programs here (3.0% of the list), against 9.5% of the country’s struggling readers.
CRLA reading levels by grade and language in BARMM
Rows in the table are the five grade-and-language blocks, then all BARMM learners and all learners nationally; columns are the five CRLA levels. A struggling reader is one placed at Low Emerging or High Emerging.
| Grade and language | Learners | Low Emerging | High Emerging | Developing | Transitioning | At Grade Level | Struggling |
|---|---|---|---|---|---|---|---|
| Grade 1 Mother Tongue | 67,542 | 23.5% | 5.5% | 13.0% | 28.5% | 29.5% | 29.0% |
| Grade 2 Mother Tongue | 62,133 | 15.9% | 3.7% | 13.2% | 36.6% | 30.6% | 19.6% |
| Grade 2 Filipino | 68,226 | 15.6% | 3.6% | 12.9% | 36.7% | 31.3% | 19.2% |
| Grade 3 Filipino | 72,236 | 12.6% | 3.2% | 12.4% | 39.7% | 32.0% | 15.9% |
| Grade 3 English | 71,609 | 17.6% | 4.6% | 12.3% | 34.4% | 31.1% | 22.2% |
| BARMM, all learners | 207,377 | 18.8% | 4.6% | 12.7% | 33.2% | 30.7% | 23.4% |
| Philippines, all learners | 5,127,670 | 6.9% | 3.1% | 10.4% | 32.0% | 47.6% | 10.0% |
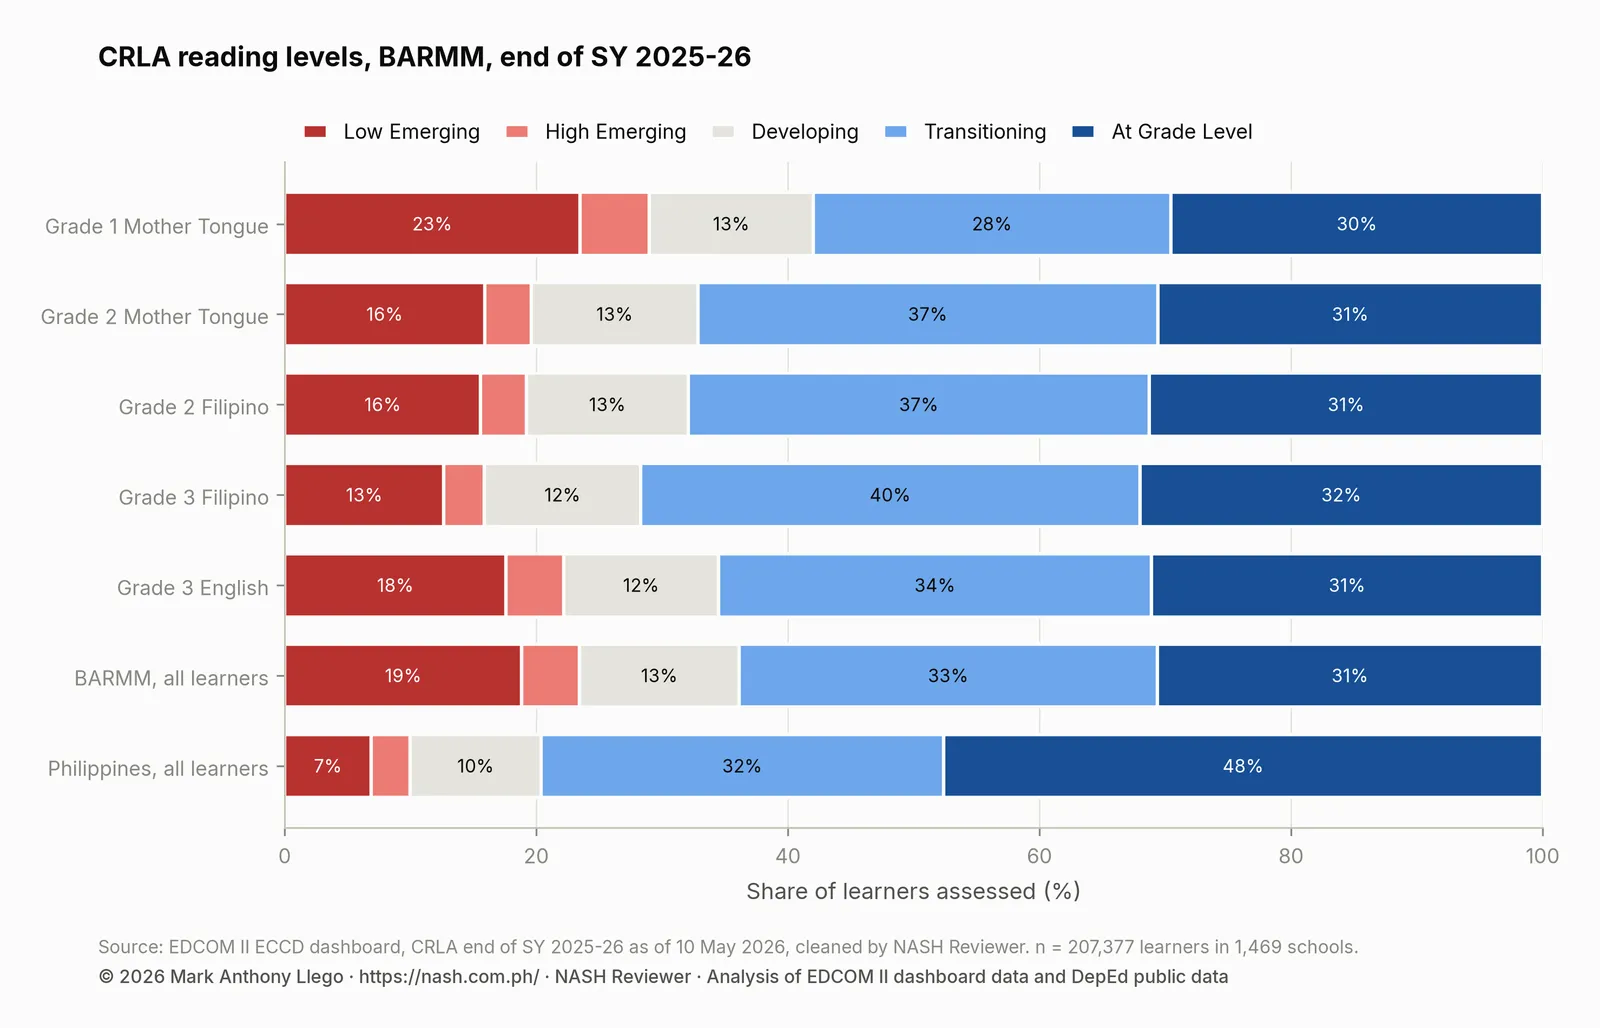
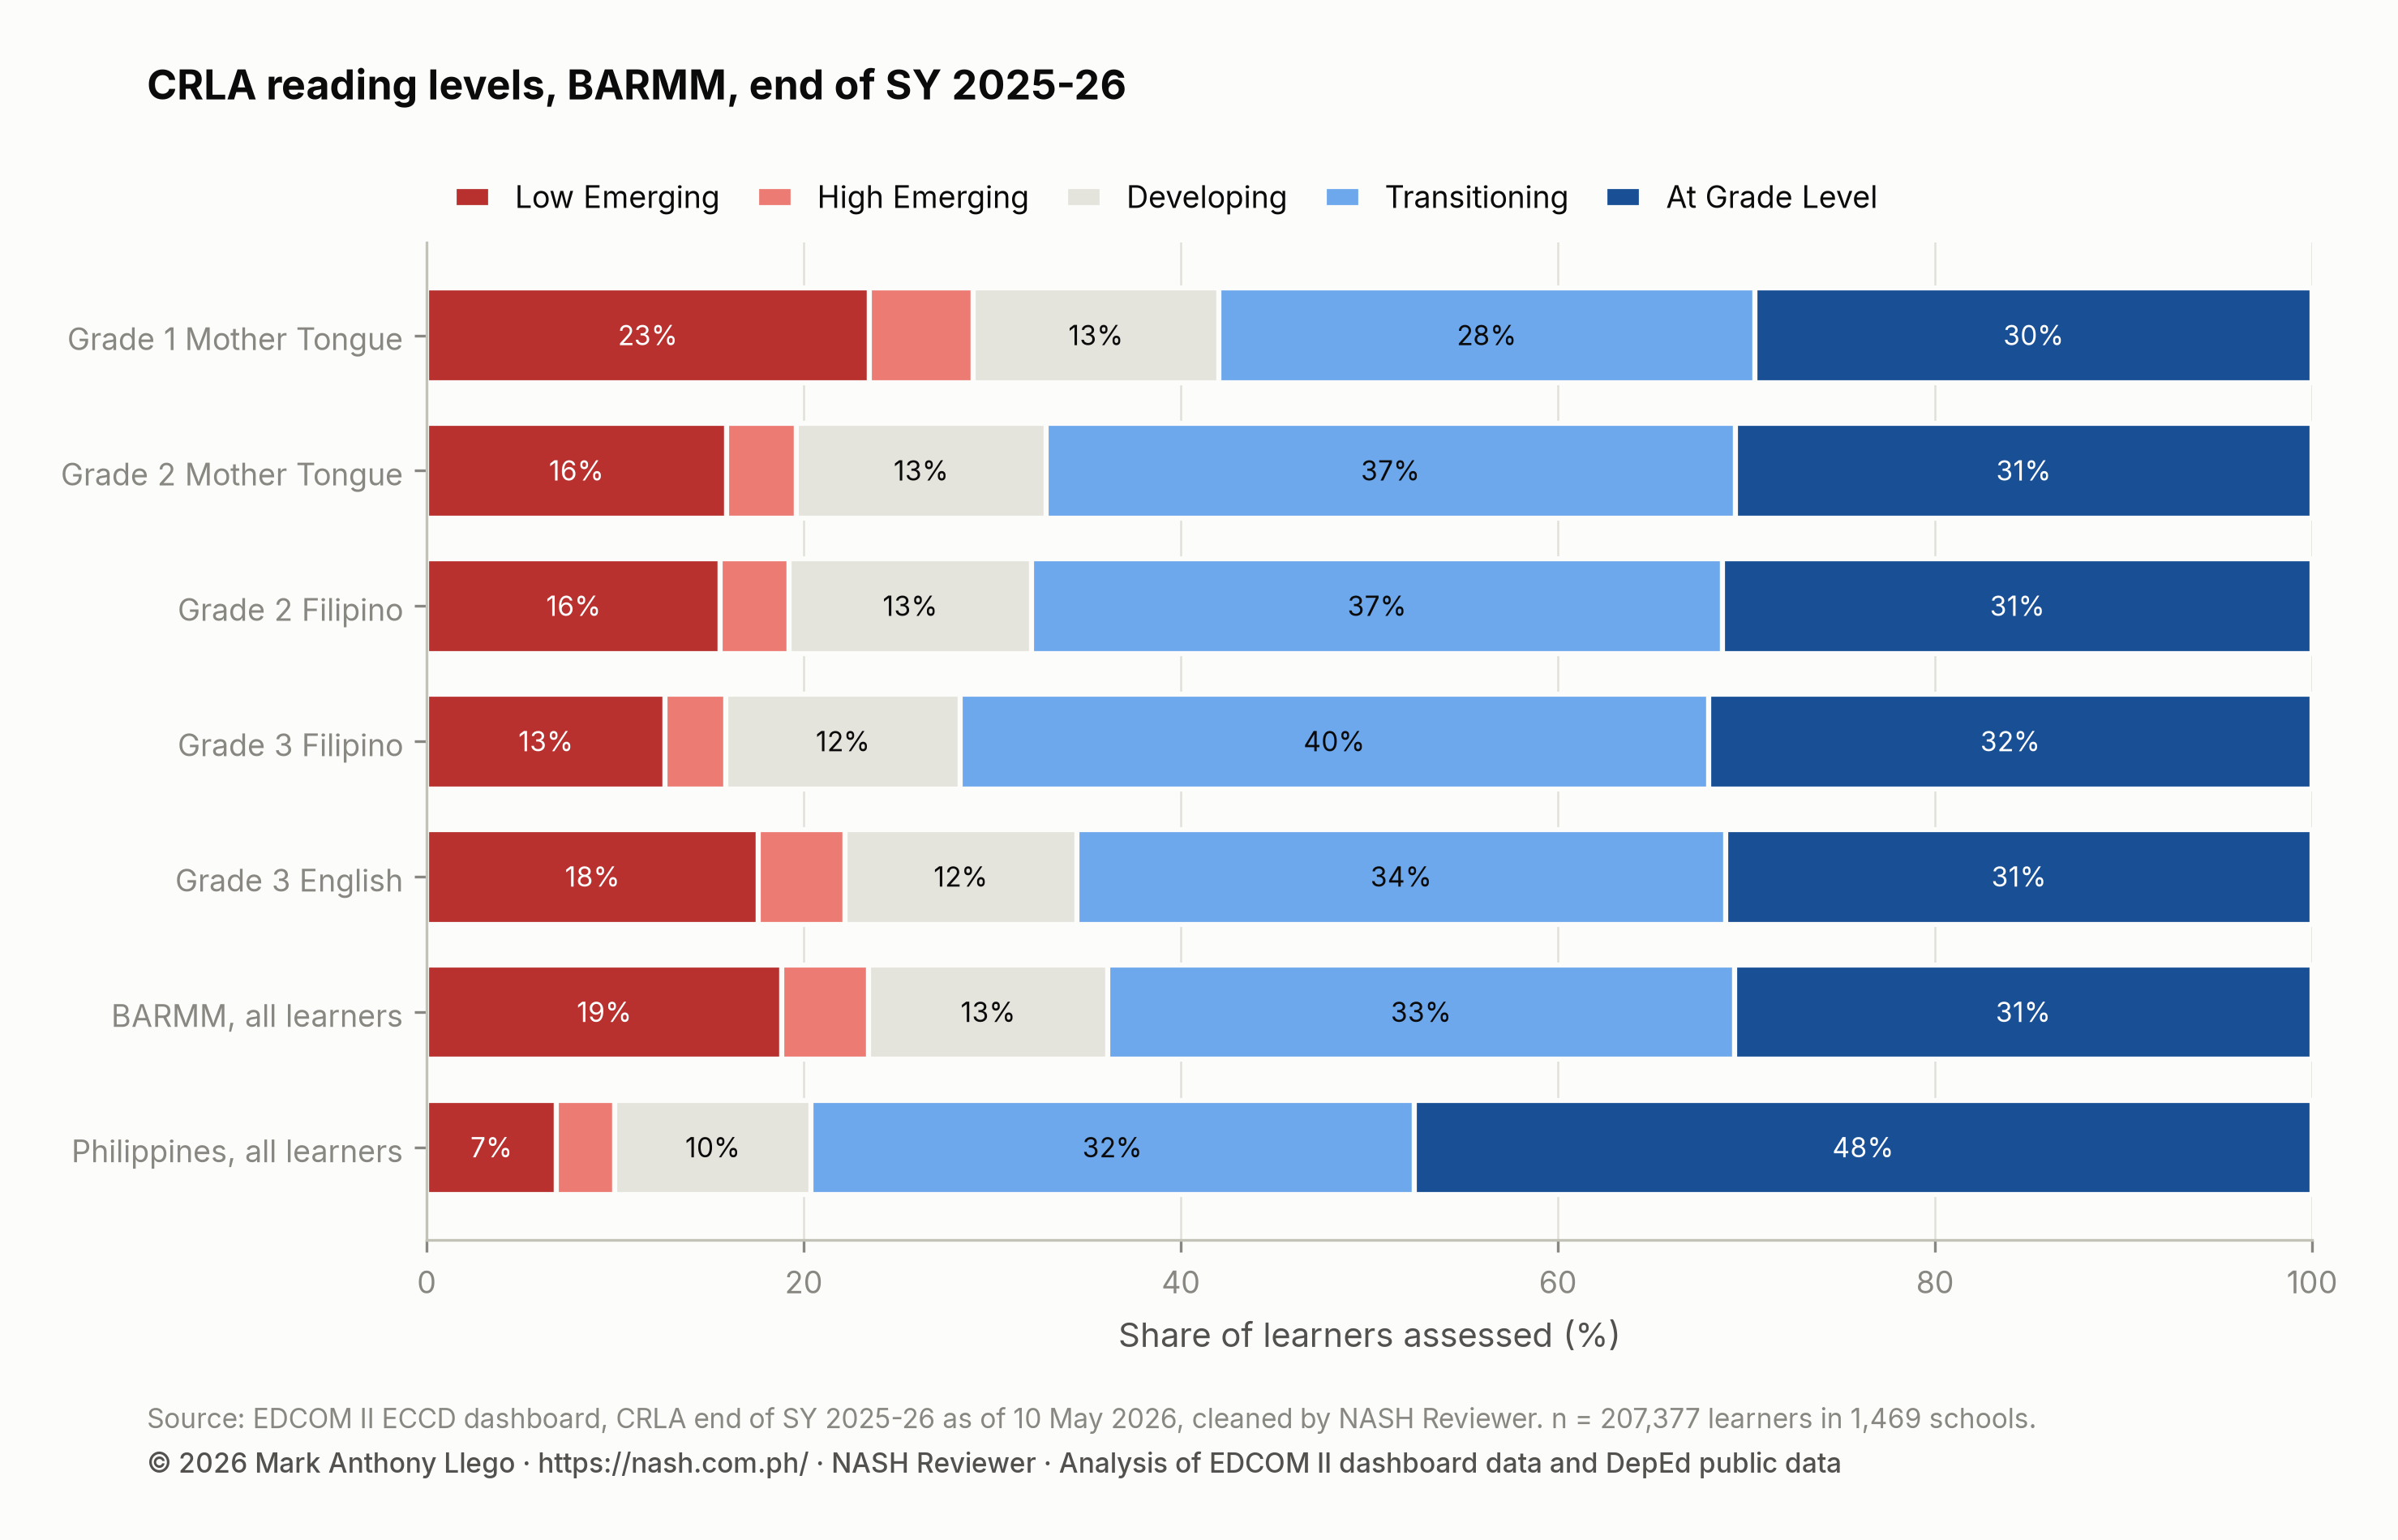
Grade 1 is where need is largest. In Grade 1 Mother Tongue, 29.0% of learners are struggling and 23.5% are at Low Emerging, the lowest level.
The share struggling is lower in each later grade, down to 15.9% in Grade 3 Filipino, but the share at grade level barely rises: from 29.5% in Grade 1 to 32.0% in Grade 3 Filipino. The higher grades have fewer learners at the Emerging levels and more at Transitioning, but not many more at grade level, so the distance from the national share is wider by Grade 3. Each grade holds different learners; this is a snapshot of the year, not one group followed over time. English is the hardest Grade 3 language, with 22.2% struggling against 15.9% in Filipino.
Schools divisions in BARMM
Each estimate in the table is an empirical Bayes figure: the division’s share drawn toward the national rate, more strongly for a small division, because a small group can land high or low by chance. The national funnel sets limits around the national rate for each division size; beyond the 95% limits is unusual, beyond the 99.8% limits very unusual.
| Division | Schools | Learners | Struggling readers | Share struggling | Estimate (95% interval) | National rank of 232 (95% interval) | National funnel |
|---|---|---|---|---|---|---|---|
| Basilan | 158 | 18,747 | 3,784 | 20.2% | 20.2% (19.6%–20.8%) | 222 (221–222) | within limits |
| Cotabato City | 29 | 13,644 | 3,624 | 26.6% | 26.5% (25.8%–27.3%) | 227 (227–228) | above 95% |
| Lamitan City | 48 | 6,909 | 1,888 | 27.3% | 27.3% (26.2%–28.3%) | 228 (227–228) | above 95% |
| Lanao del Sur - I | 302 | 32,834 | 3,530 | 10.8% | 10.8% (10.4%–11.1%) | 158 (153–164) | within limits |
| Lanao del Sur - II | 228 | 25,929 | 3,732 | 14.4% | 14.4% (14.0%–14.8%) | 200 (196–205) | within limits |
| Maguindanao del Norte | 277 | 40,320 | 13,767 | 34.1% | 34.1% (33.7%–34.6%) | 231 (230–231) | above 95% |
| Maguindanao del Sur | 270 | 46,972 | 10,758 | 22.9% | 22.9% (22.5%–23.3%) | 225 (224–225) | within limits |
| Marawi City | 41 | 7,674 | 1,293 | 16.8% | 16.8% (16.0%–17.7%) | 213 (212–214) | within limits |
| Special Geographic Area | 20 | 2,684 | 793 | 29.5% | 29.4% (27.6%–31.1%) | 229 (229–229) | above 95% |
| Tawi-Tawi | 96 | 11,664 | 5,404 | 46.3% | 46.2% (45.3%–47.2%) | 232 (232–232) | above 99.8% |
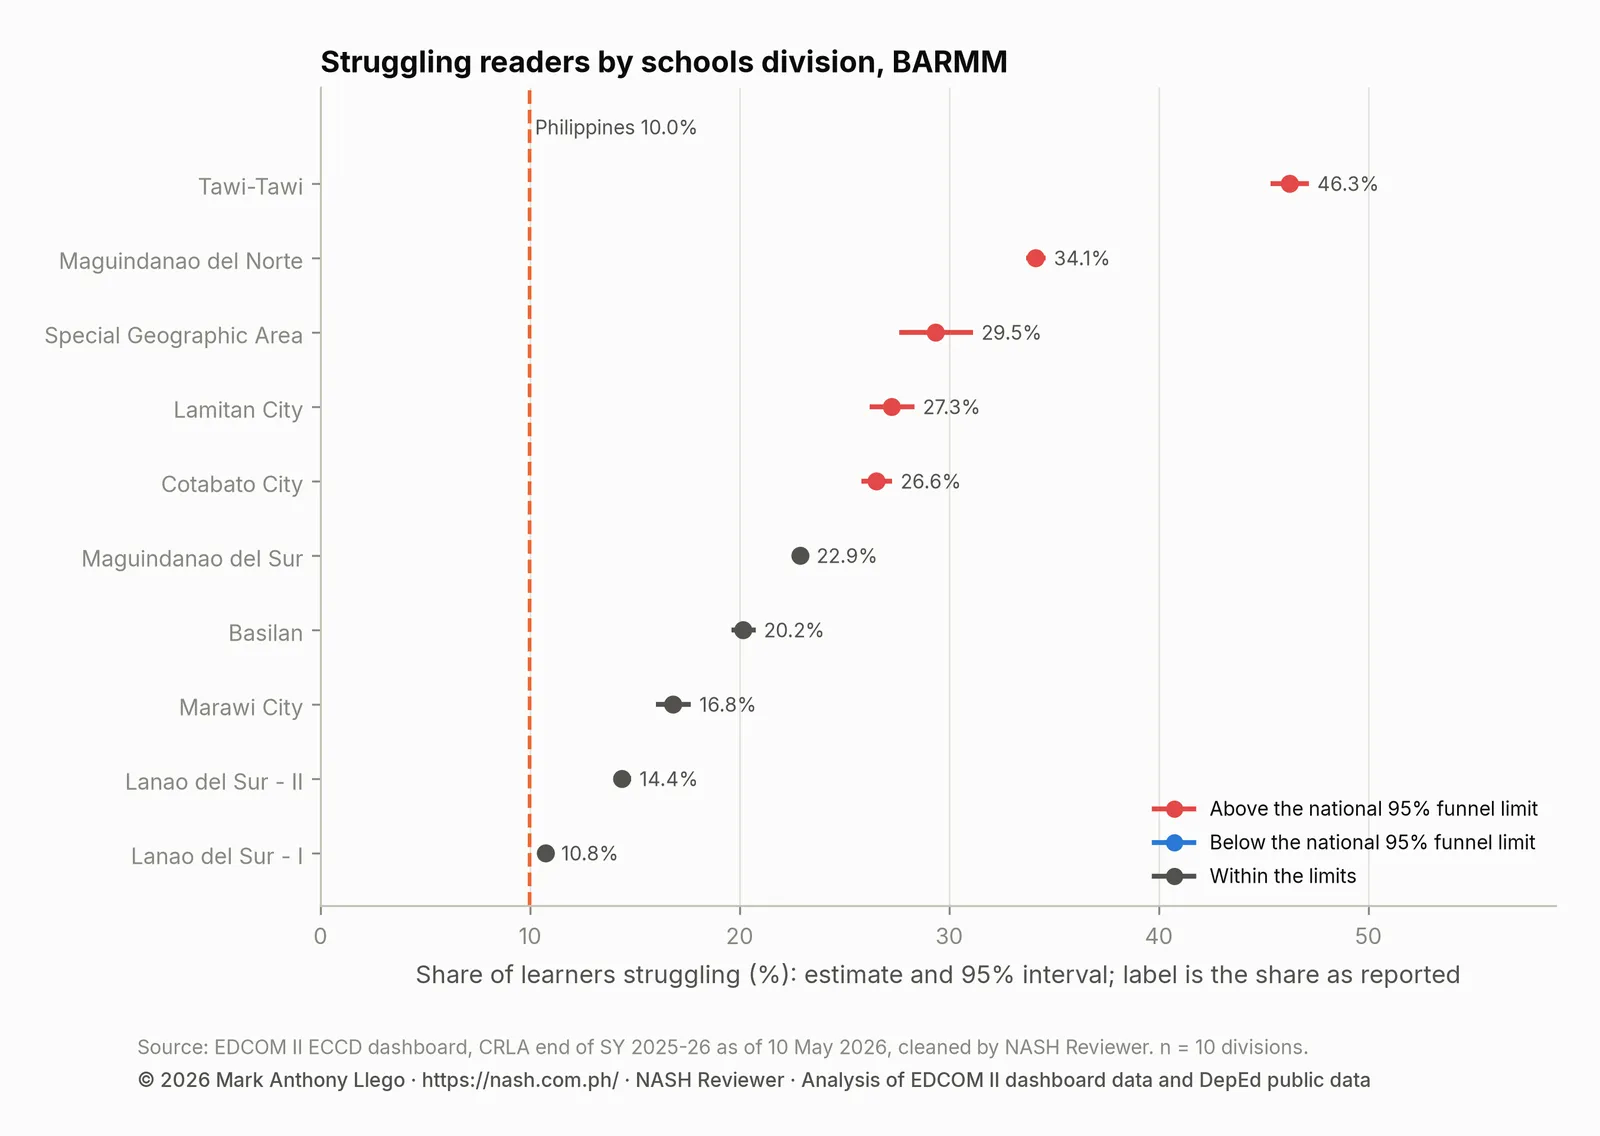
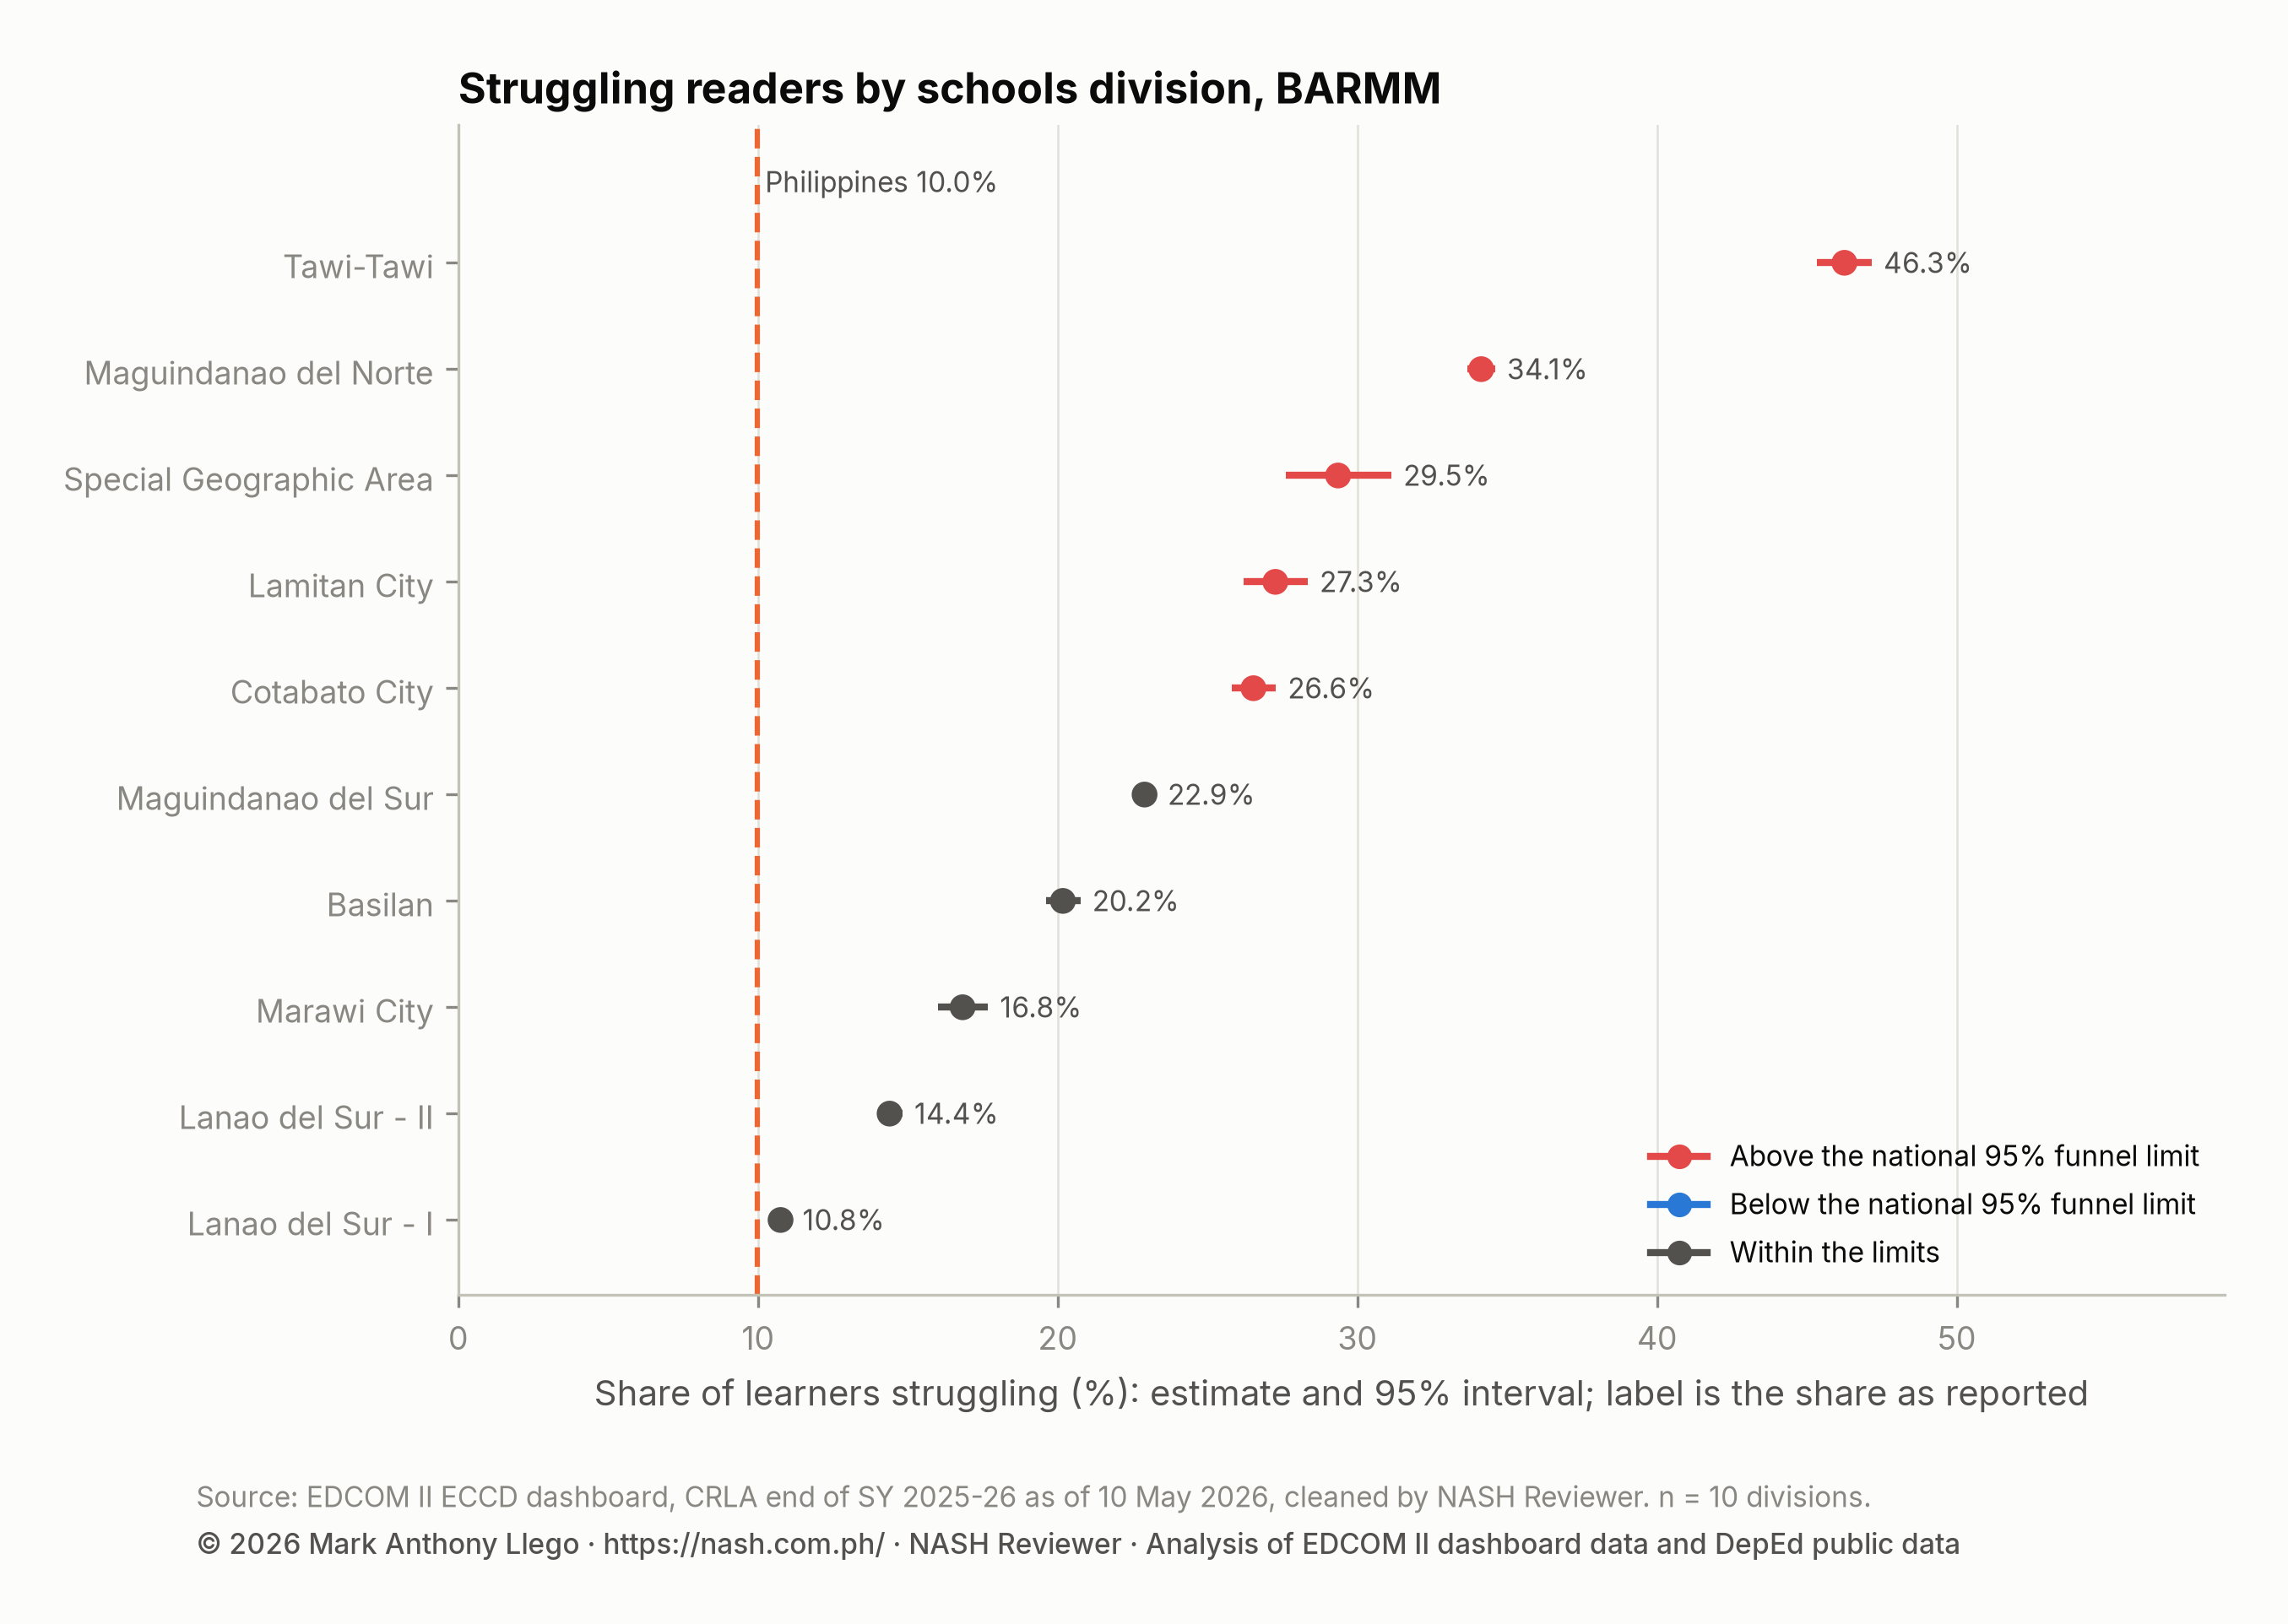
5 of BARMM’s 10 divisions lie above the 95% limits: Tawi-Tawi, Maguindanao del Norte, Special Geographic Area, Lamitan City, Cotabato City. Tawi-Tawi is also beyond the 99.8% limits. After a correction for testing all divisions at once (FDR 5%), the national analysis still flags 1 division above the national rate, and it is this one.
The divisions furthest from BARMM’s own share are Lanao del Sur - I (10.8%); Lanao del Sur - II (14.4%); Maguindanao del Norte (34.1%); Marawi City (16.8%); Special Geographic Area (29.5%); Tawi-Tawi (46.3%): the Lanao del Sur divisions and Marawi City below it; Maguindanao del Norte, the Special Geographic Area (the BARMM barangays in Cotabato province) and Tawi-Tawi above. By count, Maguindanao del Norte (13,767 struggling readers) leads, ahead of Maguindanao del Sur, the largest division.
Languages of instruction
BARMM’s schools report 6 language groups in the table, led by Tagalog (46% of schools).
| Language of instruction | Schools | Learners | Share struggling | At Grade Level |
|---|---|---|---|---|
| Tagalog | 682 | 101,380 | 24.4% | 29.7% |
| Meranaw | 332 | 38,020 | 14.3% | 36.6% |
| Magindanawn | 291 | 48,445 | 25.1% | 31.6% |
| Yakan | 53 | 5,679 | 21.4% | 28.1% |
| Bahasa Sug | 51 | 6,043 | 33.1% | 20.6% |
| Other | 45 | 6,342 | 42.2% | 15.6% |
Meranaw schools, centered on Lanao del Sur, have the lowest share struggling; Bahasa Sug schools and the small group of other languages the highest. Languages track places closely, so the table describes communities as much as languages.
Grade 2 learners are assessed in both their Mother Tongue and Filipino; BARMM’s share at grade level in Filipino is +0.2 points from the Mother Tongue share, against -0.8 nationally, so Grade 2 learners here read Filipino about as well as their Mother Tongue.
Where struggling readers are concentrated in BARMM
BARMM’s 107 municipalities and cities are colored on the map by estimated share struggling, using the same seven classes as the national map.
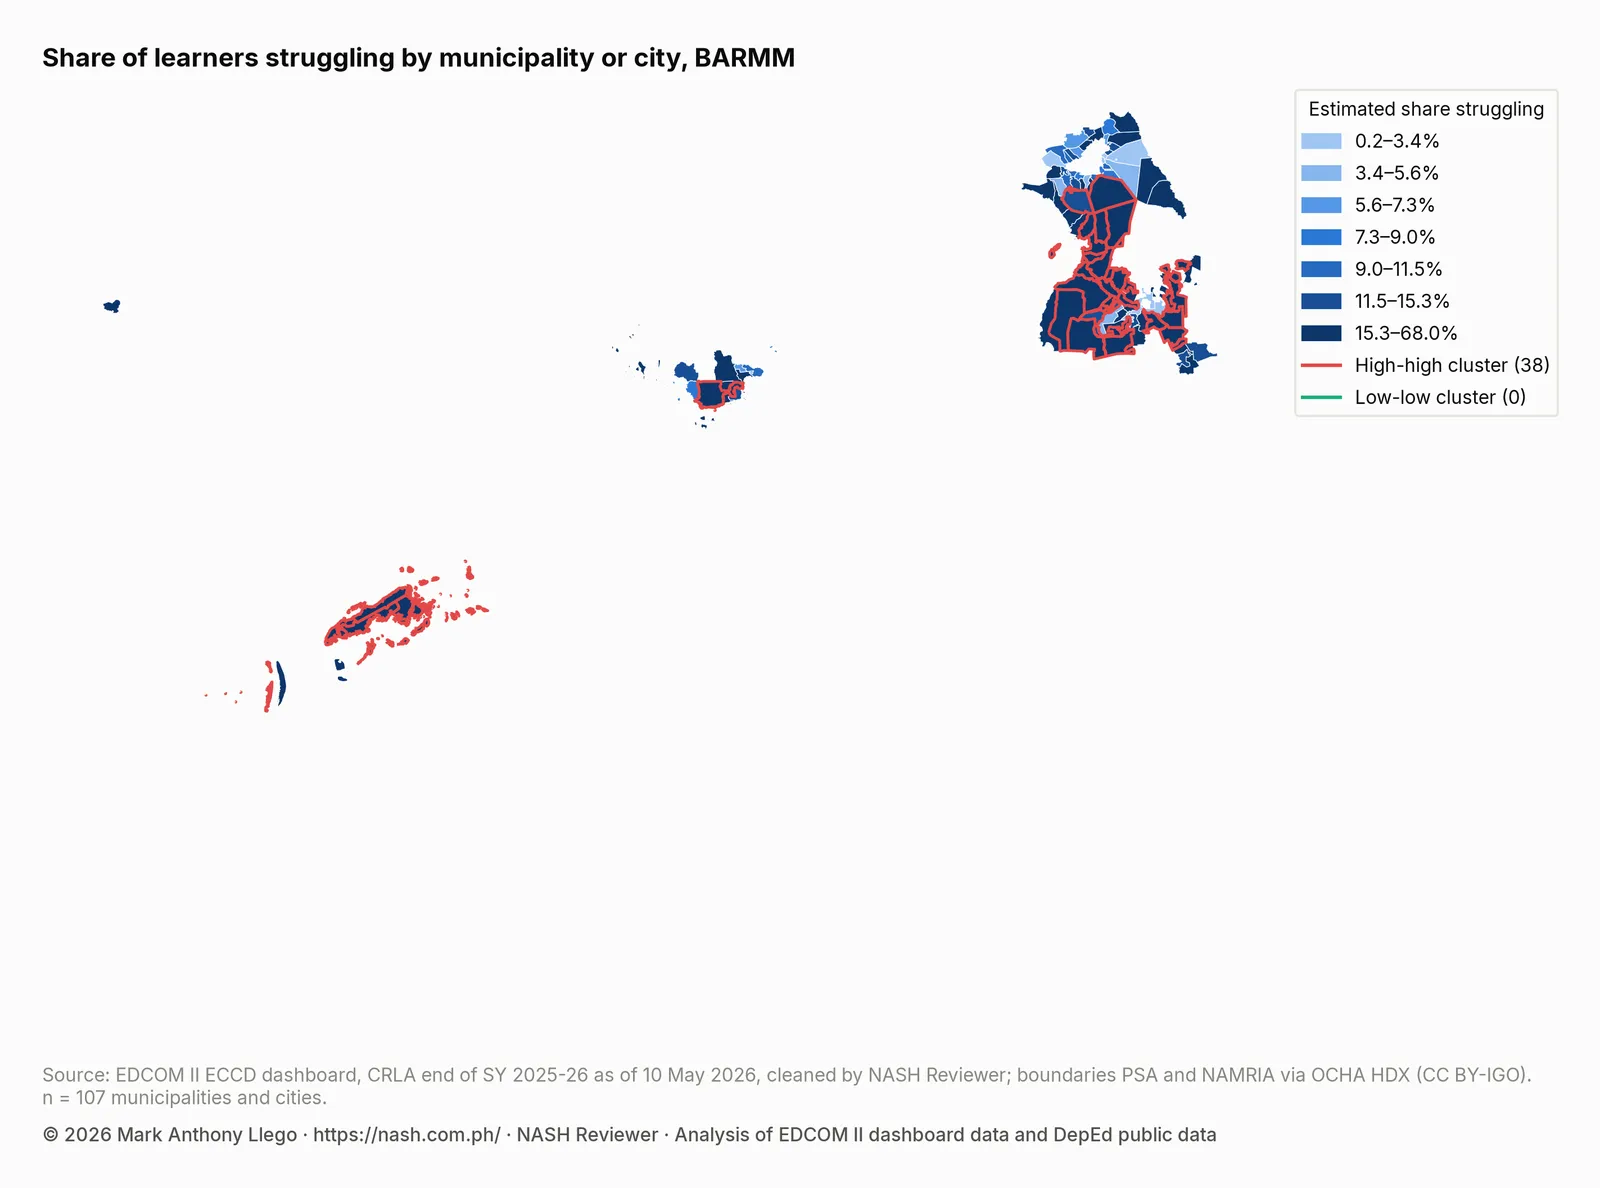
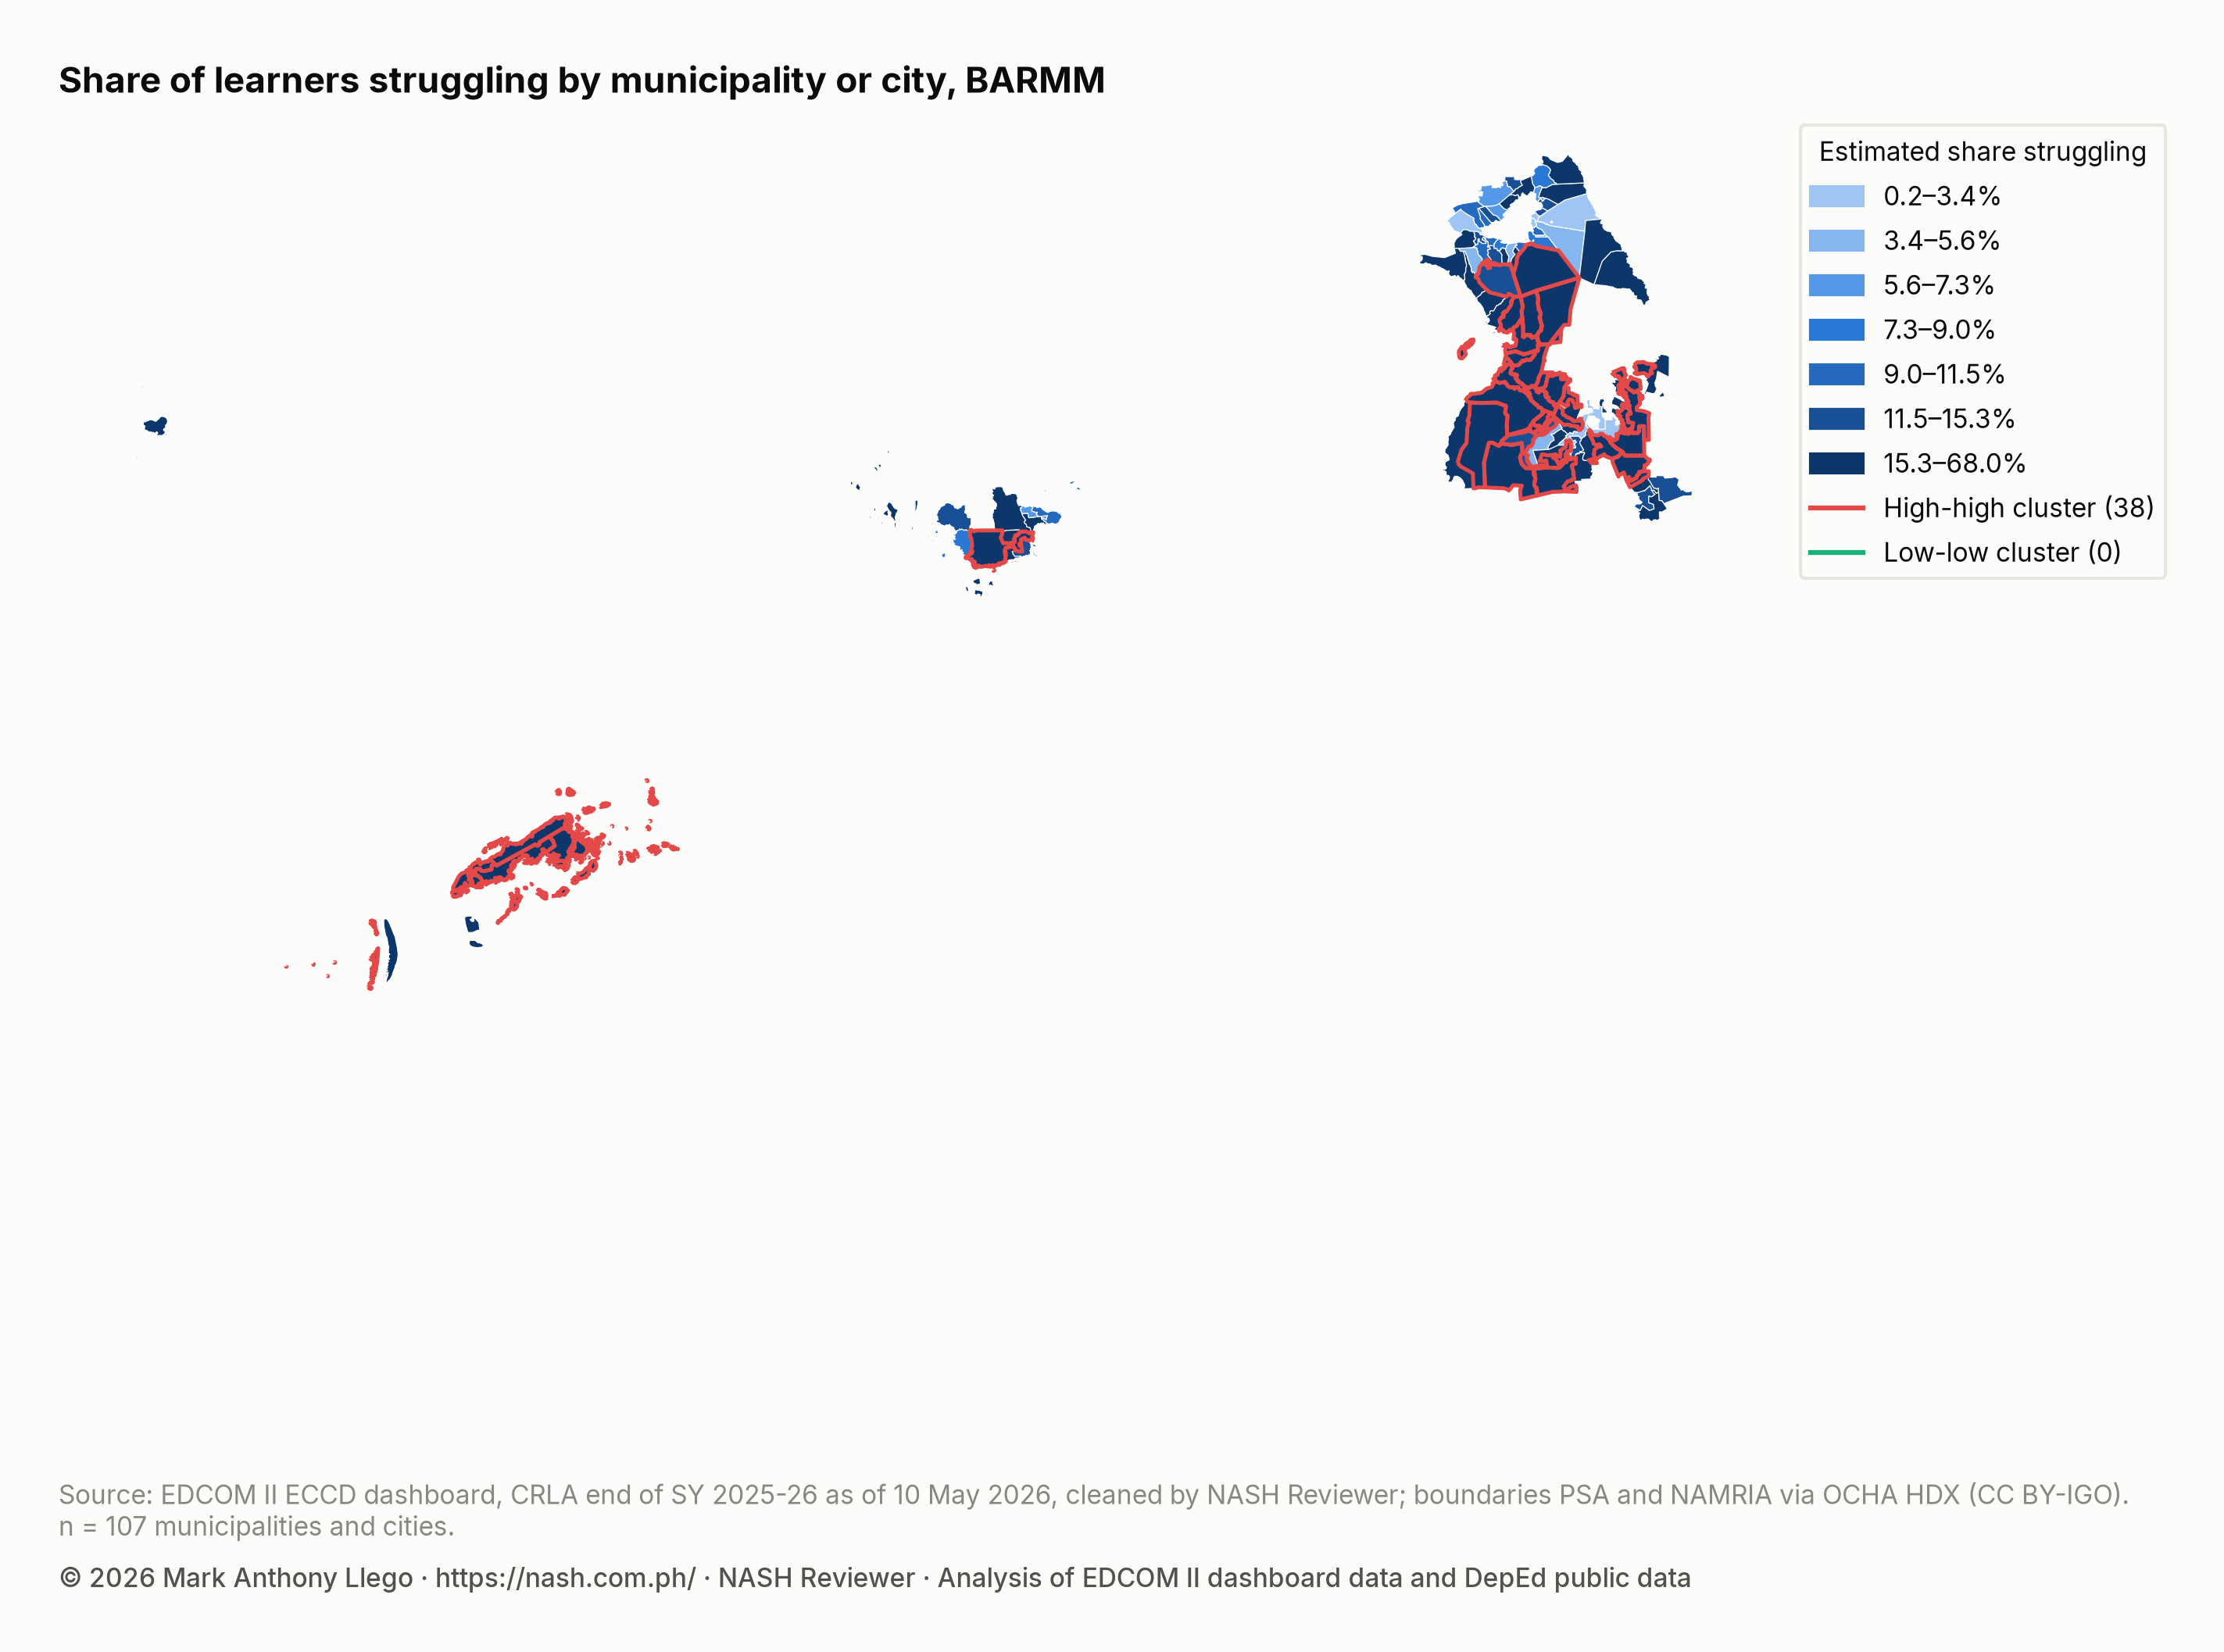
The cluster test (9,999 permutations, FDR 5%) marks a municipality high-high when its own share and its neighbors’ shares are both high, beyond what chance would produce. BARMM has 38 such municipalities and 0 low-low ones. Most form one block across Maguindanao del Norte and Maguindanao del Sur, reaching into the Special Geographic Area, with further clusters in Tawi-Tawi, Basilan and Lanao del Sur.
Counted in learners, the most struggling readers are in Cotabato City, Maguindanao del Norte (3,624); Datu Odin Sinsuat (Dinaig), Maguindanao del Norte (3,294); Sultan Kudarat (Nuling), Maguindanao del Norte (2,694); City of Lamitan, Basilan (1,888); South Upi, Maguindanao del Sur (1,654). The highest estimated shares are in Talitay, Maguindanao del Norte (68.0%); Tandubas, Tawi-Tawi (67.9%); Sibutu, Tawi-Tawi (59.3%); Sapa-Sapa, Tawi-Tawi (57.9%); Languyan, Tawi-Tawi (56.4%); Talitay’s equals the highest municipal estimate in the country (68.0%).
| Municipality or city | Province | Struggling readers | Learners | Estimated share struggling | Cluster |
|---|---|---|---|---|---|
| Cotabato City | Maguindanao del Norte | 3,624 | 13,644 | 26.5% | High-high |
| Datu Odin Sinsuat (Dinaig) | Maguindanao del Norte | 3,294 | 9,047 | 36.4% | High-high |
| Sultan Kudarat (Nuling) | Maguindanao del Norte | 2,694 | 6,746 | 39.9% | High-high |
| City of Lamitan | Basilan | 1,888 | 6,909 | 27.3% | No cluster |
| South Upi | Maguindanao del Sur | 1,654 | 4,329 | 38.1% | High-high |
These are findings about places: they show where struggling readers are most numerous or most common, not how any child or school is doing.
Early childhood: stunting and day care centers
Operation Timbang Plus 2025 measured 136,236 children aged 0–2 in BARMM, and 5.5% were stunted, or too short for their age, against 4.3% nationally. Stunting is highest in the island provinces, Basilan (13.9%); Tawi-Tawi (15.1%), both at least one and a half times the national share.
Day care coverage is BARMM’s largest early-childhood gap. On the DILG community-based monitoring list shown on the EDCOM II dashboard, 784 of 2,183 barangays have no child development center (CDC), or 35.9%, against 10.9% nationally. Lanao del Sur has the largest number.
| Province or highly urbanized city | Children 0–2 measured | Stunted | Barangays without a CDC | Learners struggling |
|---|---|---|---|---|
| Basilan | 13,447 | 13.9% | 90 of 210 | 22.1% |
| Lanao del Sur | 37,316 | 4.7% | 488 of 1,164 | 12.9% |
| Maguindanao del Norte | 35,692 | 3.1% | 68 of 258 | 32.2% |
| Maguindanao del Sur | 34,193 | 3.2% | 84 of 287 | 22.9% |
| Special Geographic Area | 7,237 | 4.5% | 5 of 63 | 29.5% |
| Tawi-Tawi | 8,351 | 15.1% | 49 of 201 | 46.3% |
Tawi-Tawi has both the highest stunting share and the highest share struggling in the table. The two describe different children, toddlers in 2025 and learners in Grades 1–3, so the match points to places facing several needs at once, not to one explaining the other. The same two measures are compared across the country in Stunting, Day Care Centers and Early Reading. Education in the Bangsamoro covers EDCOM II’s findings on nutrition, early childhood services and learning in BARMM, and what it recommends.
School resources
The inputs come from DepEd’s SY 2023-24 school files and so describe BARMM’s schools two school years before the CRLA. In the table, the ratios belong to the median elementary school and the other rows give the share of schools with each facility, beside the country’s figures.
| School input (SY 2023-24) | BARMM | Philippines |
|---|---|---|
| Learners per teacher (elementary) | 30.3 | 22.8 |
| Learners per classroom (elementary) | 44.7 | 25.8 |
| Schools with internet | 75.8% | 76.3% |
| Schools with electricity | 93.3% | 97.6% |
| Schools with a water supply | 95.0% | 97.8% |
| Schools with no functional toilet | 18.9% | 2.3% |
| Schools with multigrade classes | 10.7% | 15.3% |
Crowding and toilets set BARMM apart: the median school has 30.3 learners per teacher (national 22.8) and 44.7 per classroom (national 25.8), and 18.9% of schools have no functional toilet. Internet is close to the national share.
BARMM’s own model sets each school beside others in its division and gives an odds ratio per input, above 1 for more struggling readers and below 1 for fewer. BARMM’s schools vary far more than chance alone would produce, so the intervals are quasi-binomial: binomial standard errors widened by that extra spread. 4 terms come out with an interval that excludes 1: learners per teacher: odds ratio 1.08 (1.01–1.16); multigrade classes: odds ratio 0.72 (0.55–0.94); urban barangay: odds ratio 0.84 (0.71–0.998); income class 3rd: odds ratio 0.77 (0.63–0.93). The income term compares third-class municipalities with first-class ones.
As in the national model, schools with more learners per teacher have more struggling readers. The rest are BARMM’s own, since each national interval includes 1: multigrade classes; urban barangay; income class 3rd. Schools offering multigrade classes, schools in urban barangays and schools in third-class municipalities had fewer struggling readers than others in their division. The urban interval ends just below 1 and the other upper limits are not far below it, so these are weak, region-specific patterns rather than settled findings. Readers can compare these with the national model in School Resources and CRLA Reading Results.
School heads
In DepEd’s SY 2023-24 personnel file, 27.4% of BARMM’s schools report a School Principal position, against 40.7% nationally, and 63.6% report no head position, so most schools are run by a teacher-in-charge or officer-in-charge. The raw shares barely differ: 23.1% of learners struggle in schools with a principal and 23.7% in schools without one, before any adjustment. For a national comparison that matches similar schools, see CRLA Results in Schools With and Without a Principal.
Programs recorded in BARMM
The EDCOM II list of partner programs records 3 in BARMM, 3.0% of the list, while the region holds 9.5% of the country’s struggling readers. They are Stunting Prevention Program (1); Supplementary Feeding (0-2yo) (1); CDC Facility Upgrade (1); none is a literacy program. The list is what NGOs and corporate foundations reported, not a census. Literacy and Nutrition Programs Compared With Need sets each region’s share of programs beside its share of need.
What this means for school heads in BARMM
Grade 1 comes first: with so many learners at Low Emerging, daily small-group practice in letter sounds and word reading reaches the children furthest behind.
In every Grade 2 and Grade 3 block, Transitioning is the most common level, ahead of grade level; fluency and comprehension work in each assessed language is the next step.
Schools in high-high municipalities share the need with their neighbors, which makes district learning action cells and shared materials practical. Crowded classrooms and missing toilets belong in the school improvement plan alongside reading, and the barangay is a partner for day care and nutrition.
How these numbers were made
BARMM’s numbers are public school CRLA results from the EDCOM II early-childhood (ECCD) dashboard for the end of SY 2025-26, as of 10 May 2026. Every learner is counted in one block only (Grade 1 Mother Tongue, Grade 2 Filipino or Grade 3 English), with Low Emerging and High Emerging counted as struggling. The 18 regions follow the PSGC, with Sulu in Region IX. Because the CRLA reaches nearly every learner, BARMM’s own shares are population figures and are given without sampling intervals. Details of the estimates are in How to Read a School’s CRLA Results Fairly, with the full method in CRLA End-of-Year Results SY 2025-26: All 18 Regions.
Limits
Every pattern here is an association between places or schools, and the school inputs and heads describe SY 2023-24. 313 BARMM schools report no struggling readers, against 226 expected from normal variation between the region’s schools (a ratio of 1.39). Some zeros are genuine, but the surplus is a reason to check how results were recorded, not an accusation (CRLA Schools With No Struggling Readers: A Data Check).
Frequently asked questions
Do BARMM’s CRLA results include Sulu?
No. Following the Supreme Court’s 2024 ruling, Sulu is counted in Region IX, so BARMM’s figures cover its other provinces, its cities and the Special Geographic Area.
Which BARMM division has the highest share of struggling readers?
Tawi-Tawi (46.3%), the highest of all 232 divisions. The division with the most struggling readers is Maguindanao del Norte (13,767 struggling readers).
Which municipalities in BARMM have the most struggling readers?
By number, the five with the most are Cotabato City, Maguindanao del Norte (3,624); Datu Odin Sinsuat (Dinaig), Maguindanao del Norte (3,294); Sultan Kudarat (Nuling), Maguindanao del Norte (2,694); City of Lamitan, Basilan (1,888); South Upi, Maguindanao del Sur (1,654). The highest estimated shares are in Tawi-Tawi and Maguindanao del Norte.
Download the data
The cleaned EDCOM II dashboard data behind this series are free to download for personal study; to reuse them, email support@nash.com.ph for written permission first. How the EDCOM Dashboard Data Was Cleaned explains every table and cleaning rule. The files are at data.nash.com.ph: start with the README, then the school table with CRLA results and school inputs (Parquet), the school estimates (CSV), the division estimates (CSV) and the municipal table (CSV). The DepEd school files used for school inputs are described in Download Cleaned DepEd School Data.
Every file, with its rows, columns and checksum, is listed on the EDCOM II CRLA data page. To cite the data: Llego, M. A. (2026). EDCOM II early-childhood dashboard data, cleaned, version 1. NASH Reviewer. https://nash.com.ph/edcom-data
More in this series
- CRLA End-of-Year Results SY 2025-26: All 18 Regions
- CRLA Start vs End of SY 2025-26 in the Same Schools
- CRLA by Language: Mother Tongue, Filipino and English
- How to Read a School’s CRLA Results Fairly
- CRLA Variation: School, Division or Region?
- Where Struggling Readers Are Concentrated
- School Resources and CRLA Reading Results
- CRLA Results in Schools With and Without a Principal
- Action Research and Thesis Topics on Reading (CRLA)
- CRLA Reading Hotspots: A Map of Struggling Readers
- Stunting, Day Care Centers and Early Reading
- Literacy and Nutrition Programs Compared With Need
- CRLA Schools With No Struggling Readers: A Data Check
- How the EDCOM Dashboard Data Was Cleaned
- Regional reports: NCR, CAR, Region I, Region II, Region III, Region IV-A, MIMAROPA, Region V, Region VI, NIR, Region VII, Region VIII, Region IX, Region X, Region XI, Region XII, Caraga, BARMM
- Earlier reports: CRLA Results SY 2025-2026 (DepEd’s selected-school file), Do the Same DepEd Schools Lag on the ELLNA, NAT and CRLA?, DepEd School Inputs vs Test Results, EDCOM II Final Report: Guide for Aspiring School Heads, DepEd Data for Aspiring School Heads: Where to Start
Analysis and charts by Mark Anthony Llego for NASH Reviewer. Data: EDCOM II early-childhood dashboard and Department of Education public datasets. NASH Reviewer is not affiliated with EDCOM II or DepEd. Charts may be reused only with written permission from support@nash.com.ph.