The EDCOM II Final Report describes the schools that teachers preparing for the National Assessment for School Heads (NASH), formerly the National Qualifying Examination for School Heads (NQESH), will lead. Below, its claims about the learning crisis, classrooms, teachers and the 48% of schools without a principal are set against DepEd’s public datasets, from the eleven data reports in this series.
The Second Congressional Commission on Education, EDCOM II (also written EDCOM 2), was created by Republic Act No. 11899. Its task is to assess the whole Philippine education sector and recommend reforms to Congress. Its Year One Report (2024) diagnosed the system, and its Year Two Report (2025) argued for fixing the foundations. Its Final Report, Turning Point: A Decade of Necessary Reform (2026-2035), was published in January 2026. It sets out a National Education Plan 2035 with twenty priority reforms. One of the twenty is to “recruit and develop quality school leaders and administrators”. If you are preparing for the NASH, that reform is about your future job.
An aspiring school head needs three things from the Final Report. The first is the findings that describe the school you will lead. The second is the policies you will be expected to know under the Philippine Professional Standards for School Heads (PPSSH). The third is the targets your school will be measured against.
The datasets are themselves part of what EDCOM reports. The report credits Project BUKAS, launched in September 2025, with the first public release of school-level data. That first rollout covered exactly the five regions whose assessment results appear in this guide.
Key findings
- The learning crisis is measured, not assumed. EDCOM cites DepEd’s own assessments. On the end-of-year Comprehensive Rapid Literacy Assessment (CRLA) of SY 2024-2025, 48.76% of Grade 1 to 3 learners were not reading at grade level. On the Early Language, Literacy, and Numeracy Assessment (ELLNA), 69.5% of Grade 3 learners were not proficient. On the National Achievement Test (NAT), only 19.56% of Grade 6, 0.74% of Grade 10 and 0.4% of Grade 12 learners were proficient. In the public school-level files, the Grade 3 ELLNA mean is 63.2 and the Grade 6 NAT mean is 60.3, both below the 75-point proficiency mark.
- Nearly half of schools have no principal item. EDCOM counts 18,576 schools (48%) without a School Principal plantilla item in SY 2024-2025, and 12,057 more with the wrong school-head item. DepEd’s SY 2023-2024 personnel file shows a similar pattern: 43.4% of public schools report a School Principal position, 27.7% a head teacher only, and 28.5% no school-leadership position at all.
- The plan is one principal for every school by 2028. The baseline is 23,661 schools with Principal I to IV items (52%). DepEd is to add 6,000 items in 2026, 8,000 in 2027 and 8,124 in 2028. A first-time principal appointed to one of these items must have passed a DepEd school head assessment, now the NASH.
- Classrooms, teachers and money are the other three problems. The report counts a backlog of 165,443 classrooms, 2,233 schools on double or triple shifts, and 123,000 buildings past their 25-year design life. Nearly half of teachers worked over 50 hours a week, about 18 of them on ancillary tasks, in a mid-2024 survey taken after DepEd Order No. 002, s. 2024 had moved administrative tasks to school heads and support staff. Of school Maintenance and Other Operating Expenses (MOOE), 30% to 70% goes to utility bills.
- The report asks for the school head’s job to be redefined. It recommends an Instructional Leadership Framework and a revised Office Performance Commitment and Review Form (OPCRF) that puts classroom observation and coaching ahead of compliance. It also recommends revised staffing standards to replace the 1997 guidelines, and a Principals Academy under the National Educators Academy of the Philippines (NEAP).
What EDCOM II is and why it matters for the NASH
EDCOM II is a congressional commission, not a DepEd office. Its reports carry no legal force of their own, but they shape the laws and budgets that do. The Final Report’s table of collective accomplishments for 2023 to 2025, which it credits to the Commission, Congress, the President and the education agencies together, lists ten laws passed. Three of its entries concern teachers’ careers and workload. The first is the passage of Republic Act No. 12288, the Career Progression System for Public School Teachers and School Leaders Act, on September 12, 2025. The second is the cut in school forms accomplished by teachers from 174 to 75 through DepEd Order No. 006, s. 2025. The third is the creation of administrative officer items.
Under DepEd Memorandum No. 069, s. 2025, the NASH “shall cover conceptual and situational critical thinking questions aligned with” the PPSSH. The first PPSSH domain, Leading Strategically, asks school heads to “identify and comprehend relevant sources of information such as existing laws, policies, research, feedback and contexts”. The EDCOM Final Report is the single most complete source of that kind now in print. It also tells you what DepEd will be held to. The National Education Plan’s targets run from 2028 to 2035, the same years as a career that begins with the NASH in 2025 or 2026.
The learning crisis in DepEd’s assessment results
The report’s executive summary opens with foundational skills. On the CRLA at the end of SY 2024-2025, 48.76% of Grade 1 to 3 learners were not reading at grade level. The report’s own target table gives 47.74% at grade level for the same assessment and year (2,604,392 of 5,455,581 learners), which leaves 52.26% not at grade level. The report does not explain why the two figures do not add up to 100%. On the Grade 3 ELLNA of SY 2023-2024, at least 30.5% of learners were proficient or highly proficient, and 69.5% were not. DepEd treats the “nearly proficient” level, which is part of that 69.5%, as meeting minimum skills.
The share of proficient learners on the NAT falls at each later grade tested. By Grade 6 only 19.56% were proficient. By Grade 10 the share was 0.74%, and by Grade 12 it was 0.4% of 1,611,809 test-takers. The 2024 Southeast Asia Primary Learning Metrics placed 52% of Filipino Grade 5 learners in the two lowest reading bands, down from 56% in 2019. In the same study, 28% of learners had repeated a grade, and access to an individual reading textbook fell from 74% to 54%.
The public school-level files cover a selected set of schools in five regions (CAR, Region I, Region III, Region VIII and Region IX), so they cannot reproduce national rates. They can show the problem school by school. The test-taker-weighted Grade 3 ELLNA mean is 63.2 and the Grade 6 NAT mean is 60.3. No regional subject mean reaches 75. Numeracy is the weakest ELLNA component in every region, and Science is the weakest NAT subject. Twenty-four percent of ELLNA test-takers and 27% of NAT test-takers attend a school whose mean falls in the Low Proficient band.
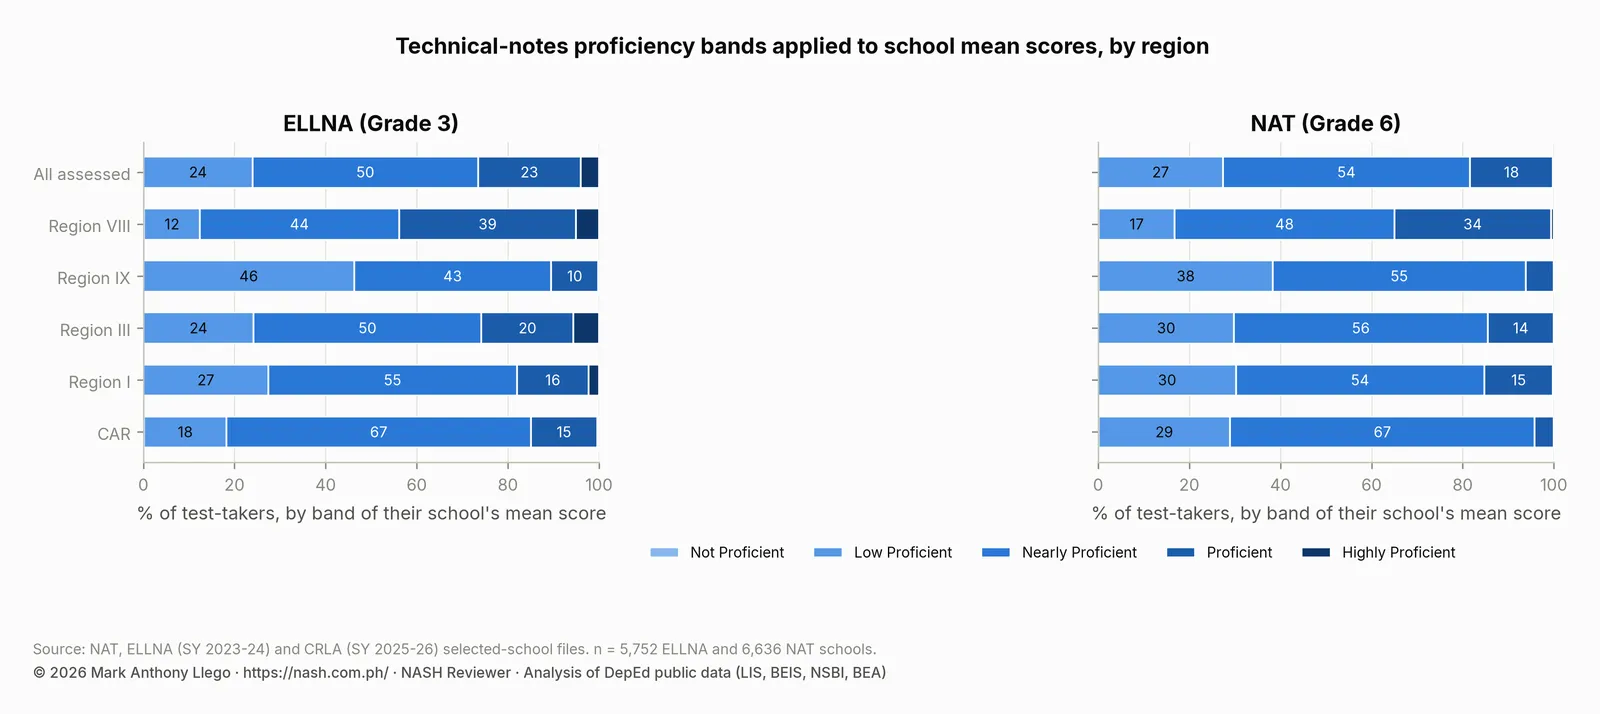
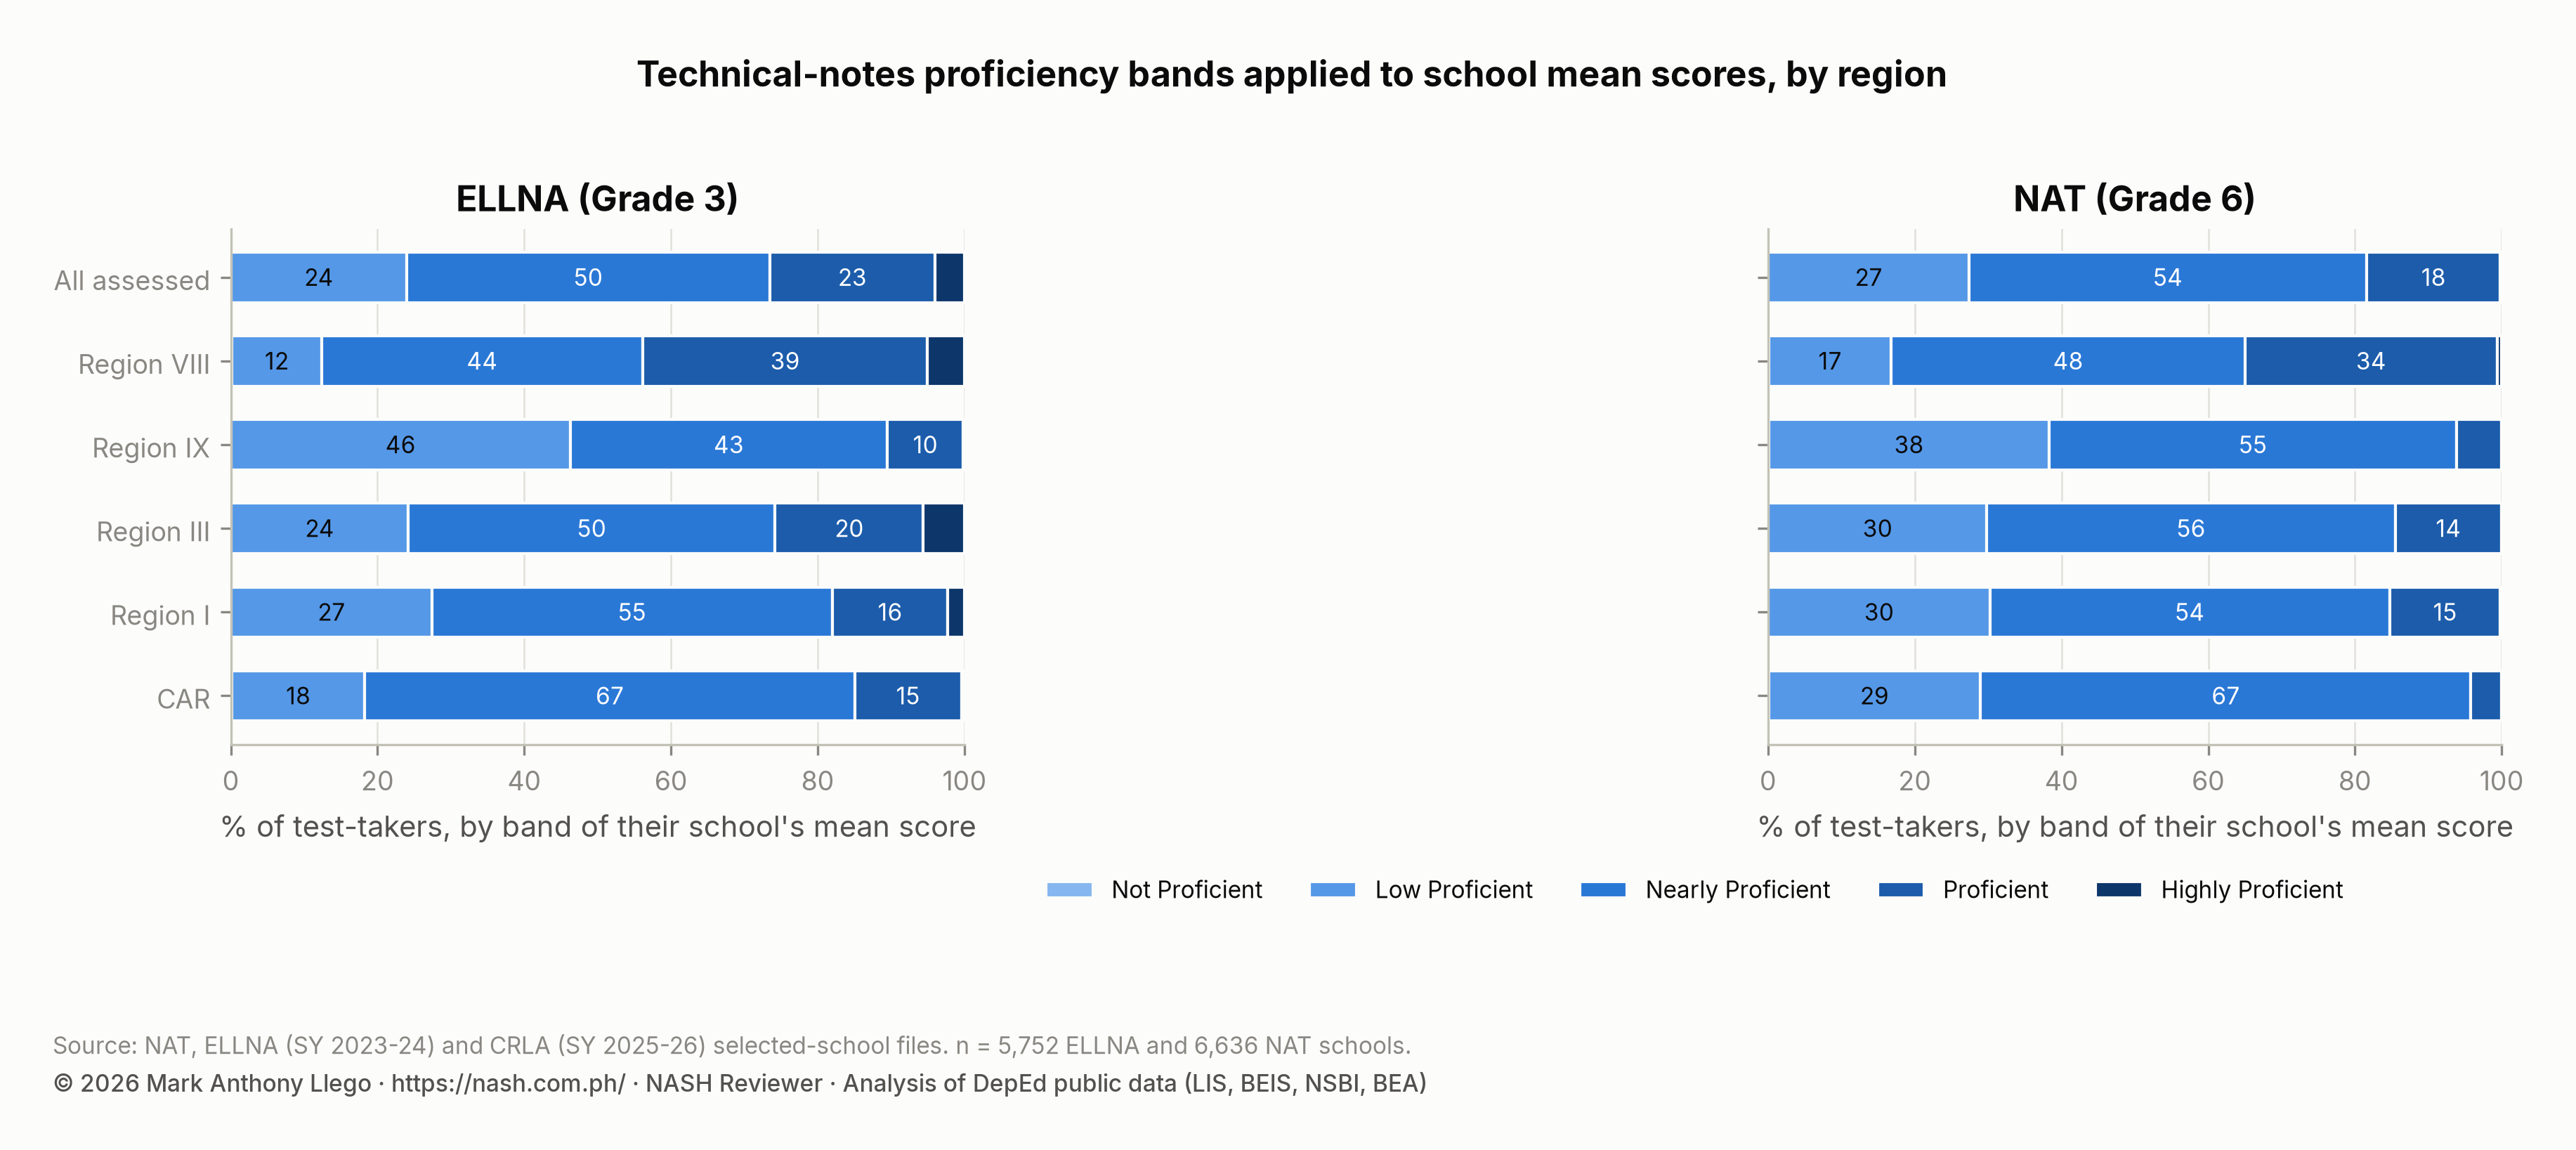
The table gives the Grade 6 NAT shares by region.
| Region | Not Proficient | Low Proficient | Nearly Proficient | Proficient | Highly Proficient |
|---|---|---|---|---|---|
| CAR | 0.1% | 28.9% | 66.8% | 4.2% | 0.0% |
| Region I | 0.0% | 30.2% | 54.5% | 15.1% | 0.2% |
| Region III | 0.0% | 29.8% | 55.7% | 14.5% | 0.0% |
| Region IX | 0.1% | 38.3% | 55.5% | 6.2% | 0.0% |
| Region VIII | 0.1% | 16.7% | 48.2% | 34.3% | 0.6% |
| All assessed | 0.0% | 27.3% | 54.3% | 18.2% | 0.2% |
The CRLA file for SY 2025-2026 shows the early grades. In the assessed schools, 15.7% of 647,681 Grade 1 to 3 learners read at grade level, and 30.3% are at the lowest level, “low emerging”. In Grade 1 mother tongue, 5.3% read at grade level. These shares are far below EDCOM’s 47.74% national end-of-year baseline, but the two should not be compared directly. The public file is a selected set of schools, and its administration date within the year is not stated. Both sources agree on one point: the gap is widest in Grade 1 and still large at the end of Key Stage 1.
PISA, TIMSS, SEA-PLM and the NAT covers these results in depth, with PISA and TIMSS.
DepEd assessments: too many, too slow, not aligned
Priority Area 6 of the report finds a system that is “over-assessed but under-informed”. DepEd administers 14 national and classroom-based assessments, against an average of four in the Organisation for Economic Co-operation and Development (OECD). Many of them “measure similar constructs but are not psychometrically linked”, and, citing a Philippine Institute for Development Studies study, the report says “results across these assessments cannot be meaningfully compared or used to validate each other”. Results have often arrived two to three years late, although one testing coordinator reported receiving the SY 2022-2023 results by December 2023. The Bureau of Education Assessment lacks the staff to run equating and longitudinal studies.
The report recommends an independent assessment body, fewer key-stage tests delivered by computer, and a reformed grading system. It also asks for a unified framework linking the CRLA, the Philippine Informal Reading Inventory (Phil-IRI), the ELLNA and the NAT. It wants equity reporting for Last Mile, Indigenous Peoples (IP), Pantawid Pamilyang Pilipino Program (4Ps) and Arabic Language and Islamic Values Education (ALIVE) learners, and faster release of results through Project BUKAS.
The public files give a concrete example of the alignment problem. In the same schools, the CRLA share of learners at grade level correlates at only 0.06 with the Grade 3 ELLNA mean. The ELLNA and NAT means correlate at 0.62. Ilocos Norte is first of 44 divisions on the ELLNA and 41st on the CRLA. A school head who treats the three instruments as interchangeable measures of school quality will draw the wrong conclusions. The CRLA report for SY 2025-2026 explains why.
PISA, TIMSS, SEA-PLM and the NAT covers these findings and recommendations in depth, and Education Data, Transparency and Research covers the delays in releasing results and Project BUKAS.
Mass promotion, learning recovery and instructional time
Priority Area 7 is the one that affects a school head’s daily work most directly. The report finds that mass promotion continues in practice even though no policy requires it, and it gives two reasons. The transmutation table of DepEd Order No. 8, s. 2015 converted an initial grade of 60 to a transmuted 75 when the report was written. Promotion, completion and dropout rates are also headline metrics in the Individual Performance Commitment and Review Form (IPCRF) and the OPCRF. Teachers told the Commission that failing a learner triggers rounds of documentation and home visits. They also said that “some [principals] explicitly discourage or prohibit failing learners even when non mastery is evident”.
The report’s answer is to phase out transmutation and adopt criterion-referenced grading. It also calls for the Results-based Performance Management System (RPMS) and the OPCRF to be reconfigured “so that neither teachers nor school heads are implicitly incentivized to minimize failures or inflate grades”. DepEd has since acted on grading. DepEd Order No. 015, s. 2026 repeals DO 8, s. 2015, and its rules apply from SY 2026-2027. This school year an adjusted table requires an initial grade of 70 for a transmuted 75, and from SY 2027-2028 grades in Key Stages 2 to 4 are reported without transmutation. The guide to DO 015, s. 2026 explains the new rules.
On learning recovery, the report credits three programs: the Academic Recovery and Accessible Learning (ARAL) Program under Republic Act No. 12028, DepEd’s Summer Literacy Remediation Program, and the Bawat Bata Makababasa pilot in Region IX. An impact evaluation of the Region IX pilot found that learners gained up to 1.3 years of schooling in a 20-day remediation. Under DepEd’s national Literacy Remediation Program, 96% of low emerging readers moved up at least one level after an 18-day program. The report warns that these programs have prioritized the lowest readers and left “more than 1.6 million transitioning readers” without targeted support.
On instructional time, EDCOM’s analysis of DepEd calendars finds an average of about 191 actual class days a year, against the 205 prescribed. It counts at least 28 nationally observed activities, commemorations and contests each year. The report asks for DepEd Order No. 9, s. 2005 on engaged time on task to be enforced.
Mass Promotion and Lost Instructional Time covers both findings in depth, with the DepEd rules that now apply.
Classroom backlog and school building condition
Priority Area 8 puts the classroom backlog at 165,443 rooms for decongestion, replacement and repair. It counts 2,233 public schools on double or triple shifts, with some rooms holding 75 to more than 250 learners. Congestion is worst in NCR, Region IV-A and parts of Mindanao. Of about 330,000 school buildings, 123,000 are more than 25 years old, which is the design life set by DepEd Order No. 64, s. 2017. Almost 24,000 are more than 50 years old. About 160,000 classrooms will need condemning between 2025 and 2075.
Fifty-eight government housing projects with 167,120 units were built without planned school sites, which implies about 8,000 more classrooms. The magnitude-6.9 Cebu earthquake of September 30, 2025 alone damaged over 7,500 classrooms. From June to October 2025, calamities affected more than 10,700 schools.
The National School Building Inventory (NSBI) that the report cites is the same source as the public facilities file, and the file agrees with the report. Thirty percent of public school buildings are in good condition and 31% need minor repair. Another 29% need major repair, 7% are for condemnation and 2% are for demolition. NCR has 53% of its buildings in good condition; BARMM and Region X have 21%. The report’s claim that “in almost all regions outside NCR, fewer than 70% of school buildings are in good or minor-repair condition” holds in the file.
The same file gives the crowding figures. Nationally there are 35.1 learners per instructional room, and 55.1 in NCR. Makeshift rooms are in use at 29.1% of public schools, and 267 schools report learners but no instructional room.
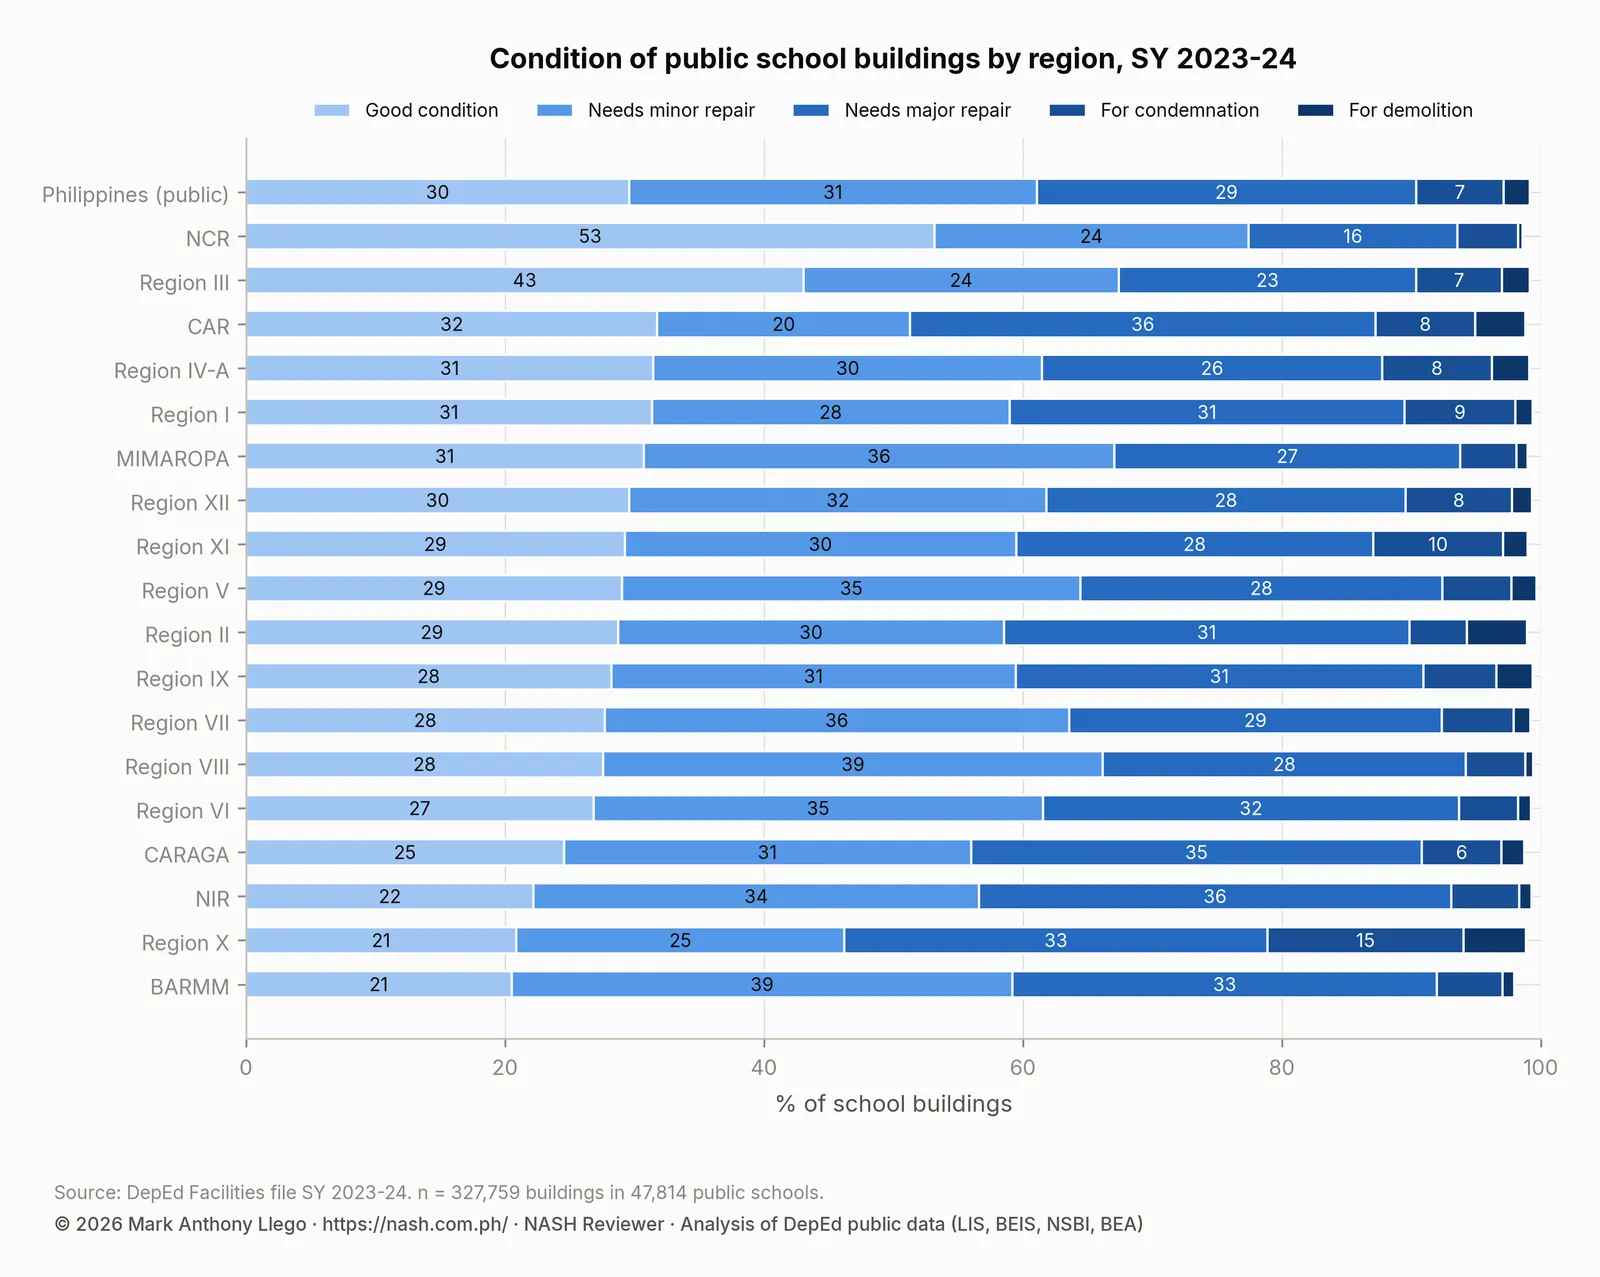
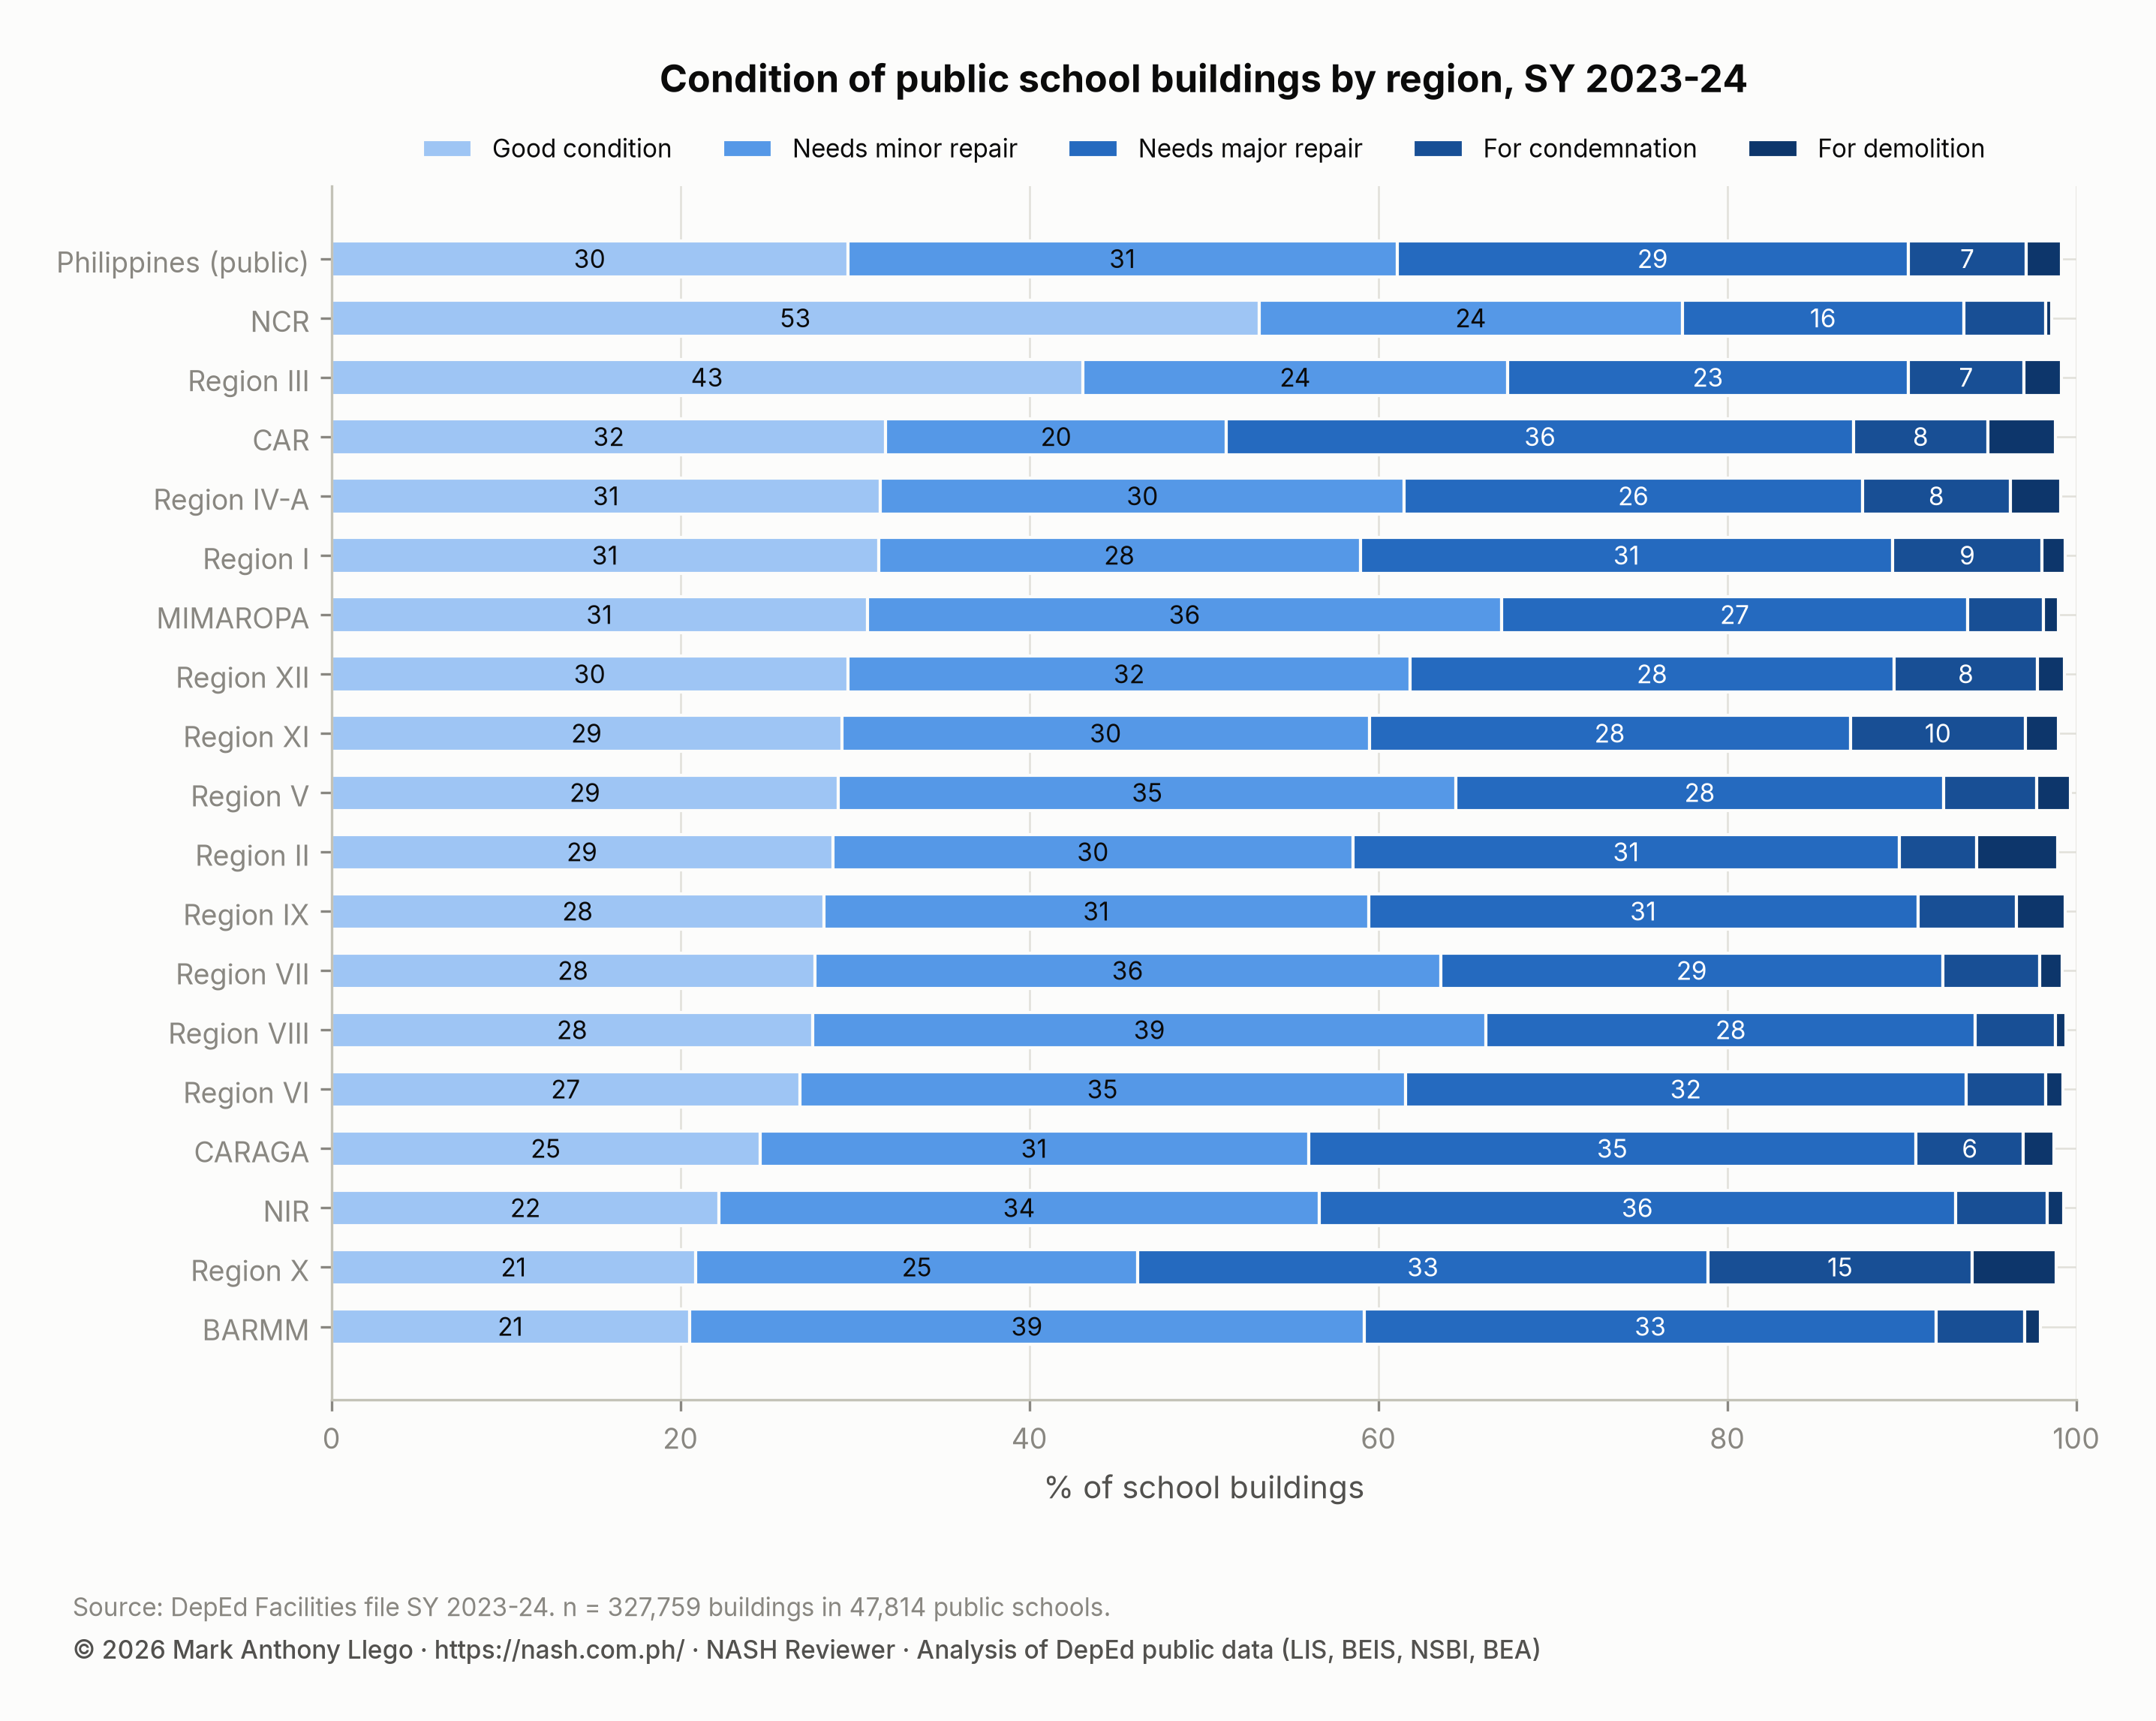
| Region | Buildings | Good condition | Needs minor repair | Needs major repair | For condemnation | For demolition | Under construction | For completion |
|---|---|---|---|---|---|---|---|---|
| BARMM | 8,728 | 20.5% | 38.7% | 32.8% | 5.1% | 0.9% | 0.6% | 1.5% |
| CAR | 8,283 | 31.8% | 19.5% | 36.0% | 7.7% | 3.9% | 0.6% | 0.6% |
| CARAGA | 13,790 | 24.6% | 31.4% | 34.8% | 6.1% | 1.7% | 0.7% | 0.6% |
| MIMAROPA | 16,123 | 30.7% | 36.4% | 26.7% | 4.3% | 0.9% | 0.3% | 0.8% |
| NCR | 4,172 | 53.2% | 24.2% | 16.1% | 4.7% | 0.4% | 0.9% | 0.5% |
| NIR | 18,377 | 22.2% | 34.4% | 36.4% | 5.3% | 0.9% | 0.4% | 0.4% |
| Region I | 21,868 | 31.4% | 27.6% | 30.5% | 8.6% | 1.3% | 0.3% | 0.3% |
| Region II | 18,230 | 28.7% | 29.8% | 31.3% | 4.4% | 4.6% | 0.4% | 0.7% |
| Region III | 30,472 | 43.1% | 24.4% | 22.9% | 6.6% | 2.2% | 0.6% | 0.2% |
| Region IV-A | 29,330 | 31.5% | 30.0% | 26.3% | 8.5% | 2.9% | 0.5% | 0.4% |
| Region IX | 16,655 | 28.2% | 31.2% | 31.5% | 5.7% | 2.8% | 0.4% | 0.3% |
| Region V | 29,092 | 29.1% | 35.4% | 28.0% | 5.3% | 1.9% | 0.2% | 0.1% |
| Region VI | 20,787 | 26.8% | 34.7% | 32.1% | 4.6% | 1.0% | 0.3% | 0.5% |
| Region VII | 18,559 | 27.7% | 35.9% | 28.8% | 5.6% | 1.3% | 0.3% | 0.5% |
| Region VIII | 23,923 | 27.6% | 38.6% | 28.0% | 4.6% | 0.6% | 0.4% | 0.2% |
| Region X | 17,730 | 20.9% | 25.3% | 32.7% | 15.1% | 4.8% | 0.6% | 0.5% |
| Region XI | 16,316 | 29.2% | 30.2% | 27.6% | 10.0% | 1.9% | 0.4% | 0.6% |
| Region XII | 15,324 | 29.6% | 32.2% | 27.7% | 8.2% | 1.6% | 0.3% | 0.3% |
| Philippines (public) | 327,759 | 29.6% | 31.5% | 29.3% | 6.8% | 2.0% | 0.4% | 0.4% |
Teachers and their workload
Priority Area 18 records that teachers were carrying more than 50 ancillary tasks. Nearly half worked over 50 hours a week, about 18 of them on ancillary duties. DepEd Order No. 002, s. 2024 “mandated the immediate removal of administrative tasks from public school teachers, and transferred these responsibilities to school heads and non-teaching personnel”. For an aspiring school head, the second half of that sentence matters most: the tasks moved to you.
The 2025 budget funded 10,000 administrative officer and support positions. DepEd’s proposed School Organizational Structure and Staffing Standards still show gaps of 12,078 Administrative Officer II items and 44,285 Project Development Officer I items. The report also asks DepEd and the Civil Service Commission (CSC) to move the master’s degree requirement from Master Teacher I to a later step. Its reason is that teachers choose the School Administration line only after reaching Master Teacher I. DepEd’s current qualification standards still require the master’s degree for Master Teacher I (ECP Qualification Standards Under DO 019, s. 2025).
The SY 2023-2024 personnel file shows the teachers you will lead. It records 909,348 teachers for 23.2 million public-school learners, or 25.5 learners per teacher nationally and 30.0 in BARMM. Master teachers are 7.6% of nationally funded teachers, and 2.6% in BARMM. Teacher I to III positions make up 91% of elementary and 92% of junior high school positions, and in senior high school 60.8% of positions are Teacher II. The SY 2023-2024 personnel report has the detail.
Teacher Workload and Accountability covers EDCOM II’s workload findings in depth, with what has changed since 2024.
The principal shortage: schools without a principal item
This is the report’s finding about your future job. Based on SY 2024-2025 data, 18,576 schools, or 48% of all schools, “have no principal items and rely on teachers-in-charge”. Another 12,057 schools have school-head items that do not follow DepEd’s own 1997 deployment policy. The governance chapter says “perhaps no indicator more starkly” reveals the gap between policy and practice. It quotes Education Secretary Br. Andrew Gonzales in 1999: “I don’t know how you can run a school without a principal.” Republic Act No. 9155 gives school heads twelve functions, from curriculum implementation to community engagement, and the PPSSH turns those into 34 strands.
The National Education Plan sets the remedy as targets. Recommendation 6.1.2.a raises the share of schools with School Principal plantilla positions from 52% (23,661 schools, June 2025) to 100% by 2028. It does this by adding 6,000 items in 2026, 8,000 in 2027 and 8,124 in 2028, on the new staffing standard of one principal per DepEd-managed school. Recommendation 6.1.2.b sets a target of 100% for the occupancy rate, which is 94.35%, or 22,320 of 23,661 items filled. Recommendation 6.1.2.c sets a target of 33% of principals meeting school-based management competencies by 2028, about 5,036 a year, “pending the establishment of DepEd’s Principals Academy”.
The report’s teacher-education recommendations add four more items. Recommendation 7 asks that “the over 21,800 schools without a principal have dedicated school heads”. Recommendation 8 asks for an Instructional Leadership Framework. Recommendation 9 asks for an OPCRF that puts “classroom observation, teacher coaching, and curriculum implementation” first, and recommendation 10 asks for revised staffing standards.
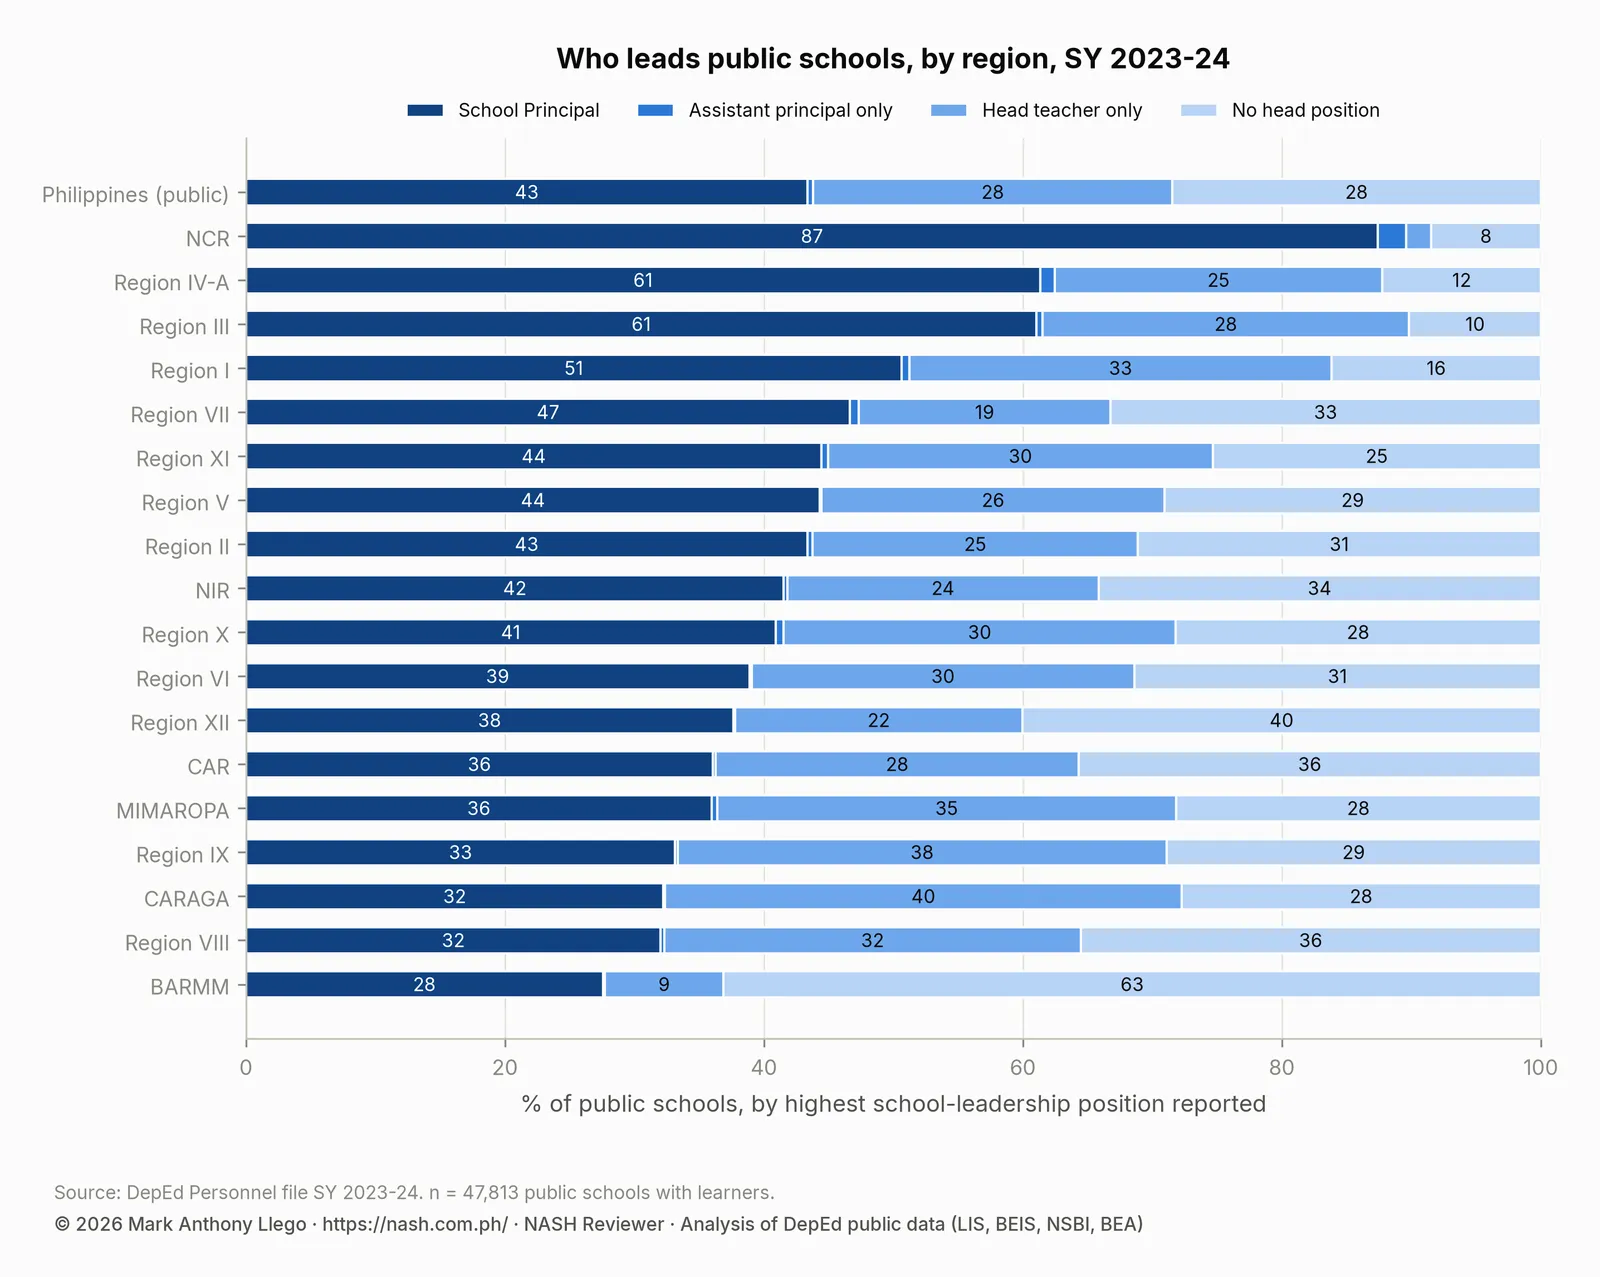
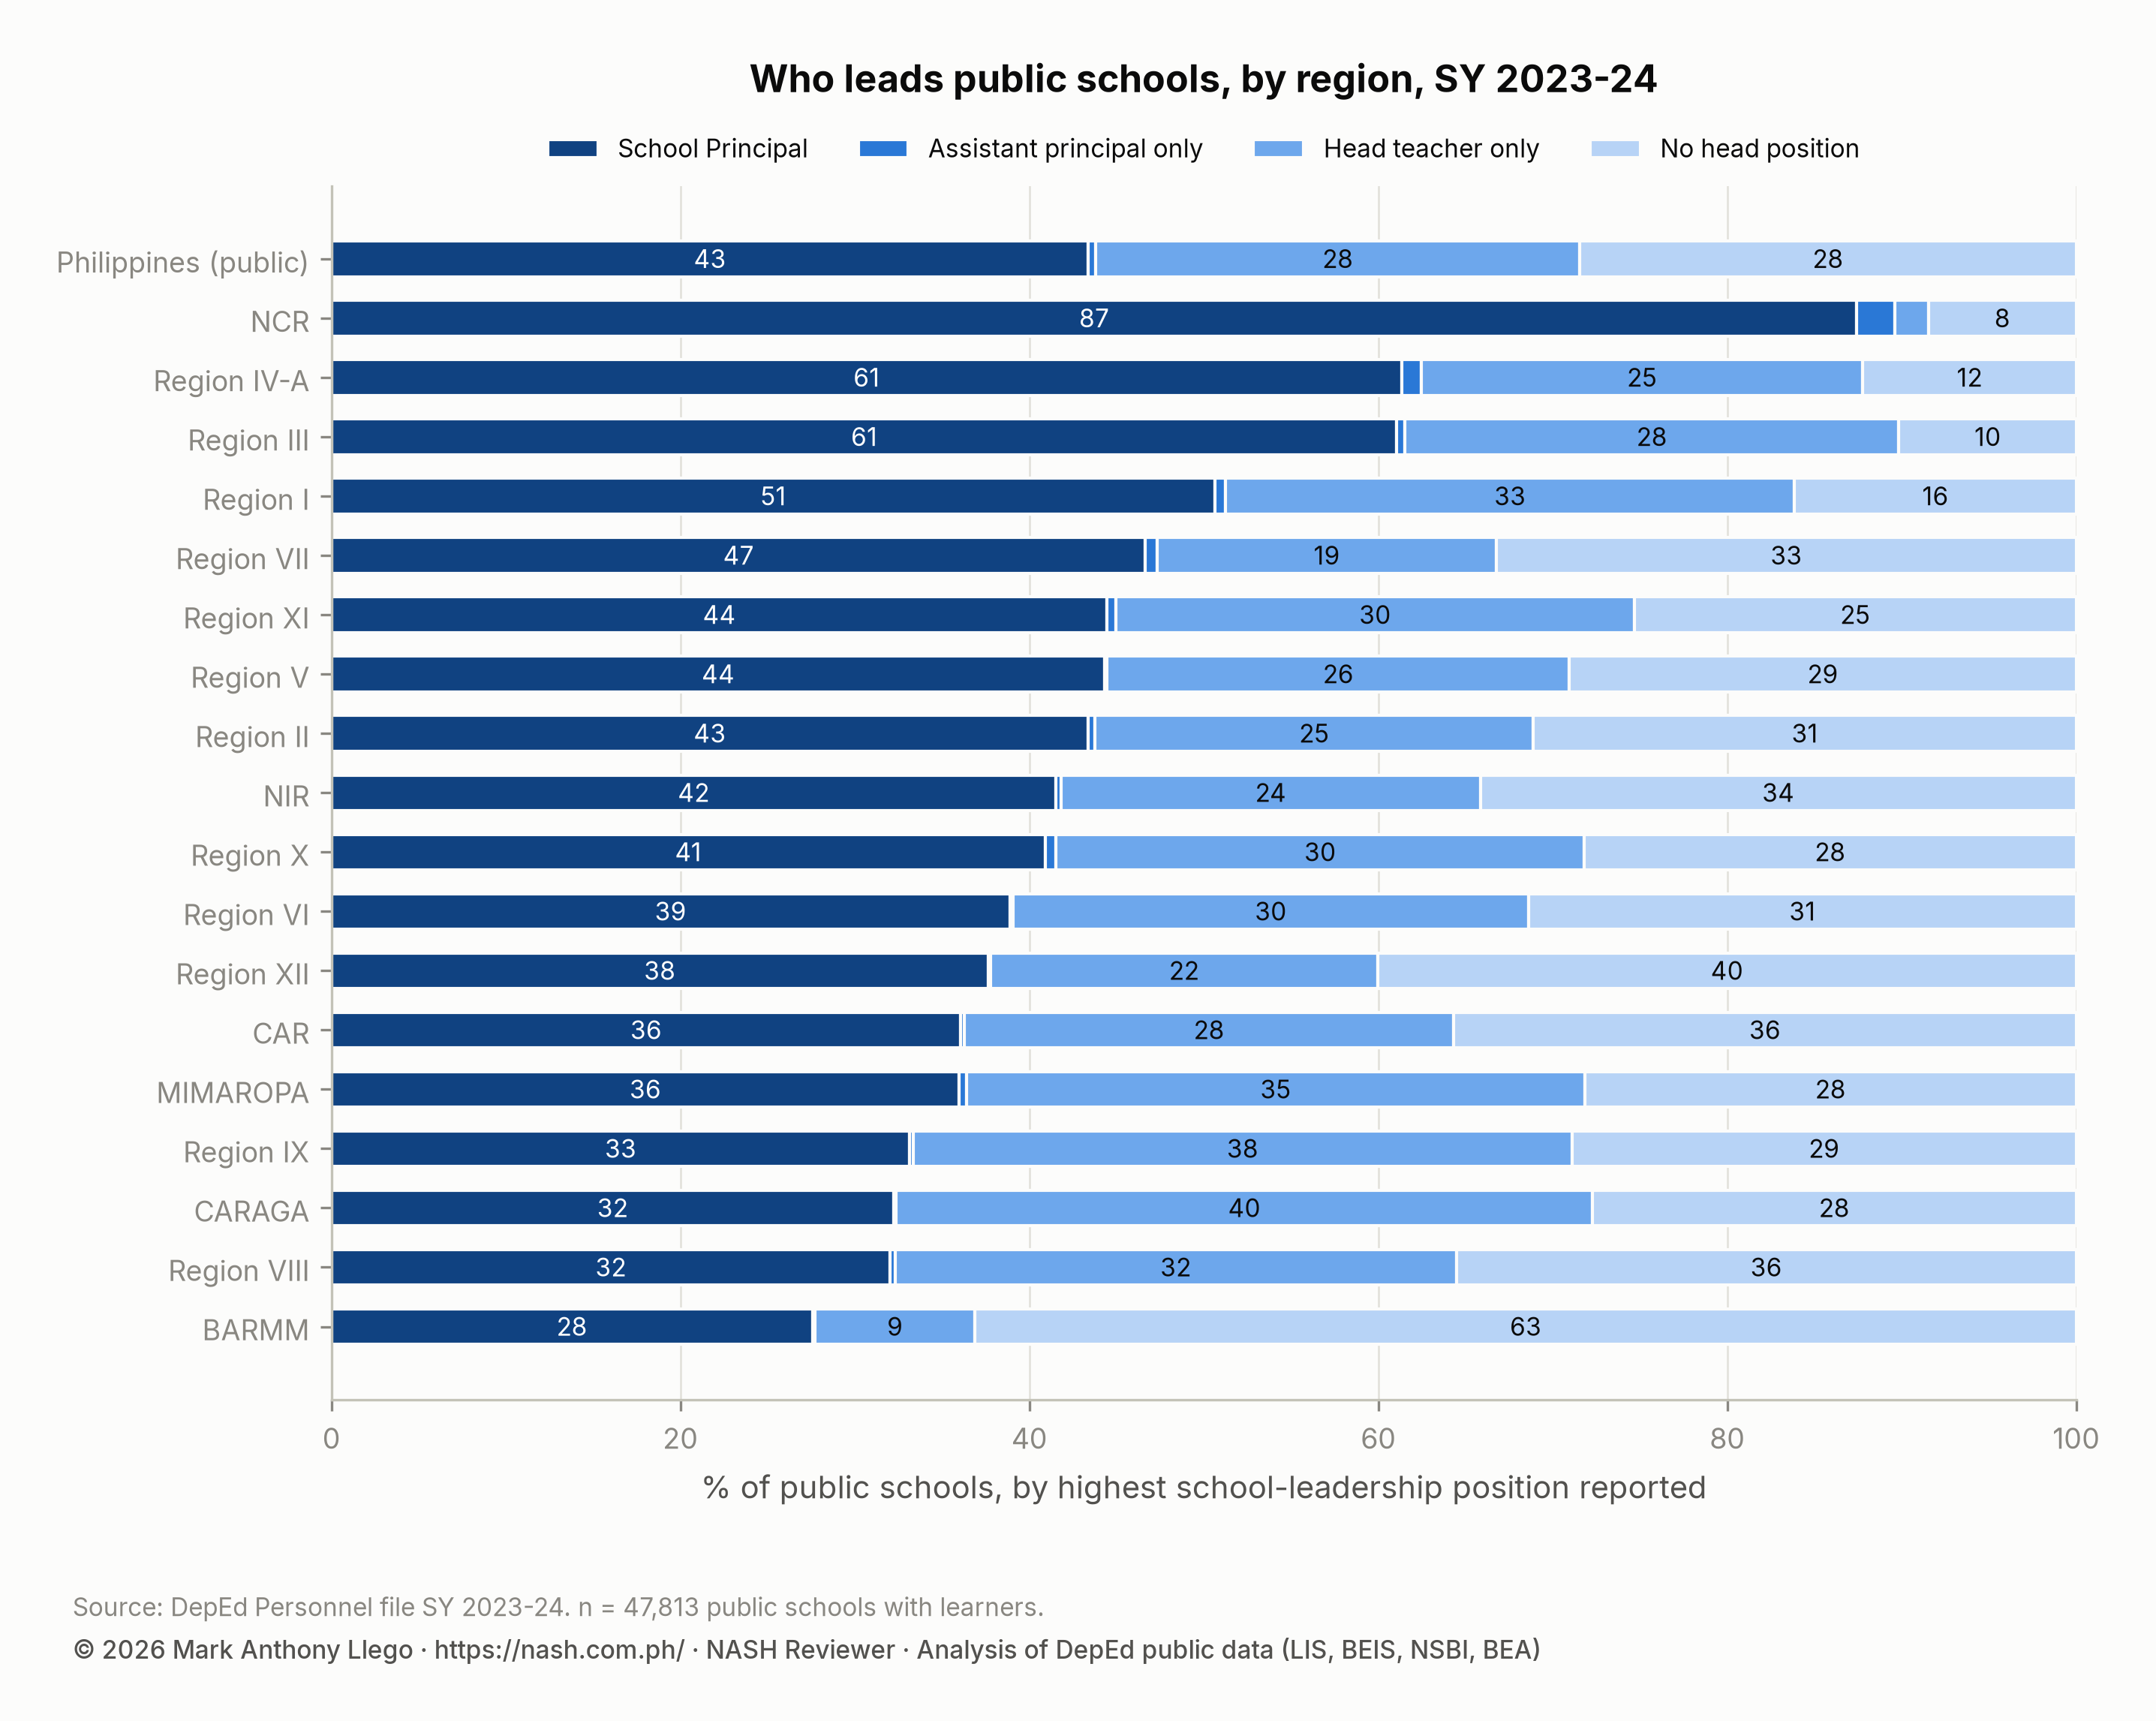
The SY 2023-2024 personnel file lets anyone check the gap one year earlier. It lists School Principal I to IV, assistant principal and Head Teacher I to VI positions for every public school. Figure 3 and the table below classify each of the 47,813 public schools with learners by the highest position it reports.
| Region | School Principal | Assistant principal only | Head teacher only | No head position | Schools | Learners |
|---|---|---|---|---|---|---|
| BARMM | 27.6% | 0.1% | 9.2% | 63.1% | 2,155 | 769,022 |
| CAR | 36.1% | 0.2% | 28.0% | 35.7% | 1,844 | 358,204 |
| CARAGA | 32.2% | 0.1% | 39.9% | 27.7% | 2,098 | 700,194 |
| MIMAROPA | 36.0% | 0.4% | 35.4% | 28.2% | 2,382 | 817,395 |
| NCR | 87.4% | 2.2% | 1.9% | 8.5% | 827 | 2,101,985 |
| NIR | 41.5% | 0.3% | 24.0% | 34.2% | 2,231 | 1,134,333 |
| Region I | 50.6% | 0.6% | 32.6% | 16.1% | 2,861 | 1,101,162 |
| Region II | 43.4% | 0.4% | 25.1% | 31.1% | 2,539 | 809,342 |
| Region III | 61.1% | 0.5% | 28.3% | 10.2% | 3,729 | 2,478,610 |
| Region IV-A | 61.3% | 1.1% | 25.3% | 12.2% | 3,564 | 3,188,202 |
| Region IX | 33.1% | 0.2% | 37.8% | 28.9% | 2,993 | 1,106,260 |
| Region V | 44.3% | 0.1% | 26.5% | 29.1% | 3,862 | 1,581,329 |
| Region VI | 38.9% | 0.2% | 29.6% | 31.4% | 2,835 | 1,040,714 |
| Region VII | 46.7% | 0.7% | 19.4% | 33.2% | 2,810 | 1,456,462 |
| Region VIII | 32.0% | 0.3% | 32.2% | 35.5% | 4,179 | 1,141,816 |
| Region X | 40.9% | 0.6% | 30.3% | 28.2% | 2,531 | 1,159,212 |
| Region XI | 44.5% | 0.5% | 29.7% | 25.3% | 2,218 | 1,218,778 |
| Region XII | 37.6% | 0.1% | 22.2% | 40.0% | 2,155 | 1,062,105 |
| Philippines (public) | 43.4% | 0.4% | 27.7% | 28.5% | 47,813 | 23,225,125 |
Nationally, 20,741 schools (43.4%) report a School Principal position, and 206 (0.4%) report an assistant principal without a principal. Another 13,261 (27.7%) report head teachers only. The remaining 13,605 (28.5%) report no school-leadership position at all, which means a teacher-in-charge or officer-in-charge runs them. The 56.6% of schools without a principal position is higher than EDCOM’s 48% without a principal item.
The two are different measures. The file counts positions that schools reported in the Basic Education Information System (BEIS) for SY 2023-2024. EDCOM counts plantilla items in June 2025, after a year in which new items were created. The file’s count of 20,968 principal positions is also below EDCOM’s 22,320 filled items. The order of the regions is not in doubt. NCR has a principal in 87% of its schools and BARMM in 28%, and 63% of BARMM schools report no head position.
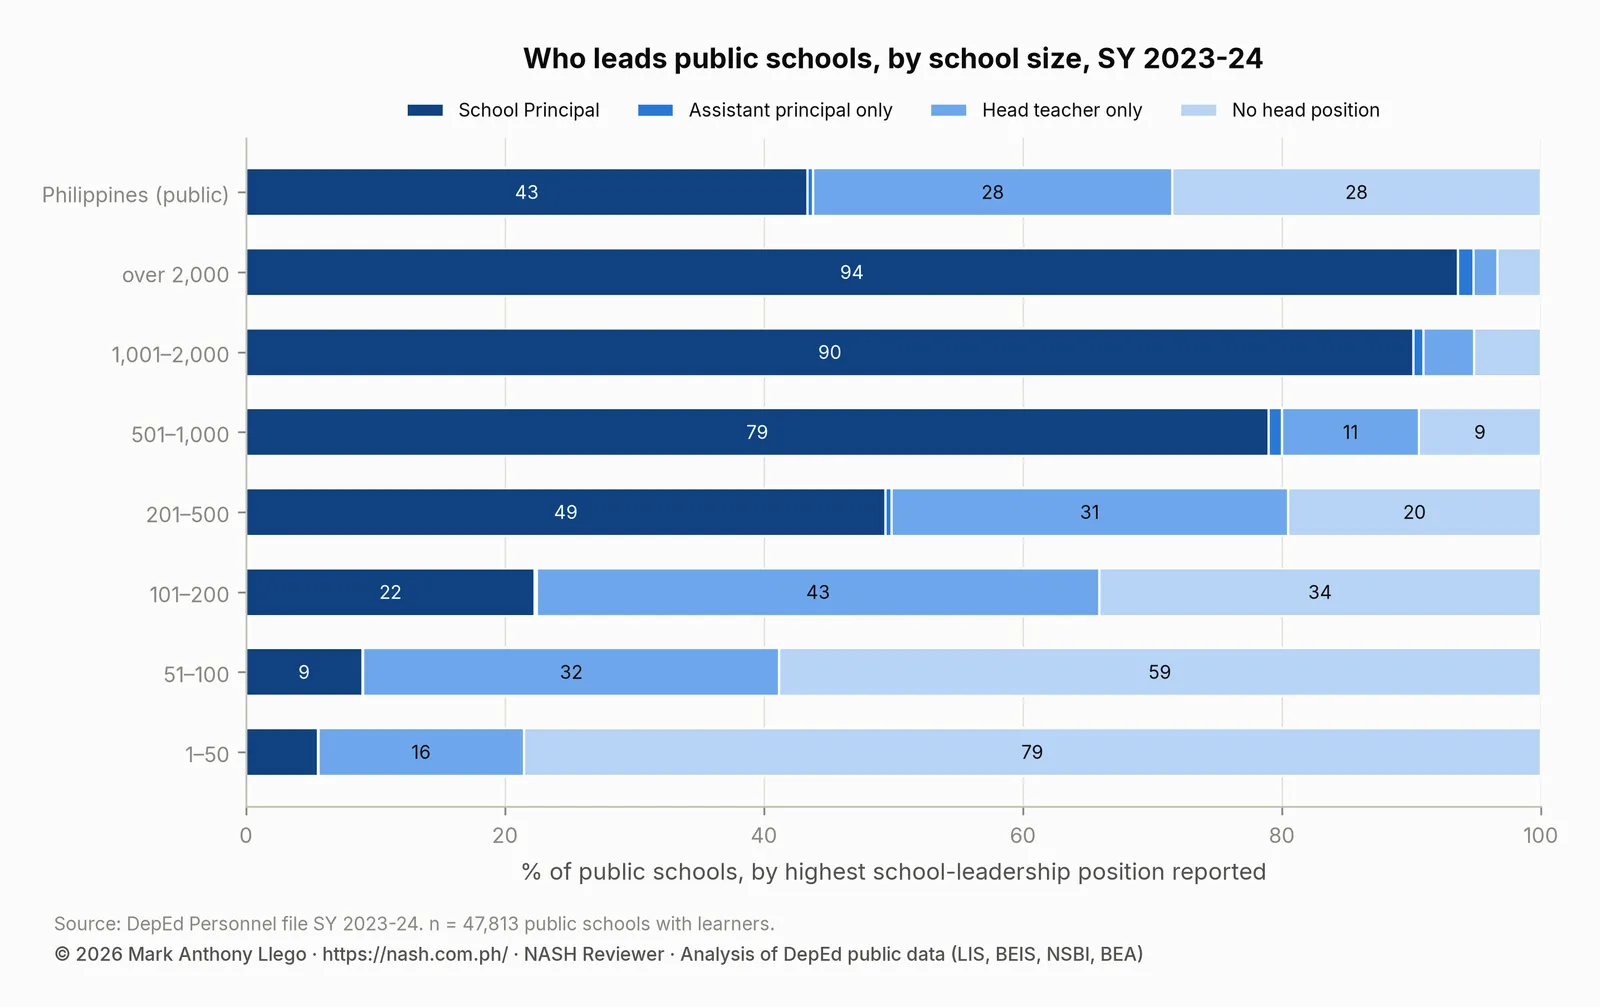
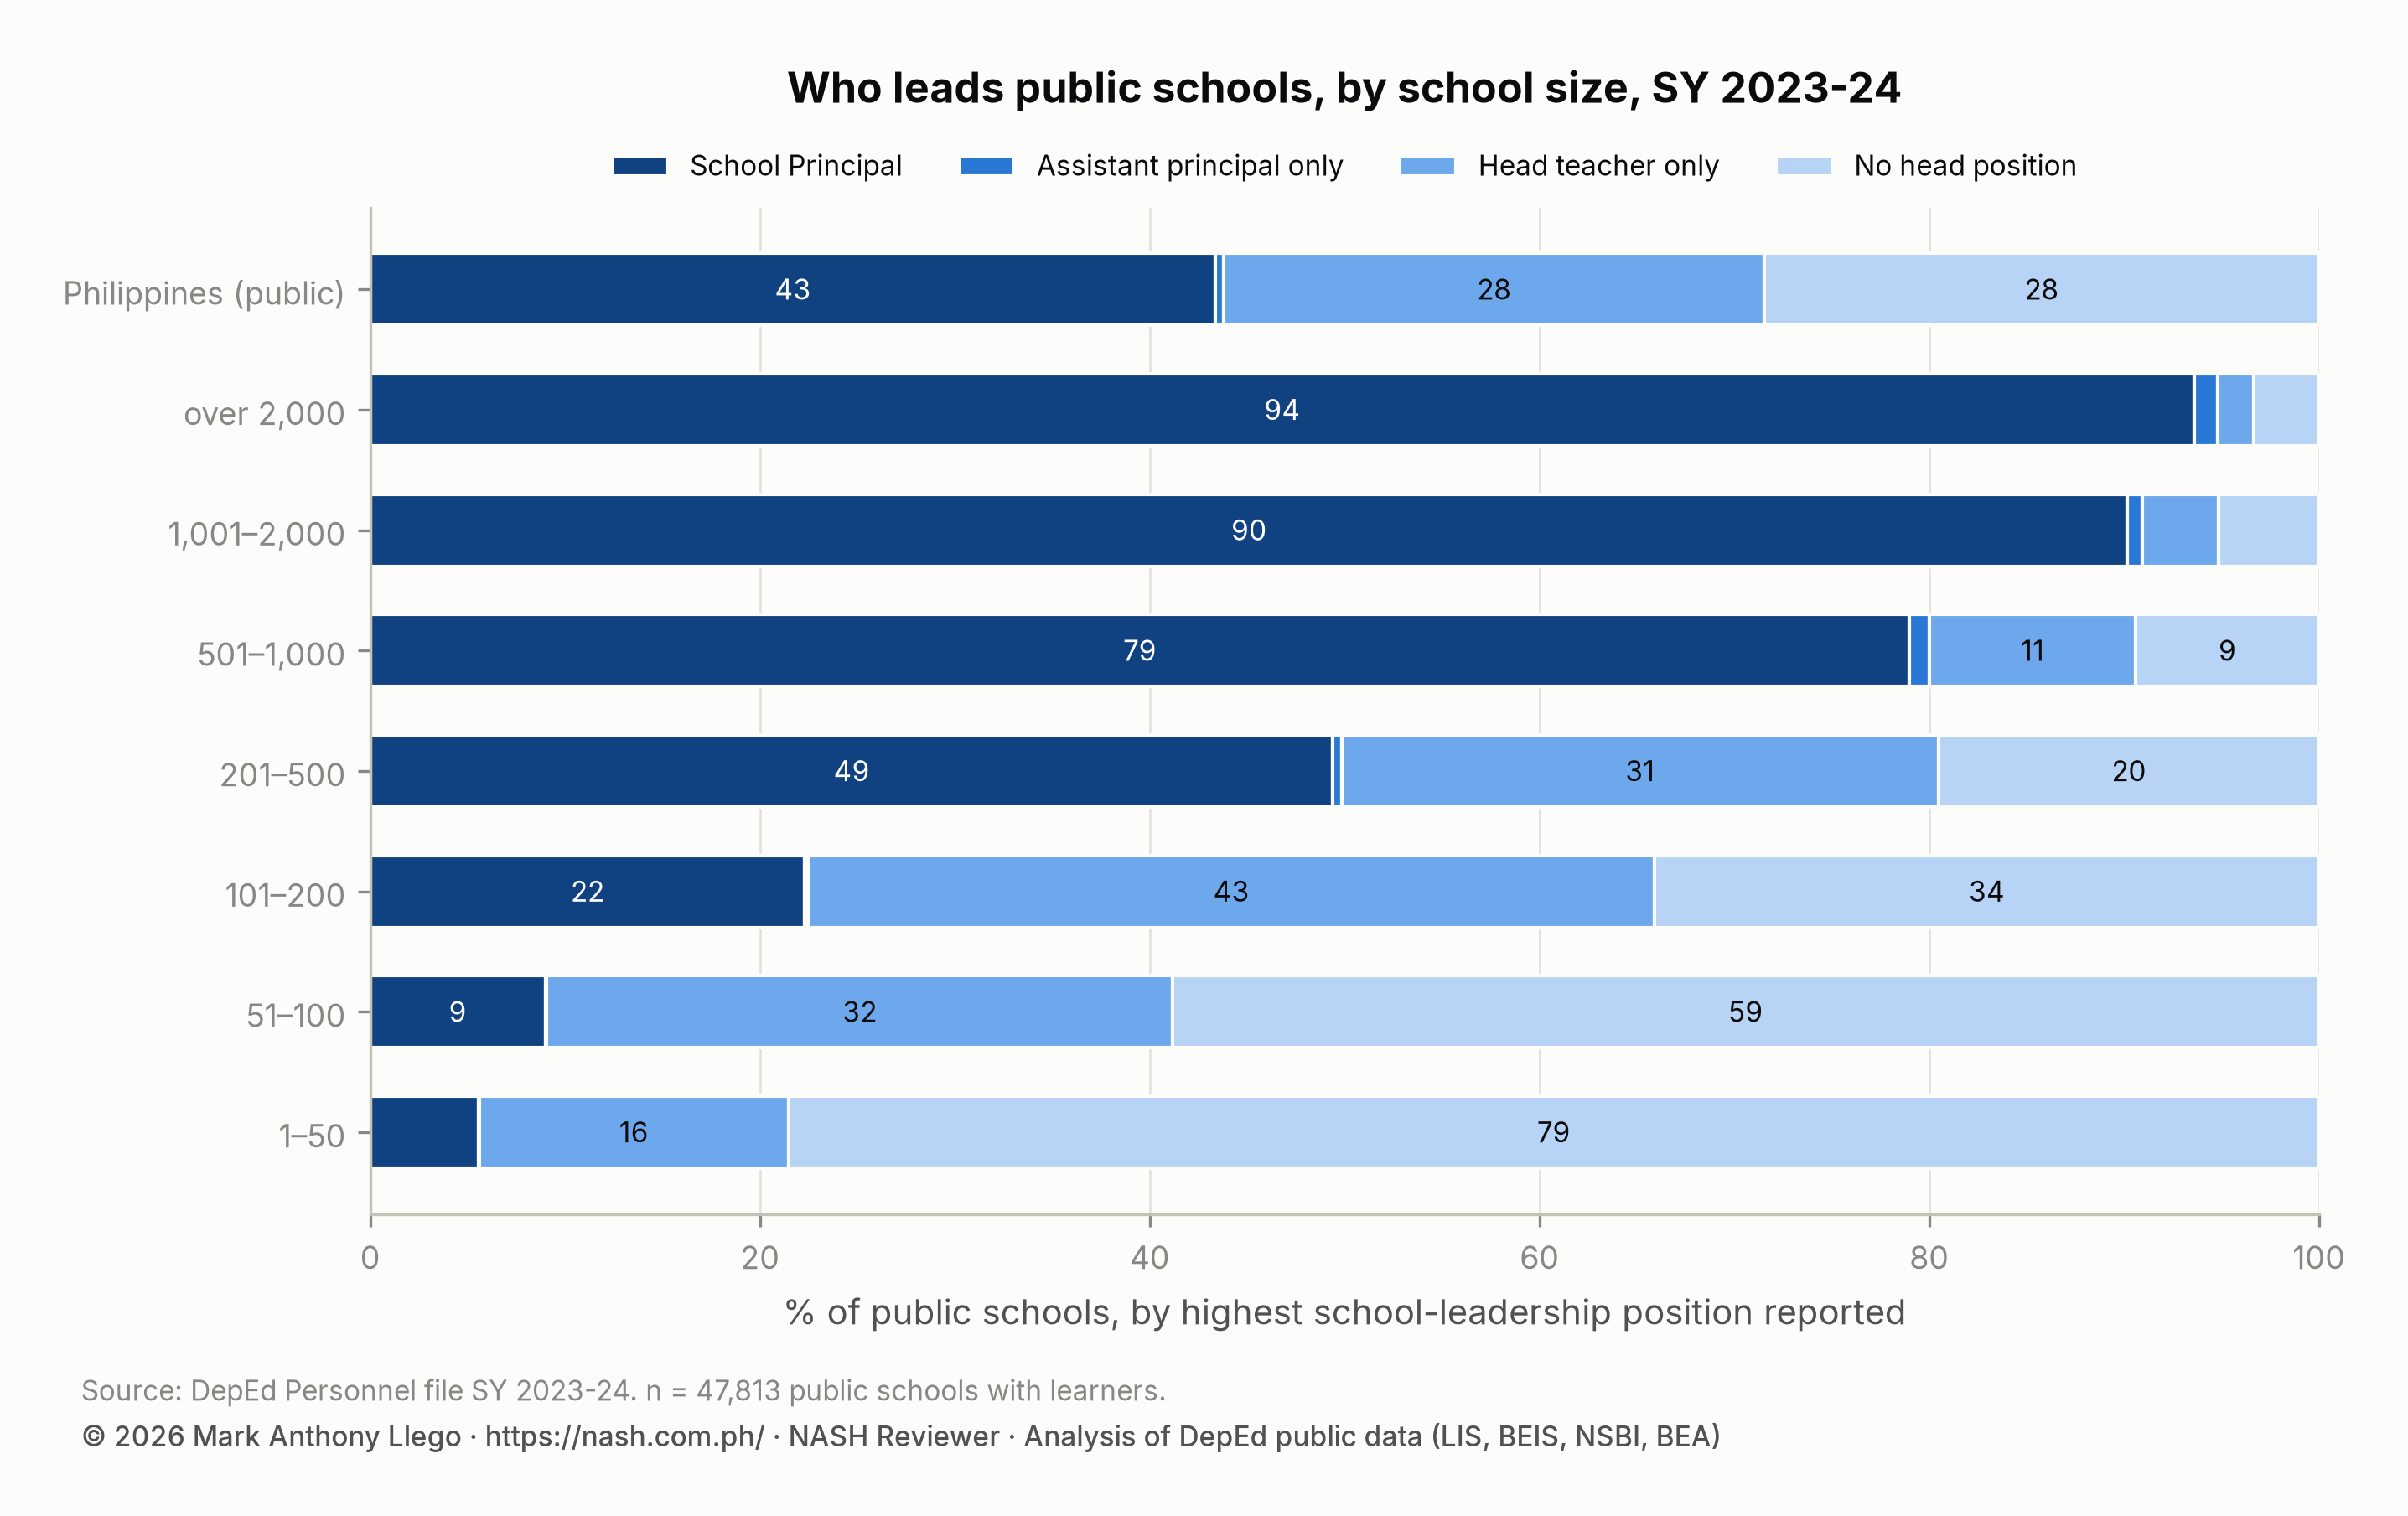
School size explains most of this pattern. Among schools with 1 to 50 learners, 79% report no head position and 6% report a principal. Among schools with more than 2,000 learners, 94% have a principal. Elementary-only schools, 37,005 of the 47,813, are the least likely to have one, at 39.5%. Annex and extension schools report no head position in 59% of cases.
| Learners per school | School Principal | Assistant principal only | Head teacher only | No head position | Schools | Learners |
|---|---|---|---|---|---|---|
| 1–50 | 5.6% | 0.0% | 15.9% | 78.5% | 2,628 | 87,517 |
| 51–100 | 9.0% | 0.1% | 32.1% | 58.8% | 5,902 | 452,684 |
| 101–200 | 22.3% | 0.2% | 43.5% | 34.1% | 12,528 | 1,848,183 |
| 201–500 | 49.4% | 0.4% | 30.6% | 19.5% | 15,288 | 4,849,403 |
| 501–1,000 | 79.0% | 1.0% | 10.6% | 9.4% | 6,185 | 4,278,461 |
| 1,001–2,000 | 90.2% | 0.8% | 3.9% | 5.1% | 3,248 | 4,494,332 |
| over 2,000 | 93.6% | 1.2% | 1.9% | 3.3% | 2,034 | 7,214,545 |
| Philippines (public) | 43.4% | 0.4% | 27.7% | 28.5% | 47,813 | 23,225,125 |
For an aspiring school head, the conclusion is simple. The 22,124 new items planned for 2026 to 2028 will go first to schools that have never had a principal. Those schools are small, rural and elementary, and a head teacher or a teacher-in-charge often leads them today. Your first principalship is more likely to be a 150-learner elementary school in a province than a 2,000-learner city school.
The supply of qualified principals is the limiting factor. The principal shortage guide on the app charts the pass rates of the NQESH, the NASH’s predecessor: 2.22% in 2016, 24.75% in 2017, about 0.7% in 2018, 36% in 2021 and 26% in 2023.
Performance management, MOOE and the Special Education Fund
Priority Area 25 finds that performance management “demonstrably fails to translate performance data into learning improvements”. The RPMS-PPST rates teachers on all 37 indicators of the Philippine Professional Standards for Teachers (PPST) over three years. The Basic Education Development Plan 2030 has 88 indicators, only 8 of them on learning outcomes. International practice is at most 15 indicators, with 60% of them on learning. For principals, “the OPCR lacks standardization across the system”. DepEd’s Q-BEDP of 2025 is the response.
Priority Area 26 covers school funding. School MOOE is “the primary source of discretionary operational funding available to school heads”, and 30% to 70% of it goes to utility bills. The Boncodin formula of 2013 allocated MOOE by enrollment, classrooms, teachers and graduates, without regard to inflation or remoteness. A full normative formula is approved for FY 2026. A study by UNICEF and the Department of Finance (DOF) links a 1% increase in MOOE to a 3.1 to 3.8 percentage-point rise in Grade 6 NAT scores, “with these gains disappearing after controlling for poverty incidence”.
The Special Education Fund (SEF) per learner ranges from PHP 25,587 in Makati City to PHP 65 in Guihulngan City, a 394-fold difference. PHP 16.3 billion of the SEF was unutilized in 2022. Priority Area 27 adds that only 2,661 of 45,225 public schools (5.9%) are implementing units with direct access to their funds. Each Schools Division Office (SDO) averages 98 staff for 33 schools, a 1:1,237 staff-to-learner ratio. Leyte’s SDO oversees 1,363 schools, and Isabela City’s oversees 74.
The public files show that local funding is uneven. Locally funded teachers are 2.0% of the teaching force nationally but 12.6% in BARMM. Local government units (LGUs) and the SEF paid for 32.7% of public schools’ academic computers, against 49.8% from the DepEd Computerization Program (DCP) and 0.1% from parent-teacher associations (PTAs).
Teacher Workload and Accountability covers EDCOM II’s proposals for teacher and principal accountability, and Local School Boards and the Special Education Fund covers the SEF in depth.
The 20 priority reforms of the National Education Plan, 2026 to 2035
The National Education Plan groups its twenty priority reforms under six key priority areas. The ones a school head will implement are in bold.
- Increase investments in early childhood nutrition.
- Provide scholarships for Child Development Workers and Teachers.
- Expand access to early childhood education.
- Address classroom backlog and congestion, using LGU and civil society organization (CSO) partnerships, public-private partnerships (PPPs) and vouchers.
- Revise procurement guidelines and policies for complete and timely textbook delivery.
- Provide equitable internet connectivity and digital resources.
- End “mass promotion” in schools: fully implement ARAL; revise RPMS, OPCR and General Appropriations Act (GAA) targets; rescind the grade transmutation policy.
- Reduce administrative burden on teachers.
- Address teacher subject-specialization misalignment.
- Improve the quality and relevance of the senior high school (SHS) TechPro program.
- Institutionalize school-to-employment pathways.
- Expand programs for learners with disabilities.
- Invest in teachers and professionals in inclusive education.
- Expand access and supports to tertiary education.
- Build relevant and seamless technical and vocational education and training (TVET) and college pathways.
- Invest at least 5% of GDP on education, focusing on the foundations.
- Recruit and develop quality school leaders and administrators.
- Implement phased decentralization and devolution.
- Strengthen inter-agency alignment and data integration.
- Update the charters of DepEd, the Commission on Higher Education (CHED) and the Technical Education and Skills Development Authority (TESDA).
The learning targets behind item 7 are specific. The share of Key Stage 1 learners reading at grade level on the end-of-year CRLA is to rise from 47.74% in SY 2024-2025 to 75% by 2028, 90% by 2031 and 95% by 2035. The share at grade level in numeracy on the Rapid Mathematics Assessment (RMA) is to rise from 40.49% to 65%, 75% and 85%.
Senior High School and Jobs covers items 10 and 11, and RA 11650 and Learners With Disabilities covers items 12 and 13.
How the EDCOM II findings relate to the PPSSH strands
| EDCOM II theme | PPSSH strands most engaged | What the public data add |
|---|---|---|
| Assessment system and its misuse (PA 6) | 3.4 learner achievement, 3.5 learning assessment, 1.7 monitoring and evaluation | ELLNA, NAT and CRLA by division with confidence intervals; the 0.06 CRLA-ELLNA correlation |
| Mass promotion, ARAL, instructional time (PA 7) | 3.1 learning standards, 3.2 pedagogies, 4.4 performance management, 1.5 program design | CRLA 5.3% at grade level in Grade 1; one in six Grade 3 learners still low emerging |
| Classrooms and disasters (PA 8) | 2.3 facilities and equipment, 2.5 school safety, 2.6 emerging challenges | 30% of buildings in good condition; 35.1 learners per room; 29.1% of schools with makeshift rooms |
| Teacher workload and career progression (PA 18) | 2.4 management of staff, 4.5 professional development, 4.7 welfare | 7.6% master teachers; 25.5 learners per teacher; 60.8% of SHS positions at Teacher II |
| School leadership deployment (PA 18, PA 27) | 4.6 leadership development, 1.3 policy implementation | 43.4% of schools with a principal position; 28.5% with none; 79% of the smallest schools with none |
| Performance management (PA 25) | 4.4 performance management, 1.7 monitoring and evaluation | What a school can and cannot be judged on from six sampled NAT test-takers |
| Financing and decentralization (PA 26, 27) | 2.2 financial management, 5.5 community engagement | 2.0% locally funded teachers nationally, 12.6% in BARMM; 32.7% of computers LGU- or SEF-funded |
| Inclusion and IP education (PA 7) | 5.3 inclusive practice, 3.6 learning environment | 9.3% IP learners nationally, 71.9% in CAR; 1.4% in ALIVE; 2.0% of elementary learners in multigrade classes |
How the NASH may test this
DepEd Memorandum No. 069, s. 2025 describes “conceptual and situational critical thinking questions” built on the SOLO (Structure of Observed Learning Outcomes) taxonomy. The SOLO taxonomy grades a response by how it structures ideas: using one relevant idea, connecting several into a coherent whole, and then generalizing from them. EDCOM’s findings are exactly the kind of evidence such items are built from.
A situational stem might describe a 180-learner elementary school led by a head teacher. The school has 60% of Grade 1 learners at low emerging on the CRLA, a makeshift classroom, and a parent-teacher association that wants to spend the next fund-raiser on a covered court. A relational answer connects the CRLA profile to a structured remediation plan under ARAL, the instructional time protected by DepEd Order No. 9, s. 2005, the MOOE and SEF rules that govern the fund-raiser, and the stakeholders who have to agree. An extended-abstract answer explains why the same plan would differ in a 2,000-learner city school on double shifts.
Nothing in this guide reproduces or predicts examination content. It presents the policies and evidence the examination says it is aligned with.
Frequently asked questions
What does the EDCOM II Final Report say about school principals?
The report finds that 18,576 schools (48%) had no principal plantilla item in SY 2024-2025 and that 12,057 had the wrong school-head item. It recommends that DepEd create 22,124 principal items from 2026 to 2028 so that every school has one, revise the OPCRF toward instructional leadership, and establish a Principals Academy.
Do DepEd’s public datasets confirm the 48% of schools without a principal?
They show the same pattern one year earlier with a different measure. In the SY 2023-2024 personnel file, 43.4% of public schools report a School Principal position, 27.7% head teachers only and 28.5% no school-leadership position. The file counts reported positions, not plantilla items.
Is the EDCOM II report covered by the NASH?
The NASH covers the PPSSH, and the first PPSSH domain asks school heads to know relevant laws, policies, research and contexts. The EDCOM report is the most current compilation of that evidence. The policies it discusses (DepEd Orders 002 and 006 of 2024 and 2025, RA 12028, RA 12288, DO 8 s. 2015) are policies a school head must implement.
Where can I read the EDCOM II Final Report?
EDCOM II publishes its reports on its website.
Download the data
The cleaned, harmonized DepEd files behind this series are free to download in CSV and Parquet, with a codebook and checksums, under the terms of use set out in the release. Download Cleaned DepEd School Data, SY 2017-18 to 2025-26 documents every file and column. The files themselves are at data.nash.com.ph, starting with the README, the SY 2023-24 school master file (CSV, 8.0 MB) and the nine-year enrollment panel (Parquet, 17.2 MB).
The EDCOM II series
The reports:
- What EDCOM II Achieved, 2023-2025: Laws, Budgets, Policies
- EDCOM II’s Three Reports: How the Key Numbers Changed
- EDCOM II Final Report: Guide for Aspiring School Heads (this post)
- National Education Plan 2026-2035: Guide for School Heads
- 100 Years After the Monroe Report: Education Commissions
- Is the Philippines Spending Enough on Education?
- Education Data, Transparency and Research: EDCOM II
Learners and learning:
- Mass Promotion and Lost Instructional Time: EDCOM II
- PISA, TIMSS, SEA-PLM and the NAT: What EDCOM II Found
- Mother Tongue After RA 12027: Language of Instruction
- Why DepEd Bought Only 27 Textbook Titles in 2012-2023
- RA 12080, Bullying and School Mental Health: EDCOM II
- RA 11650 and Learners With Disabilities: EDCOM II Findings
- Senior High School and Jobs: EDCOM II Workforce Findings
Schools, teachers and governance:
- Teacher Workload and Accountability: EDCOM II Findings
- Local School Boards and the Special Education Fund
- Local Education Models in EDCOM II: What the Evidence Shows
- Education in the Bangsamoro: EDCOM II Findings for BARMM
Guides for aspiring school heads
- DepEd Data for Aspiring School Heads: Where to Start
- NASH Practice Questions With Answers: 50 Items on the PPSSH
- How to Read DepEd Data: A Guide for Aspiring School Heads
- National Education Plan 2026-2035: Guide for School Heads
- NASH Study Guide: DepEd Memorandum 069, s. 2025 and PPSSH
- PPSSH Domain 1: Leading Strategically With DepEd Data
- PPSSH Domain 2: Managing School Operations With DepEd Data
- PPSSH Domain 3: Teaching and Learning With DepEd Data
- PPSSH Domain 4: Developing Self and Others With DepEd Data
- PPSSH Domain 5: Building Connections With DepEd Data
- On the app: the NASH guide, the PPSSH guide, the principal shortage and the full data report, Philippine basic education in numbers
The data reports
- DepEd Enrollment Trends SY 2017-2018 to SY 2025-2026
- Enrollment by school year: SY 2017-18, SY 2018-19, SY 2019-20, SY 2020-21, SY 2021-22, SY 2022-23, SY 2023-24, SY 2024-25, SY 2025-26
- DepEd Learner Data SY 2023-2024: IP, ALIVE and School Size
- DepEd Teachers and School Personnel Data, SY 2023-2024
- DepEd Classroom and School Building Data, SY 2023-2024
- DepEd WASH Data SY 2023-2024: Toilets, Water, Electricity
- DepEd ICT Data SY 2023-2024: Computers and Internet
- NAT Grade 6 Results SY 2023-2024: DepEd Division Scores
- ELLNA Grade 3 Results SY 2023-2024: DepEd Division Scores
- CRLA Results SY 2025-2026: Reading Levels in Grades 1 to 3
- DepEd School Inputs vs Test Results: Multigrade and Internet
- DepEd Open Data Quality: Errors, Blanks and Coverage Limits
- Download Cleaned DepEd School Data, SY 2017-18 to 2025-26
Written by Mark Anthony Llego for NASH Reviewer. Sources: EDCOM II, Turning Point: A Decade of Necessary Reform (2026-2035), Final Report, January 2026; DepEd Order No. 024, s. 2020; DepEd Memorandum No. 069, s. 2025; DepEd public datasets. Charts may be reused only with written permission from support@nash.com.ph.