DepEd’s SY 2020-2021 enrollment file is the first count taken during the pandemic. It is the first file in the series to record a fall: 26,227,022 learners, 803,369 fewer than in SY 2019-2020, a drop of 3.0%.
SY 2020-2021 opened on October 5, 2020, four months later than any school year before it, with every school closed to in-person classes. Learners enrolled remotely over the summer. They studied through printed and digital modules, online classes, television and radio under DepEd’s Basic Education Learning Continuity Plan (DepEd Order No. 012, s. 2020).
The national total understates how uneven the drop was. Public enrollment rose, while private enrollment fell by a fifth and private kindergarten enrollment halved. The capital lost one learner in twelve, while four rural regions grew. At every step from one grade to the next, fewer learners continued than in any other year of the series.
Key findings
- Enrollment fell by 803,369 learners (−3.0%) to 26,227,022. Public enrollment rose 0.6%, while private enrollment fell 21.6%.
- Private kindergarten enrollment halved, from 250,811 to 125,848. The private share of all learners fell from 15.9% to 12.9% in a single year.
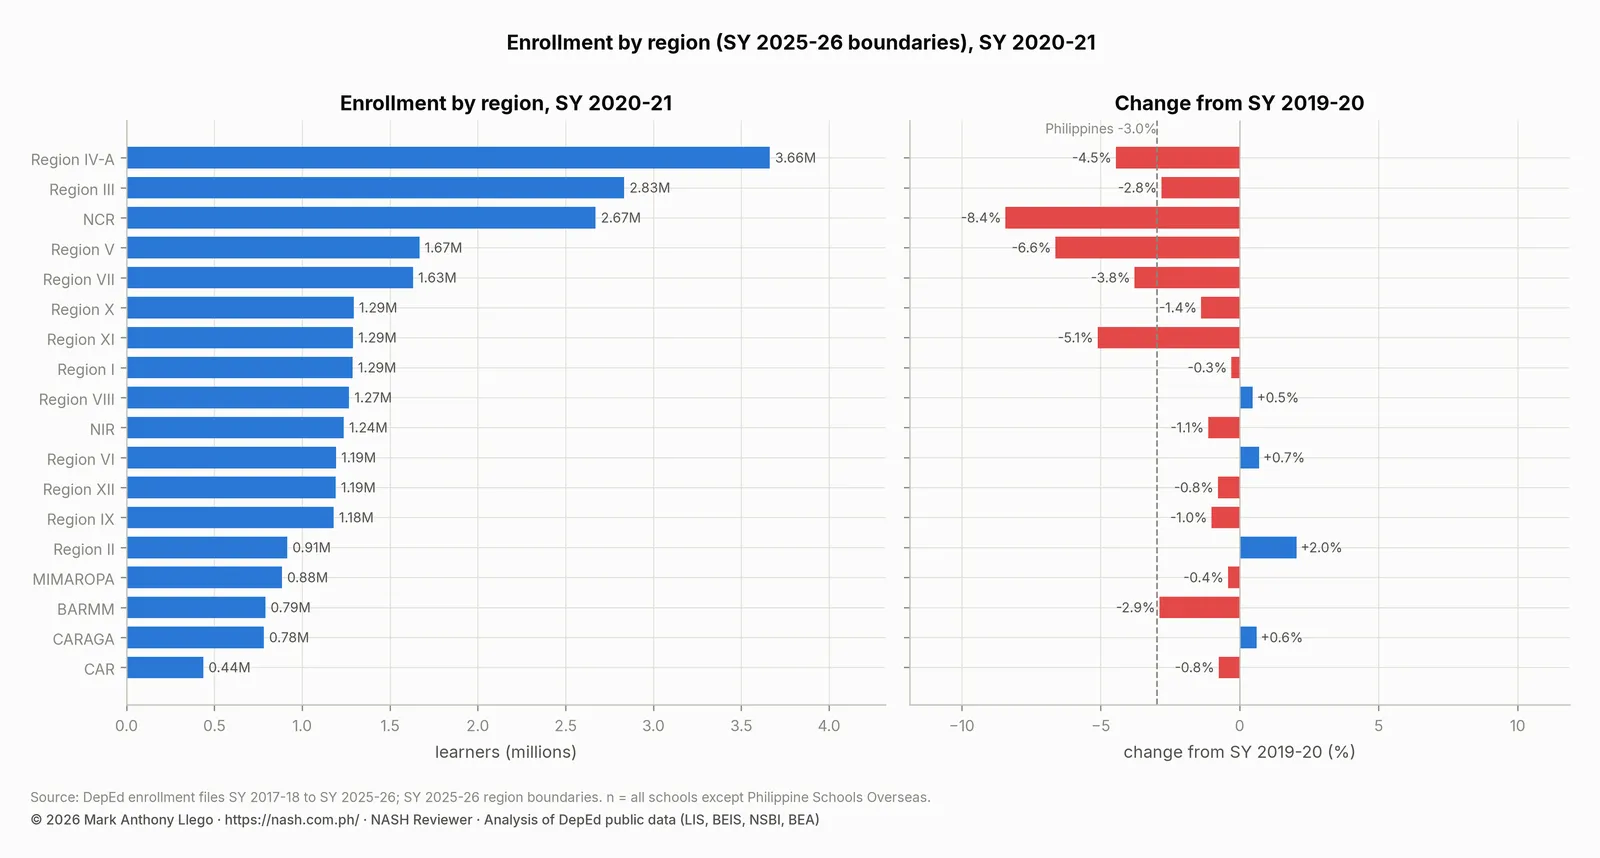
- NCR lost 245,675 learners, or 8.4%, the largest regional loss in any year of the series. Region II, Region VI, CARAGA and Region VIII grew.
- Every grade-to-grade flow ratio was the lowest in the series. Grade 1 enrolled only 0.992 learners for every kindergarten learner of the year before.
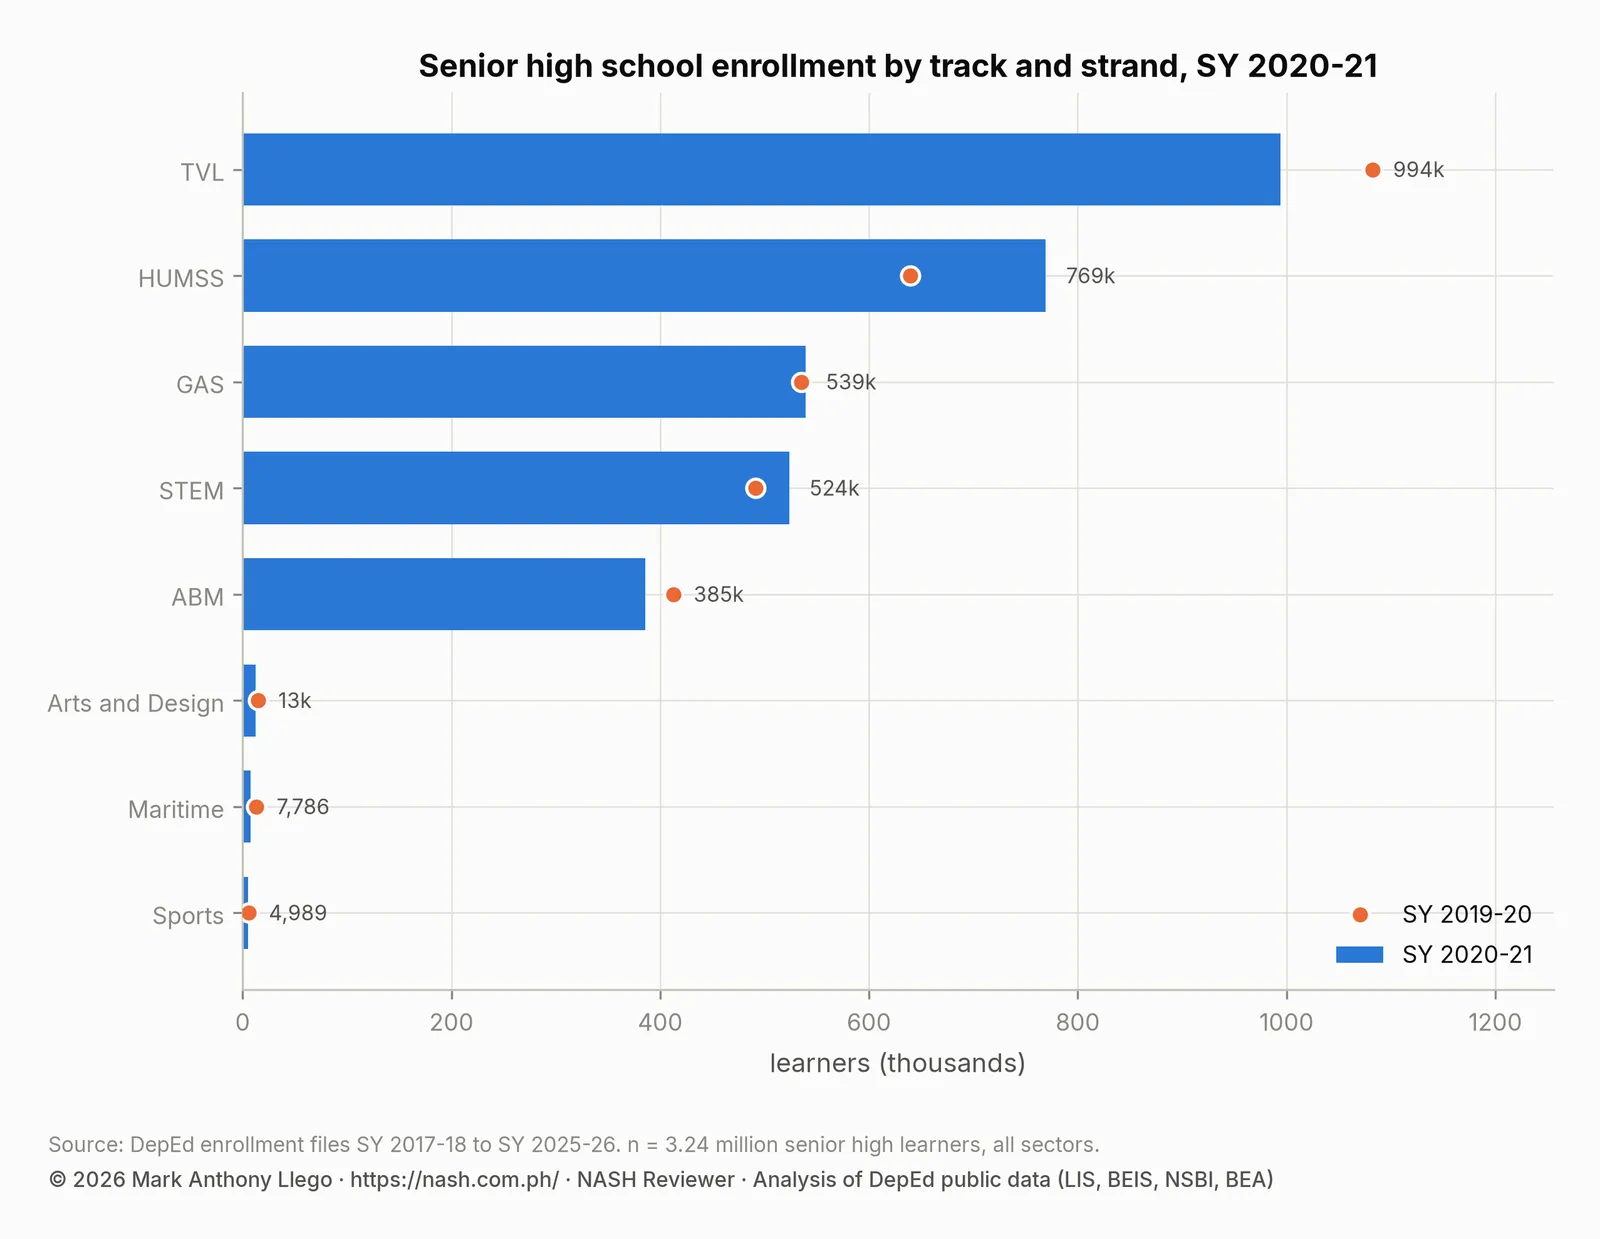
- The Technical-Vocational-Livelihood (TVL) track fell for the first time, by 88,675 learners (−8.2%). Humanities and Social Sciences (HUMSS) gained 129,506 (+20.2%).
| Item | SY 2020-21 | SY 2019-20 | Change | Change (%) |
|---|---|---|---|---|
| Schools in the file | 60,957 | 61,923 | -966 | -1.6% |
| Schools reporting enrollment | 60,957 | 61,923 | -966 | -1.6% |
| Total enrollment | 26,227,022 | 27,030,391 | -803,369 | -3.0% |
| Kindergarten | 2,055,635 | 2,044,745 | +10,890 | +0.5% |
| Grades 1 to 6 | 12,539,961 | 13,226,174 | -686,213 | -5.2% |
| Elementary non-graded | 55,208 | 61,787 | -6,579 | -10.6% |
| Elementary (K to 6 and non-graded) | 14,650,804 | 15,332,706 | -681,902 | -4.4% |
| Junior high school (Grades 7 to 10 and non-graded) | 8,339,391 | 8,503,650 | -164,259 | -1.9% |
| Senior high school (Grades 11 and 12) | 3,236,827 | 3,194,035 | +42,792 | +1.3% |
| Female learners | 12,915,363 | 13,274,182 | -358,819 | -2.7% |
| Male learners | 13,311,659 | 13,756,209 | -444,550 | -3.2% |
| Female share of learners | 49.2% | 49.1% | +0.14 points |
Private school enrollment fell 21.6%
| Sector | Schools | Learners | Share of learners | Kindergarten | Elementary (K to 6) | Junior high | Senior high | Schools, SY 2019-20 | Learners, SY 2019-20 | Change (%) |
|---|---|---|---|---|---|---|---|---|---|---|
| Public | 47,421 | 22,712,409 | 86.6% | 1,927,619 | 13,681,248 | 7,043,981 | 1,987,180 | 47,188 | 22,572,923 | +0.6% |
| Private | 13,256 | 3,375,748 | 12.9% | 125,848 | 947,568 | 1,238,473 | 1,189,707 | 14,435 | 4,304,676 | -21.6% |
| SUC/LUC laboratory schools | 247 | 118,755 | 0.5% | 782 | 9,757 | 50,779 | 58,219 | 271 | 131,006 | -9.4% |
| Philippine Schools Overseas | 33 | 20,110 | 0.1% | 1,386 | 12,231 | 6,158 | 1,721 | 29 | 21,786 | -7.7% |
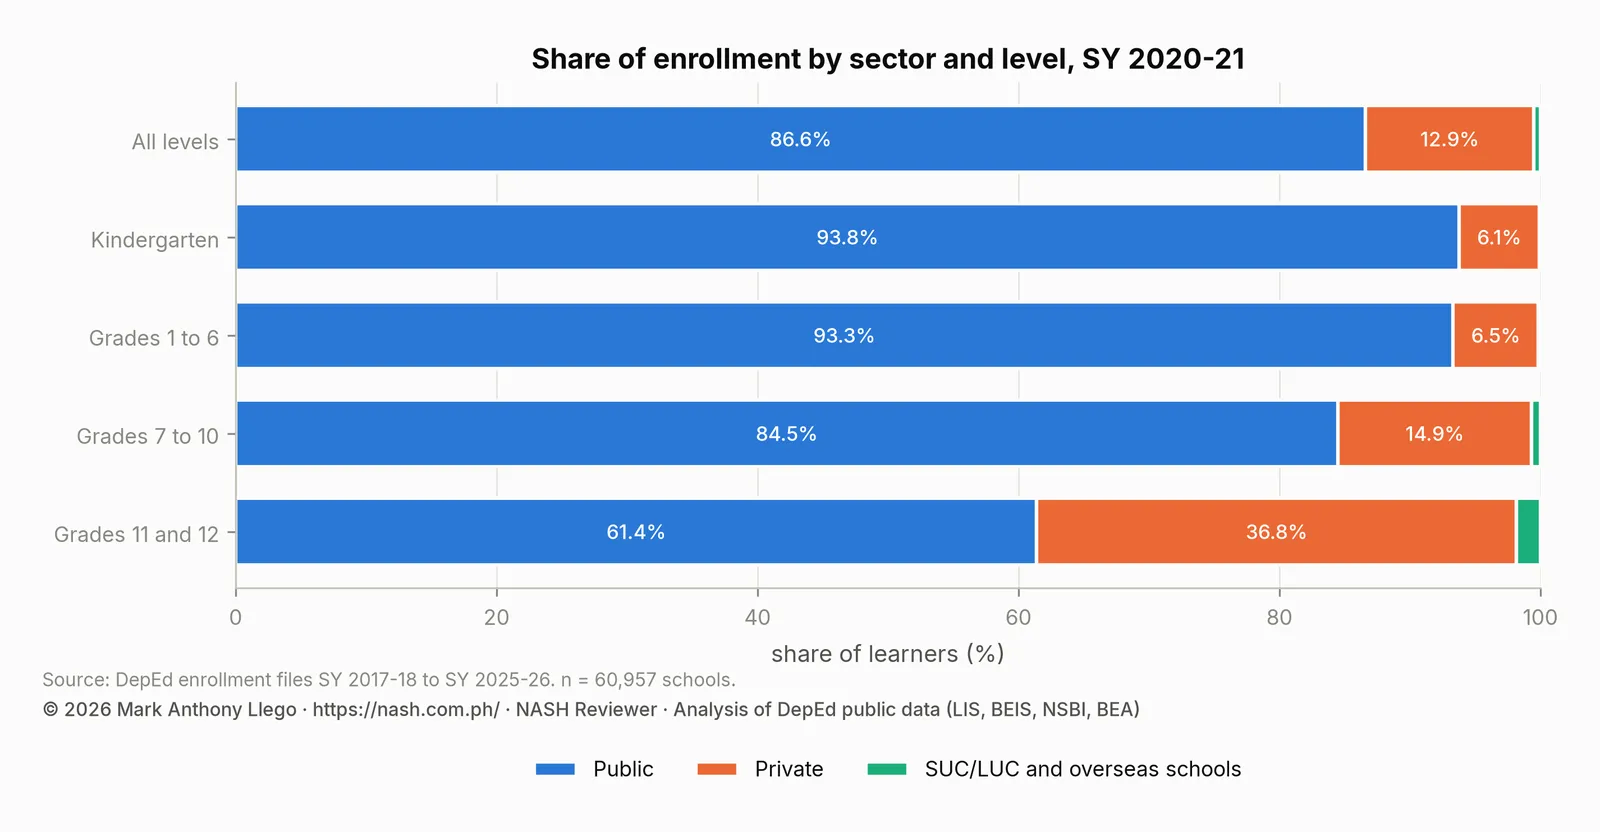
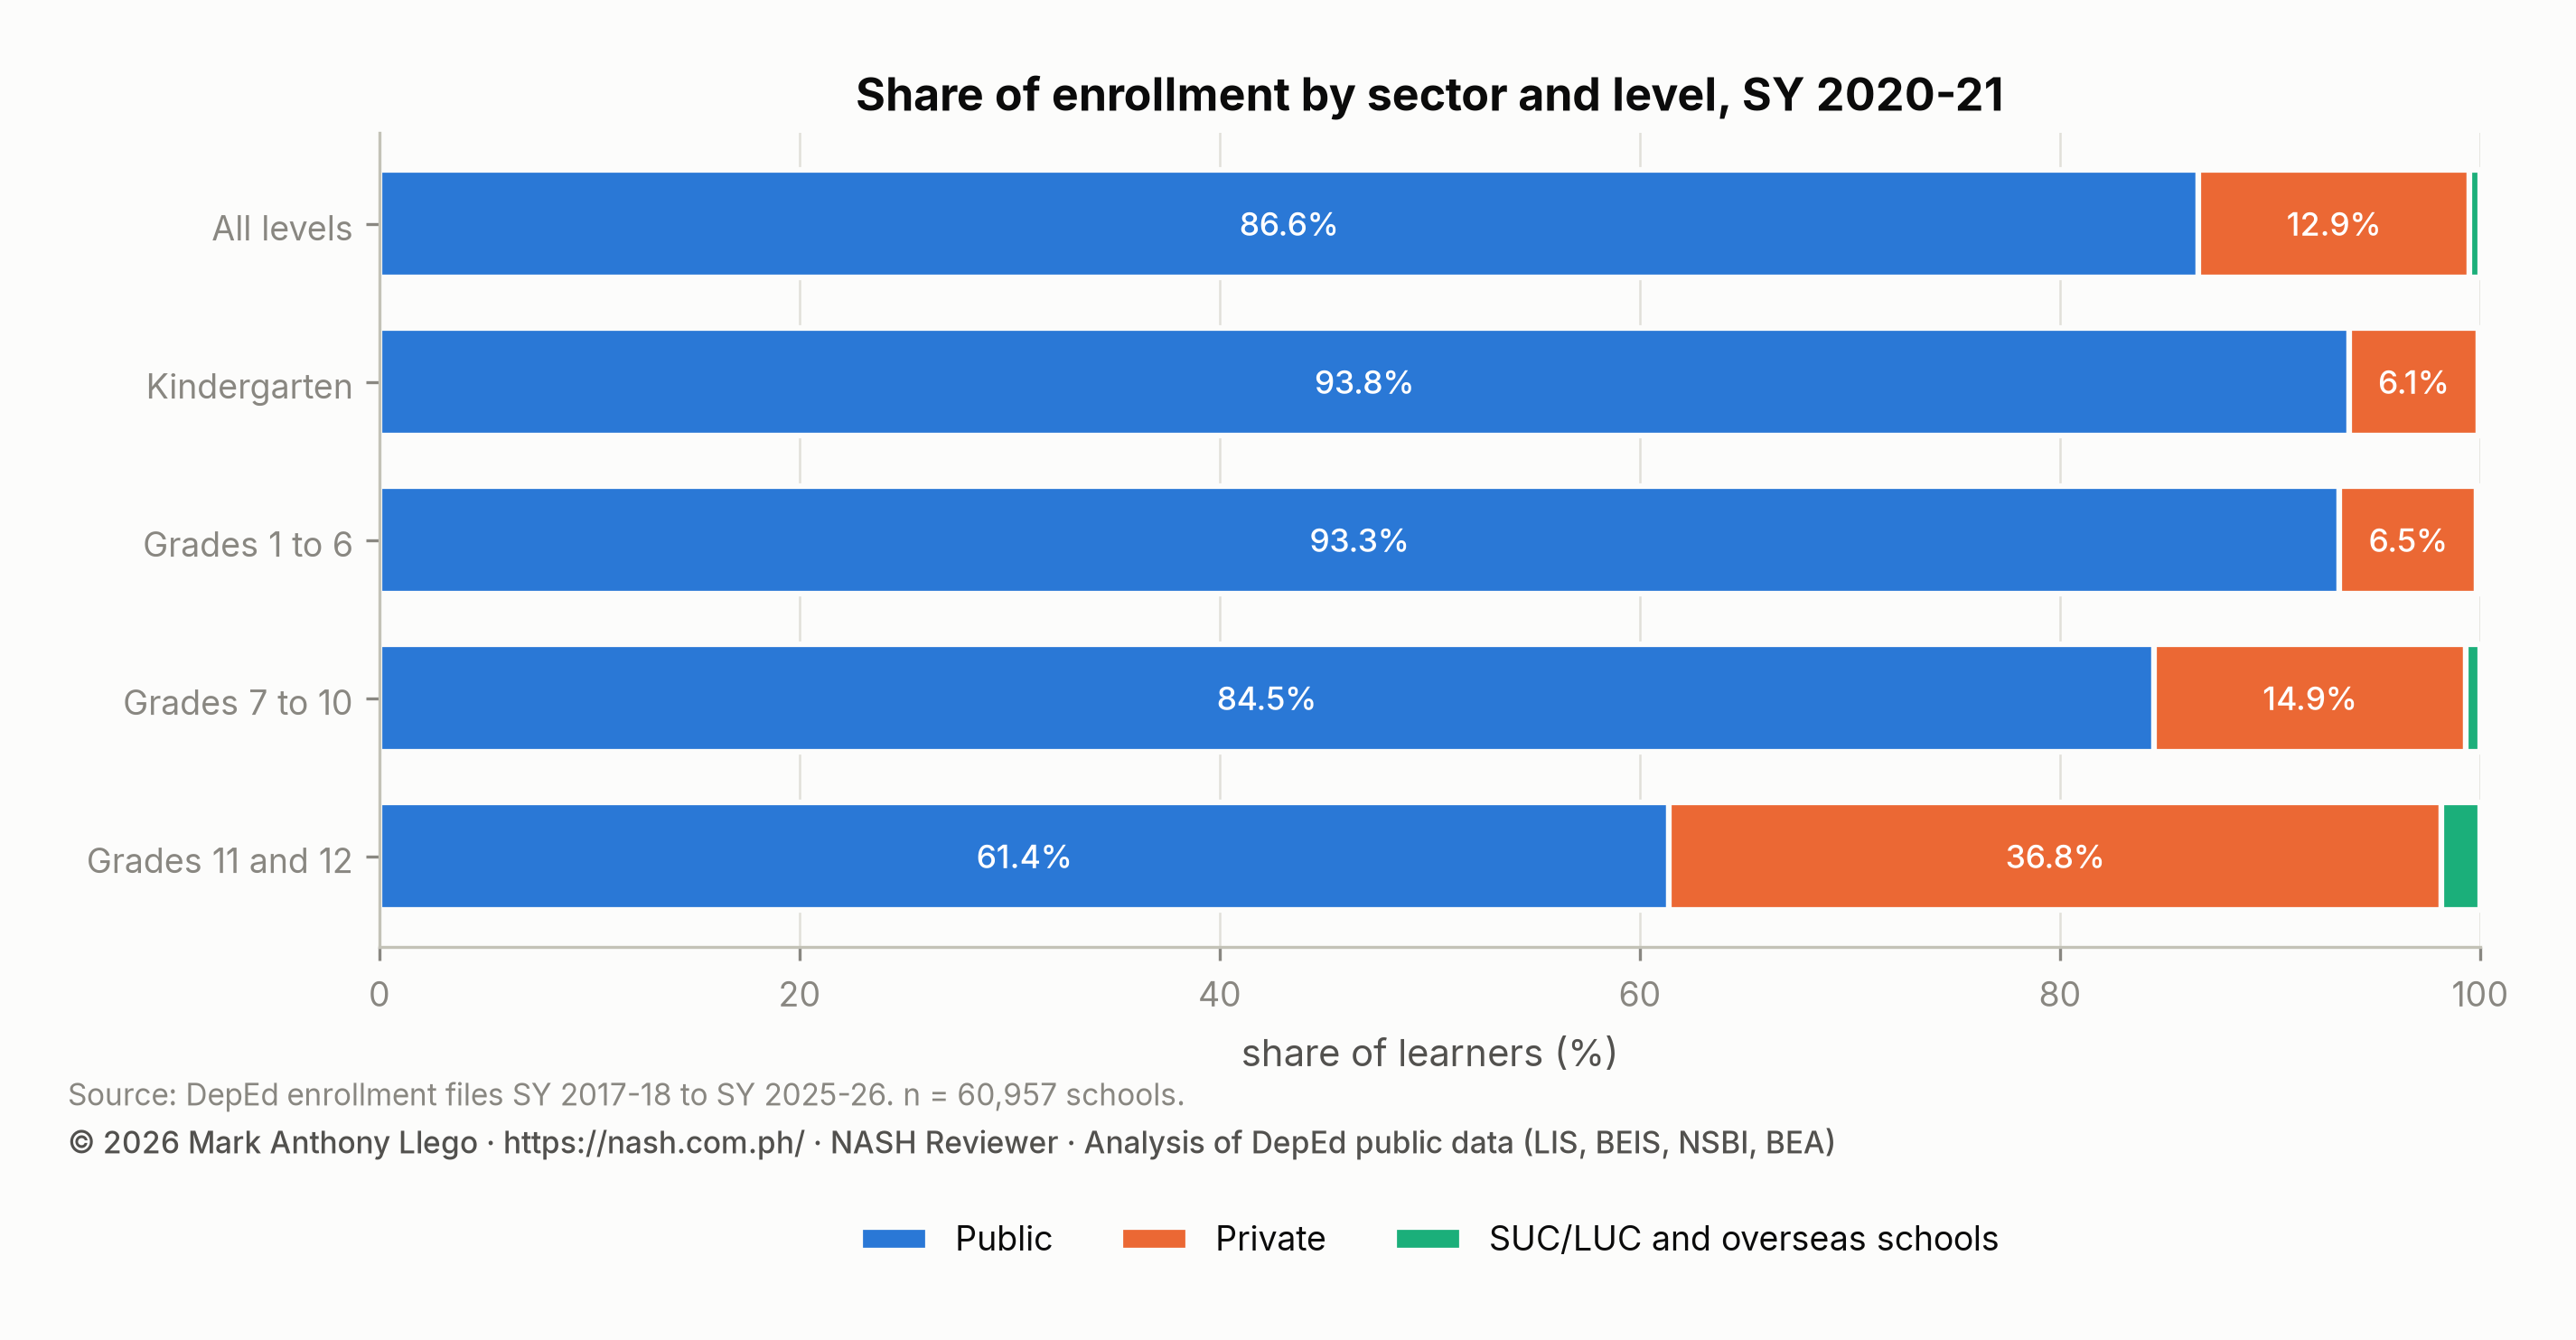
Private schools enrolled 3,375,748 learners, 928,928 fewer than the year before (−21.6%). They numbered 13,256 schools, 1,179 fewer than the year before. Public schools enrolled 22,712,409 learners, 139,486 more (+0.6%). The private share of all learners fell from 15.9% to 12.9% in a single year.
The loss was deepest at the youngest ages. Private kindergarten enrollment fell from 250,811 to 125,848, a drop of 49.8%. Private elementary enrollment including kindergarten fell 37.1%, from 1,507,287 to 947,568. Private junior high lost 14.0% and private senior high 12.4%. By level, private schools held 6.1% of kindergarten learners, down from 12.3% a year earlier. They held 6.5% of Grades 1 to 6, down from 9.5%. In Grades 7 to 10 their share fell from 16.9% to 14.9%. In senior high it fell from 42.5% to 36.8%.
The file cannot show where the private learners went, but the arithmetic sets a limit. Private schools lost 928,928 learners and public schools gained 139,486. Even if every public gain was a transfer from a private school, about 790,000 learners who would have been in a private school were in no school in the file. Some had deferred a year, and some were being taught at home. The next report shows how many came back: SY 2021-2022 added 1.33 million learners, more than this year lost.
Enrollment by grade: fewer learners continued at every step
| Grade | Learners | Share of total | SY 2019-20 | Change | Change (%) |
|---|---|---|---|---|---|
| Kindergarten | 2,055,635 | 7.8% | 2,044,745 | +10,890 | +0.5% |
| Grade 1 | 2,029,223 | 7.7% | 2,448,099 | -418,876 | -17.1% |
| Grade 2 | 2,314,200 | 8.8% | 2,306,031 | +8,169 | +0.4% |
| Grade 3 | 2,209,280 | 8.4% | 1,924,797 | +284,483 | +14.8% |
| Grade 4 | 1,847,248 | 7.0% | 2,096,355 | -249,107 | -11.9% |
| Grade 5 | 2,024,970 | 7.7% | 2,191,225 | -166,255 | -7.6% |
| Grade 6 | 2,115,040 | 8.1% | 2,259,667 | -144,627 | -6.4% |
| Grade 7 | 2,096,738 | 8.0% | 2,287,310 | -190,572 | -8.3% |
| Grade 8 | 2,138,517 | 8.2% | 2,318,290 | -179,773 | -7.8% |
| Grade 9 | 2,161,860 | 8.2% | 2,071,210 | +90,650 | +4.4% |
| Grade 10 | 1,940,578 | 7.4% | 1,824,699 | +115,879 | +6.4% |
| Grade 11 | 1,705,109 | 6.5% | 1,699,863 | +5,246 | +0.3% |
| Grade 12 | 1,531,718 | 5.8% | 1,494,172 | +37,546 | +2.5% |
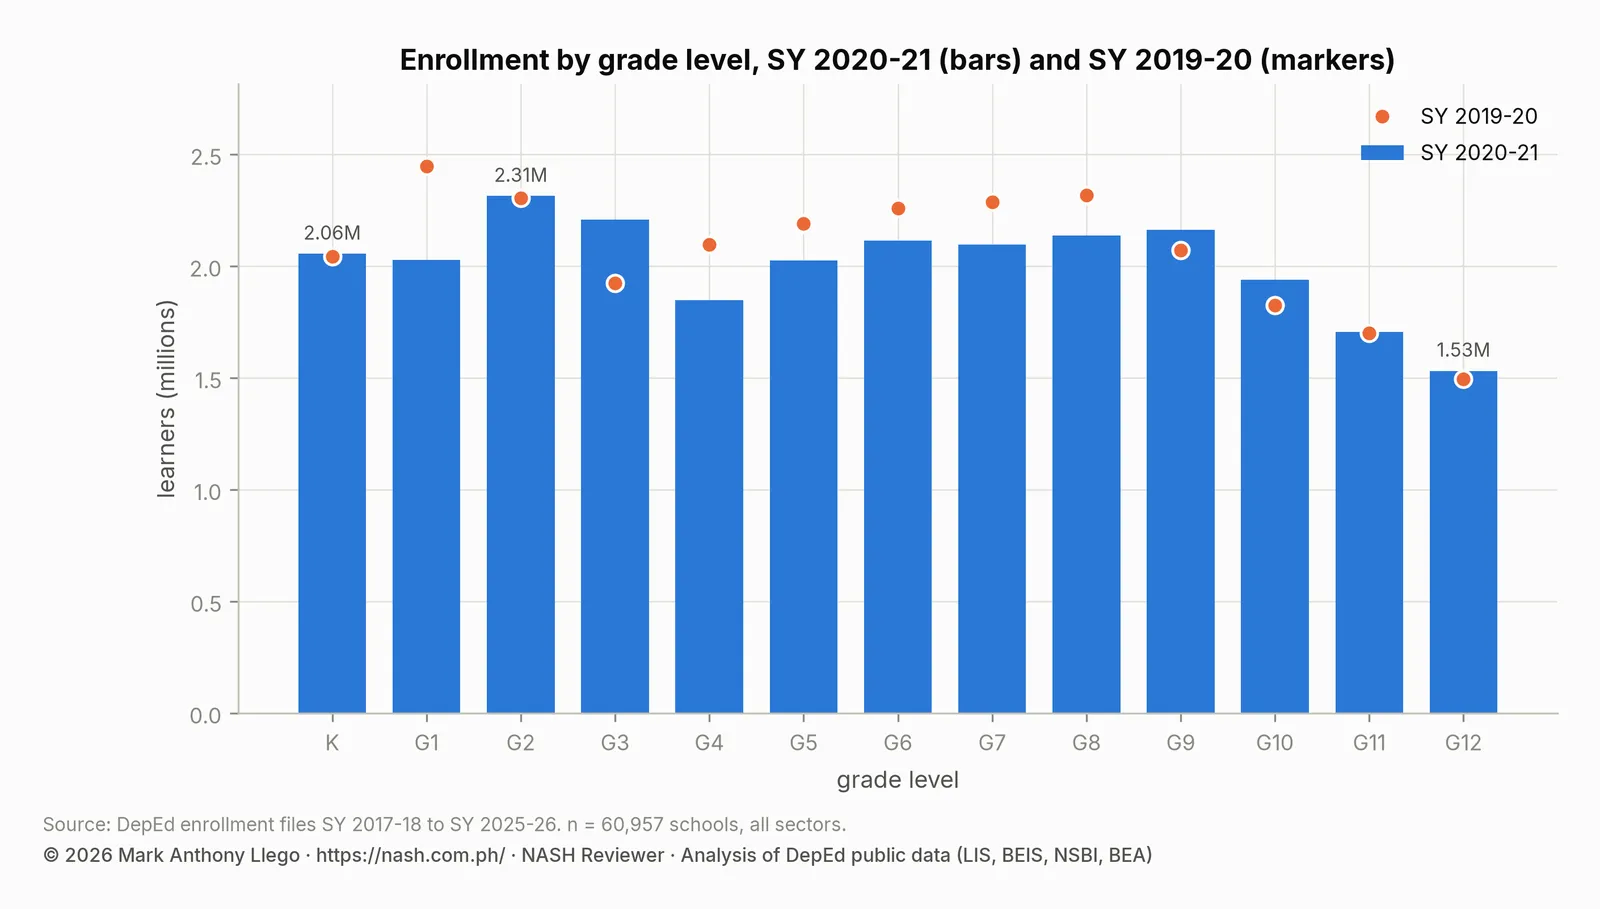
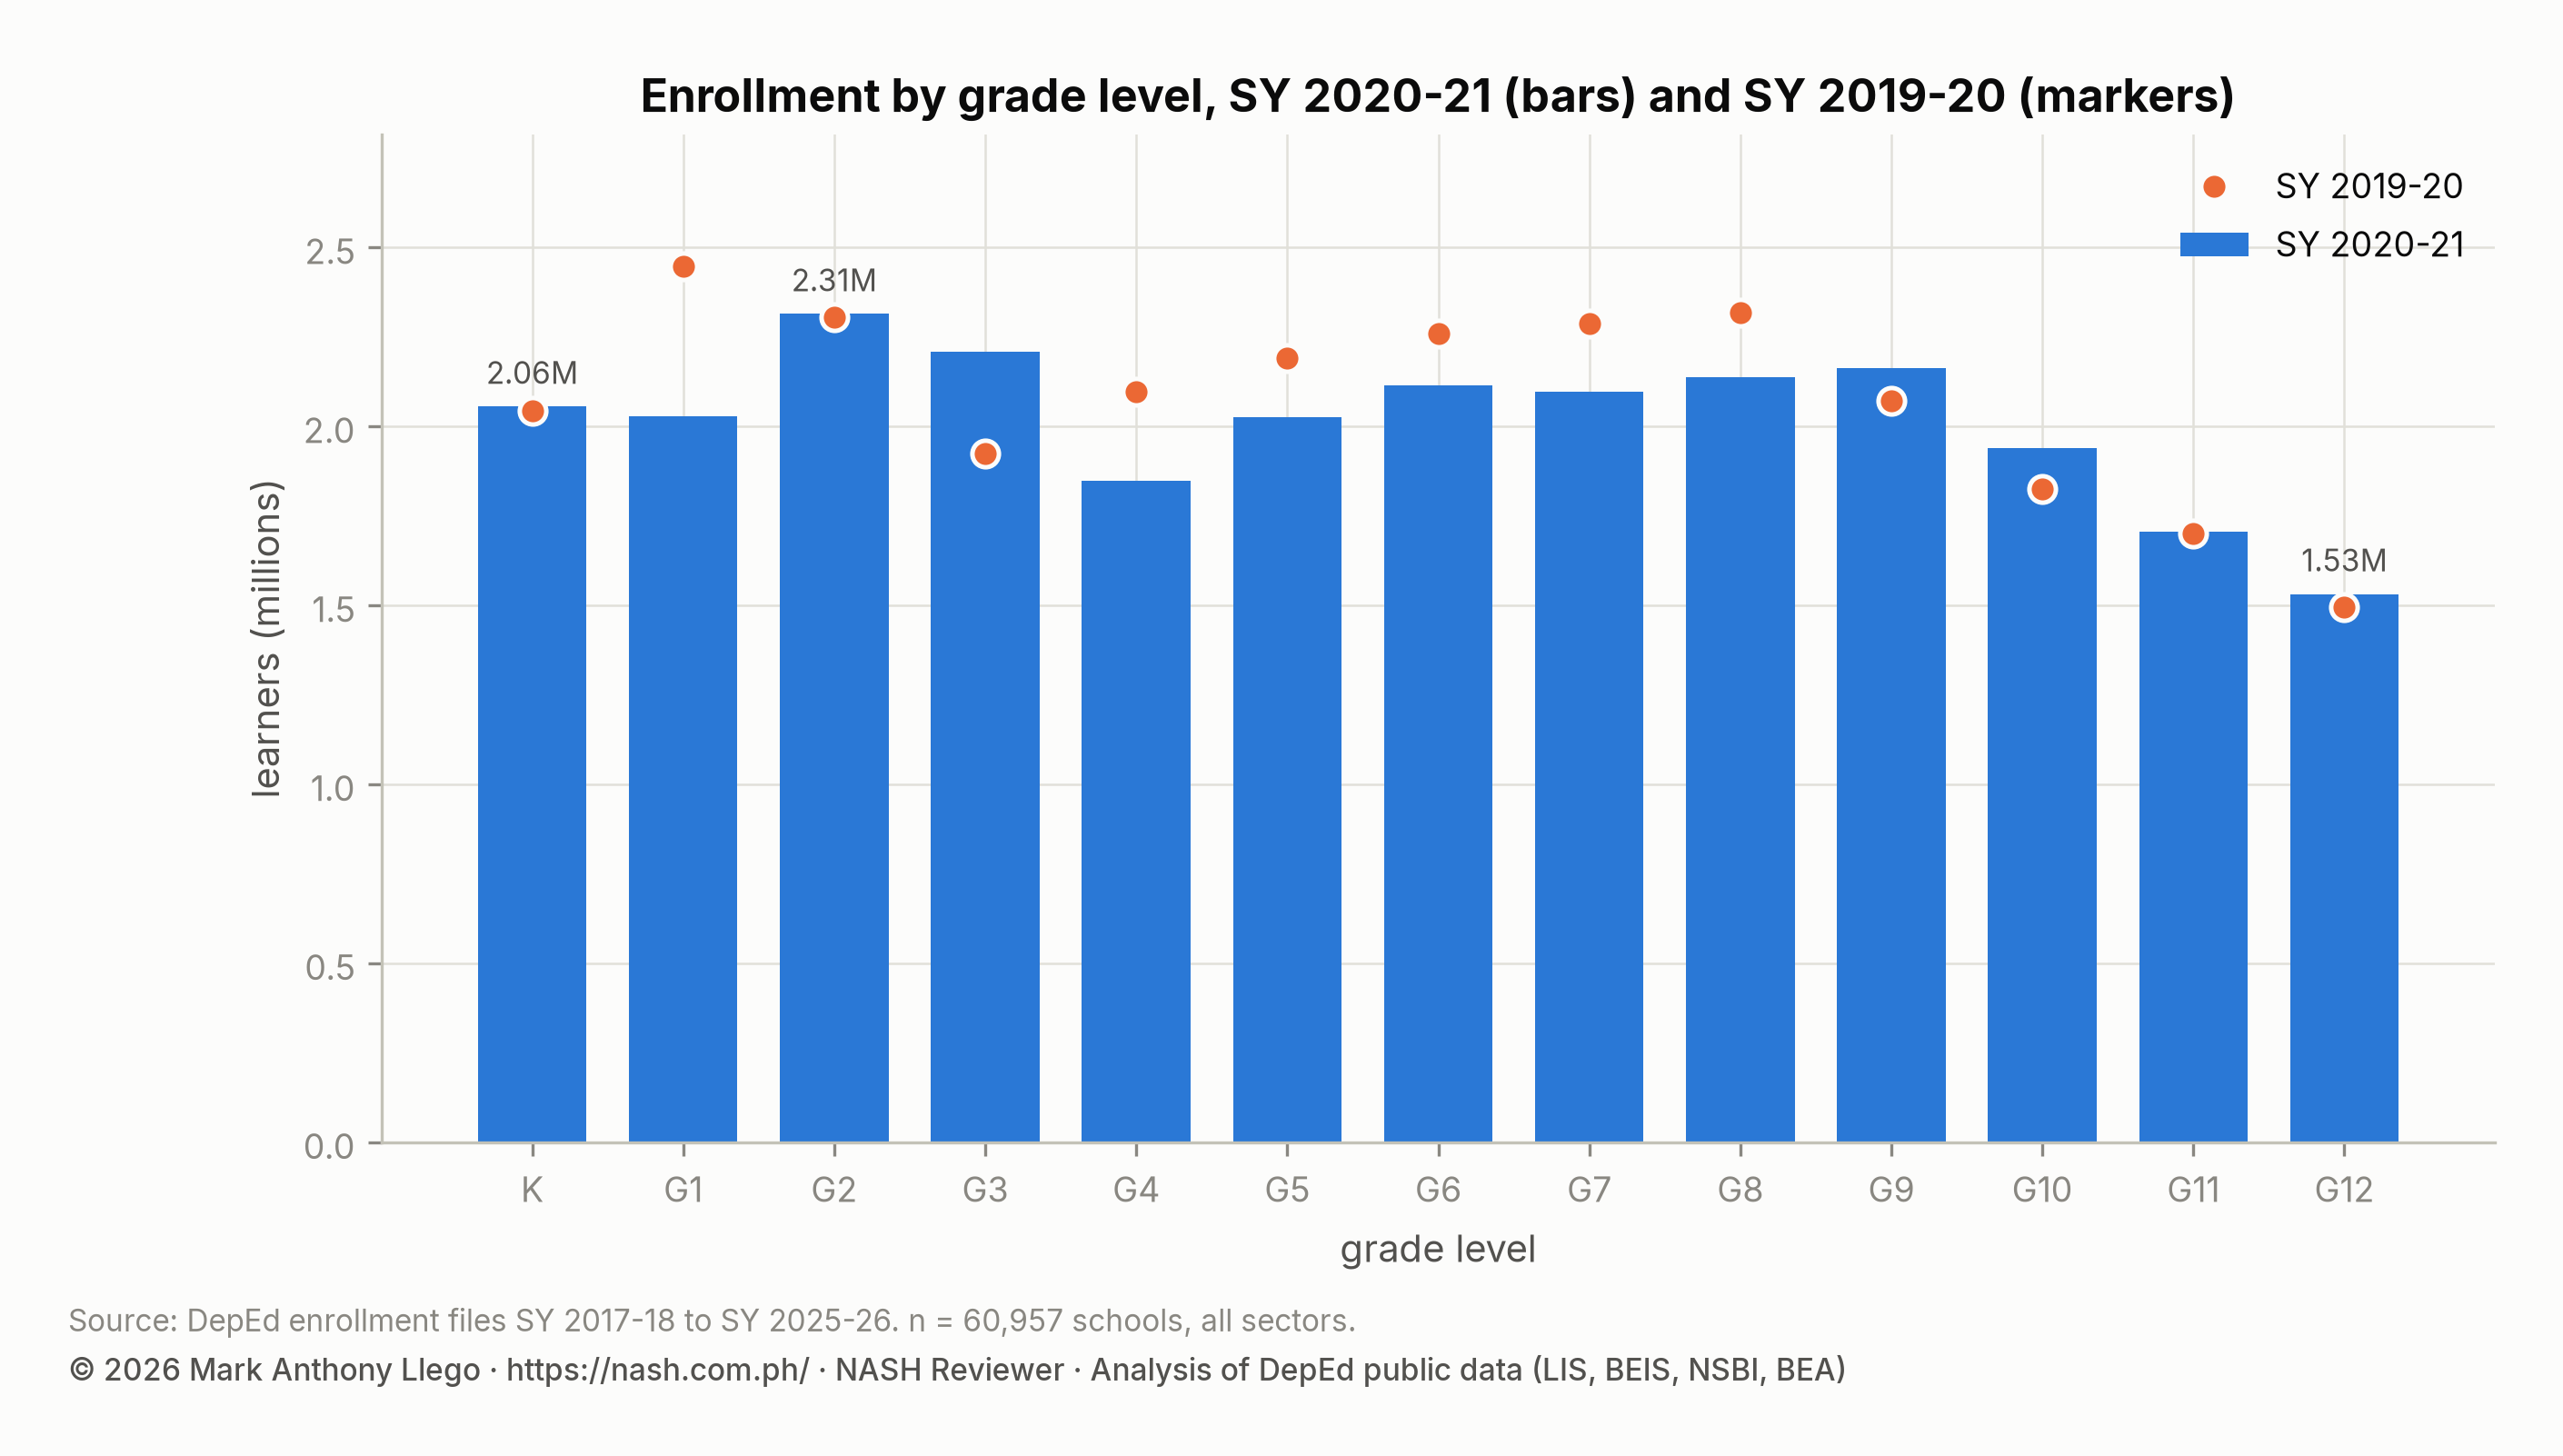
Grade 1 fell by 418,876 learners (−17.1%). Part of that fall is the small SY 2019-2020 kindergarten class moving up. The rest is new: this is the only year in the series in which Grade 1 enrolled fewer learners than kindergarten had the year before, 0.992 for every one. In every other year the ratio is above 1, because over-age children and children without a kindergarten record enter at Grade 1. In SY 2020-2021 they did not.
The same thing happened at every transition. Grade 4 took 0.960 of the previous Grade 3, and Grade 7 took 0.928 of the previous Grade 6. Grade 11 took 0.934 of the previous Grade 10, and Grade 12 took 0.901 of the previous Grade 11. All five ratios are the lowest in the series. The step from Grade 6 to 7 alone lost 7.2% of the cohort, against about 0.5% to 2% in normal years. Grade 4 held 1,847,248 learners. It was the small cohort that entered Grade 1 in SY 2017-2018, now smaller still, and it was the smallest grade in the elementary system.
Elementary as a whole lost 681,902 learners (−4.4%). Junior high lost 164,259 (−1.9%). Senior high gained 42,792 (+1.3%), because Grade 12 held 2.5% more learners than the year before. Kindergarten was flat at 2,055,635.
Enrollment by region: NCR lost 8.4%, four rural regions grew
| Region (SY 2025-26 boundaries) | Schools | Learners | Share of learners | SY 2019-20 | Change | Change (%) | Private share | Senior high share | Female share |
|---|---|---|---|---|---|---|---|---|---|
| Region IV-A | 6,312 | 3,662,581 | 14.0% | 3,833,280 | -170,699 | -4.5% | 17.7% | 12.3% | 49.2% |
| Region III | 5,258 | 2,833,197 | 10.8% | 2,915,454 | -82,257 | -2.8% | 15.0% | 12.9% | 49.1% |
| NCR | 3,059 | 2,670,620 | 10.2% | 2,916,295 | -245,675 | -8.4% | 23.2% | 13.9% | 49.6% |
| Region V | 4,445 | 1,667,388 | 6.4% | 1,785,756 | -118,368 | -6.6% | 8.4% | 12.1% | 49.1% |
| Region VII | 3,552 | 1,630,401 | 6.2% | 1,694,486 | -64,085 | -3.8% | 13.9% | 12.9% | 49.1% |
| Region X | 3,105 | 1,293,092 | 4.9% | 1,311,257 | -18,165 | -1.4% | 11.5% | 11.2% | 49.3% |
| Region XI | 2,727 | 1,289,331 | 4.9% | 1,358,826 | -69,495 | -5.1% | 11.6% | 11.4% | 49.6% |
| Region I | 3,426 | 1,287,192 | 4.9% | 1,291,071 | -3,879 | -0.3% | 10.8% | 13.8% | 48.5% |
| Region VIII | 4,470 | 1,267,220 | 4.8% | 1,261,310 | +5,910 | +0.5% | 5.8% | 12.6% | 49.0% |
| NIR | 2,727 | 1,236,727 | 4.7% | 1,250,904 | -14,177 | -1.1% | 9.3% | 12.0% | 49.3% |
| Region VI | 3,471 | 1,192,435 | 4.6% | 1,184,212 | +8,223 | +0.7% | 8.8% | 13.4% | 48.4% |
| Region XII | 2,632 | 1,190,374 | 4.5% | 1,199,786 | -9,412 | -0.8% | 9.2% | 11.1% | 49.6% |
| Region IX | 3,309 | 1,179,031 | 4.5% | 1,191,123 | -12,092 | -1.0% | 7.3% | 10.7% | 49.8% |
| Region II | 2,939 | 914,822 | 3.5% | 896,502 | +18,320 | +2.0% | 10.4% | 12.6% | 48.9% |
| MIMAROPA | 2,667 | 884,410 | 3.4% | 888,159 | -3,749 | -0.4% | 7.5% | 11.9% | 49.0% |
| BARMM | 2,333 | 789,972 | 3.0% | 813,434 | -23,462 | -2.9% | 11.8% | 8.2% | 51.8% |
| CARAGA | 2,393 | 781,551 | 3.0% | 776,855 | +4,696 | +0.6% | 7.9% | 12.0% | 48.8% |
| CAR | 2,099 | 436,568 | 1.7% | 439,895 | -3,327 | -0.8% | 17.3% | 13.6% | 49.0% |
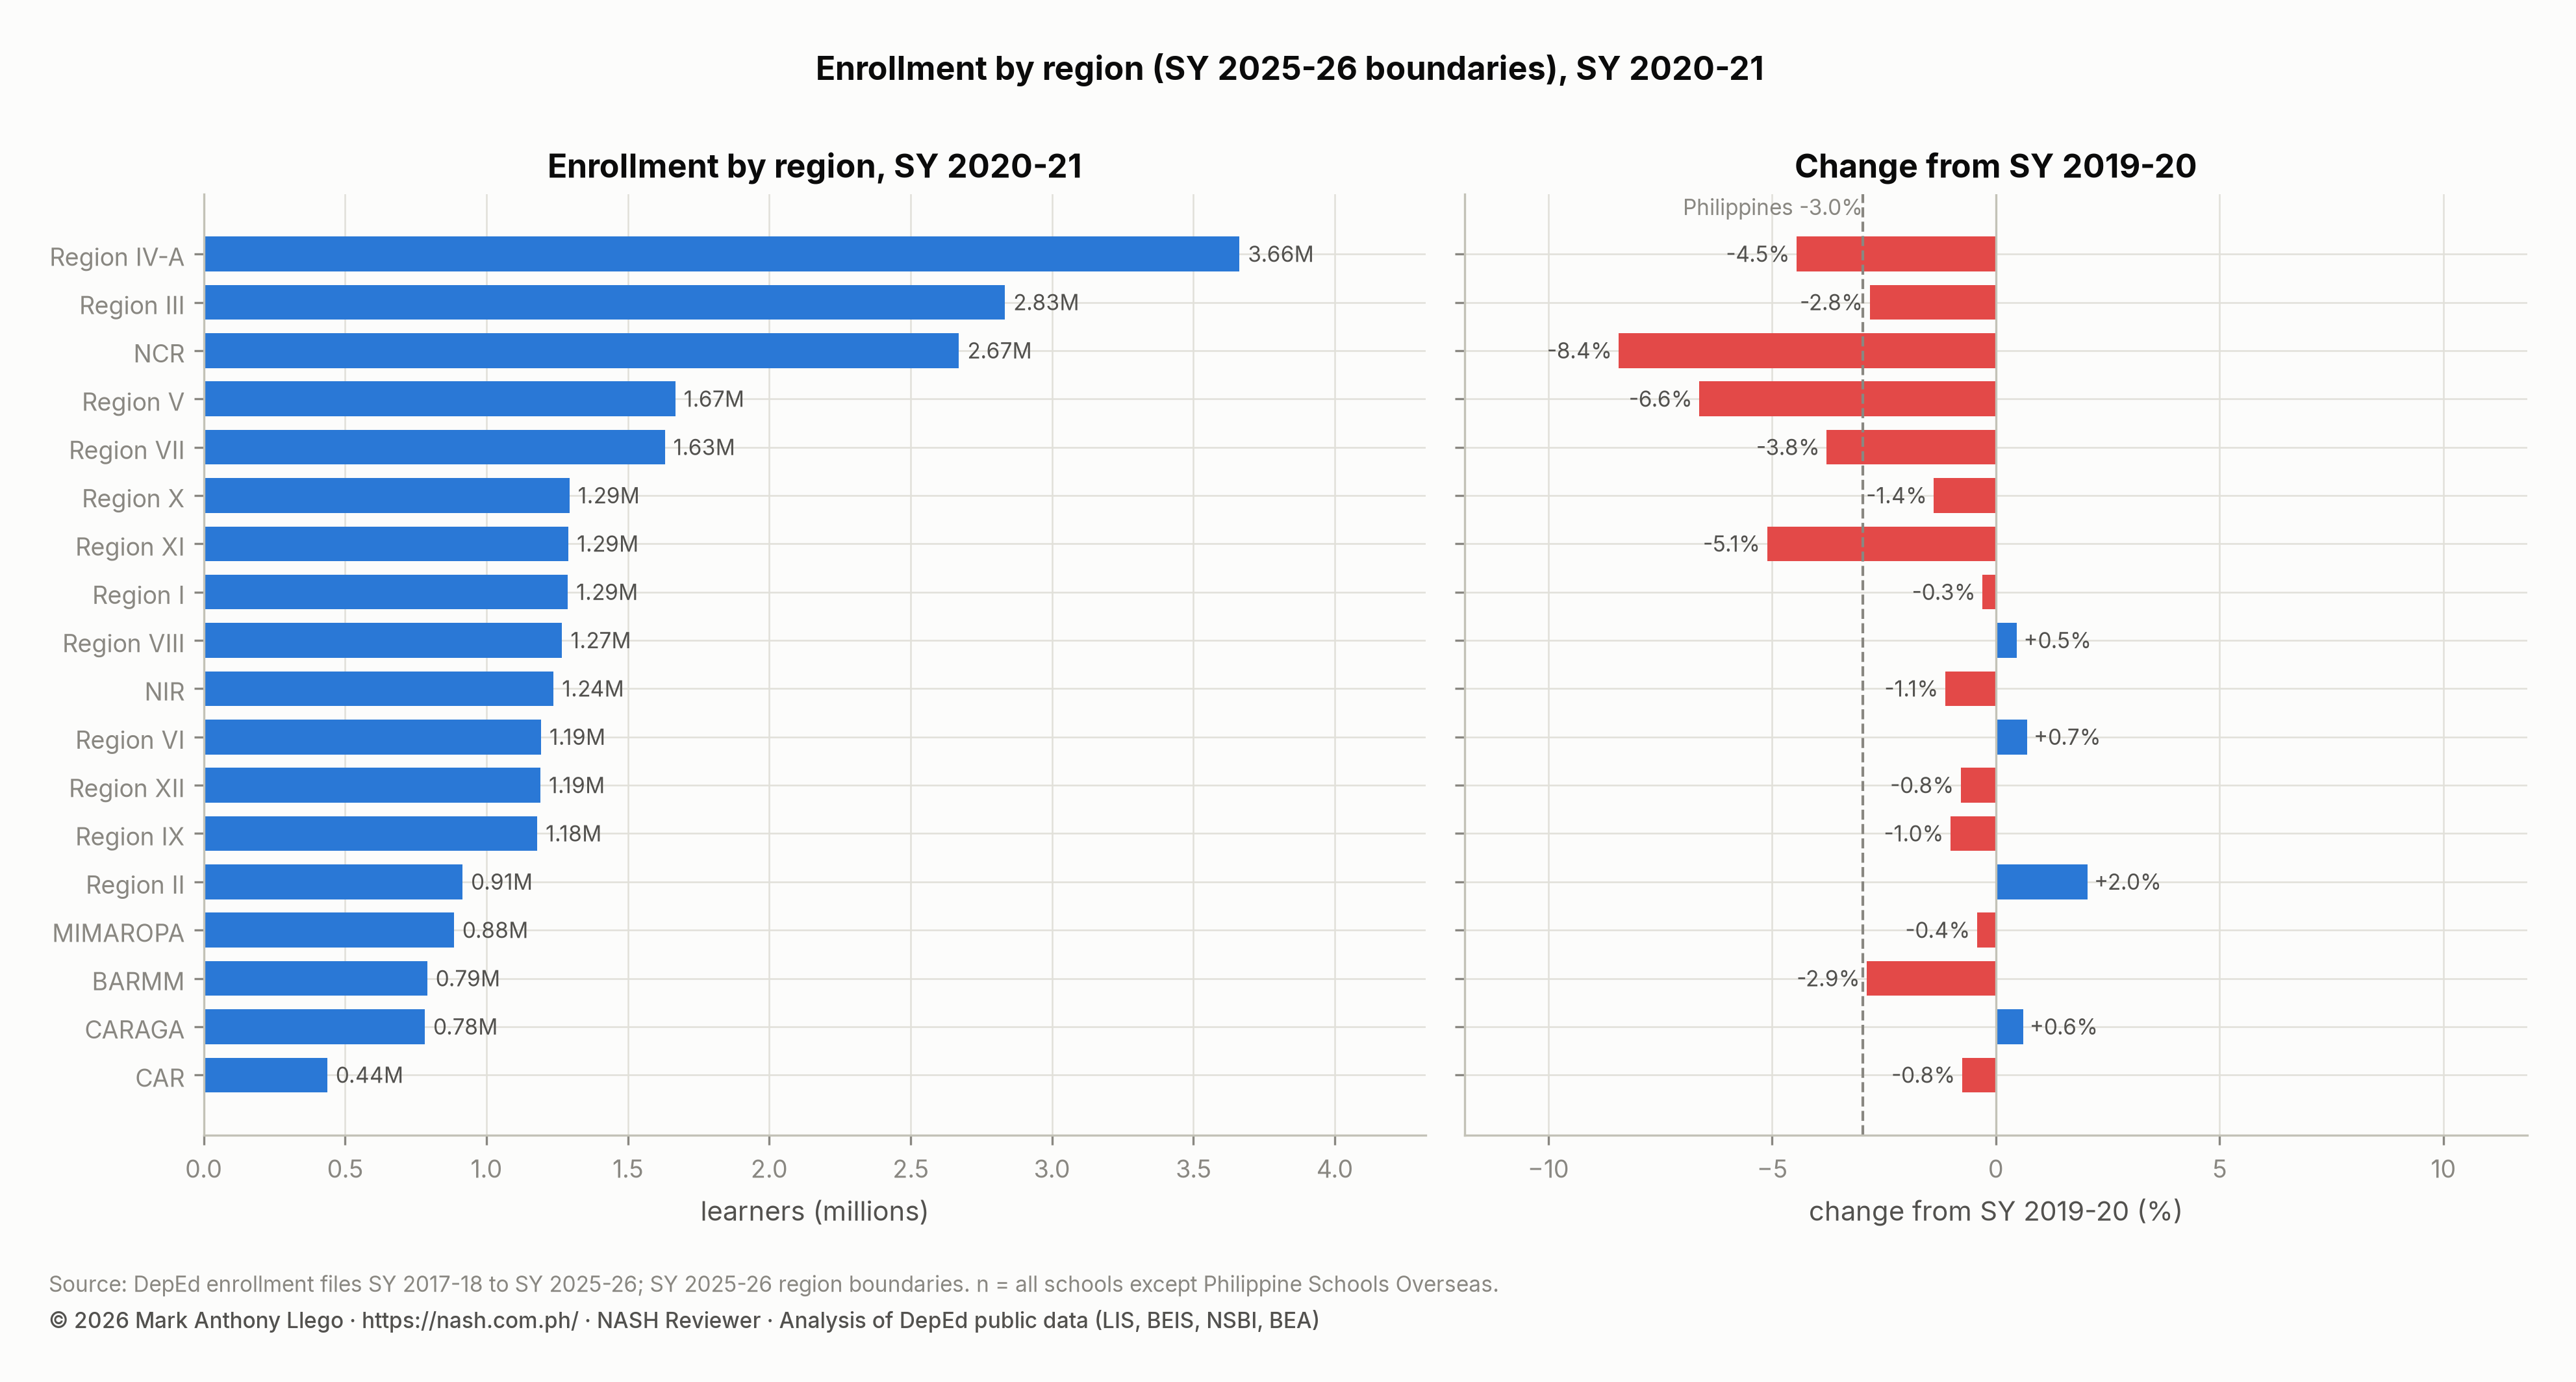
NCR lost 245,675 learners, 8.4% of its enrollment, the largest regional loss in any year of the series. Its private share fell from 28.9% to 23.2%. Region V lost 6.6% (118,368 learners) and Region XI 5.1%. Region IV-A lost 4.5%, or 170,699 learners, the second-largest absolute loss, and Region VII lost 3.8%. These are the regions with the most private schools and the largest cities.
Four regions grew: Region II by 2.0% and Region VI by 0.7%, with CARAGA and Region VIII growing by less. Region I and MIMAROPA were nearly flat. All six are predominantly rural, with private shares of 11% or less. The file cannot track individual learners. The pattern is consistent with families leaving the cities during the lockdowns and enrolling children in the provinces. The next year’s rebound, strongest in NCR, Region V and Region XI, is consistent with their return.
Enrollment by division: Quezon City no longer the largest
| Rank | Division | Region | Schools | Learners | Share of all learners |
|---|---|---|---|---|---|
| 1 | Cebu | Region VII | 1,321 | 586,586 | 2.2% |
| 2 | Bulacan | Region III | 905 | 574,987 | 2.2% |
| 3 | Quezon City | NCR | 810 | 564,553 | 2.2% |
| 4 | Rizal | Region IV-A | 766 | 524,337 | 2.0% |
| 5 | Iloilo | Region VI | 1,397 | 496,560 | 1.9% |
| 6 | Quezon | Region IV-A | 1,149 | 470,706 | 1.8% |
| 7 | Batangas | Region IV-A | 978 | 458,483 | 1.7% |
| 8 | Camarines Sur | Region V | 1,262 | 445,844 | 1.7% |
| 9 | Cavite | Region IV-A | 657 | 431,002 | 1.6% |
| 10 | Davao City | Region XI | 674 | 396,203 | 1.5% |
For the first time, Quezon City was not the country’s largest schools division. Its enrollment fell from 640,283 to 564,553 (−11.8%). Cebu (586,586) and Bulacan (574,987) passed it. Davao City lost 58,692 learners (−12.9%). Albay lost 33,281 (−13.5%). Dasmariñas City lost 21,383 (−11.9%). Valenzuela City lost 20,166 (−12.0%). The divisions that grew were small and rural: Quirino (+4.3%), Zamboanga del Norte (+4.2%), the City of Naga in Cebu, Dinagat Island and Kalinga.
| Division | Region | Schools | Learners, SY 2020-21 | Learners, SY 2019-20 | Change | Change (%) | |
|---|---|---|---|---|---|---|---|
| Fastest growth | Quirino | Region II | 206 | 52,276 | 50,142 | +2,134 | +4.3% |
| Fastest growth | Zamboanga del Norte | Region IX | 796 | 228,765 | 219,551 | +9,214 | +4.2% |
| Fastest growth | City of Naga, Cebu | Region VII | 54 | 33,101 | 31,939 | +1,162 | +3.6% |
| Fastest growth | Dinagat Island | CARAGA | 145 | 31,556 | 30,490 | +1,066 | +3.5% |
| Fastest growth | Kalinga | CAR | 200 | 27,063 | 26,155 | +908 | +3.5% |
| Steepest decline | Cavite City | Region IV-A | 27 | 20,156 | 23,669 | -3,513 | -14.8% |
| Steepest decline | Albay | Region V | 614 | 212,766 | 246,047 | -33,281 | -13.5% |
| Steepest decline | Davao City | Region XI | 674 | 396,203 | 454,895 | -58,692 | -12.9% |
| Steepest decline | Valenzuela City | NCR | 147 | 147,598 | 167,764 | -20,166 | -12.0% |
| Steepest decline | Dasmarinas City | Region IV-A | 186 | 158,913 | 180,296 | -21,383 | -11.9% |
No new division appears in this file. The 86-learner division of Lanao del Sur - IB, which existed only in the SY 2019-2020 file, is gone.
Senior high school strands: TVL falls for the first time
| Track or strand | Learners | Share of senior high | SY 2019-20 | Change | Change (%) |
|---|---|---|---|---|---|
| TVL | 993,856 | 30.7% | 1,082,531 | -88,675 | -8.2% |
| HUMSS | 769,252 | 23.8% | 639,746 | +129,506 | +20.2% |
| GAS | 539,413 | 16.7% | 534,934 | +4,479 | +0.8% |
| STEM | 523,658 | 16.2% | 491,349 | +32,309 | +6.6% |
| ABM | 385,359 | 11.9% | 412,474 | -27,115 | -6.6% |
| Arts and Design | 12,514 | 0.4% | 14,544 | -2,030 | -14.0% |
| Maritime | 7,786 | 0.2% | 12,974 | -5,188 | -40.0% |
| Sports | 4,989 | 0.2% | 5,483 | -494 | -9.0% |
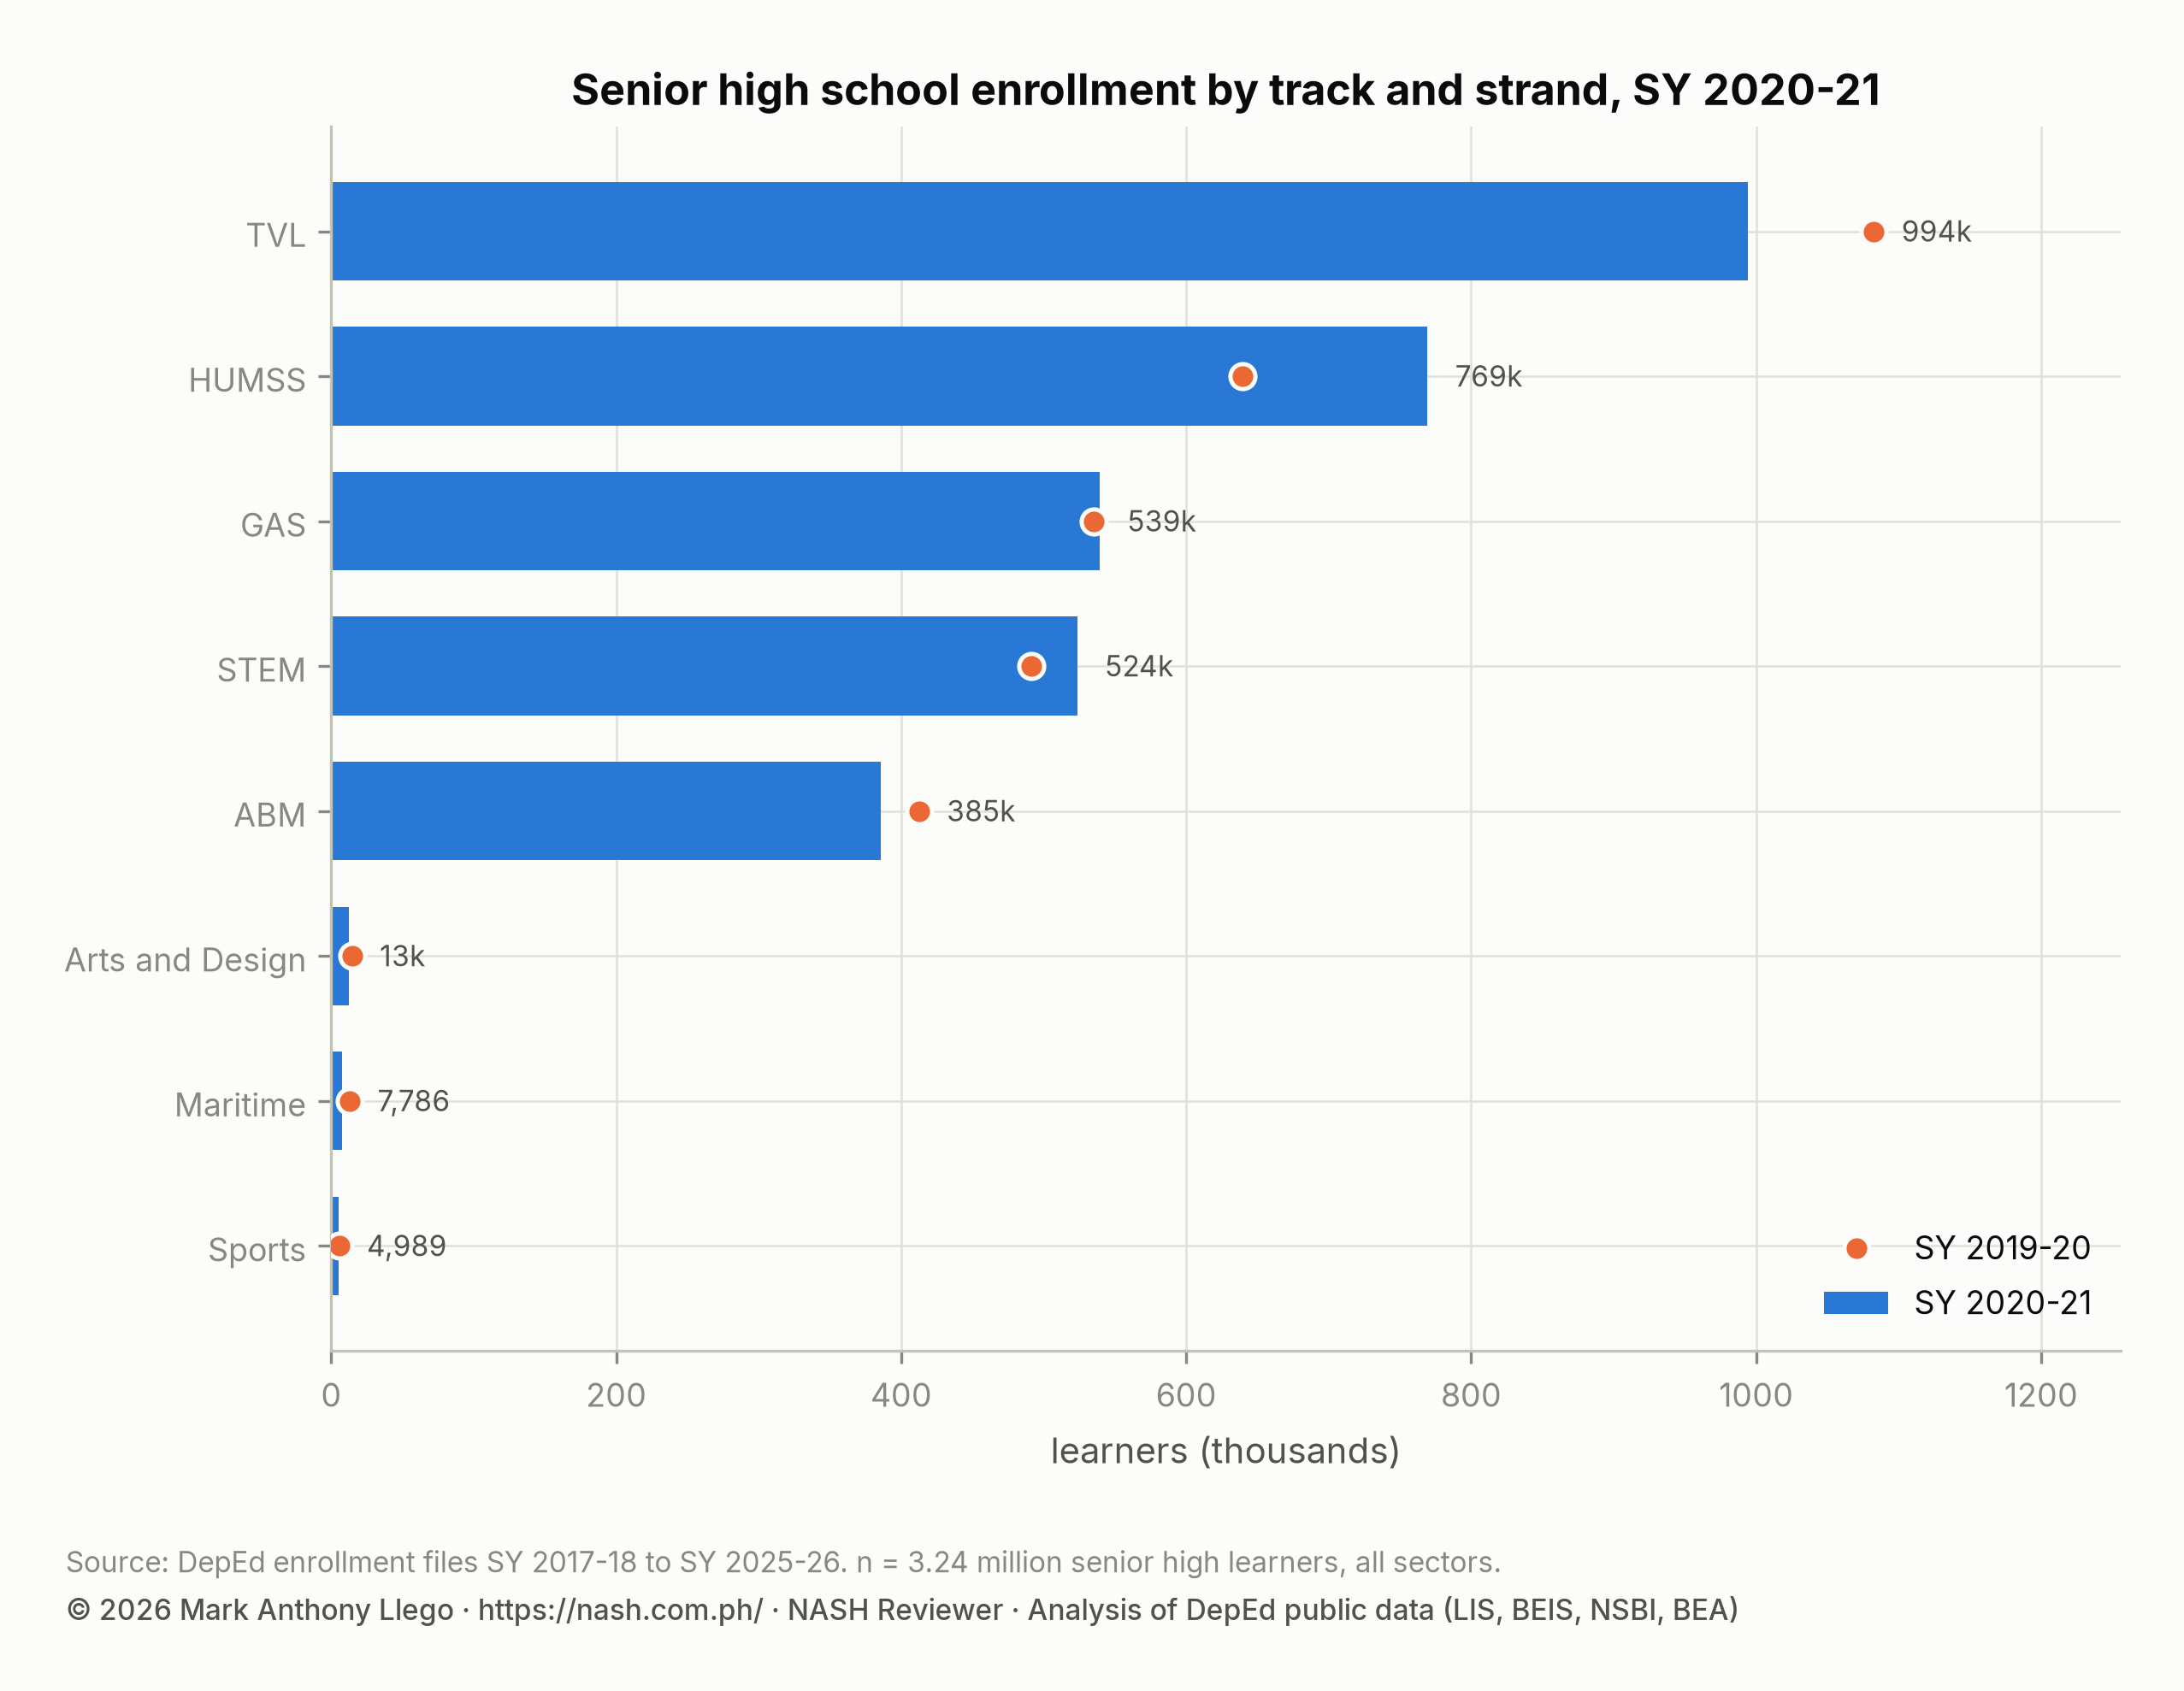
Senior high enrolled 3,236,827 learners, and the strand mix changed sharply. The TVL track depends on workshops, laboratories and work immersion. It lost 88,675 learners (−8.2%), its first decline. Its share of senior high fell from 33.9% to 30.7%. HUMSS gained 129,506 (+20.2%). Science, Technology, Engineering and Mathematics (STEM) grew 6.6%, the General Academic Strand (GAS) was flat, and Accountancy, Business and Management (ABM) lost 6.6%. Maritime, a small strand that requires shipboard training, lost 40%.
School size: smaller private schools and 439 schools with zero learners
The median private school shrank from 111 learners to 82. Among private schools, 37.2% had 50 learners or fewer, up from 30.8%. The median public school was unchanged at 233. The file also lists 439 schools with zero learners, the most of any year; they count as schools but add nothing to the totals. Compared with the files before and after it, only 243 private schools were new this year. Another 833 private schools present this year are absent from the SY 2021-2022 file, with 30,082 learners in their last year.
| Learners per school | Schools | Share of schools | Learners | Share of learners | Public schools | Share of public schools | Private schools | Share of private schools |
|---|---|---|---|---|---|---|---|---|
| 1–50 | 7,582 | 12.4% | 186,770 | 0.7% | 2,619 | 5.5% | 4,934 | 37.2% |
| 51–100 | 7,994 | 13.1% | 603,050 | 2.3% | 5,655 | 11.9% | 2,324 | 17.5% |
| 101–200 | 14,536 | 23.8% | 2,144,210 | 8.2% | 12,460 | 26.3% | 2,023 | 15.3% |
| 201–500 | 17,628 | 28.9% | 5,591,928 | 21.3% | 15,387 | 32.4% | 2,153 | 16.2% |
| 501–1,000 | 7,370 | 12.1% | 5,116,028 | 19.5% | 6,220 | 13.1% | 1,091 | 8.2% |
| 1,001–2,000 | 3,708 | 6.1% | 5,147,416 | 19.6% | 3,167 | 6.7% | 512 | 3.9% |
| over 2,000 | 2,139 | 3.5% | 7,437,620 | 28.4% | 1,913 | 4.0% | 219 | 1.7% |
How to read the SY 2020-2021 enrollment file
- DepEd collected enrollment remotely before the October 5, 2020 opening. The file’s structure is unchanged from SY 2019-2020. The comparison with the year before, not the file, is what is unusual this year.
- Regions follow the SY 2025-2026 boundaries: Sulu’s 470 schools are counted under Region IX, Cotabato City’s 82 schools under BARMM, and the Negros divisions under NIR.
- The 1,422 private schools that were in the SY 2019-2020 file and not in this one are counted in the previous year’s report as exits. Their 67,236 learners are part of this year’s private loss.
- Changes compare all schools in each file. Enrollment is a beginning-of-year count and cannot show how many learners stopped participating during the year.
Frequently asked questions
How much did DepEd enrollment fall in SY 2020-2021, the first pandemic school year?
Enrollment fell by 803,369 learners, or 3.0%. It went from 27,030,391 to 26,227,022. Private enrollment fell by 928,928 (−21.6%). Public enrollment rose by 139,486 (+0.6%).
Which region lost the most learners in SY 2020-2021?
NCR lost the most, 245,675 learners or 8.4%. Region V (−6.6%), Region XI (−5.1%) and Region IV-A (−4.5%) followed. Region II, Region VI, CARAGA and Region VIII grew.
Did senior high school enrollment fall in SY 2020-2021?
No. Senior high enrollment rose 1.3% to 3,236,827. Within it, the TVL track lost 8.2% and HUMSS gained 20.2%.
Download the data
The cleaned, harmonized DepEd files behind this series are free to download in CSV and Parquet, with a codebook and checksums, under the terms of use set out in the release. Download Cleaned DepEd School Data, SY 2017-18 to 2025-26 documents every file and column. The files themselves are at data.nash.com.ph, starting with the README, the SY 2023-24 school master file (CSV, 8.0 MB) and the nine-year enrollment panel (Parquet, 17.2 MB).
More in this series
- Previous year: DepEd Enrollment SY 2019-2020: The Pre-Pandemic Peak
- Next year: DepEd Enrollment SY 2021-2022: Rebound to 27.6 Million
- The nine-year overview: DepEd Enrollment Trends SY 2017-2018 to SY 2025-2026
- All nine annual reports: SY 2017-18, SY 2018-19, SY 2019-20, SY 2020-21, SY 2021-22, SY 2022-23, SY 2023-24, SY 2024-25, SY 2025-26
- DepEd Data for Aspiring School Heads: Where to Start
- For aspiring school heads: How to Read DepEd Data and the full report, Philippine basic education in numbers
Analysis and charts by Mark Anthony Llego for NASH Reviewer. Data: Department of Education enrollment datasets for SY 2019-20 and SY 2020-21 (Learner Information System). Charts may be reused only with written permission from support@nash.com.ph.