DepEd’s SY 2021-2022 enrollment file is the count taken at the opening of the second pandemic school year. Enrollment rose by 1,333,639 learners to 27,560,661, an increase of 5.1%, the largest in the series by a wide margin. The system regained what it had lost in SY 2020-2021 and more: the total passed its pre-pandemic level by 530,000.
The school year opened on September 13, 2021, still in distance learning. A pilot of limited in-person classes began in November and widened through the year.
The year’s most important number is in senior high school, which added 587,886 learners, or 18.2%, in one year. The year’s most important ratio is 1.084: for every Grade 10 learner in SY 2020-2021 there were 1.084 Grade 11 learners in SY 2021-2022. A cohort does not grow as it moves from one grade to the next unless learners who had left come back.
Key findings
- Enrollment rose by 1,333,639 learners (+5.1%) to 27,560,661. The total passed the pre-pandemic SY 2019-2020 level by 530,270.
- Senior high added 587,886 learners (+18.2%). Grade 11 alone rose by 397,593, and every grade-to-grade flow ratio went above one.
- Public enrollment reached 24,127,495, the highest in the nine years. Private enrollment fell again, to 3,307,342, and the private share reached its low of 12.0%.
- Seventeen regions grew and Region XII was flat. BARMM grew 11.3%, partly because the file lists the new Special Geographic Area Division for the first time.
- Every major senior high strand grew. The General Academic Strand (GAS) rose 27.1%, Humanities and Social Sciences (HUMSS) 24.8% and the Technical-Vocational-Livelihood (TVL) track 11.3%.
| Item | SY 2021-22 | SY 2020-21 | Change | Change (%) |
|---|---|---|---|---|
| Schools in the file | 60,429 | 60,957 | -528 | -0.9% |
| Schools reporting enrollment | 60,429 | 60,957 | -528 | -0.9% |
| Total enrollment | 27,560,661 | 26,227,022 | +1,333,639 | +5.1% |
| Kindergarten | 2,181,189 | 2,055,635 | +125,554 | +6.1% |
| Grades 1 to 6 | 12,738,002 | 12,539,961 | +198,041 | +1.6% |
| Elementary non-graded | 58,800 | 55,208 | +3,592 | +6.5% |
| Elementary (K to 6 and non-graded) | 14,977,991 | 14,650,804 | +327,187 | +2.2% |
| Junior high school (Grades 7 to 10 and non-graded) | 8,757,957 | 8,339,391 | +418,566 | +5.0% |
| Senior high school (Grades 11 and 12) | 3,824,713 | 3,236,827 | +587,886 | +18.2% |
| Female learners | 13,519,031 | 12,915,363 | +603,668 | +4.7% |
| Male learners | 14,041,630 | 13,311,659 | +729,971 | +5.5% |
| Female share of learners | 49.1% | 49.2% | -0.19 points |
Enrollment by grade: returning learners in senior high
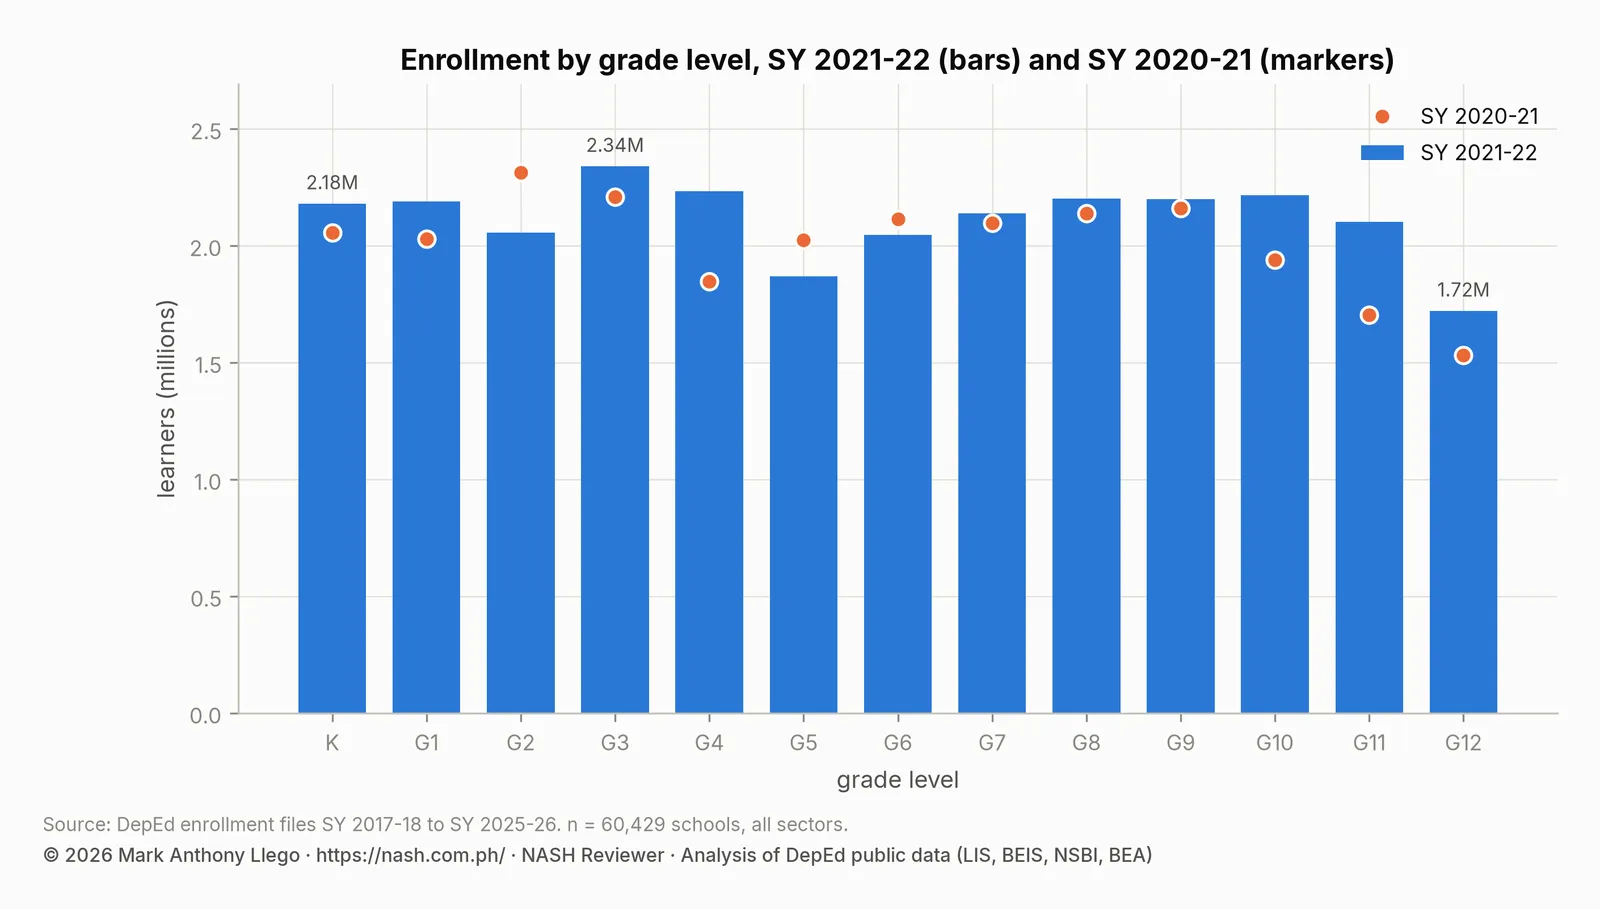
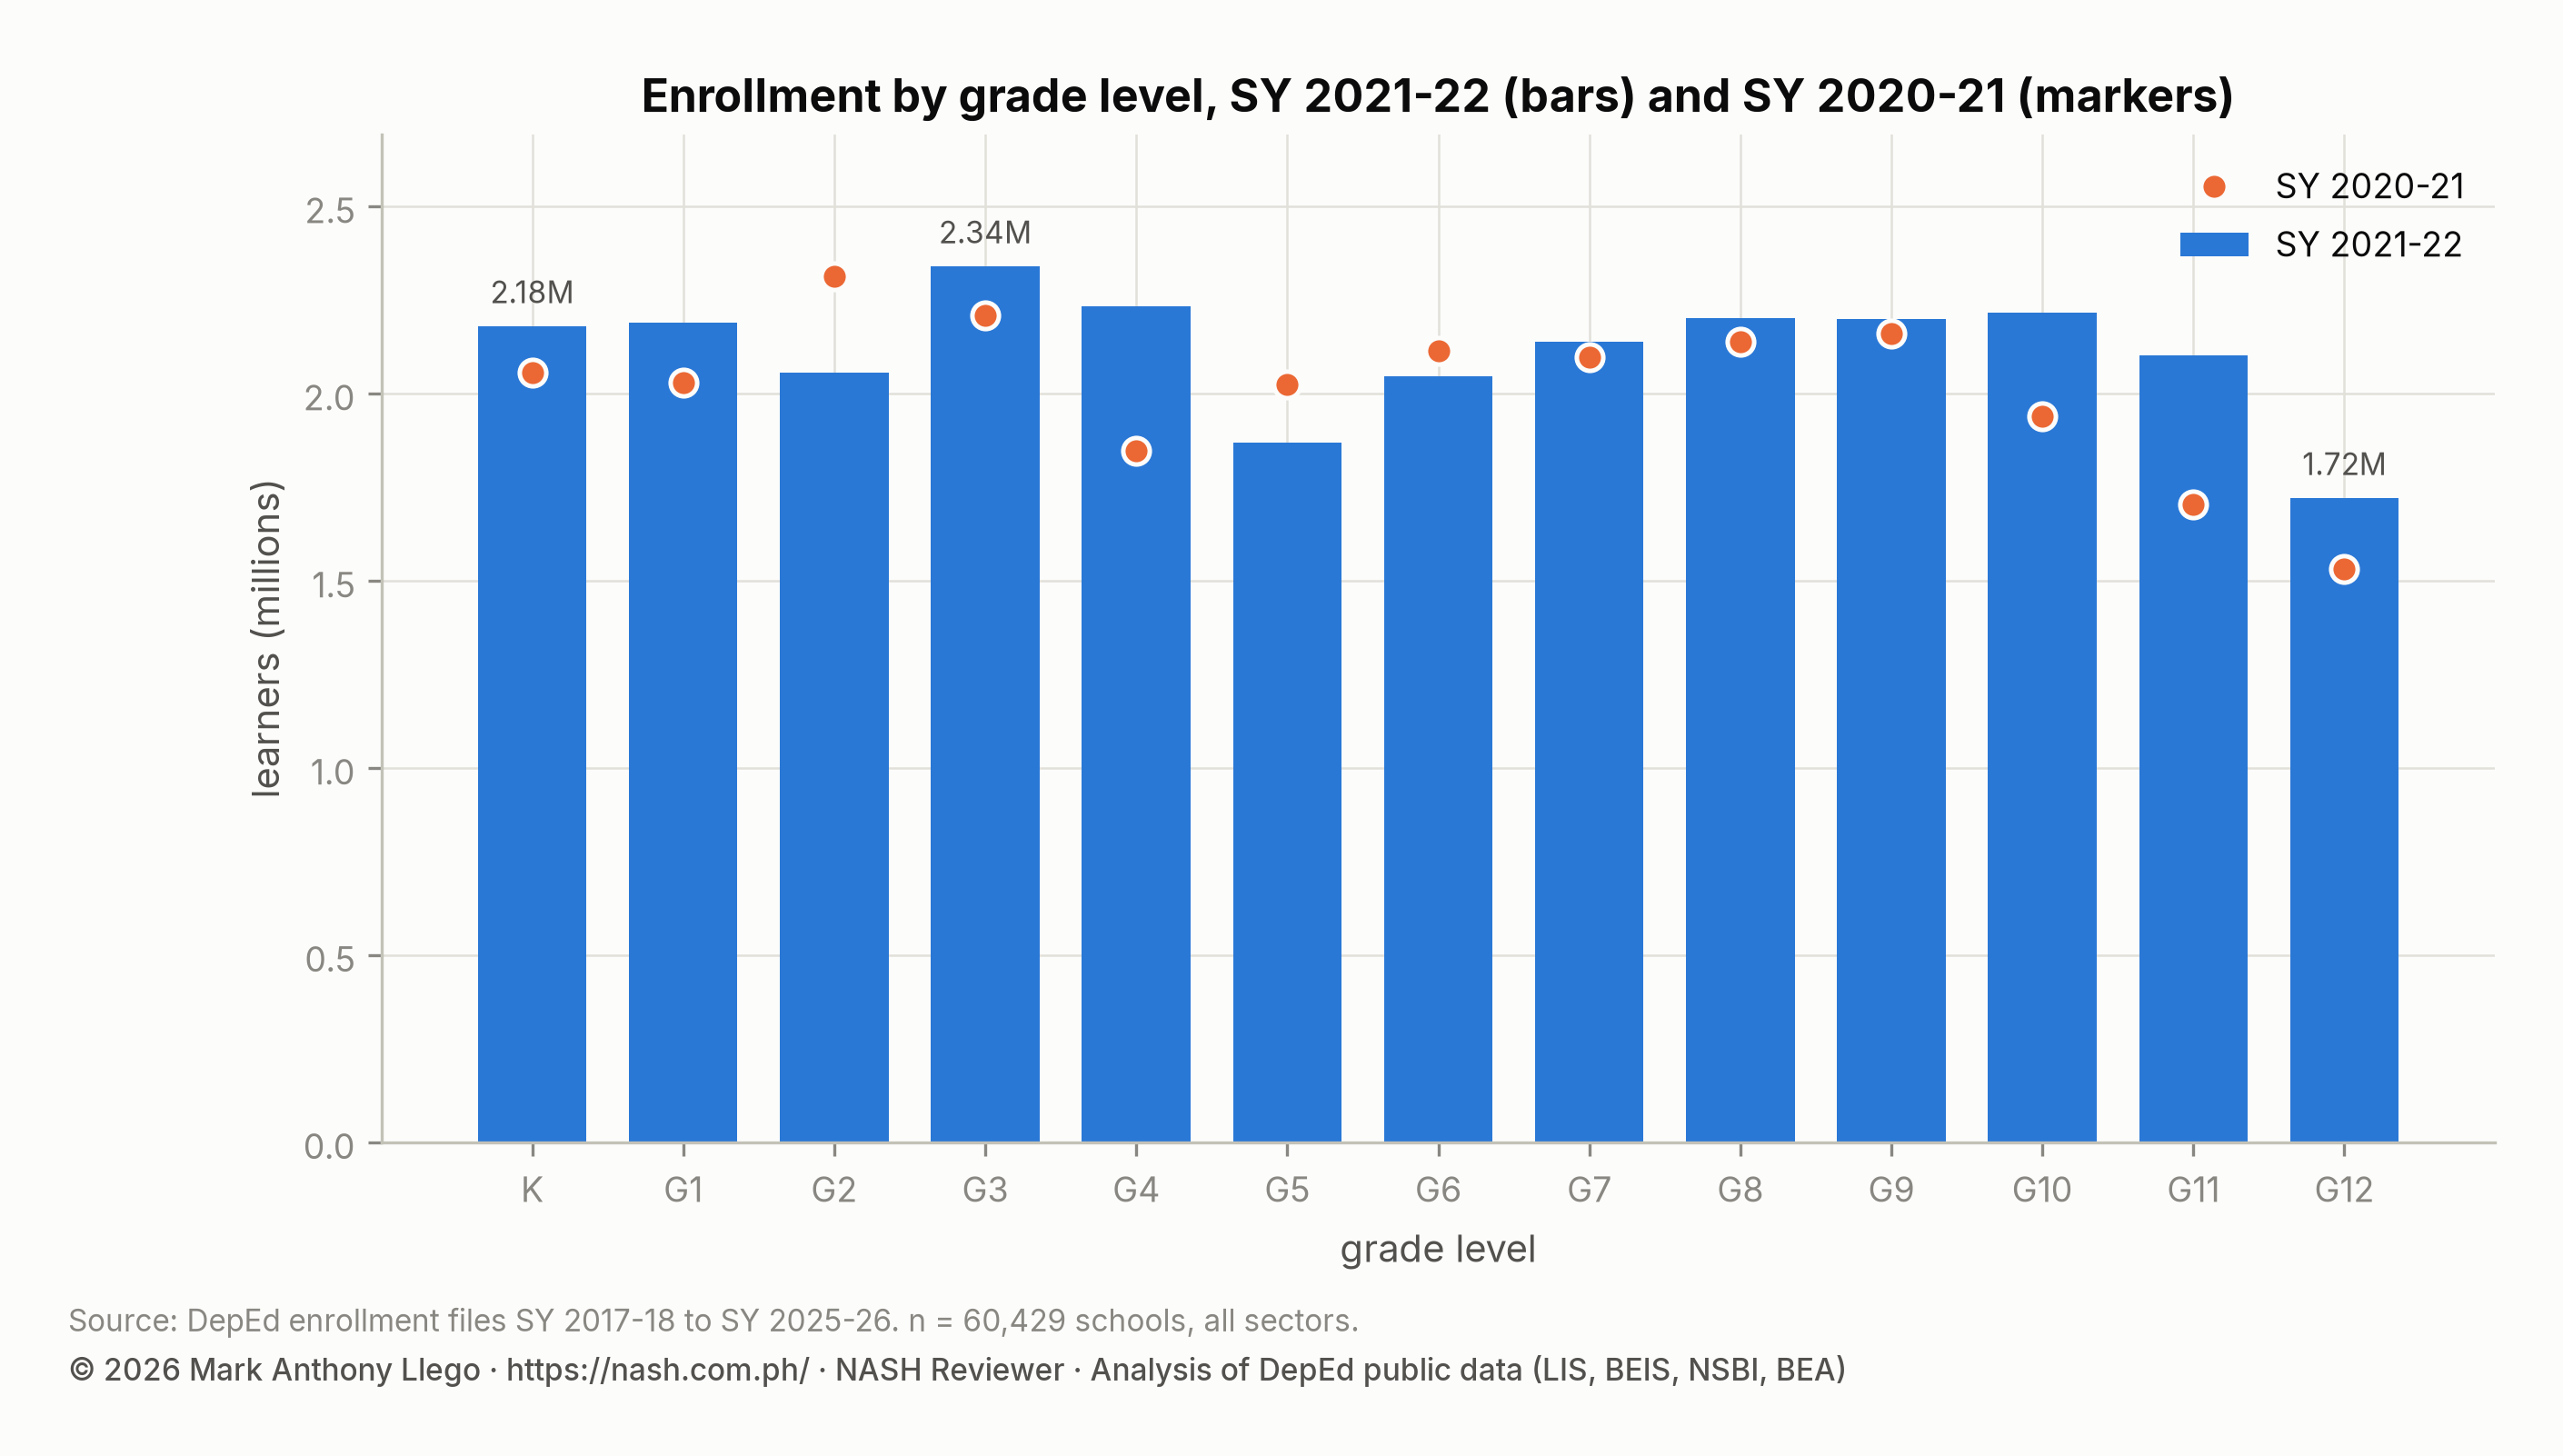
In a normal year, each grade enrolls slightly fewer learners than the grade below it had the year before. In SY 2021-2022 each of the five flow ratios below went above one. Grade 1 took 1.065 learners for every kindergarten learner of the previous year, the highest in the series. Grade 4 took 1.011 of the previous Grade 3, and Grade 7 took 1.011 of the previous Grade 6. Grade 11 took 1.084 of the previous Grade 10, and Grade 12 took 1.010 of the previous Grade 11. The previous year, every one of these ratios had been the lowest in the series. The learners who had not enrolled in SY 2020-2021 were enrolling now, a year older than their grade.
| Grade | Learners | Share of total | SY 2020-21 | Change | Change (%) |
|---|---|---|---|---|---|
| Kindergarten | 2,181,189 | 7.9% | 2,055,635 | +125,554 | +6.1% |
| Grade 1 | 2,190,067 | 7.9% | 2,029,223 | +160,844 | +7.9% |
| Grade 2 | 2,057,355 | 7.5% | 2,314,200 | -256,845 | -11.1% |
| Grade 3 | 2,341,058 | 8.5% | 2,209,280 | +131,778 | +6.0% |
| Grade 4 | 2,232,977 | 8.1% | 1,847,248 | +385,729 | +20.9% |
| Grade 5 | 1,869,837 | 6.8% | 2,024,970 | -155,133 | -7.7% |
| Grade 6 | 2,046,708 | 7.4% | 2,115,040 | -68,332 | -3.2% |
| Grade 7 | 2,137,995 | 7.8% | 2,096,738 | +41,257 | +2.0% |
| Grade 8 | 2,202,920 | 8.0% | 2,138,517 | +64,403 | +3.0% |
| Grade 9 | 2,198,737 | 8.0% | 2,161,860 | +36,877 | +1.7% |
| Grade 10 | 2,216,270 | 8.0% | 1,940,578 | +275,692 | +14.2% |
| Grade 11 | 2,102,702 | 7.6% | 1,705,109 | +397,593 | +23.3% |
| Grade 12 | 1,722,011 | 6.2% | 1,531,718 | +190,293 | +12.4% |
The returns were concentrated in the upper grades. Grade 11 gained 397,593 learners (+23.3%). Grade 10 gained 275,692 and Grade 12 gained 190,293. Grade 1 gained 160,844 learners and kindergarten 125,554. Two grades fell, and both falls are cohort effects rather than losses. Grade 2 (−11.1%) received the small Grade 1 class of the pandemic year, and Grade 5 (−7.7%) received the small cohort that had entered Grade 1 in SY 2017-2018. Grade 4, which that small cohort had just left, rose 20.9%.
Boys came back in greater numbers than girls. Male enrollment rose 5.5% and female enrollment 4.7%. The female share fell from 49.2% to 49.1%. In junior high it fell from 49.8% to 49.2%. The next report shows the same pattern continuing.
Public and private school enrollment: public at its largest
| Sector | Schools | Learners | Share of learners | Kindergarten | Elementary (K to 6) | Junior high | Senior high | Schools, SY 2020-21 | Learners, SY 2020-21 | Change (%) |
|---|---|---|---|---|---|---|---|---|---|---|
| Public | 47,553 | 24,127,495 | 87.5% | 2,042,798 | 14,034,548 | 7,547,278 | 2,545,669 | 47,421 | 22,712,409 | +6.2% |
| Private | 12,624 | 3,307,342 | 12.0% | 136,251 | 922,896 | 1,156,524 | 1,227,922 | 13,256 | 3,375,748 | -2.0% |
| SUC/LUC laboratory schools | 220 | 107,912 | 0.4% | 843 | 9,689 | 48,669 | 49,554 | 247 | 118,755 | -9.1% |
| Philippine Schools Overseas | 32 | 17,912 | 0.1% | 1,297 | 10,858 | 5,486 | 1,568 | 33 | 20,110 | -10.9% |
All of the growth went to public schools. Public enrollment rose by 1,415,086 (+6.2%) to 24,127,495, the highest public total in the nine years. That was 1.55 million above its pre-pandemic level. Private enrollment fell again, by 68,406 (−2.0%) to 3,307,342. Private schools numbered 12,624, which was 632 fewer than the year before and 1,811 fewer than two years before. The private share of all learners reached its low point, 12.0%. In senior high, the private share fell from 36.8% to 32.1%. Public senior high grew 28.1% in one year, from 1,987,180 to 2,545,669.
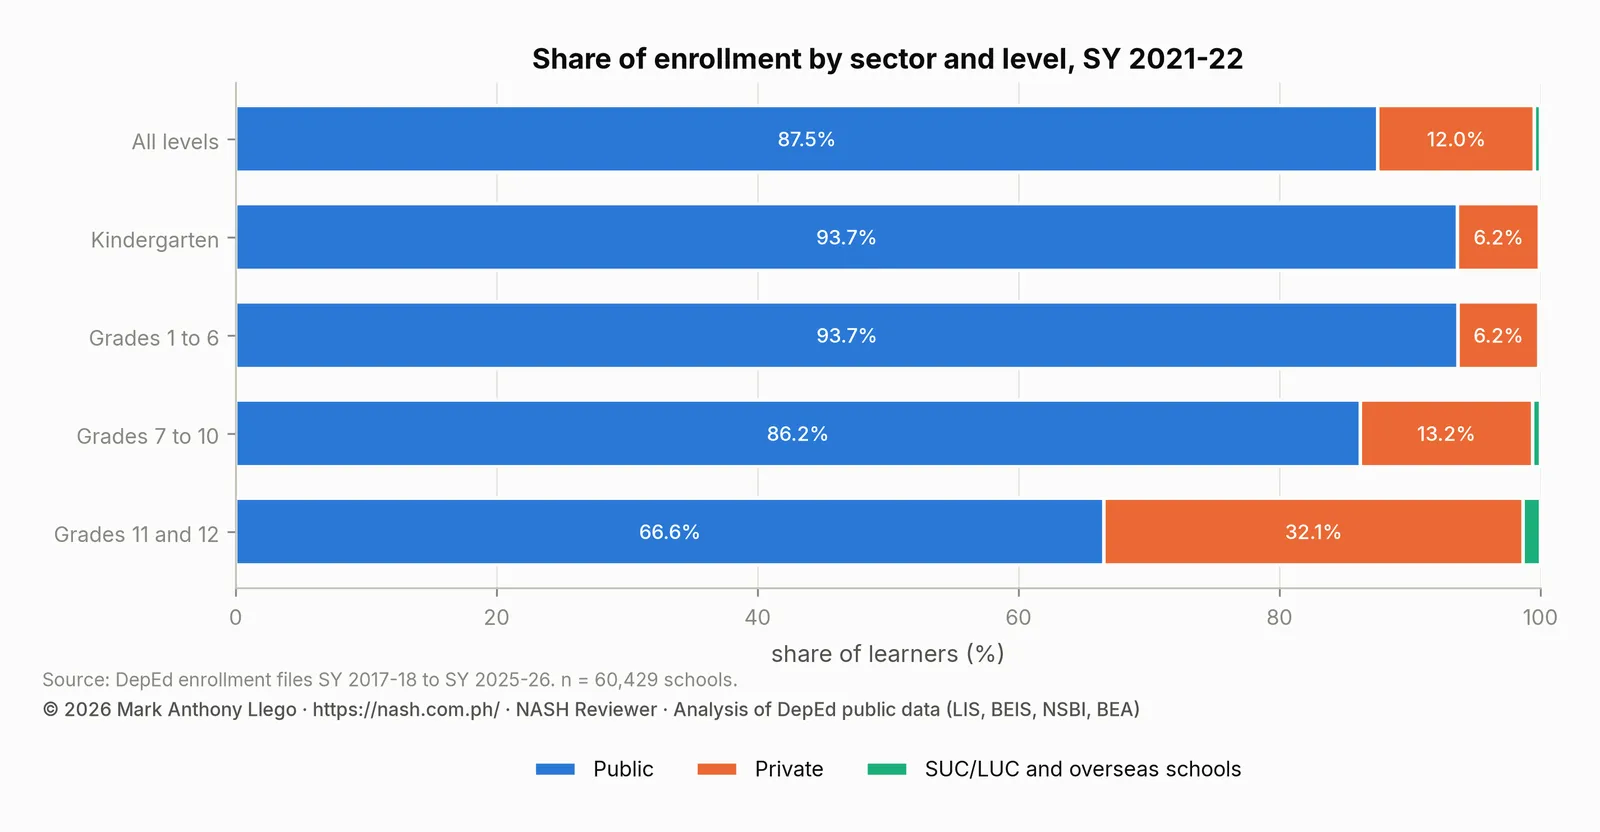
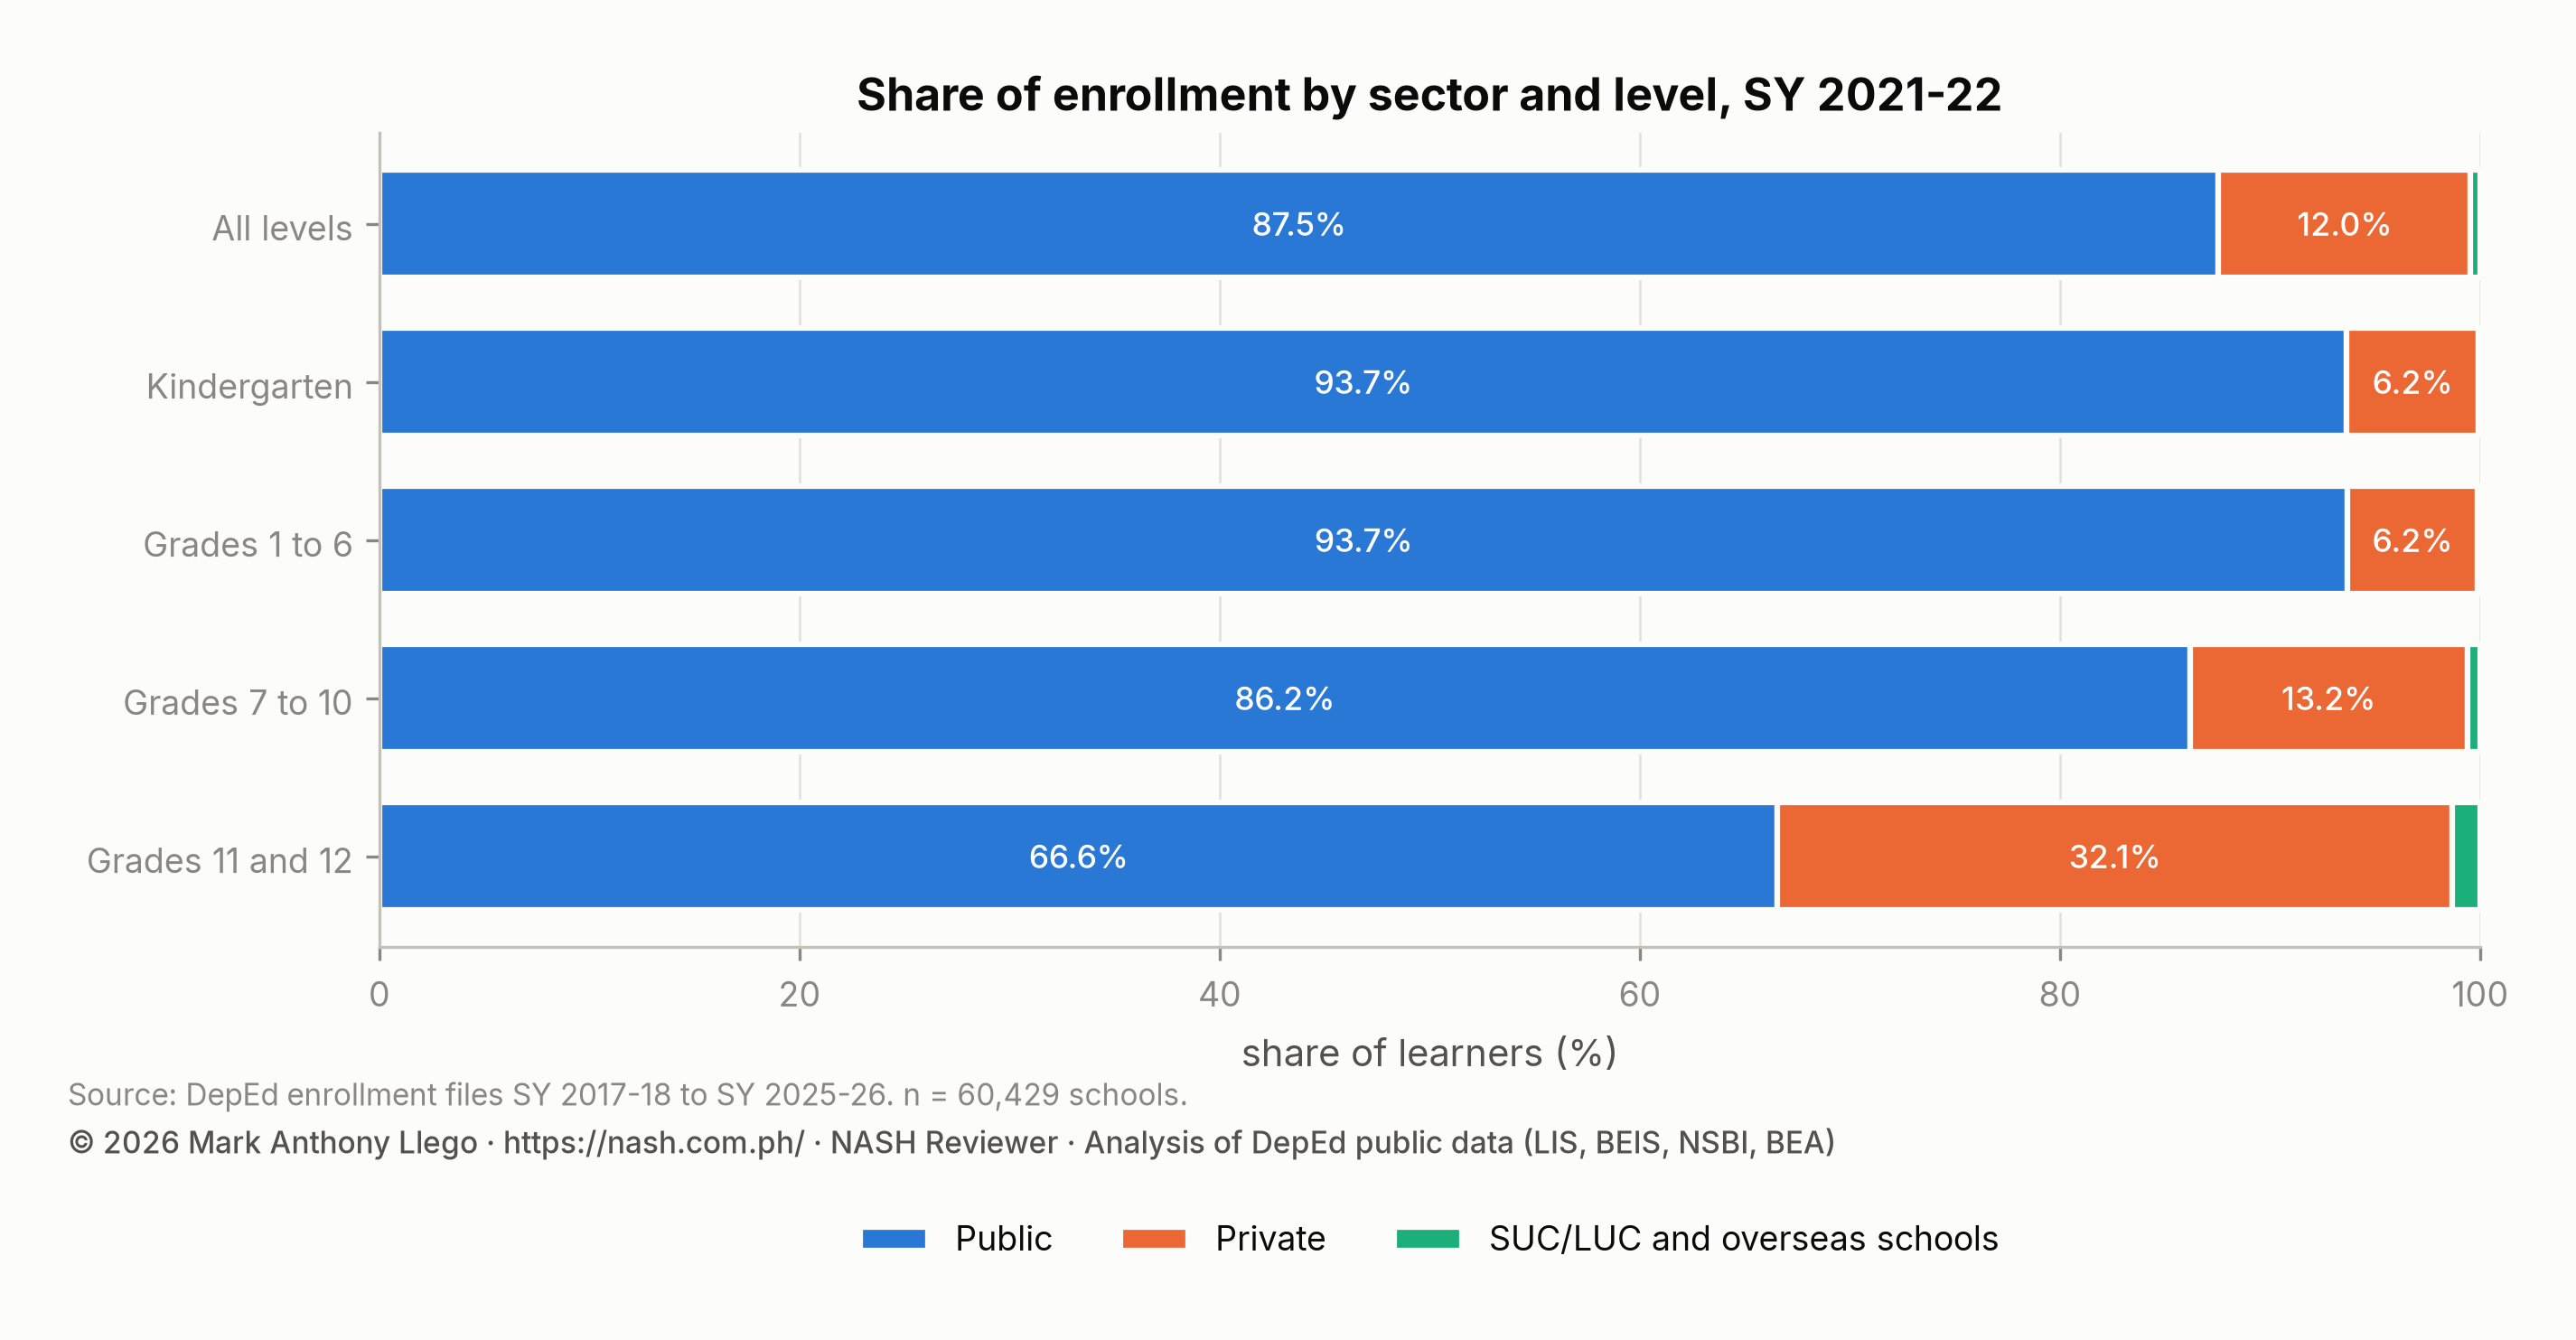
For public school heads, this was the largest one-year increase in the series. Schools whose classrooms were still closed took in 1.4 million more learners in one year, most of them in senior high. The number of schools with more than 2,000 learners rose from 2,139 to 2,375. Those schools held 30.9% of all learners, up from 28.4%.
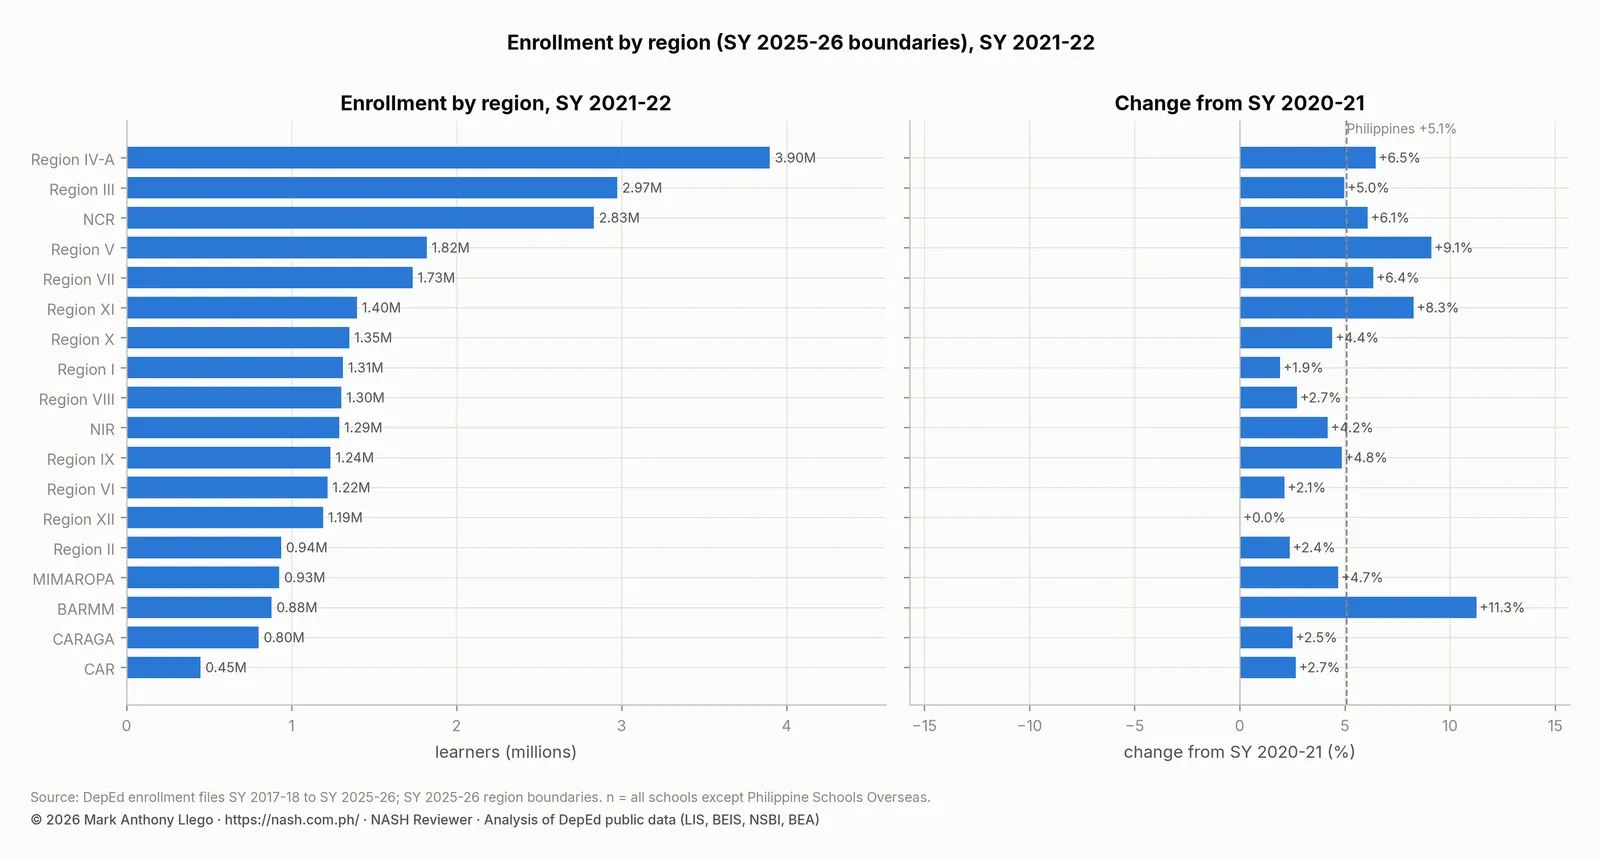
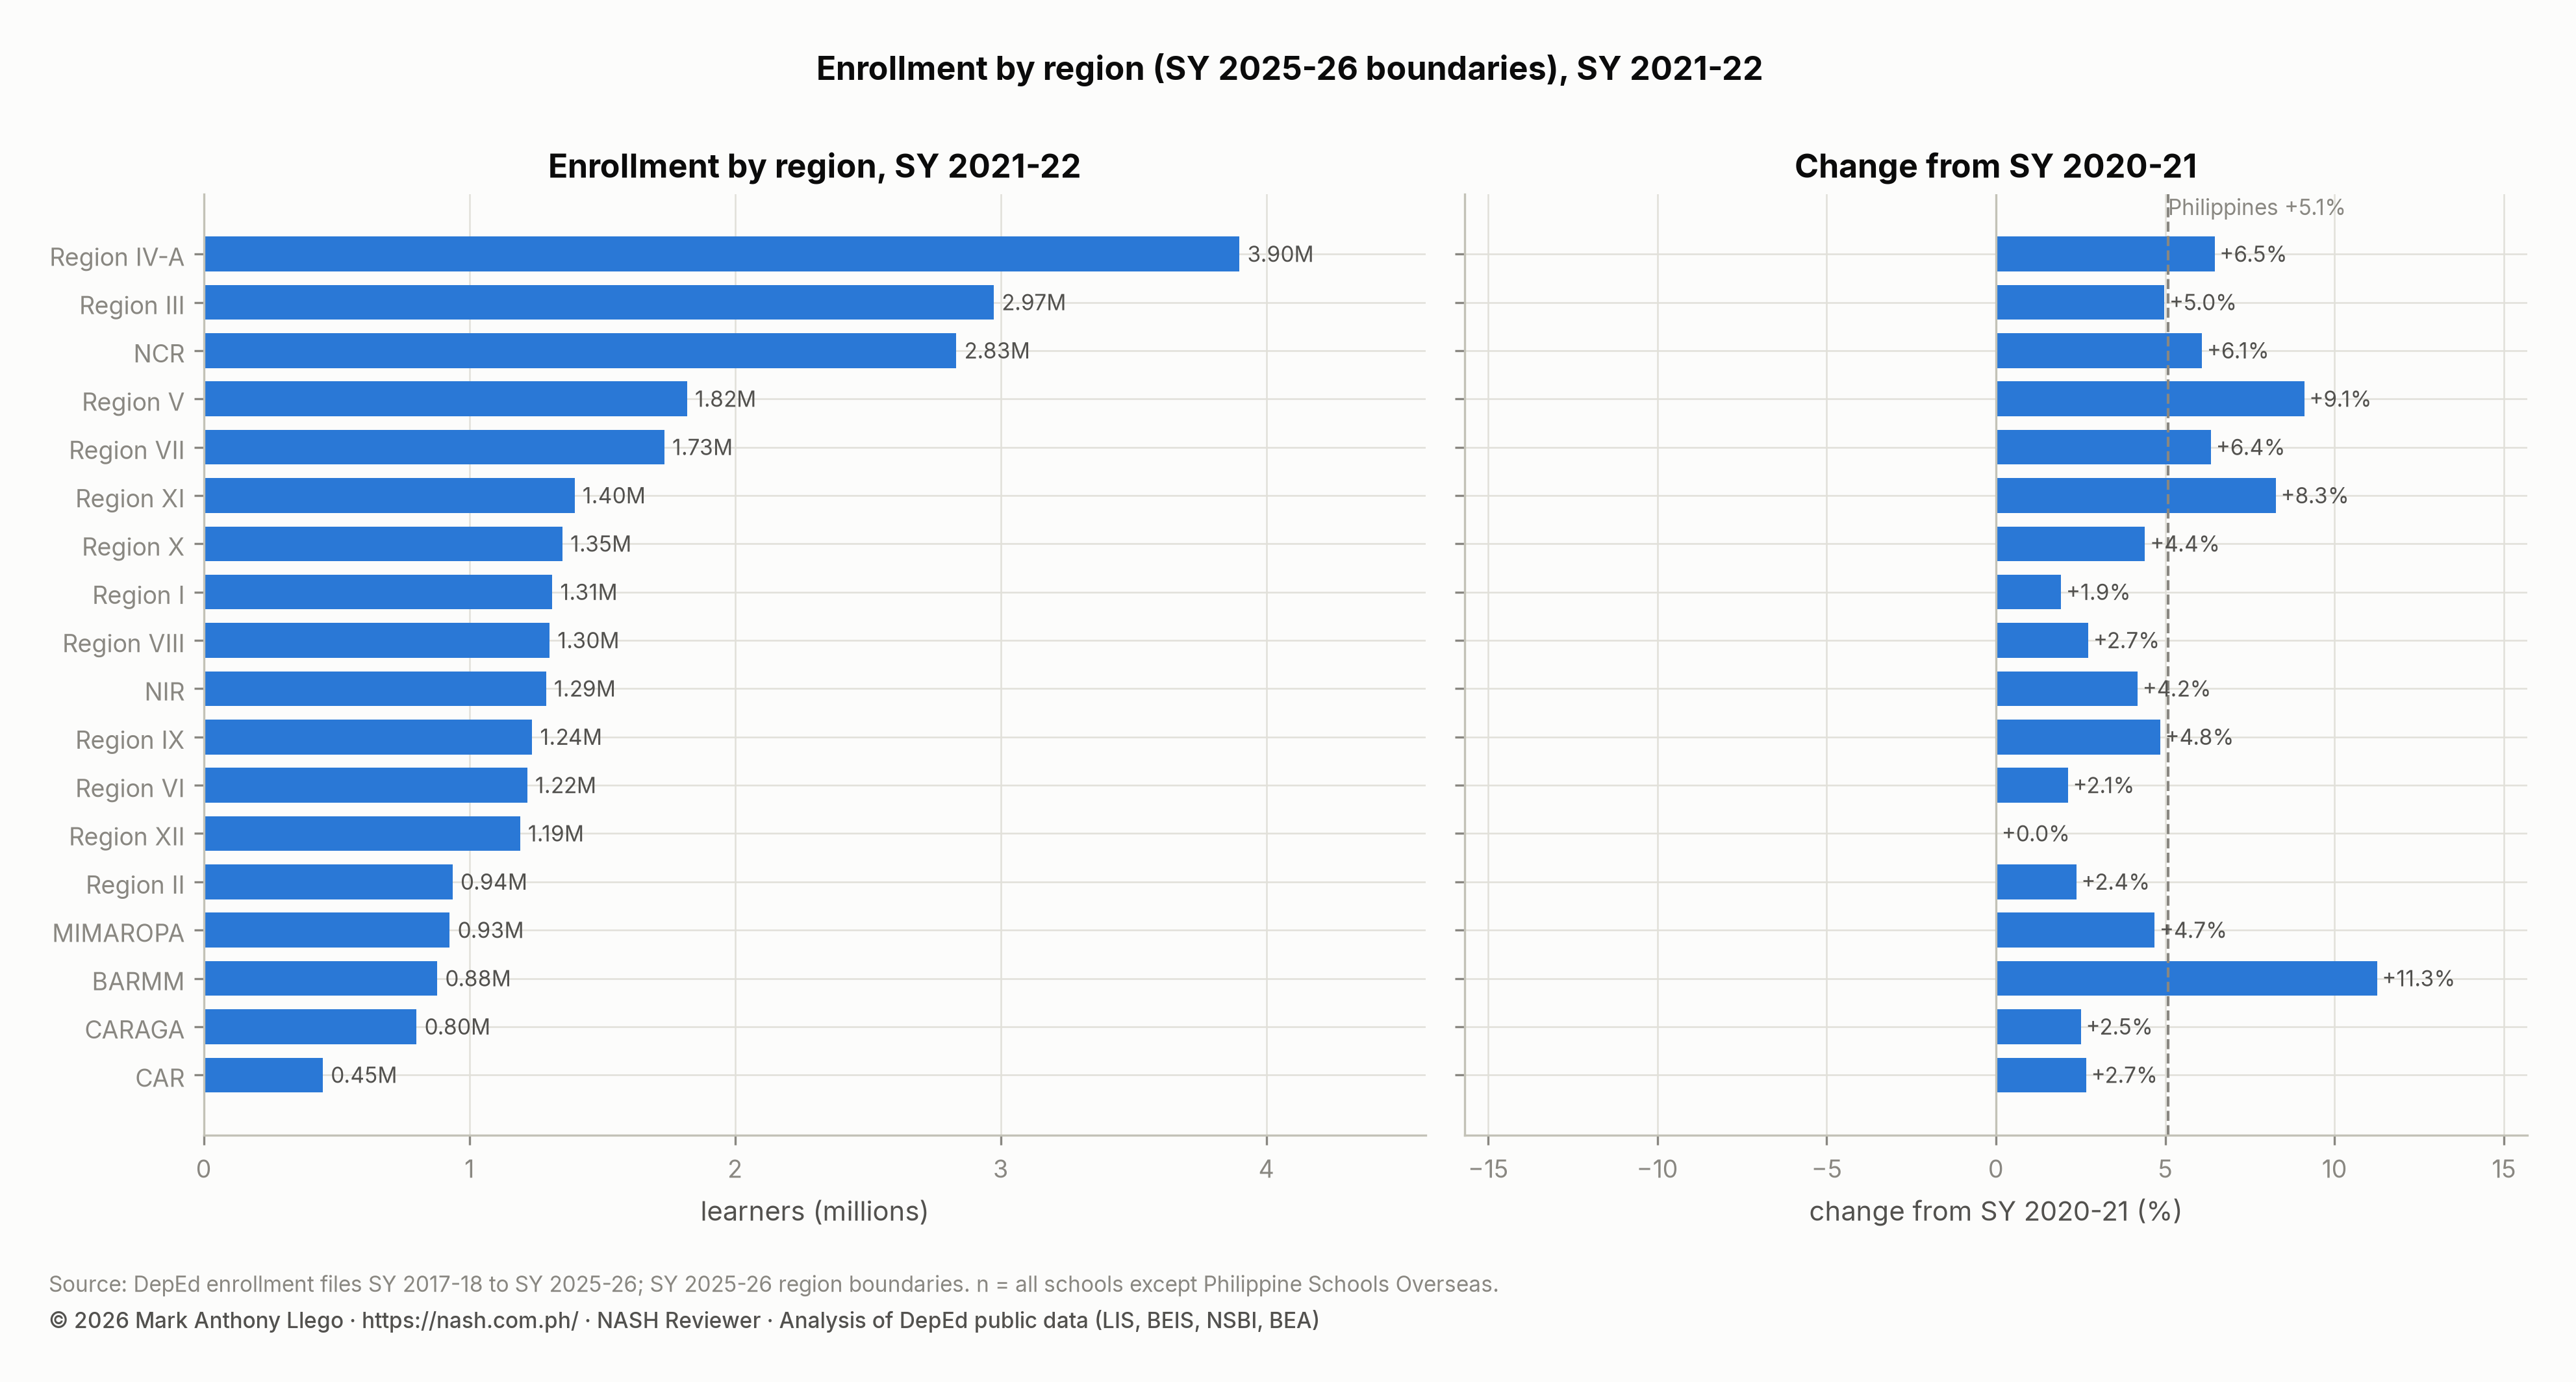
Enrollment by region: seventeen regions grew, Region XII flat
| Region (SY 2025-26 boundaries) | Schools | Learners | Share of learners | SY 2020-21 | Change | Change (%) | Private share | Senior high share | Female share |
|---|---|---|---|---|---|---|---|---|---|
| Region IV-A | 6,145 | 3,899,077 | 14.2% | 3,662,581 | +236,496 | +6.5% | 16.5% | 13.5% | 49.0% |
| Region III | 5,195 | 2,974,068 | 10.8% | 2,833,197 | +140,871 | +5.0% | 14.0% | 14.1% | 48.9% |
| NCR | 2,907 | 2,833,110 | 10.3% | 2,670,620 | +162,490 | +6.1% | 22.2% | 14.9% | 49.5% |
| Region V | 4,440 | 1,819,218 | 6.6% | 1,667,388 | +151,830 | +9.1% | 7.6% | 14.4% | 48.7% |
| Region VII | 3,535 | 1,733,956 | 6.3% | 1,630,401 | +103,555 | +6.4% | 12.6% | 14.5% | 48.7% |
| Region XI | 2,699 | 1,395,893 | 5.1% | 1,289,331 | +106,562 | +8.3% | 10.2% | 13.7% | 49.4% |
| Region X | 3,101 | 1,350,026 | 4.9% | 1,293,092 | +56,934 | +4.4% | 11.1% | 13.1% | 49.2% |
| Region I | 3,409 | 1,311,942 | 4.8% | 1,287,192 | +24,750 | +1.9% | 9.9% | 15.4% | 48.3% |
| Region VIII | 4,471 | 1,301,782 | 4.7% | 1,267,220 | +34,562 | +2.7% | 5.3% | 14.5% | 48.7% |
| NIR | 2,726 | 1,288,455 | 4.7% | 1,236,727 | +51,728 | +4.2% | 8.5% | 13.6% | 49.0% |
| Region IX | 3,300 | 1,236,203 | 4.5% | 1,179,031 | +57,172 | +4.8% | 6.9% | 12.8% | 49.5% |
| Region VI | 3,449 | 1,217,790 | 4.4% | 1,192,435 | +25,355 | +2.1% | 8.0% | 15.1% | 48.0% |
| Region XII | 2,525 | 1,190,617 | 4.3% | 1,190,374 | +243 | +0.0% | 8.4% | 12.9% | 49.4% |
| Region II | 2,922 | 936,533 | 3.4% | 914,822 | +21,711 | +2.4% | 9.6% | 14.0% | 48.8% |
| MIMAROPA | 2,674 | 925,831 | 3.4% | 884,410 | +41,421 | +4.7% | 7.0% | 13.7% | 48.8% |
| BARMM | 2,453 | 878,880 | 3.2% | 789,972 | +88,908 | +11.3% | 10.8% | 8.6% | 51.7% |
| CARAGA | 2,361 | 801,163 | 2.9% | 781,551 | +19,612 | +2.5% | 7.8% | 13.9% | 48.9% |
| CAR | 2,085 | 448,205 | 1.6% | 436,568 | +11,637 | +2.7% | 15.3% | 15.1% | 48.8% |
Seventeen regions grew and Region XII was flat (+243 learners). BARMM grew 11.3%, Region V 9.1% and Region XI 8.3%. Region IV-A (6.5%), Region VII (6.4%) and NCR (6.1%) came next. The regions that had lost most in the pandemic year recovered most. Region V’s gain of 151,830 more than reversed its loss of 118,368. Region XI’s gain of 106,562 exceeded its loss of 69,495. NCR gained 162,490, about two thirds of the 245,675 it had lost. It is the one region that never regained its SY 2019-2020 level. Region IV-A added the most learners, 236,496.
At division level, the divisions that lost most in the pandemic year recovered most. Albay, which had lost 13.5%, grew 16.9%. Camarines Sur grew 15.8%. Davao City, which had lost 58,692 learners, regained 61,165 (+15.4%). Cavite City grew 16.6% and Basilan 15.1%.
| Division | Region | Schools | Learners, SY 2021-22 | Learners, SY 2020-21 | Change | Change (%) | |
|---|---|---|---|---|---|---|---|
| Fastest growth | Albay | Region V | 612 | 248,634 | 212,766 | +35,868 | +16.9% |
| Fastest growth | Cavite City | Region IV-A | 27 | 23,496 | 20,156 | +3,340 | +16.6% |
| Fastest growth | Camarines Sur | Region V | 1,260 | 516,264 | 445,844 | +70,420 | +15.8% |
| Fastest growth | Davao City | Region XI | 657 | 457,368 | 396,203 | +61,165 | +15.4% |
| Fastest growth | Basilan | BARMM | 188 | 57,315 | 49,808 | +7,507 | +15.1% |
| Steepest decline | North Cotabato | Region XII | 857 | 315,576 | 349,217 | -33,641 | -9.6% |
| Steepest decline | Vigan City | Region I | 35 | 19,612 | 20,166 | -554 | -2.7% |
| Steepest decline | San Fernando City | Region I | 61 | 30,731 | 31,344 | -613 | -2.0% |
| Steepest decline | City of San Juan | NCR | 42 | 23,345 | 23,704 | -359 | -1.5% |
| Steepest decline | Malolos City | Region III | 107 | 61,109 | 61,854 | -745 | -1.2% |
The Special Geographic Area Division of BARMM
The table’s steepest decline, North Cotabato at −9.6% (−33,641 learners), is not a decline. This is the first file to list the Special Geographic Area Division of BARMM, with 41,604 learners. The division covers the 63 barangays of North Cotabato that voted to join the Bangsamoro region in 2019, and their schools were transferred to it. The learners moved from one column to another.
The same file is the first to list Cotabato City under BARMM rather than Region XII. Cotabato City is counted under BARMM in every year here, so that change does not affect the regional figures. The Special Geographic Area does affect them: it is why BARMM’s growth, large in any case, reads 11.3% rather than about 6%.
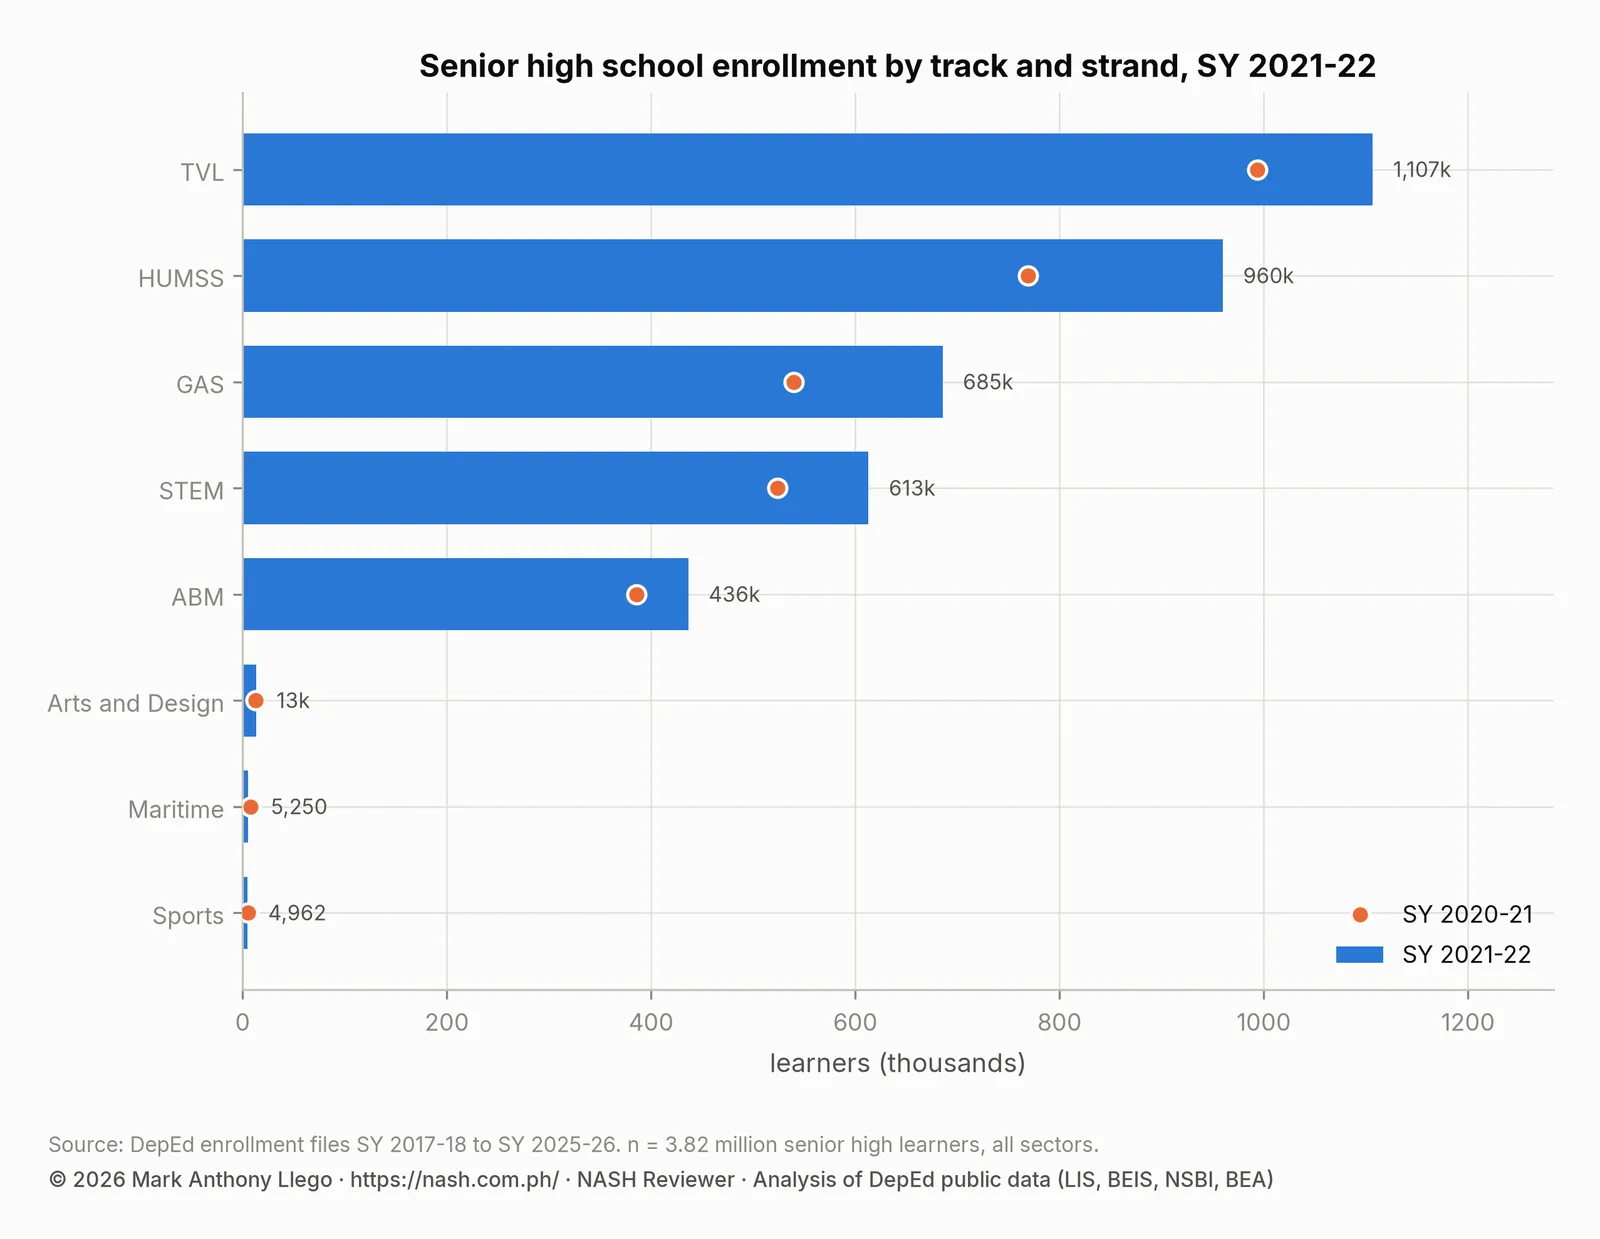
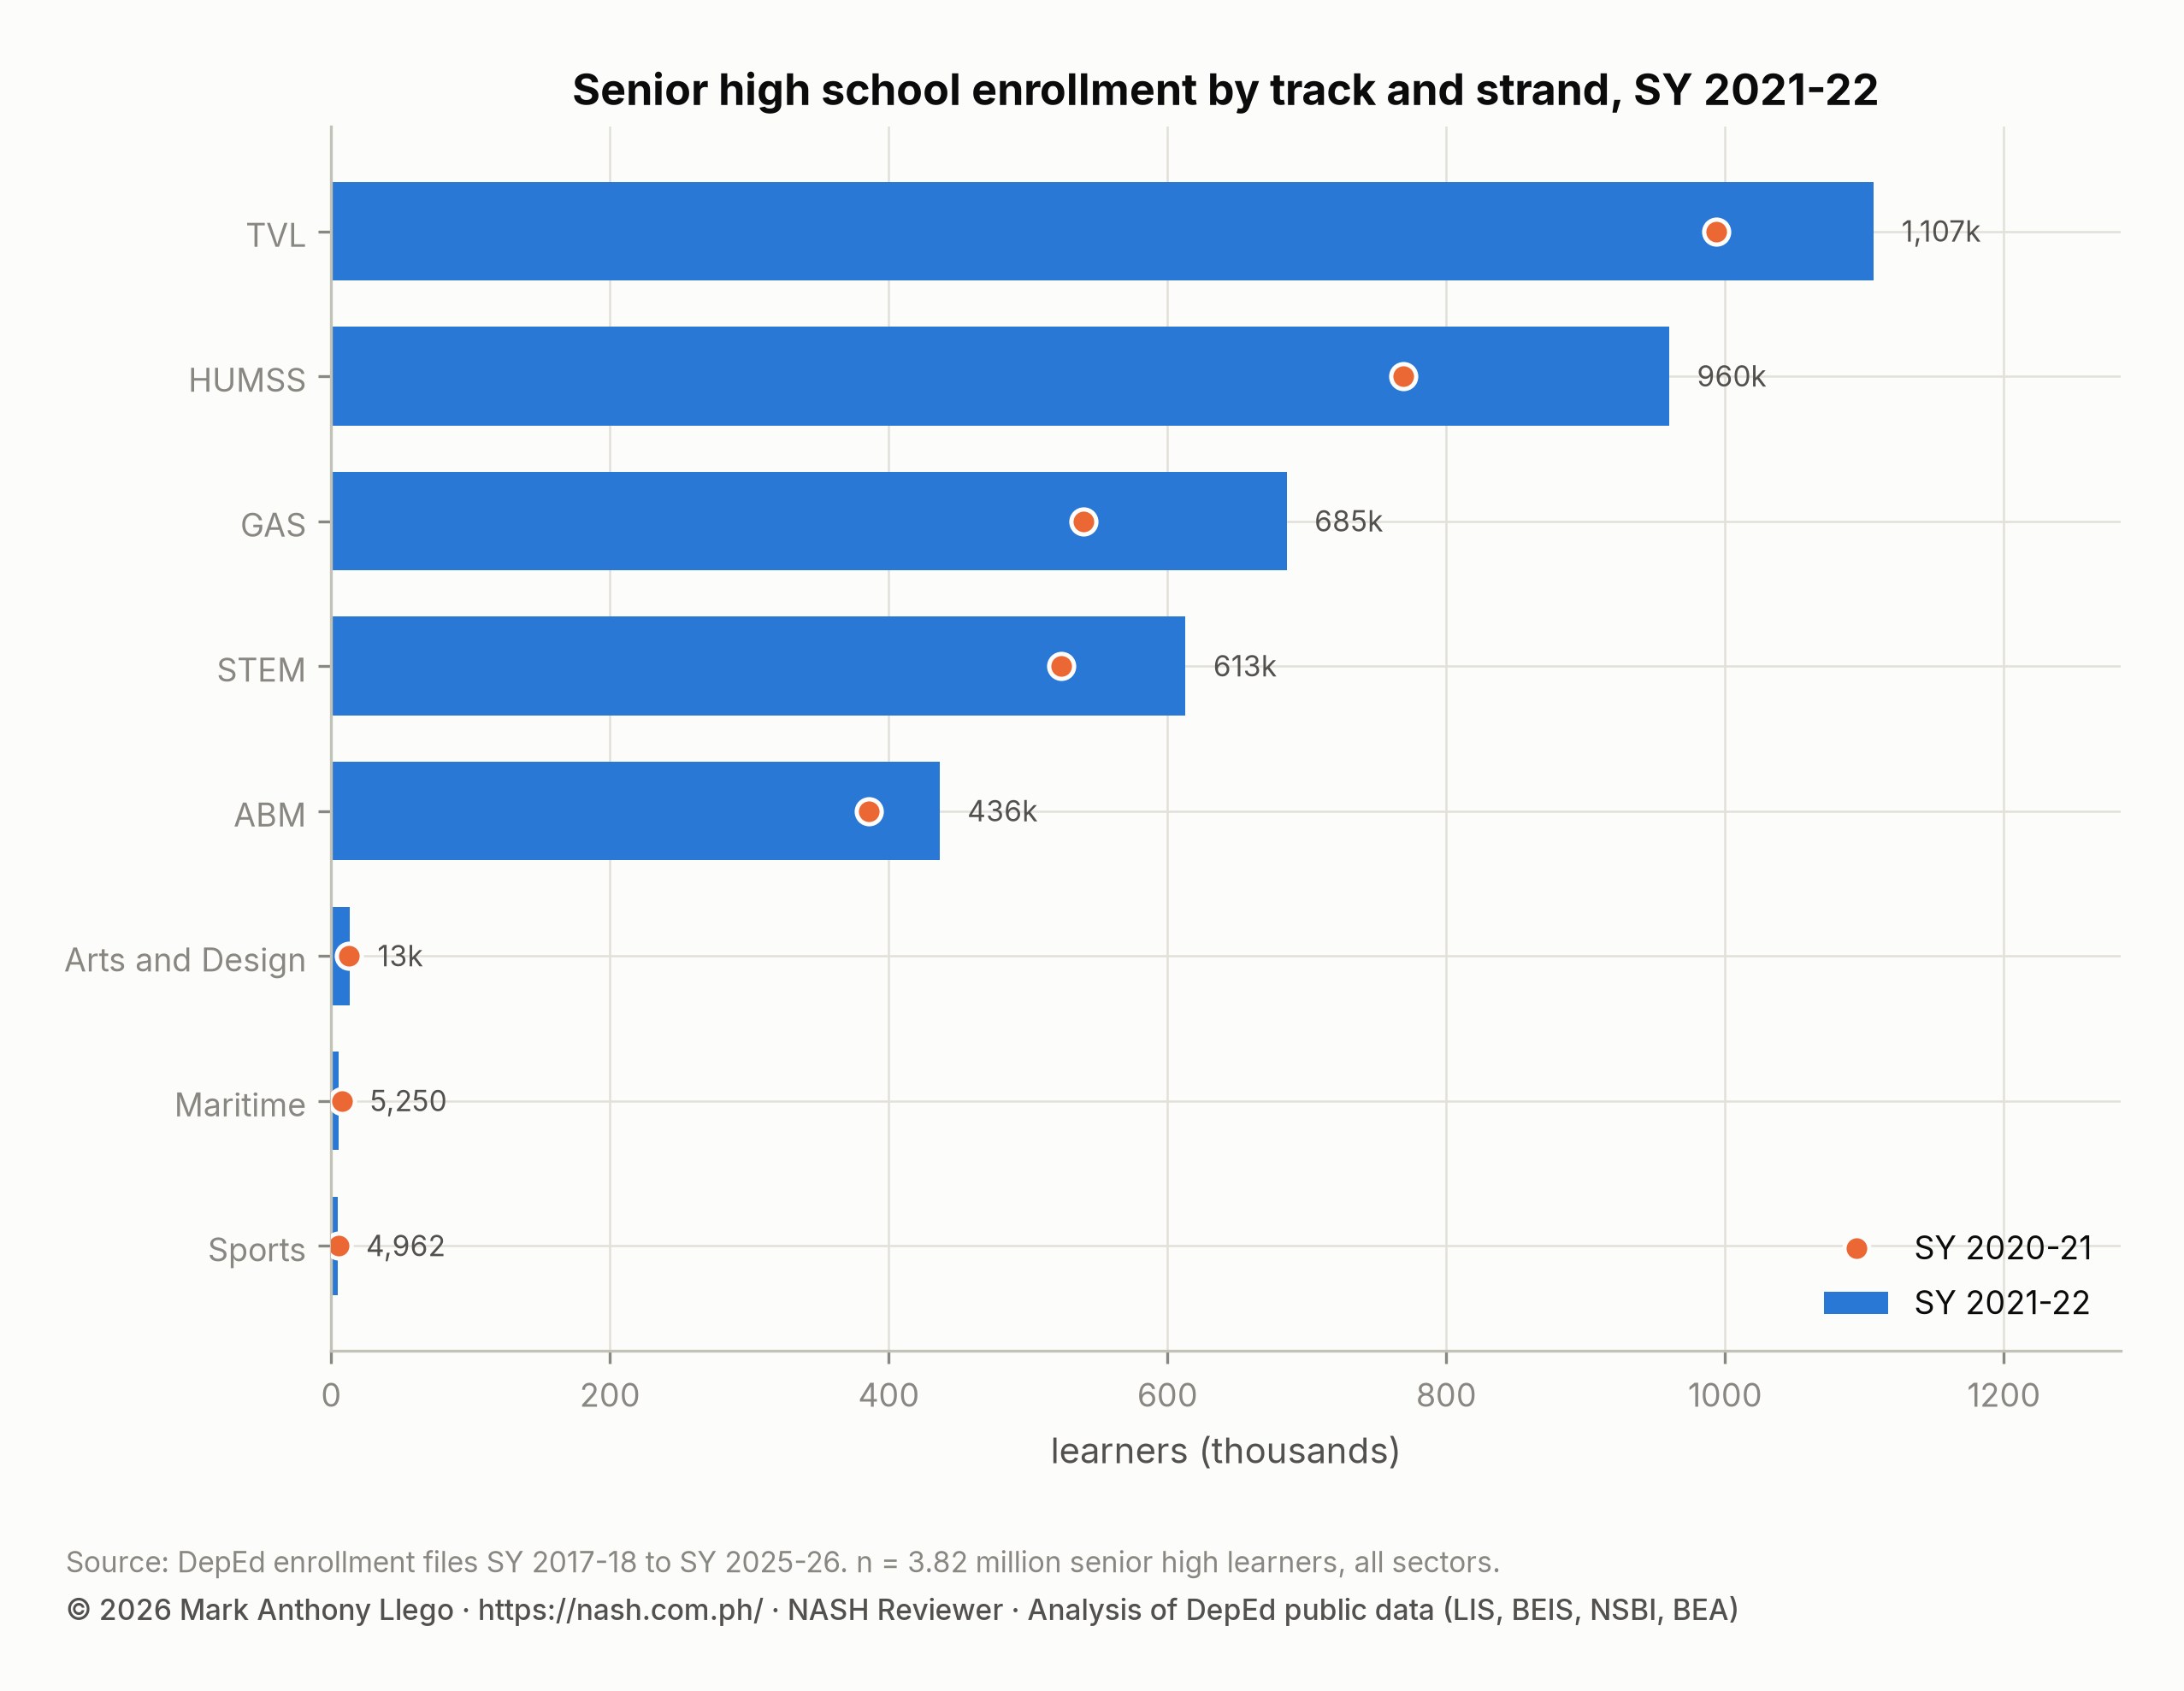
Senior high school strands: all five major strands grew
| Track or strand | Learners | Share of senior high | SY 2020-21 | Change | Change (%) |
|---|---|---|---|---|---|
| TVL | 1,106,646 | 28.9% | 993,856 | +112,790 | +11.3% |
| HUMSS | 959,863 | 25.1% | 769,252 | +190,611 | +24.8% |
| GAS | 685,462 | 17.9% | 539,413 | +146,049 | +27.1% |
| STEM | 612,857 | 16.0% | 523,658 | +89,199 | +17.0% |
| ABM | 436,409 | 11.4% | 385,359 | +51,050 | +13.2% |
| Arts and Design | 13,264 | 0.3% | 12,514 | +750 | +6.0% |
| Maritime | 5,250 | 0.1% | 7,786 | -2,536 | -32.6% |
| Sports | 4,962 | 0.1% | 4,989 | -27 | -0.5% |
With 3,824,713 learners, senior high was 13.9% of all enrollment, up from 12.3%. Every major strand grew. GAS grew by 27.1% (146,049 learners). HUMSS grew by 24.8% (190,611). Science, Technology, Engineering and Mathematics (STEM) grew 17.0% and Accountancy, Business and Management (ABM) 13.2%. TVL grew by 11.3% (112,790 learners), recovering what it had lost the year before. HUMSS passed 950,000 learners and was approaching TVL’s total. The gap between the two, 540,000 learners in SY 2018-2019, was now 147,000. Maritime lost another third.
Schools in the file: fewer private schools
The file lists 60,429 schools, 528 fewer than the year before and 1,494 fewer than two years before. The whole decline was in private schools. Only 201 private schools were new this year, against 454 in SY 2019-2020. Another 638 private schools present this year are absent from the SY 2022-2023 file. The median private school had 90 learners, up from 82 but still below the pre-pandemic 111. The median public school had 238. The file lists 206 schools with zero learners.
| Sector | Schools in the file | Schools new in SY 2021-22 | Learners in new schools | Schools absent from SY 2022-23 | Their learners in this year |
|---|---|---|---|---|---|
| Public | 47,553 | 395 | 127,160 | 204 | 67,432 |
| Private | 12,624 | 201 | 14,597 | 638 | 27,079 |
| SUC/LUC laboratory schools | 220 | 5 | 1,397 | 10 | 2,335 |
| Philippine Schools Overseas | 32 | 0 | 0 | 0 | 0 |
How to read the SY 2021-2022 enrollment file
- DepEd took the enrollment count at the September 13, 2021 opening, before the in-person pilot began. The file’s structure is unchanged from the previous two years.
- The Special Geographic Area Division appears for the first time, and North Cotabato’s drop is the transfer of its schools. Regions follow the SY 2025-2026 boundaries, so Cotabato City’s reassignment to BARMM in this file changes nothing here.
- Flow ratios are cross-sectional approximations, not DepEd’s transition rates, which subtract repeaters. A ratio above one is only possible when learners enter a grade from outside the previous year’s cohort.
Frequently asked questions
How much did DepEd enrollment recover in SY 2021-2022?
Enrollment rose by 1,333,639 learners (+5.1%) to 27,560,661. That passed the pre-pandemic SY 2019-2020 total of 27,030,391 by 530,270.
Where did the returning learners enroll in SY 2021-2022?
They enrolled in public schools, and mostly in senior high. Public enrollment rose by 1,415,086 while private enrollment fell by 68,406. Senior high gained 587,886 learners, with Grade 11 alone up 397,593.
Why does BARMM show 11.3% enrollment growth in SY 2021-2022?
There are two reasons. BARMM’s enrollment was growing anyway, at 2.6% a year over the series, and this file is the first to list the Special Geographic Area Division. That division’s 41,604 learners were previously counted under North Cotabato in Region XII.
Download the data
The cleaned, harmonized DepEd files behind this series are free to download in CSV and Parquet, with a codebook and checksums, under the terms of use set out in the release. Download Cleaned DepEd School Data, SY 2017-18 to 2025-26 documents every file and column. The files themselves are at data.nash.com.ph, starting with the README, the SY 2023-24 school master file (CSV, 8.0 MB) and the nine-year enrollment panel (Parquet, 17.2 MB).
More in this series
- Previous year: DepEd Enrollment SY 2020-2021: The Pandemic Drop
- Next year: DepEd Enrollment SY 2022-2023: The Peak at 27.8 Million
- The nine-year overview: DepEd Enrollment Trends SY 2017-2018 to SY 2025-2026
- All nine annual reports: SY 2017-18, SY 2018-19, SY 2019-20, SY 2020-21, SY 2021-22, SY 2022-23, SY 2023-24, SY 2024-25, SY 2025-26
- DepEd Data for Aspiring School Heads: Where to Start
- For aspiring school heads: How to Read DepEd Data and the full report, Philippine basic education in numbers
Analysis and charts by Mark Anthony Llego for NASH Reviewer. Data: Department of Education enrollment datasets for SY 2020-21 and SY 2021-22 (Learner Information System). Charts may be reused only with written permission from support@nash.com.ph.