DepEd’s SY 2019-2020 enrollment file is the last count taken before COVID-19. It lists 27,030,391 learners in 61,923 schools, and the total was up only 11,882 on the year before, a change of four hundredths of one percent. The file lists seven more schools than in SY 2018-2019. The private share of learners, 15.9%, was at its peak, and 1,422 private schools were in their last year in the file.
Classes opened on June 3, 2019, as they had for decades. They were suspended in March 2020, weeks before the planned end of the year, when COVID-19 arrived. The count was taken at the start of the year, so it describes the system as it stood before the pandemic. It is the baseline against which the next two years are measured.
Under the flat total, four things were changing. The kindergarten class fell by 15%. Ten of the 18 regions lost learners, for the first time in the series. Humanities and Social Sciences (HUMSS) overtook the General Academic Strand (GAS). And 1,422 private schools were in their last year in the file.
Key findings
- Enrollment was 27,030,391 in 61,923 schools, up 11,882 on SY 2018-2019. The count was taken at the start of the year, before the pandemic.
- Kindergarten fell by 365,037 learners, or 15.1%, to 2,044,745. Public kindergarten lost 319,599 learners and private kindergarten 45,455.
- Private enrollment peaked at 4,304,676, a 15.9% share. Two years later it would be 3.31 million and the share 12.0%.
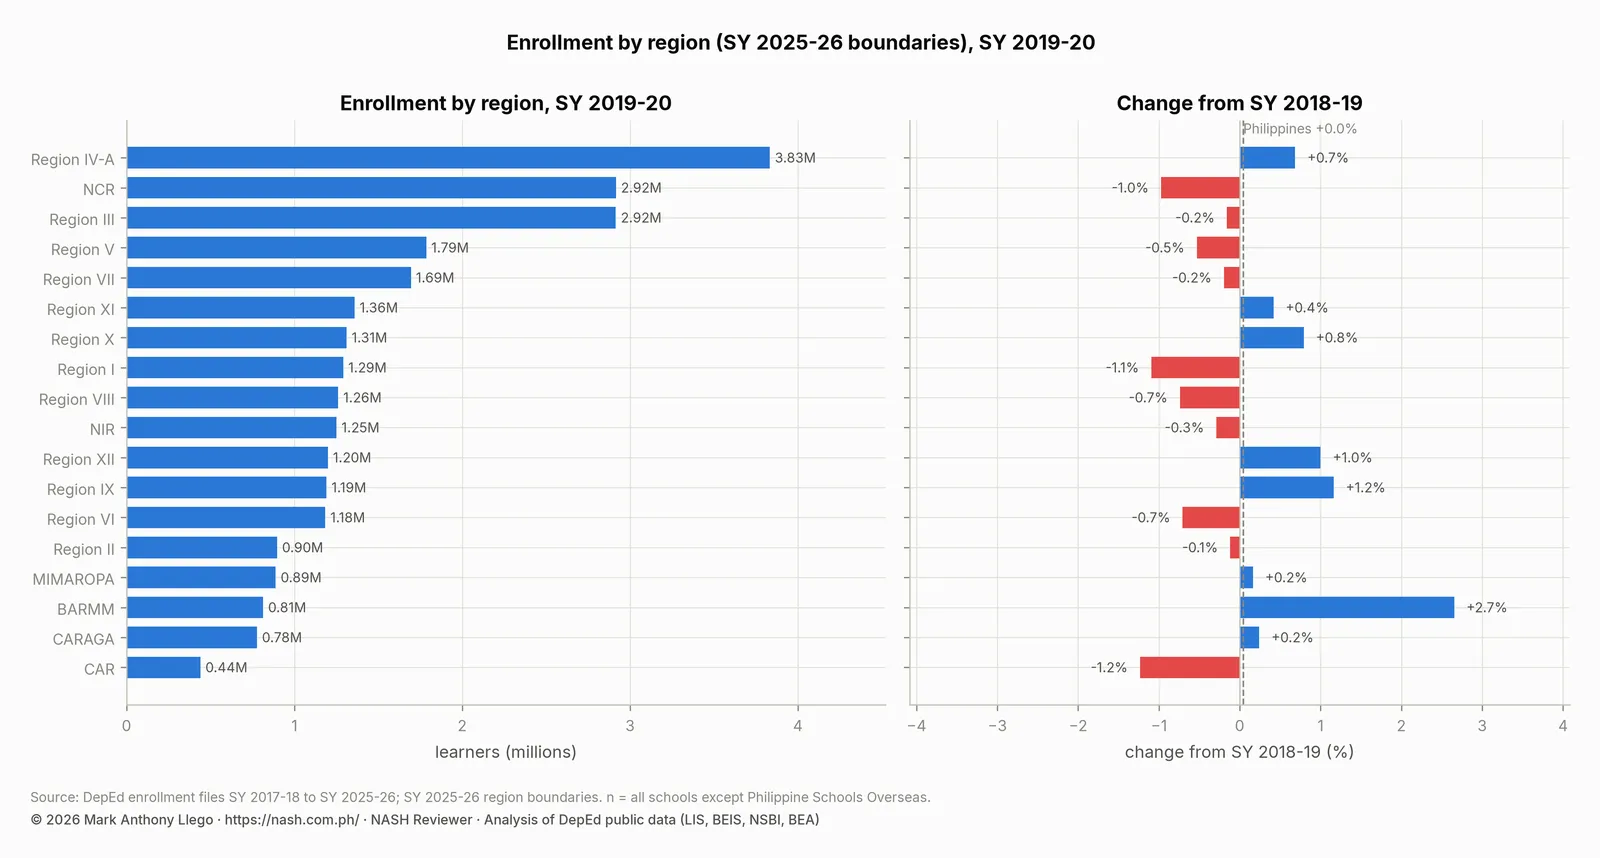
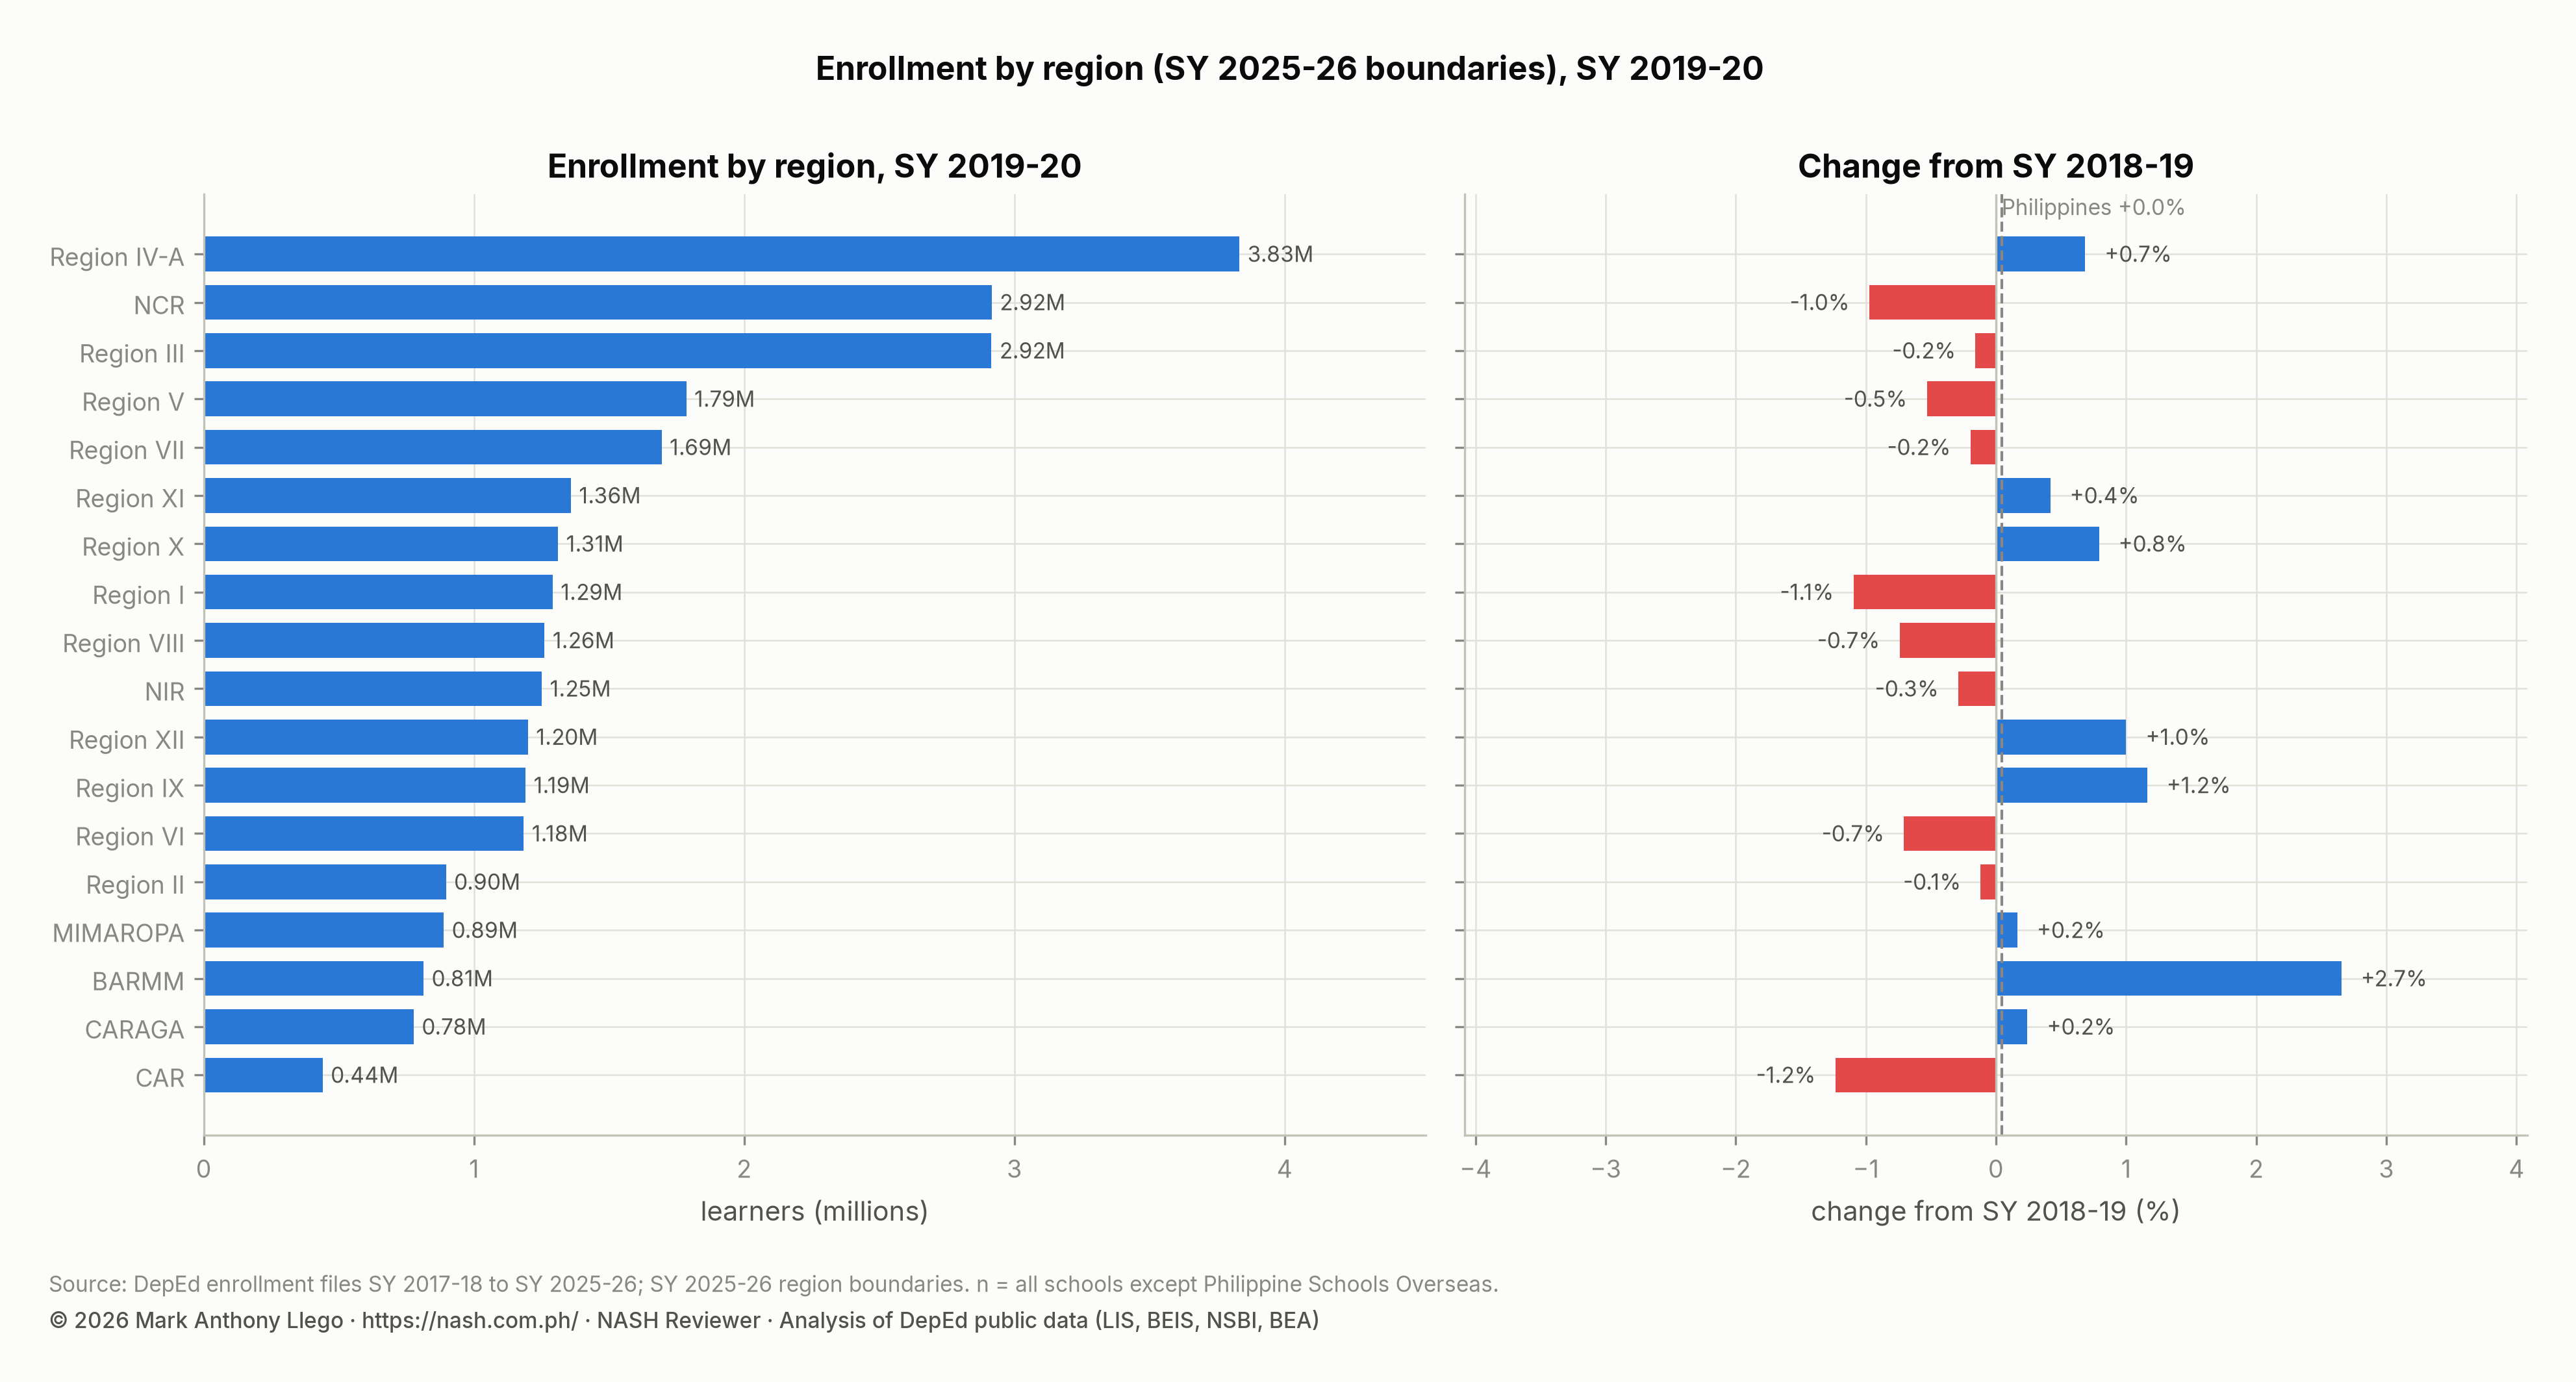
- Ten of the 18 regions lost learners, the first time in the series. BARMM grew 2.7%. CAR (−1.2%), Region I (−1.1%) and NCR (−1.0%) shrank most.
- A total of 1,422 private schools did not appear in the SY 2020-2021 file. They held 67,236 learners in SY 2019-2020; in every other year, private exits run between 420 and 833.
| Item | SY 2019-20 | SY 2018-19 | Change | Change (%) |
|---|---|---|---|---|
| Schools in the file | 61,923 | 61,916 | +7 | +0.0% |
| Schools reporting enrollment | 61,923 | 61,916 | +7 | +0.0% |
| Total enrollment | 27,030,391 | 27,018,509 | +11,882 | +0.0% |
| Kindergarten | 2,044,745 | 2,409,782 | -365,037 | -15.1% |
| Grades 1 to 6 | 13,226,174 | 13,201,928 | +24,246 | +0.2% |
| Elementary non-graded | 61,787 | 63,331 | -1,544 | -2.4% |
| Elementary (K to 6 and non-graded) | 15,332,706 | 15,675,041 | -342,335 | -2.2% |
| Junior high school (Grades 7 to 10 and non-graded) | 8,503,650 | 8,320,627 | +183,023 | +2.2% |
| Senior high school (Grades 11 and 12) | 3,194,035 | 3,022,841 | +171,194 | +5.7% |
| Female learners | 13,274,182 | 13,286,514 | -12,332 | -0.1% |
| Male learners | 13,756,209 | 13,731,995 | +24,214 | +0.2% |
| Female share of learners | 49.1% | 49.2% | -0.07 points |
Kindergarten enrollment fell 15% in SY 2019-2020
Kindergarten fell from 2,409,782 to 2,044,745. That is a loss of 365,037 learners, or 15.1%, the largest fall in any grade in any year of the series apart from the pandemic year’s Grade 1. The fall came before the pandemic. The previous year’s class had been the largest of the nine; this one was the seventh largest. No later class has exceeded 2.2 million. Public kindergarten fell by 319,599 learners, from 2,110,675 to 1,791,076. Private kindergarten fell by 45,455, so the drop was not a private-sector event.
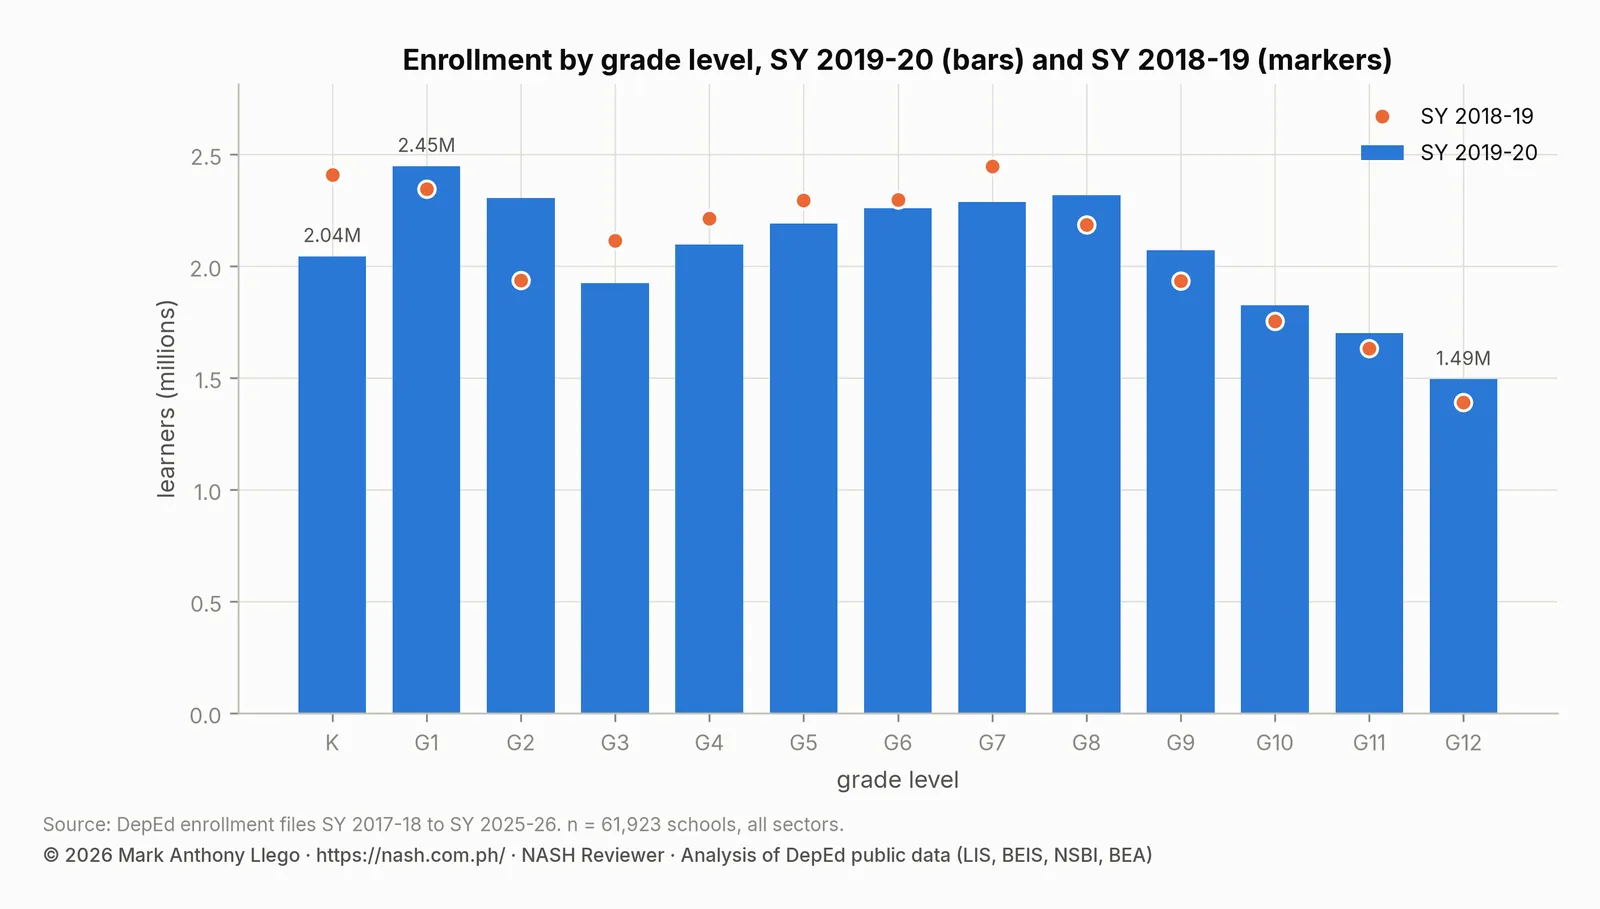
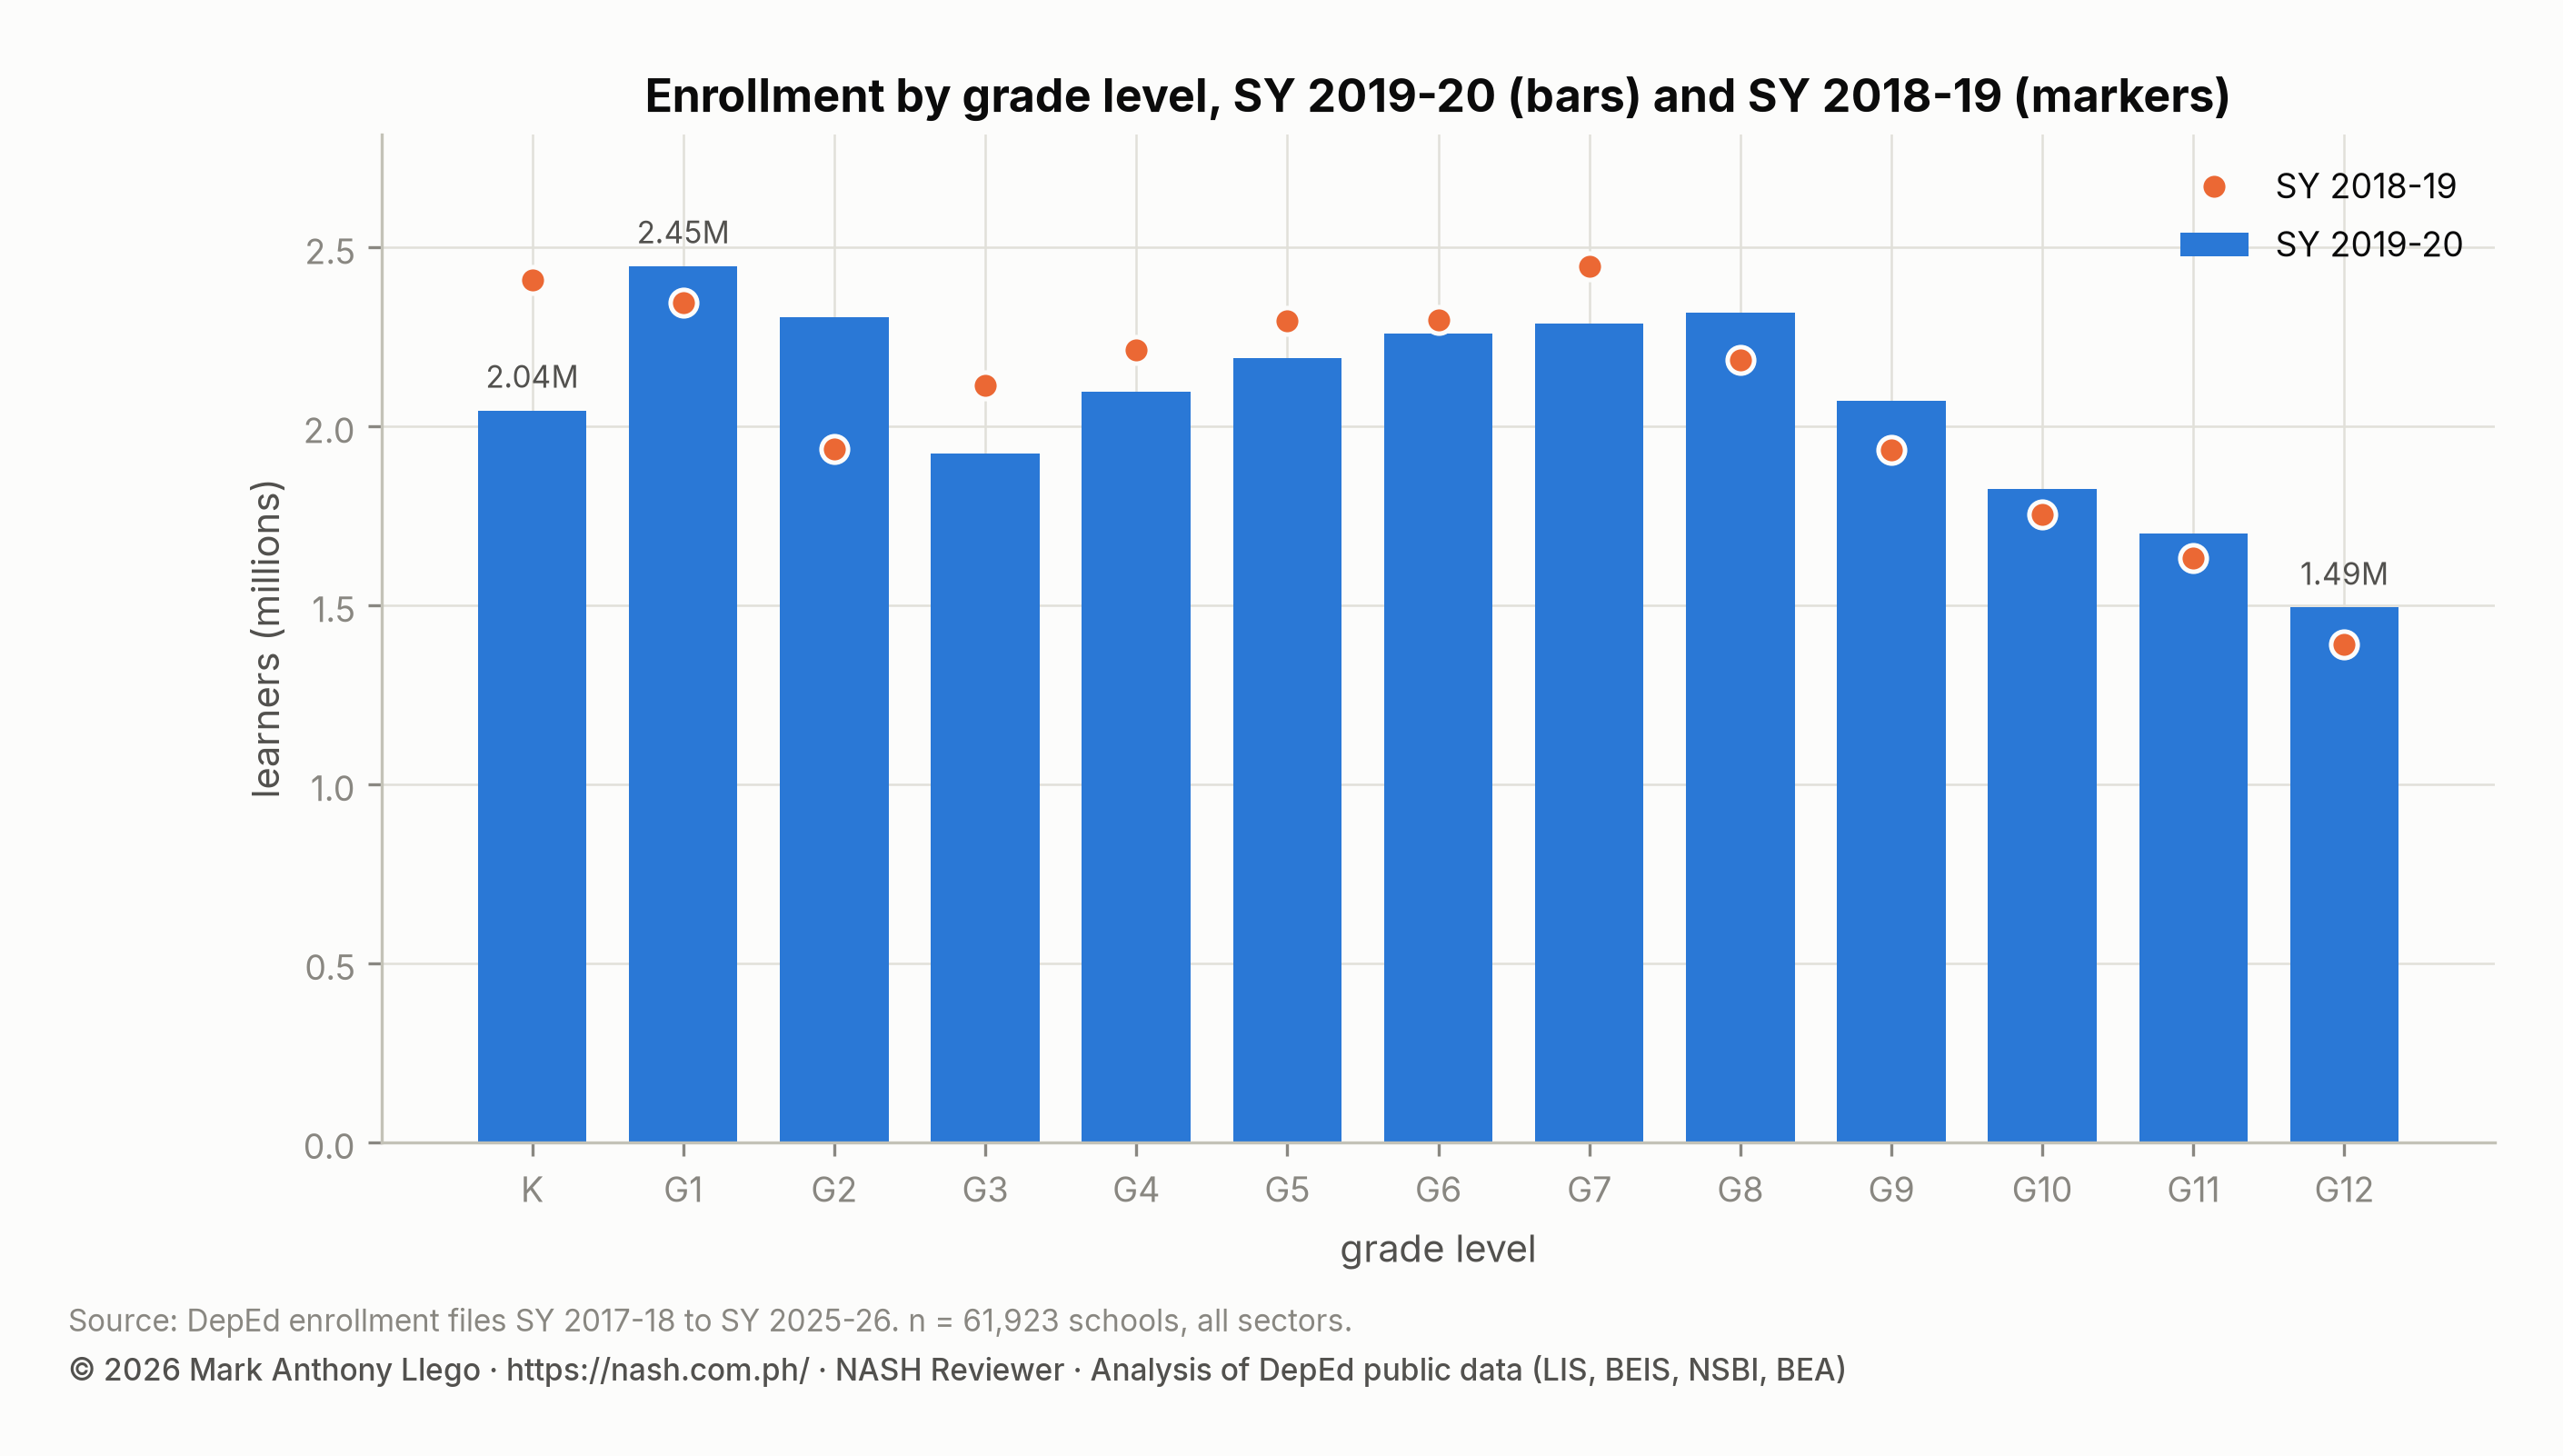
The rest of the elementary profile shows the two cohorts of the previous reports moving up. Grade 2 rose by 370,255 (+19.1%) as the large Grade 1 class of SY 2018-2019 moved up. Grade 3 fell by 190,726 (−9.0%) as the small SY 2017-2018 Grade 1 cohort reached it. Grade 7 fell 6.5% because the SY 2018-2019 Grade 6 class had been smaller than the one before it. Grades 8 and 9 grew 6.1% and 7.1%. Elementary as a whole lost 342,335 learners (−2.2%). Junior high gained 183,023 learners (+2.2%). Senior high gained 171,194 (+5.7%).
| Grade | Learners | Share of total | SY 2018-19 | Change | Change (%) |
|---|---|---|---|---|---|
| Kindergarten | 2,044,745 | 7.6% | 2,409,782 | -365,037 | -15.1% |
| Grade 1 | 2,448,099 | 9.1% | 2,345,534 | +102,565 | +4.4% |
| Grade 2 | 2,306,031 | 8.5% | 1,935,776 | +370,255 | +19.1% |
| Grade 3 | 1,924,797 | 7.1% | 2,115,523 | -190,726 | -9.0% |
| Grade 4 | 2,096,355 | 7.8% | 2,212,689 | -116,334 | -5.3% |
| Grade 5 | 2,191,225 | 8.1% | 2,294,920 | -103,695 | -4.5% |
| Grade 6 | 2,259,667 | 8.4% | 2,297,486 | -37,819 | -1.6% |
| Grade 7 | 2,287,310 | 8.5% | 2,447,556 | -160,246 | -6.5% |
| Grade 8 | 2,318,290 | 8.6% | 2,185,177 | +133,113 | +6.1% |
| Grade 9 | 2,071,210 | 7.7% | 1,933,761 | +137,449 | +7.1% |
| Grade 10 | 1,824,699 | 6.8% | 1,754,133 | +70,566 | +4.0% |
| Grade 11 | 1,699,863 | 6.3% | 1,632,005 | +67,858 | +4.2% |
| Grade 12 | 1,494,172 | 5.5% | 1,390,836 | +103,336 | +7.4% |
The flow ratios were close to their pre-pandemic norms. Grade 1 took 1.016 learners for every kindergarten learner the year before, Grade 7 took 0.996 of the previous Grade 6, and Grade 11 took 0.969 of the previous Grade 10. The next report shows all three ratios falling.
Public and private school enrollment: the private peak
| Sector | Schools | Learners | Share of learners | Kindergarten | Elementary (K to 6) | Junior high | Senior high | Schools, SY 2018-19 | Learners, SY 2018-19 | Change (%) |
|---|---|---|---|---|---|---|---|---|---|---|
| Public | 47,188 | 22,572,923 | 83.5% | 1,791,076 | 13,801,750 | 7,004,355 | 1,766,818 | 47,025 | 22,558,138 | +0.1% |
| Private | 14,435 | 4,304,676 | 15.9% | 250,811 | 1,507,287 | 1,439,507 | 1,357,882 | 14,562 | 4,298,566 | +0.1% |
| SUC/LUC laboratory schools | 271 | 131,006 | 0.5% | 1,088 | 10,197 | 53,107 | 67,702 | 309 | 148,313 | -11.7% |
| Philippine Schools Overseas | 29 | 21,786 | 0.1% | 1,770 | 13,472 | 6,681 | 1,633 | 20 | 13,492 | +61.5% |
Private enrollment was 4,304,676 learners in 14,435 schools, the highest in the series. The private share of all learners was 15.9% for the second year running. Private schools held 12.3% of kindergarten learners and 9.5% of Grades 1 to 6. They held 16.9% of Grades 7 to 10 and 42.5% of senior high. Public enrollment was 22,572,923, up 14,785. The laboratory schools of state and local universities and colleges (SUC/LUC in the tables) lost 11.7% of their enrollment in a year, from 148,313 to 131,006. That decline continued and would halve them by SY 2025-2026.
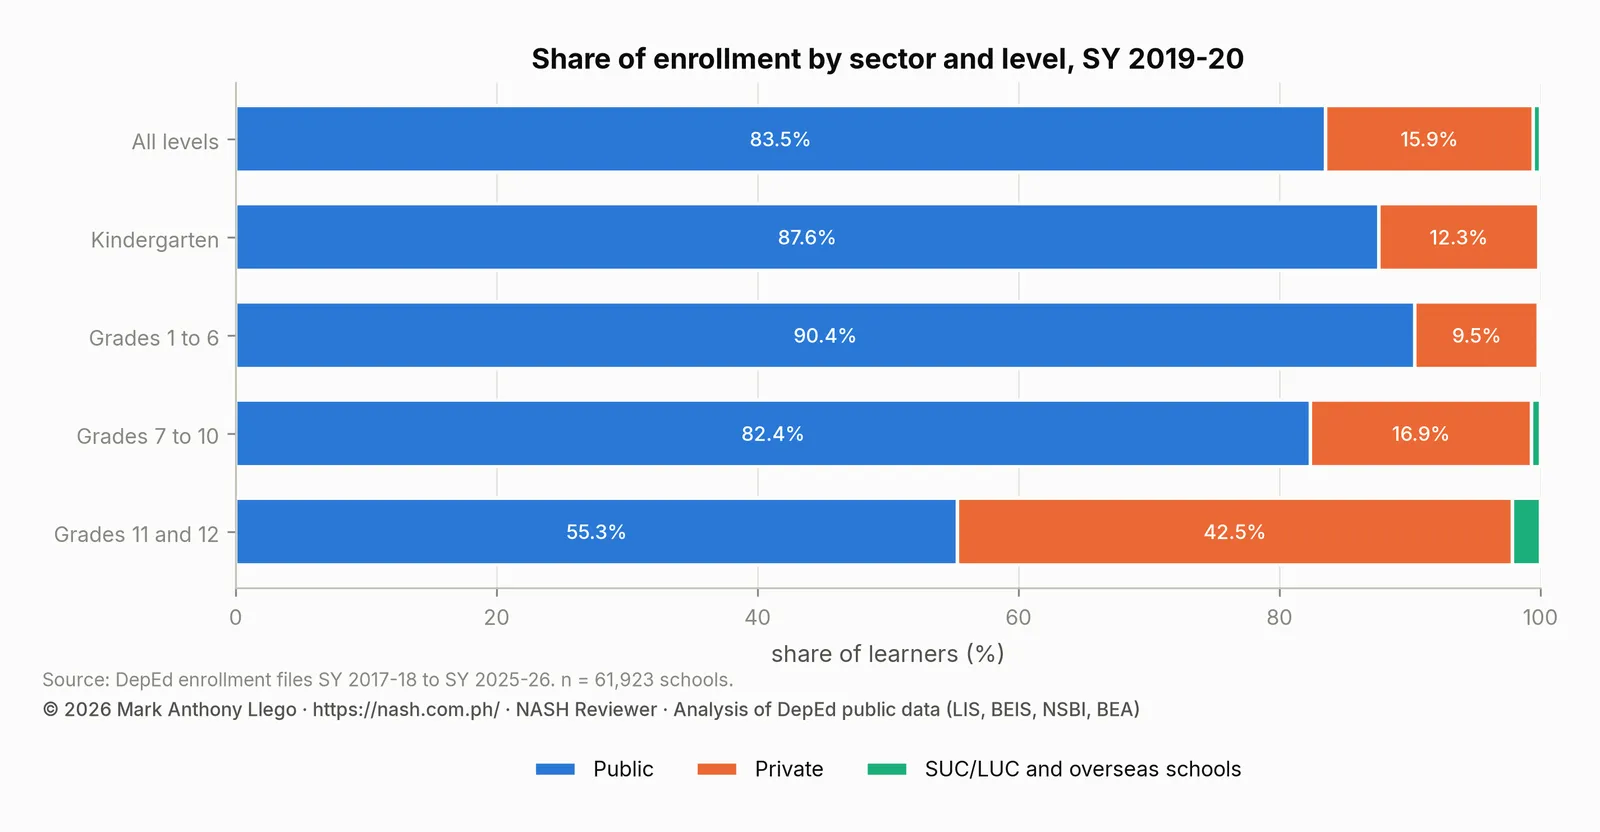
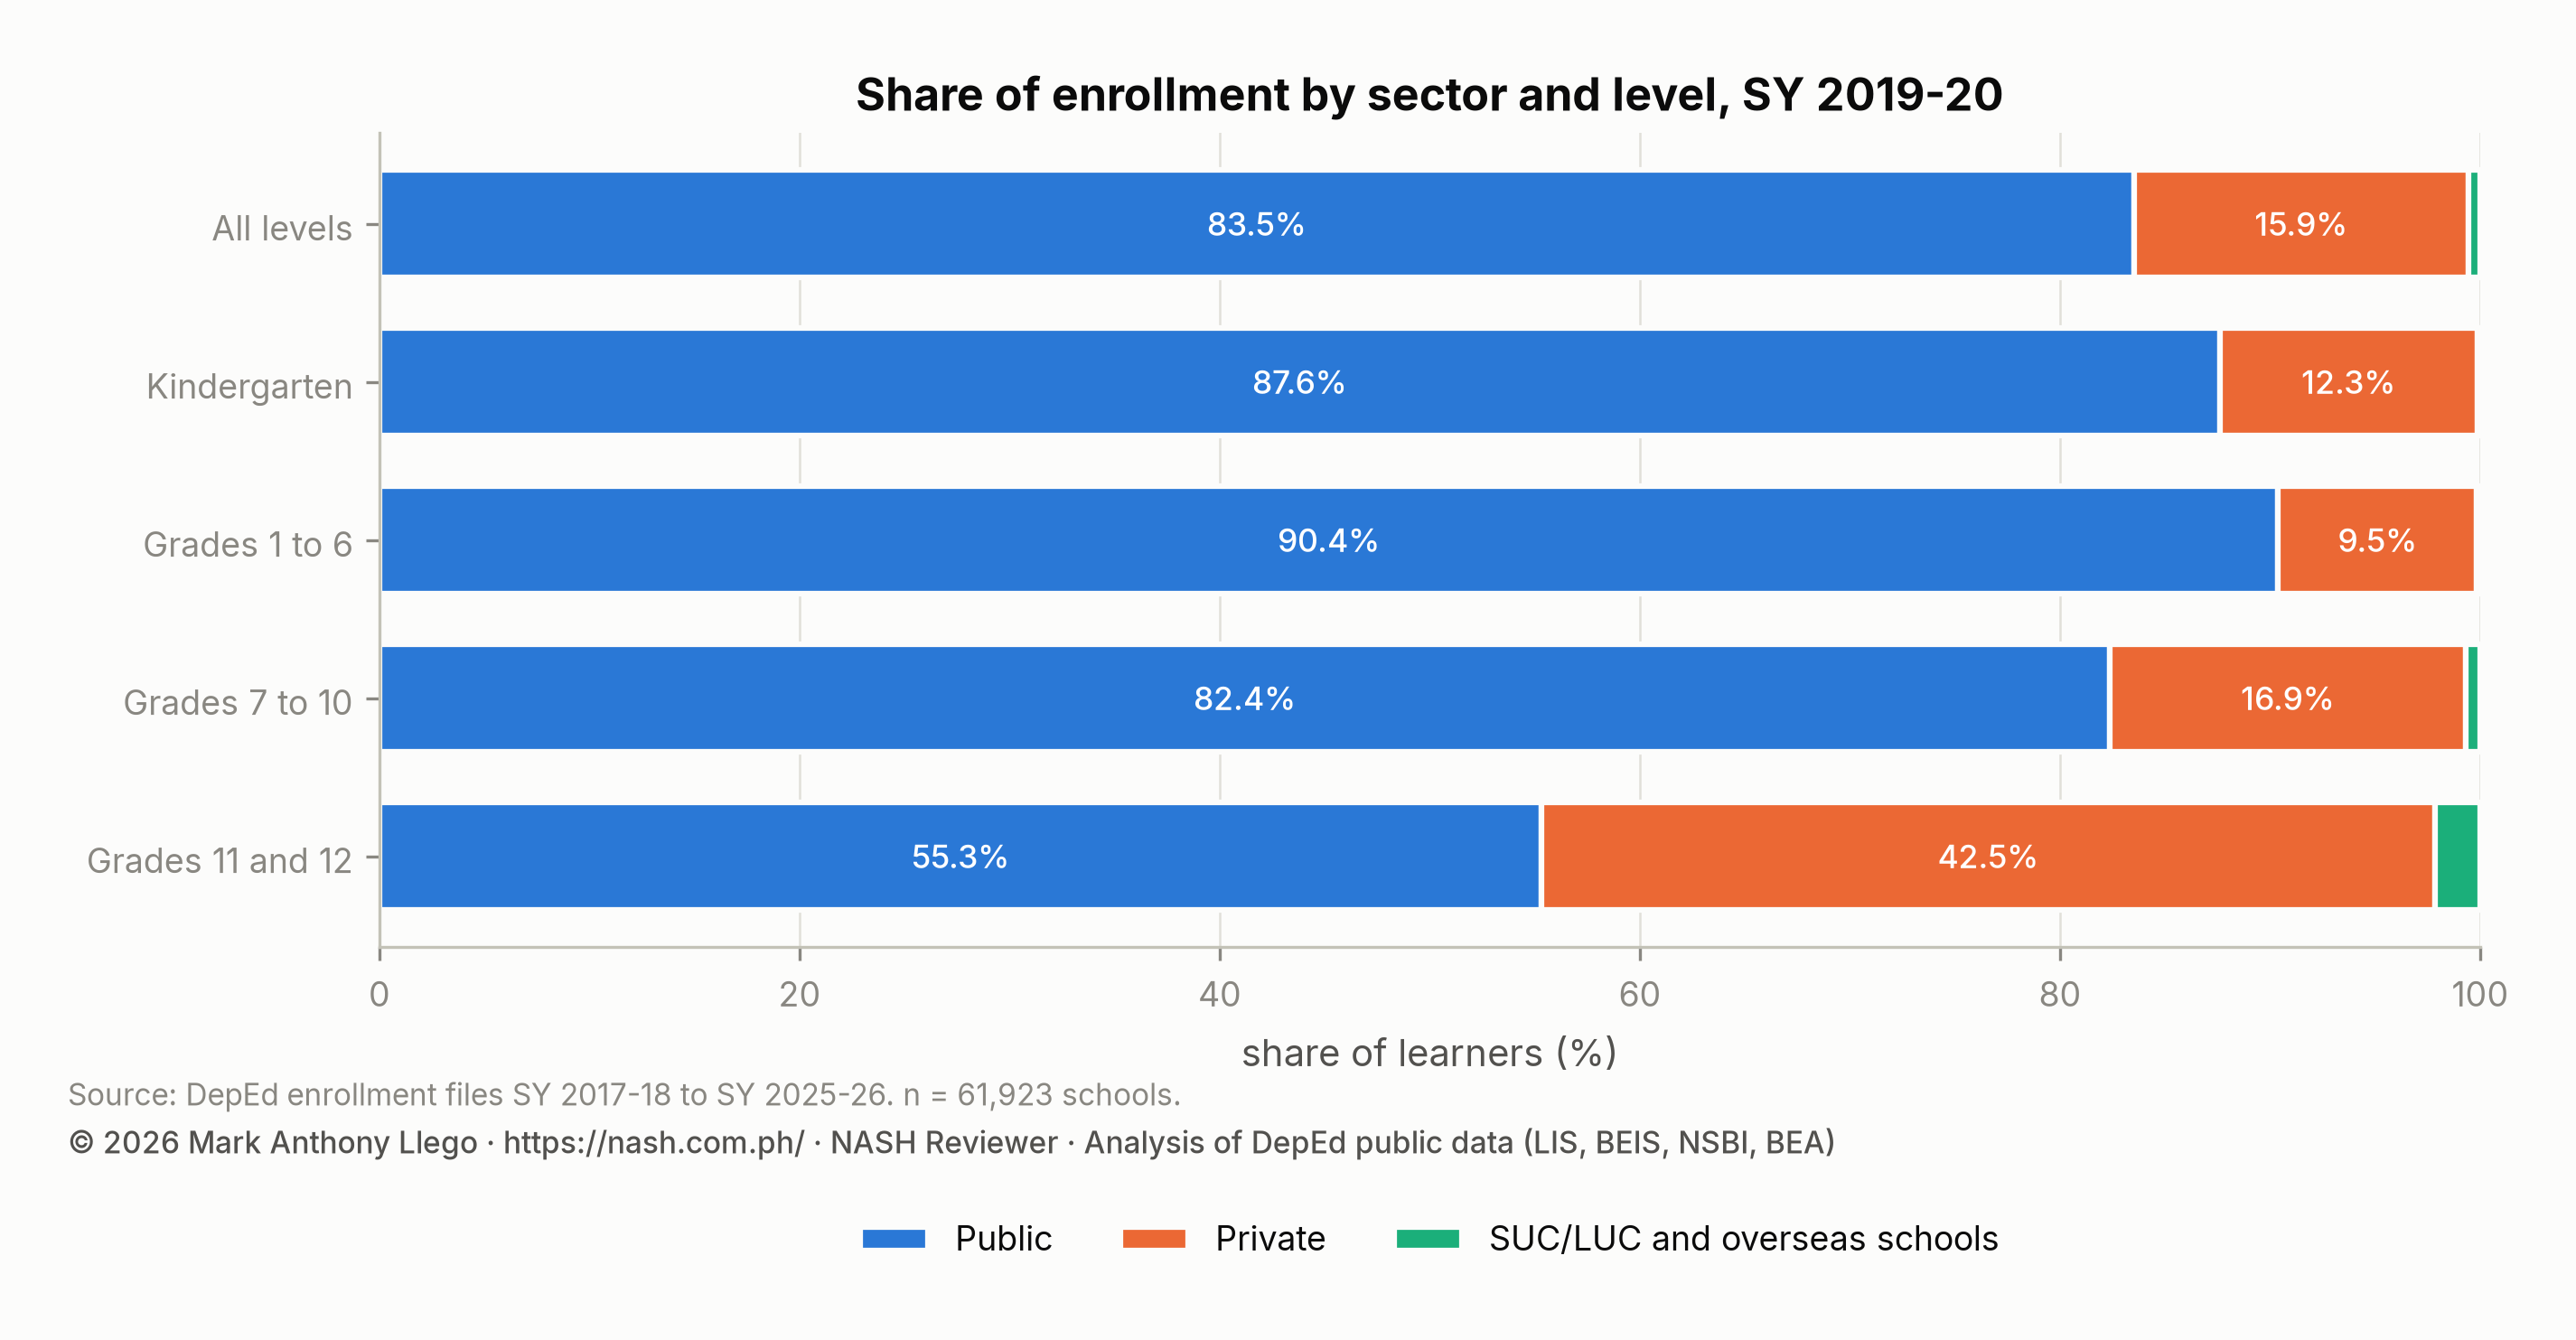
Two years later, private enrollment would be 3.31 million and the private share 12.0%. Even in SY 2025-2026, at 3.76 million, it had recovered only to 87% of this year’s level. For anyone comparing private and public schools over time, SY 2019-2020 is the year of peak private enrollment.
Enrollment by region: ten regions lost learners
| Region (SY 2025-26 boundaries) | Schools | Learners | Share of learners | SY 2018-19 | Change | Change (%) | Private share | Senior high share | Female share |
|---|---|---|---|---|---|---|---|---|---|
| Region IV-A | 6,592 | 3,833,280 | 14.2% | 3,807,176 | +26,104 | +0.7% | 22.8% | 11.9% | 48.9% |
| NCR | 3,221 | 2,916,295 | 10.8% | 2,944,976 | -28,681 | -1.0% | 28.9% | 14.1% | 49.3% |
| Region III | 5,415 | 2,915,454 | 10.8% | 2,920,039 | -4,585 | -0.2% | 19.1% | 12.3% | 48.9% |
| Region V | 4,462 | 1,785,756 | 6.6% | 1,795,289 | -9,533 | -0.5% | 9.2% | 11.6% | 48.8% |
| Region VII | 3,629 | 1,694,486 | 6.3% | 1,697,810 | -3,324 | -0.2% | 17.0% | 12.5% | 48.9% |
| Region XI | 2,739 | 1,358,826 | 5.0% | 1,353,174 | +5,652 | +0.4% | 14.5% | 10.9% | 49.4% |
| Region X | 3,173 | 1,311,257 | 4.9% | 1,300,956 | +10,301 | +0.8% | 13.3% | 10.4% | 49.2% |
| Region I | 3,454 | 1,291,071 | 4.8% | 1,305,362 | -14,291 | -1.1% | 13.1% | 13.1% | 48.5% |
| Region VIII | 4,486 | 1,261,310 | 4.7% | 1,270,720 | -9,410 | -0.7% | 6.8% | 11.8% | 49.0% |
| NIR | 2,752 | 1,250,904 | 4.6% | 1,254,527 | -3,623 | -0.3% | 11.0% | 11.3% | 49.2% |
| Region XII | 2,660 | 1,199,786 | 4.4% | 1,187,895 | +11,891 | +1.0% | 11.6% | 10.4% | 49.4% |
| Region IX | 3,339 | 1,191,123 | 4.4% | 1,177,437 | +13,686 | +1.2% | 8.3% | 9.9% | 49.8% |
| Region VI | 3,531 | 1,184,212 | 4.4% | 1,192,633 | -8,421 | -0.7% | 11.1% | 12.7% | 48.5% |
| Region II | 2,960 | 896,502 | 3.3% | 897,554 | -1,052 | -0.1% | 12.2% | 12.0% | 49.0% |
| MIMAROPA | 2,681 | 888,159 | 3.3% | 886,699 | +1,460 | +0.2% | 8.4% | 11.1% | 48.9% |
| BARMM | 2,333 | 813,434 | 3.0% | 792,399 | +21,035 | +2.7% | 12.4% | 7.2% | 51.7% |
| CARAGA | 2,353 | 776,855 | 2.9% | 774,978 | +1,877 | +0.2% | 9.2% | 11.1% | 48.8% |
| CAR | 2,114 | 439,895 | 1.6% | 445,393 | -5,498 | -1.2% | 20.2% | 13.0% | 49.1% |
For the first time in the series, regions moved in opposite directions. The regions that grew most were all in Mindanao: BARMM (+2.7%), Region IX (+1.2%) and Region XII (+1.0%). Region X (+0.8%) came next, and Region IV-A (+0.7%) was the only Luzon region above 0.3%. CAR (−1.2%), Region I (−1.1%) and NCR (−1.0%) shrank most. NCR lost 28,681 learners, the largest absolute loss, and it has lost learners in every year since. Its share of the national total, 10.8%, was now equal to Region III’s.
This split is the start of the pattern that the nine-year enrollment trends report describes. That pattern is growth in BARMM and parts of Mindanao, and decline in Ilocos, the Cordillera, the Visayas and the capital. It began a year before the pandemic, so it is demographic, not a pandemic effect.
Enrollment by division: a transfer between Davao Oriental and Mati City
The division table for this year shows Davao Oriental growing by 86.7%, from 62,264 to 116,221 learners. It also shows Mati City shrinking by 56.4%, from 97,171 to 42,390. The two movements cancel almost exactly: Davao Oriental gained 53,957 learners and Mati City lost 54,781. Schools were reassigned between the two divisions, which share a province, and nothing happened to the learners. The same table shows Marawi City growing another 16.8% after its 164% recovery the year before. Manila (−2.9%), Makati City (−3.1%) and the City of San Juan (−4.5%) led NCR’s decline.
| Division | Region | Schools | Learners, SY 2019-20 | Learners, SY 2018-19 | Change | Change (%) | |
|---|---|---|---|---|---|---|---|
| Fastest growth | Davao Oriental | Region XI | 349 | 116,221 | 62,264 | +53,957 | +86.7% |
| Fastest growth | Marawi City | BARMM | 101 | 48,368 | 41,413 | +6,955 | +16.8% |
| Fastest growth | Cabuyao City | Region IV-A | 134 | 82,994 | 76,697 | +6,297 | +8.2% |
| Fastest growth | Lamitan City | BARMM | 67 | 27,681 | 25,677 | +2,004 | +7.8% |
| Fastest growth | Sulu | Region IX | 472 | 151,199 | 144,981 | +6,218 | +4.3% |
| Steepest decline | Mati City | Region XI | 86 | 42,390 | 97,171 | -54,781 | -56.4% |
| Steepest decline | City of San Juan | NCR | 46 | 24,463 | 25,623 | -1,160 | -4.5% |
| Steepest decline | Tagbilaran City | Region VII | 50 | 34,332 | 35,596 | -1,264 | -3.6% |
| Steepest decline | Makati City | NCR | 137 | 109,222 | 112,771 | -3,549 | -3.1% |
| Steepest decline | Manila | NCR | 356 | 401,725 | 413,631 | -11,906 | -2.9% |
Two divisions are new in the file. General Trias City, with 85,957 learners, was carved from Cavite, which therefore shows a 13.6% drop. Lanao del Sur - IB, an 86-learner division, exists only in this one file. The ten largest divisions are the same ten as the year before, with Quezon City first at 640,283, and they hold 18.6% of all learners.
Senior high school strands: HUMSS overtakes GAS, TVL stops growing
| Track or strand | Learners | Share of senior high | SY 2018-19 | Change | Change (%) |
|---|---|---|---|---|---|
| TVL | 1,082,531 | 33.9% | 1,085,926 | -3,395 | -0.3% |
| HUMSS | 639,746 | 20.0% | 473,958 | +165,788 | +35.0% |
| GAS | 534,934 | 16.7% | 577,830 | -42,896 | -7.4% |
| STEM | 491,349 | 15.4% | 436,376 | +54,973 | +12.6% |
| ABM | 412,474 | 12.9% | 416,558 | -4,084 | -1.0% |
| Arts and Design | 14,544 | 0.5% | 13,215 | +1,329 | +10.1% |
| Maritime | 12,974 | 0.4% | 13,818 | -844 | -6.1% |
| Sports | 5,483 | 0.2% | 5,160 | +323 | +6.3% |
Senior high enrolled 3,194,035 learners, 11.8% of all learners, and the strand mix changed more than the total. HUMSS grew by 165,788 learners (+35.0%) to 639,746. It overtook GAS, which fell 7.4% to 534,934, to become the second-largest strand. Science, Technology, Engineering and Mathematics (STEM) grew 12.6% to 491,349. The Technical-Vocational-Livelihood (TVL) track, the largest with 1,082,531 learners, did not grow at all (−0.3%). Its share of senior high fell from 35.9% to 33.9%, and it would keep falling. Accountancy, Business and Management (ABM) fell 1.0%.
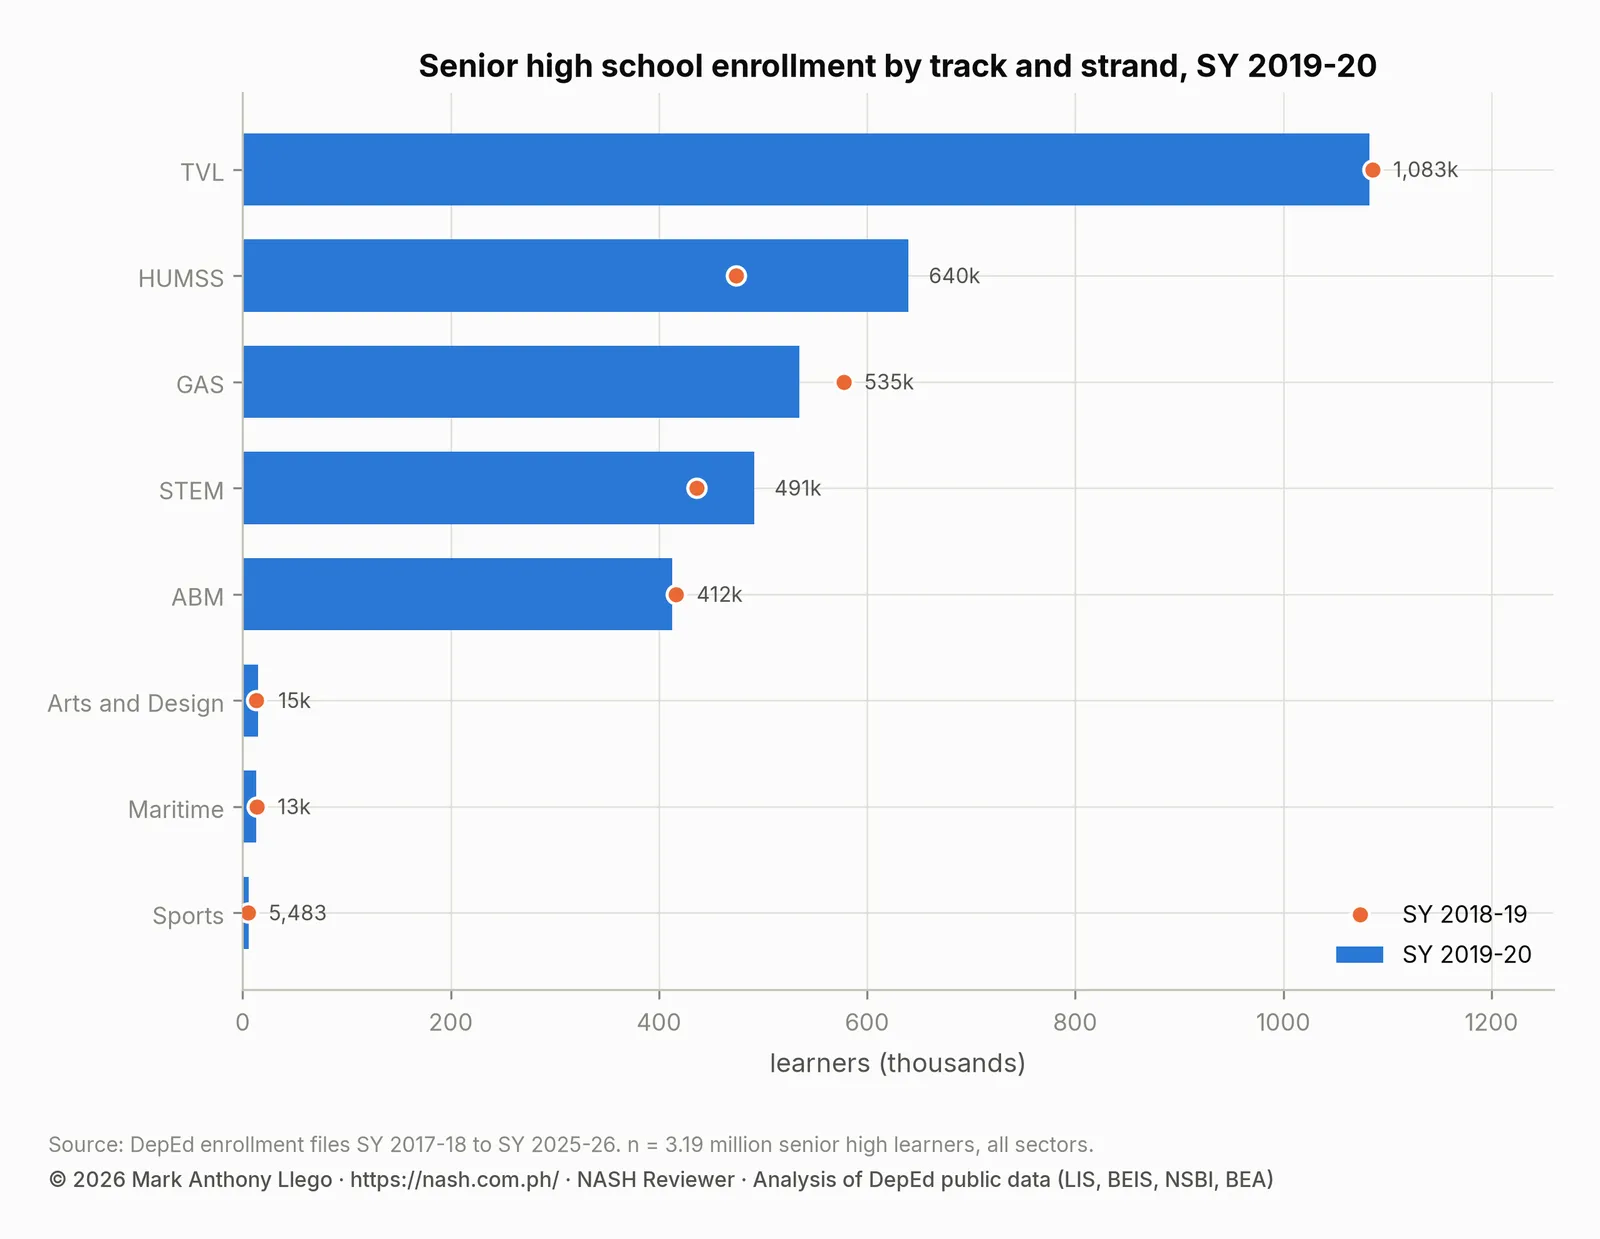
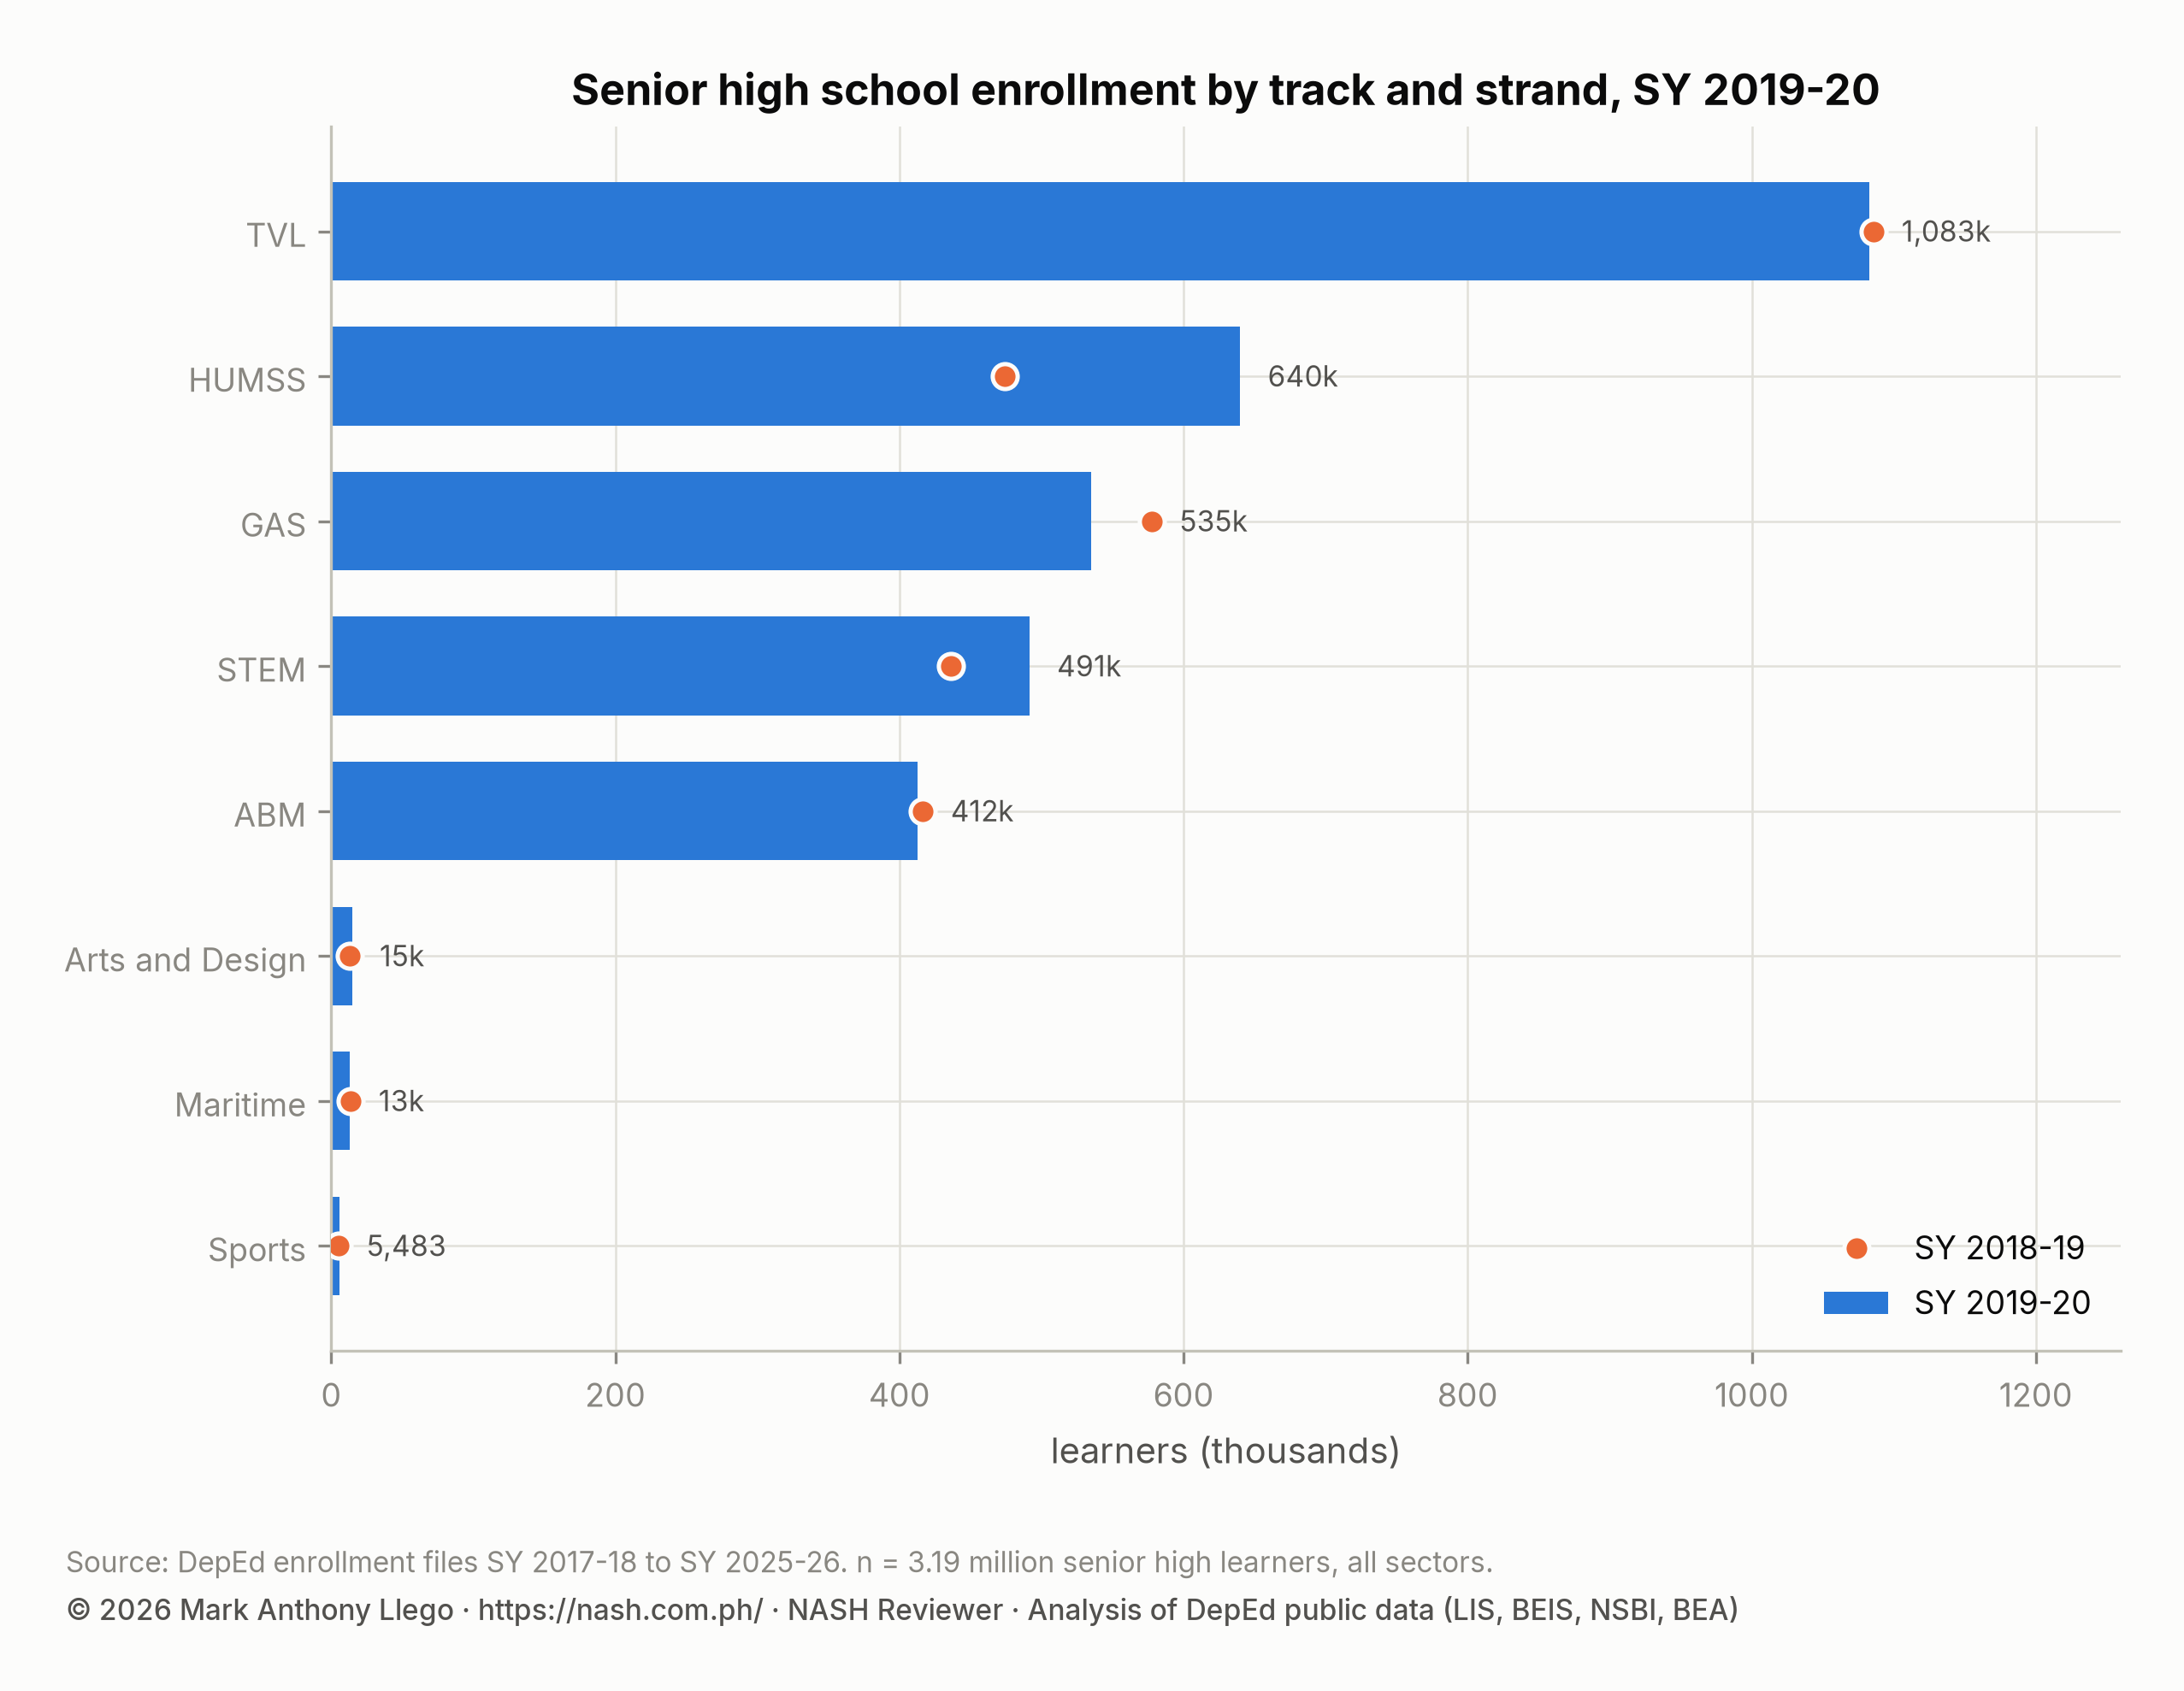
The shift from GAS and TVL toward HUMSS and STEM, visible here for the first time, continued in every later year. By SY 2025-2026, HUMSS was within 27,000 learners of TVL.
The 1,422 private schools absent from the SY 2020-2021 file
| Sector | Schools in the file | Schools new in SY 2019-20 | Learners in new schools | Schools absent from SY 2020-21 | Their learners in this year |
|---|---|---|---|---|---|
| Public | 47,188 | 574 | 180,774 | 263 | 75,148 |
| Private | 14,435 | 454 | 26,017 | 1,422 | 67,236 |
| SUC/LUC laboratory schools | 271 | 4 | 290 | 26 | 2,410 |
| Philippine Schools Overseas | 29 | 9 | 3,070 | 0 | 0 |
The most important number in this file concerns the following year. Of the 14,435 private schools present in SY 2019-2020, 1,422 are absent from the SY 2020-2021 file. They held 67,236 learners in this, their last year. No other year in the series comes close: private exits run between 420 and 833 in every other year. These are the schools that did not open for the pandemic school year. The SY 2020-2021 report counts how many of their learners reappear in public schools. The trends report notes that 194 of the 1,711 schools of all sectors that left after this year came back later, so some were pauses rather than closures.
Public schools changed less. The 263 public schools absent from the next file carried 75,148 learners, which is consistent with the usual turnover from mergers and ID changes. New in this year’s file were 574 public schools with 180,774 learners. Another 454 private schools, with 26,017 learners, were also new.
What the SY 2019-2020 file records for the first time
- It is the first file to use the name BARMM, after the Bangsamoro Organic Law took effect in 2019. Cotabato City’s 87 schools are still listed under Region XII. They are counted under BARMM here, and Sulu’s 472 schools under Region IX.
- It is the first file to record each school’s annex status: 58,148 standalone schools, 2,358 mother schools, 1,402 annex or extension schools and 15 mobile schools or centers.
- The number of schools labeled as managed by a local government falls from 1,054 to 193 between the SY 2018-2019 and SY 2019-2020 files. The label changed, not the schools, and by SY 2023-2024 it disappears.
- The median public school had 233 learners and the median private school 111. In the file, 117 schools report zero learners.
Frequently asked questions
How many learners were enrolled in Philippine schools in SY 2019-2020?
DepEd’s file counts 27,030,391 learners in 61,923 schools. Of these, 15,332,706 were in elementary including kindergarten, 8,503,650 in junior high and 3,194,035 in senior high. The total was 11,882 higher than in SY 2018-2019.
Was SY 2019-2020 the peak of DepEd enrollment?
No. Total enrollment peaked in SY 2022-2023 at 27,794,282. SY 2019-2020 was the peak of private enrollment, 4,304,676, and of the private share, 15.9%, and it was the last count before the pandemic.
Why did kindergarten enrollment fall by 15% in SY 2019-2020?
The file does not say. The SY 2018-2019 class of 2,409,782 was the largest of the nine years, and the SY 2019-2020 class of 2,044,745 was the seventh largest. The fall was in public schools (−319,599) far more than in private ones (−45,455).
Download the data
The cleaned, harmonized DepEd files behind this series are free to download in CSV and Parquet, with a codebook and checksums, under the terms of use set out in the release. Download Cleaned DepEd School Data, SY 2017-18 to 2025-26 documents every file and column. The files themselves are at data.nash.com.ph, starting with the README, the SY 2023-24 school master file (CSV, 8.0 MB) and the nine-year enrollment panel (Parquet, 17.2 MB).
More in this series
- Previous year: DepEd Enrollment SY 2018-2019: Growth to 27.0 Million
- Next year: DepEd Enrollment SY 2020-2021: The Pandemic Drop
- The nine-year overview: DepEd Enrollment Trends SY 2017-2018 to SY 2025-2026
- All nine annual reports: SY 2017-18, SY 2018-19, SY 2019-20, SY 2020-21, SY 2021-22, SY 2022-23, SY 2023-24, SY 2024-25, SY 2025-26
- DepEd Data for Aspiring School Heads: Where to Start
- For aspiring school heads: How to Read DepEd Data and the full report, Philippine basic education in numbers
Analysis and charts by Mark Anthony Llego for NASH Reviewer. Data: Department of Education enrollment datasets for SY 2018-19 and SY 2019-20 (Learner Information System). Charts may be reused only with written permission from support@nash.com.ph.