DepEd’s enrollment dataset for SY 2024-2025 covers the year with the smallest kindergarten class in the nine years of DepEd’s open data. Kindergarten enrolled 1,827,258 children, 220,098 fewer than the year before (−10.8%). Total enrollment fell by 681,110 (−2.5%) to 26,400,182, the second year of decline. Classes opened on July 29, 2024, the first year of the MATATAG curriculum in kindergarten and Grades 1, 4 and 7. The kindergarten class that met the new curriculum was 24% below the SY 2018-2019 peak of 2.41 million.
A kindergarten class is the number in an enrollment file that says most about the years ahead. These children are the Grade 1 class of SY 2025-2026, the Grade 6 class of SY 2030-2031 and the Grade 10 class of SY 2034-2035. Every elementary school in the country will organize fewer sections for them than for the cohorts ahead of them. The next report shows kindergarten recovering by 9% the following year, so the SY 2024-2025 class may prove to be a one-year low rather than a trend. Either way, this cohort will move through the system for twelve more years.
Key findings
- Kindergarten fell 10.8% to 1,827,258 learners in SY 2024-2025, the smallest class in nine years of DepEd data. It was 24% below the SY 2018-2019 peak of 2.41 million.
- Total enrollment fell by 681,110 (−2.5%) to 26,400,182, the second year of decline. Every level fell, and the whole of the national decline was in public schools.
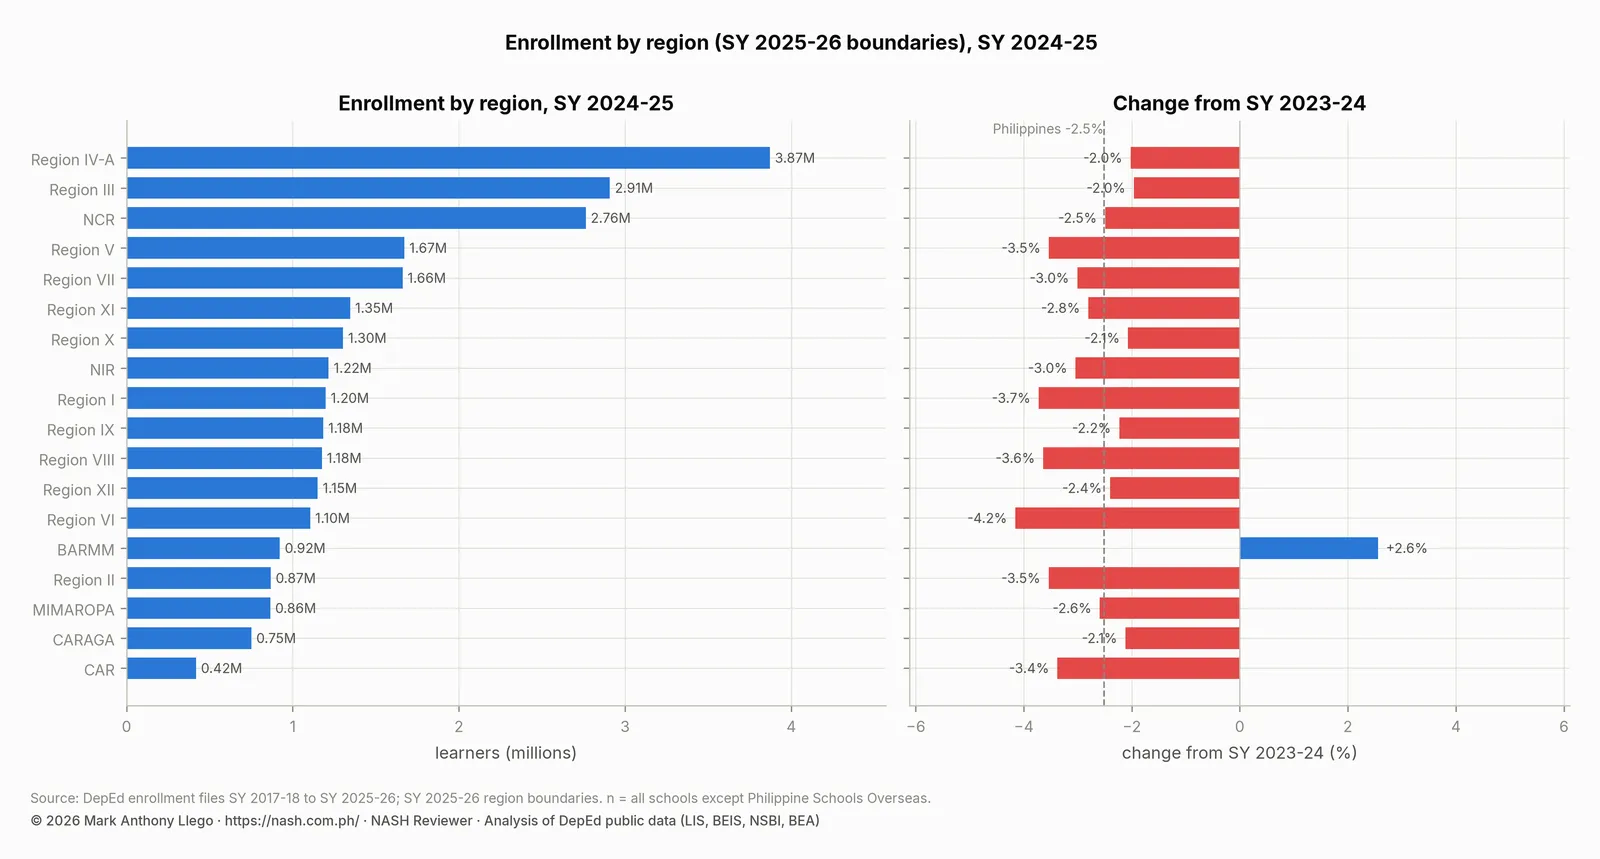
- BARMM was the only region to grow, by 2.6%. The other 17 regions fell by between 2.0% and 4.2%.
- Grade 7 rose 18.4% as the large cohort of SY 2018-2019 arrived. Grade 8, holding the small cohort of SY 2017-2018, fell 10.0% to the smallest grade in the system.
- GAS lost 111,592 learners (−18.2%) and became smaller than STEM. STEM grew 4.1% to 786,711, its highest count in the series.
| Item | SY 2024-25 | SY 2023-24 | Change | Change (%) |
|---|---|---|---|---|
| Schools in the file | 60,129 | 60,167 | -38 | -0.1% |
| Schools reporting enrollment | 60,129 | 60,167 | -38 | -0.1% |
| Total enrollment | 26,400,182 | 27,081,292 | -681,110 | -2.5% |
| Kindergarten | 1,827,258 | 2,047,356 | -220,098 | -10.8% |
| Grades 1 to 6 | 12,831,966 | 13,073,357 | -241,391 | -1.8% |
| Elementary non-graded | 89,540 | 81,238 | +8,302 | +10.2% |
| Elementary (K to 6 and non-graded) | 14,748,764 | 15,201,951 | -453,187 | -3.0% |
| Junior high school (Grades 7 to 10 and non-graded) | 7,665,606 | 7,749,265 | -83,659 | -1.1% |
| Senior high school (Grades 11 and 12) | 3,985,812 | 4,130,076 | -144,264 | -3.5% |
| Female learners | 12,923,116 | 13,227,202 | -304,086 | -2.3% |
| Male learners | 13,477,066 | 13,854,090 | -377,024 | -2.7% |
| Female share of learners | 49.0% | 48.8% | +0.11 points |
Enrollment by grade: three cohorts moving through the system
| Grade | Learners | Share of total | SY 2023-24 | Change | Change (%) |
|---|---|---|---|---|---|
| Kindergarten | 1,827,258 | 6.9% | 2,047,356 | -220,098 | -10.8% |
| Grade 1 | 2,070,358 | 7.8% | 2,161,371 | -91,013 | -4.2% |
| Grade 2 | 2,131,024 | 8.1% | 2,205,979 | -74,955 | -3.4% |
| Grade 3 | 2,193,031 | 8.3% | 2,183,377 | +9,654 | +0.4% |
| Grade 4 | 2,161,314 | 8.2% | 2,029,448 | +131,866 | +6.5% |
| Grade 5 | 2,000,886 | 7.6% | 2,309,827 | -308,941 | -13.4% |
| Grade 6 | 2,275,353 | 8.6% | 2,183,355 | +91,998 | +4.2% |
| Grade 7 | 2,141,724 | 8.1% | 1,808,212 | +333,512 | +18.4% |
| Grade 8 | 1,746,152 | 6.6% | 1,940,033 | -193,881 | -10.0% |
| Grade 9 | 1,867,514 | 7.1% | 1,992,251 | -124,737 | -6.3% |
| Grade 10 | 1,905,019 | 7.2% | 2,004,570 | -99,551 | -5.0% |
| Grade 11 | 2,041,601 | 7.7% | 2,090,066 | -48,465 | -2.3% |
| Grade 12 | 1,944,211 | 7.4% | 2,040,010 | -95,799 | -4.7% |
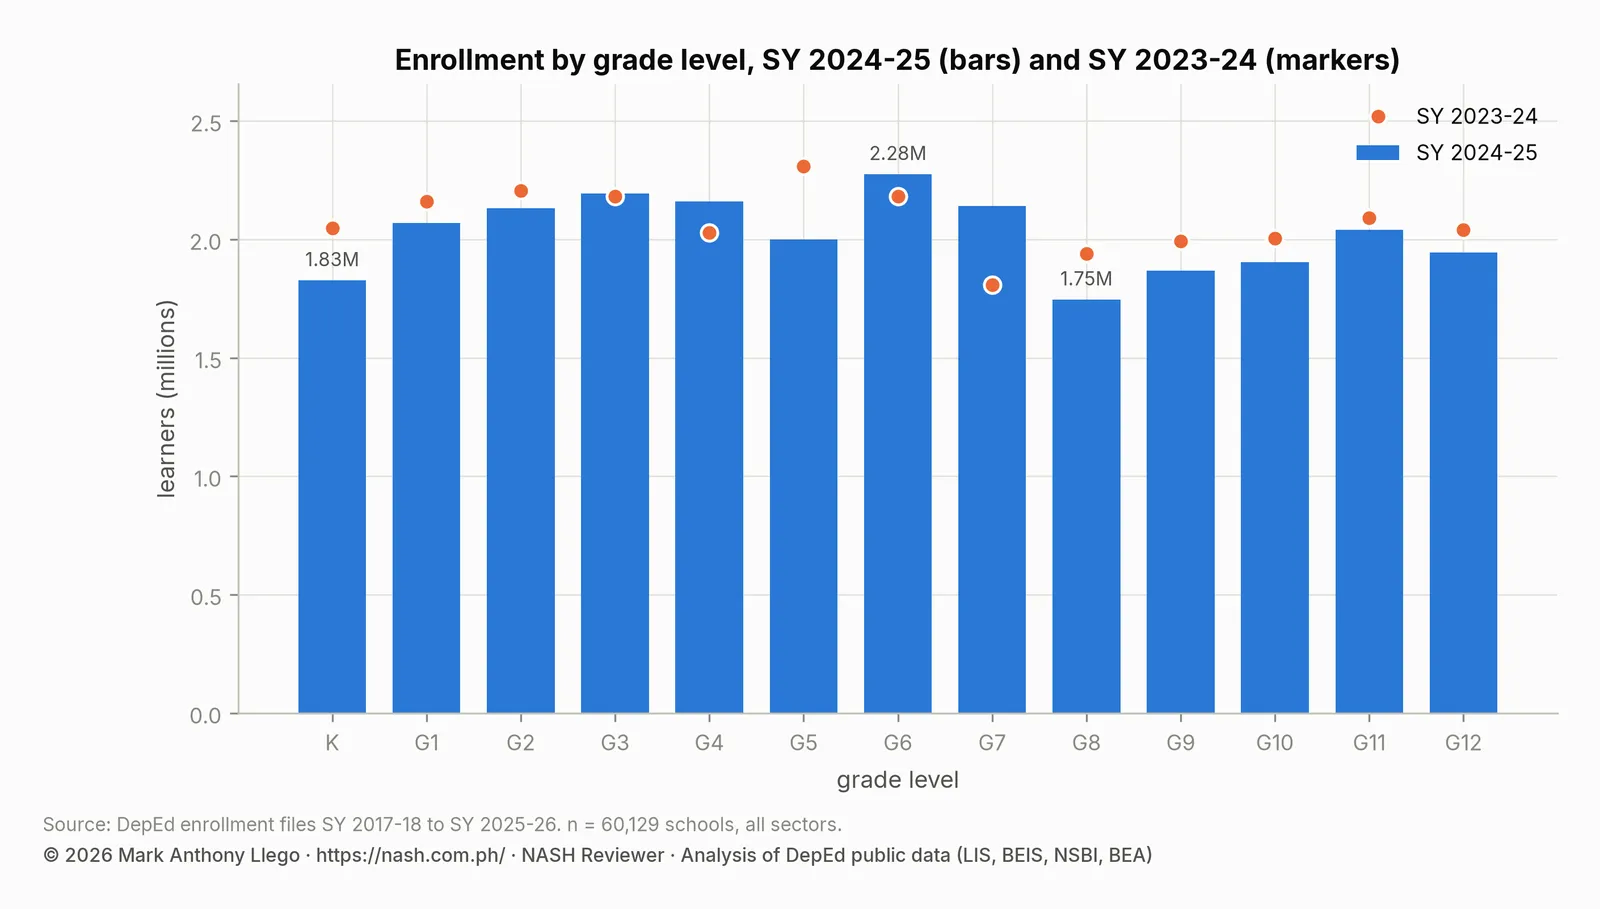
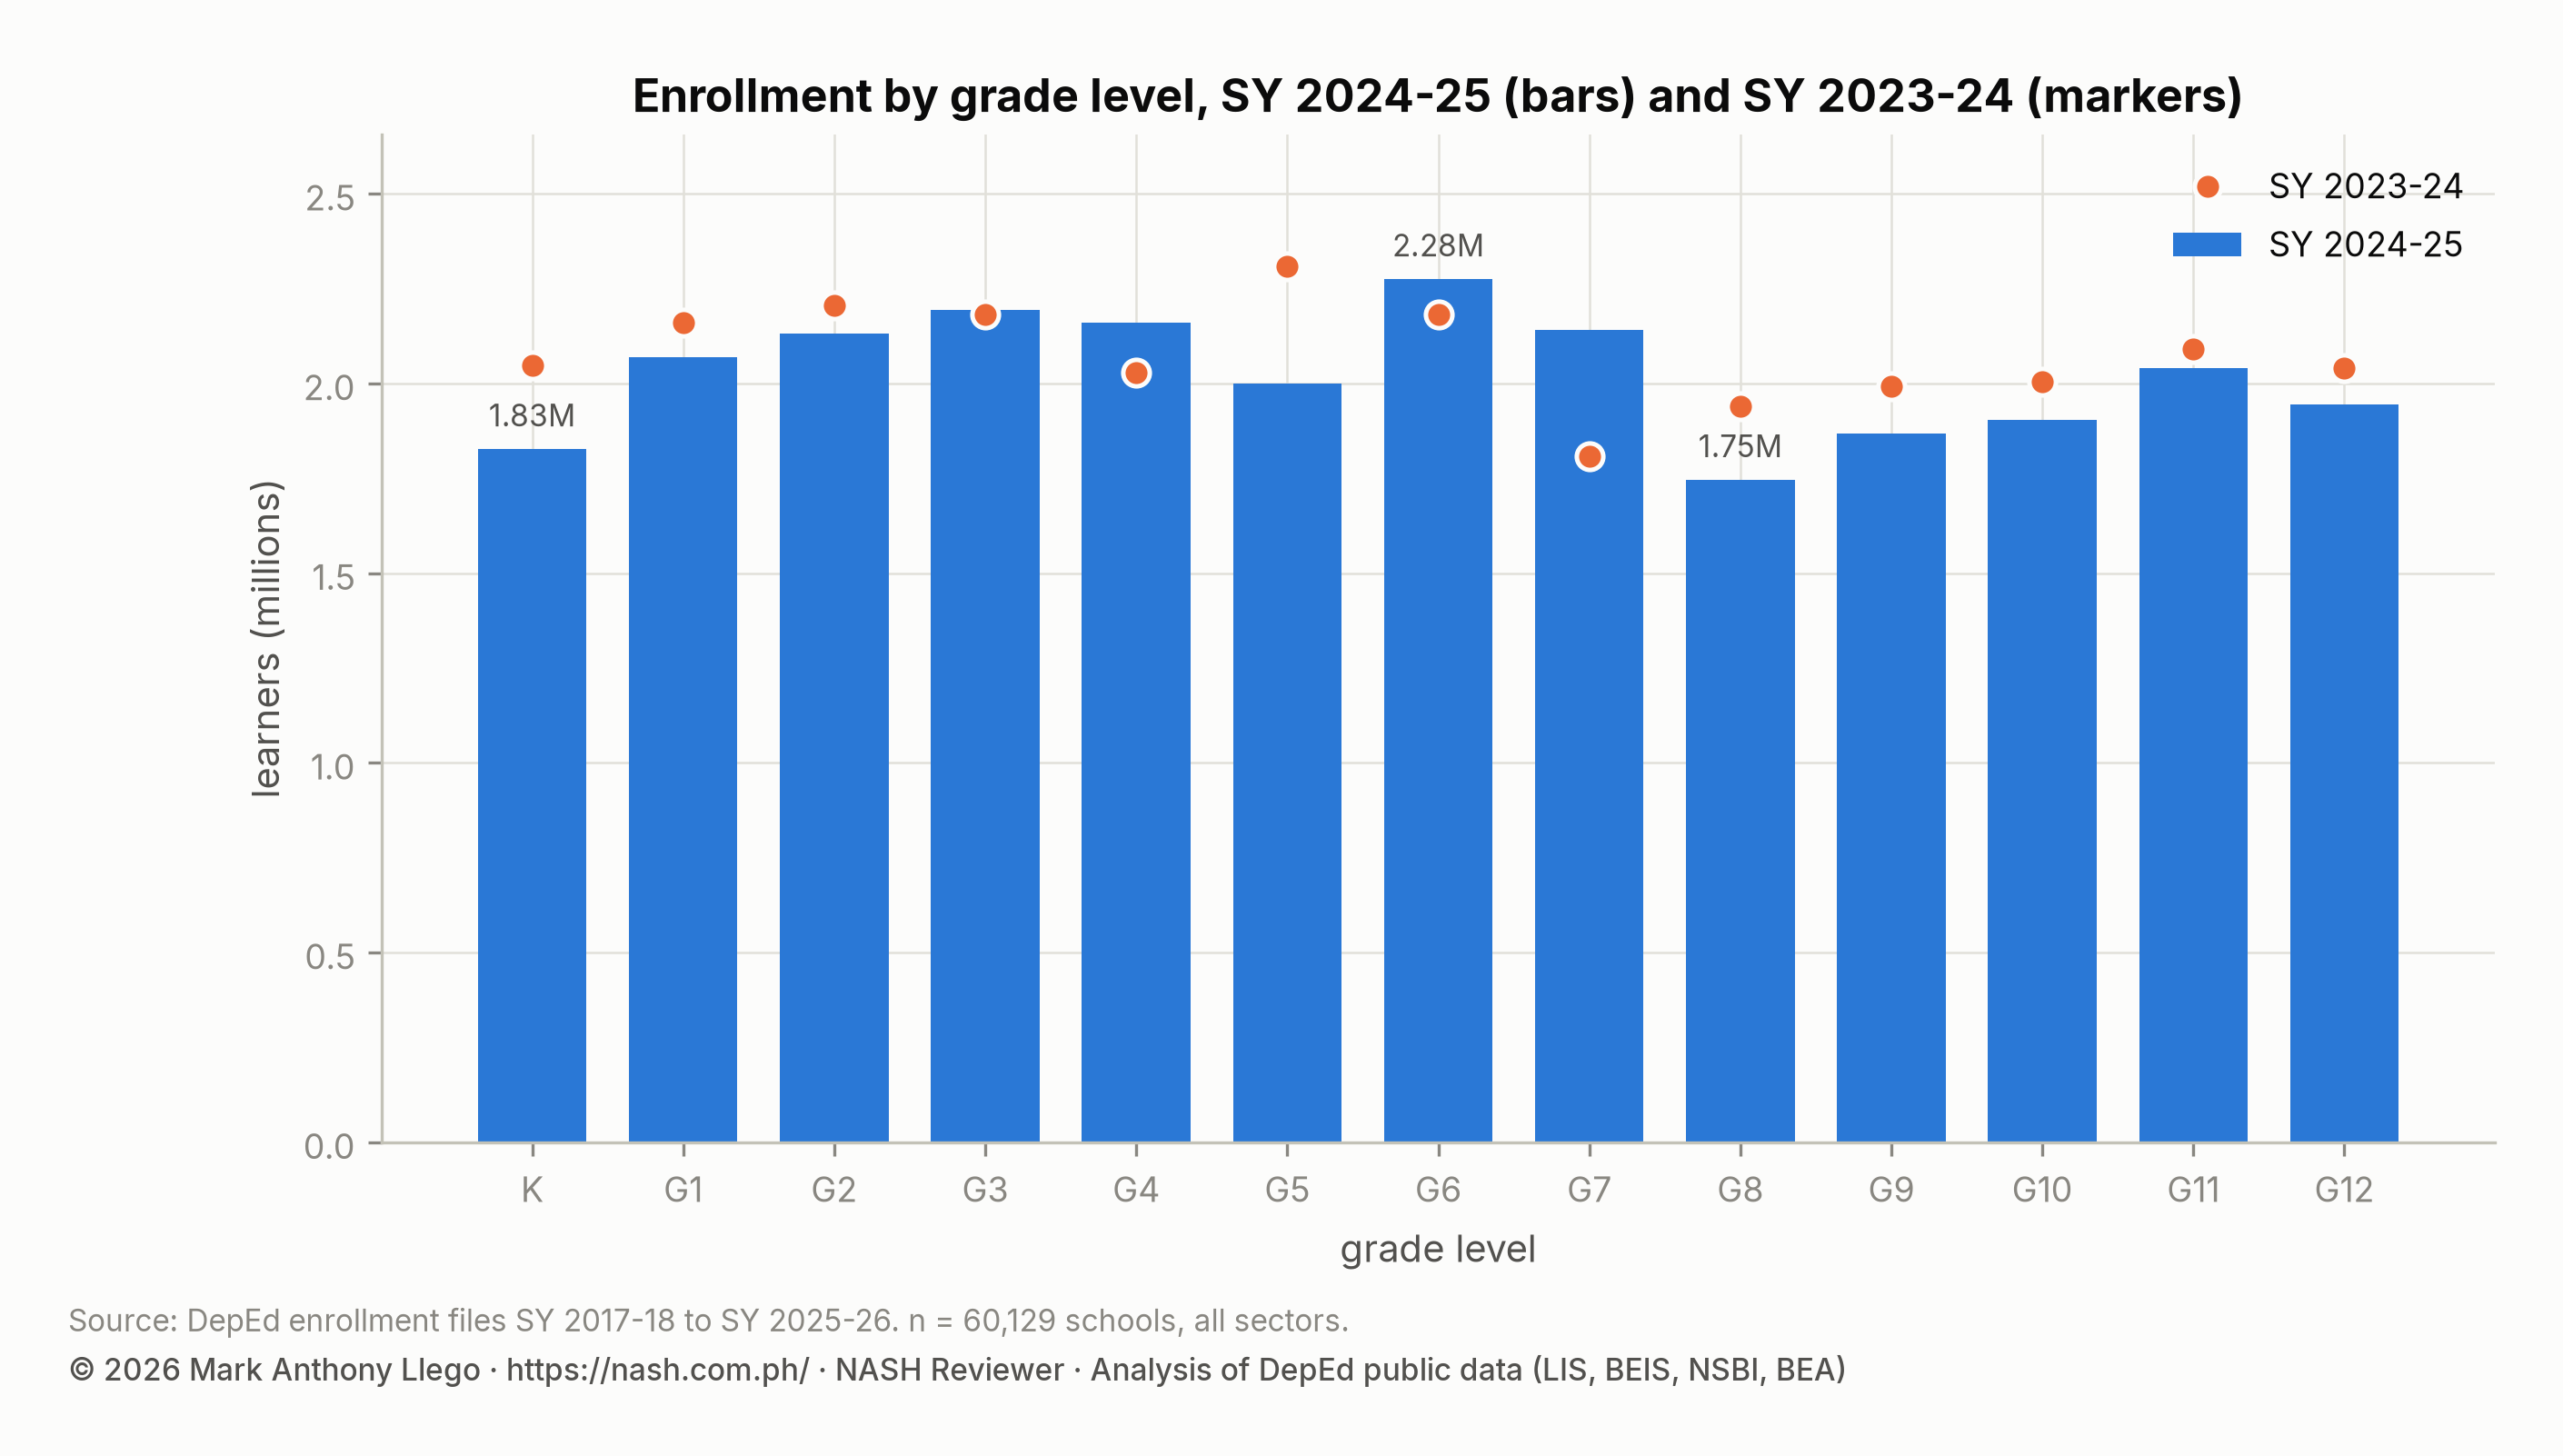
The grade table shows the three cohorts that the earlier reports in this series have been following, each one grade further on. The large cohort that entered Grade 1 in SY 2018-2019 reached Grade 7, which rose by 333,512 learners (+18.4%) to 2,141,724. The small cohort that entered Grade 1 in SY 2017-2018 had passed through Grade 7 the year before. It was now in Grade 8, which fell 10.0% to 1,746,152, the smallest grade in the system. The pandemic cohort, which entered Grade 1 in SY 2020-2021, was in Grade 5, which fell 13.4% to 2,000,886.
Beneath these cohort movements, every level fell. Elementary lost 453,187 learners (−3.0%), half of it the kindergarten drop, and junior high lost 83,659 (−1.1%). Senior high lost 144,264 (−3.5%). Grade 11 was down 2.3% and Grade 12 down 4.7%. The flow from Grade 10 to Grade 11 was slightly above one, at 1.018. Senior high’s loss therefore came from the smaller Grade 10 class behind it, not from learners leaving at the transition. Grade 12 held 0.930 of the previous year’s Grade 11, the weakest Grade 11 to Grade 12 flow since the pandemic year.
Enrollment by region: only BARMM grew
| Region (SY 2025-26 boundaries) | Schools | Learners | Share of learners | SY 2023-24 | Change | Change (%) | Private share | Senior high share | Female share |
|---|---|---|---|---|---|---|---|---|---|
| Region IV-A | 6,011 | 3,871,761 | 14.7% | 3,951,663 | -79,902 | -2.0% | 19.9% | 14.8% | 48.7% |
| Region III | 5,193 | 2,908,517 | 11.0% | 2,966,748 | -58,231 | -2.0% | 16.8% | 15.5% | 48.8% |
| NCR | 2,541 | 2,763,471 | 10.5% | 2,834,118 | -70,647 | -2.5% | 26.2% | 17.4% | 49.0% |
| Region V | 4,481 | 1,672,003 | 6.3% | 1,733,251 | -61,248 | -3.5% | 8.8% | 14.7% | 48.6% |
| Region VII | 3,589 | 1,660,969 | 6.3% | 1,712,480 | -51,511 | -3.0% | 15.2% | 15.9% | 48.5% |
| Region XI | 2,706 | 1,345,342 | 5.1% | 1,384,153 | -38,811 | -2.8% | 11.8% | 15.0% | 49.1% |
| Region X | 3,109 | 1,303,187 | 4.9% | 1,330,705 | -27,518 | -2.1% | 12.3% | 14.2% | 49.2% |
| NIR | 2,732 | 1,216,279 | 4.6% | 1,254,413 | -38,134 | -3.0% | 9.5% | 15.0% | 48.9% |
| Region I | 3,391 | 1,198,291 | 4.5% | 1,244,604 | -46,313 | -3.7% | 11.3% | 16.6% | 48.5% |
| Region IX | 3,355 | 1,183,411 | 4.5% | 1,210,424 | -27,013 | -2.2% | 7.7% | 13.3% | 49.7% |
| Region VIII | 4,480 | 1,175,013 | 4.5% | 1,219,378 | -44,365 | -3.6% | 6.1% | 14.5% | 48.8% |
| Region XII | 2,551 | 1,150,229 | 4.4% | 1,178,506 | -28,277 | -2.4% | 9.9% | 14.6% | 49.4% |
| Region VI | 3,442 | 1,104,607 | 4.2% | 1,152,498 | -47,891 | -4.2% | 9.6% | 16.4% | 48.3% |
| BARMM | 2,473 | 922,116 | 3.5% | 899,130 | +22,986 | +2.6% | 13.6% | 10.2% | 51.4% |
| Region II | 2,908 | 867,339 | 3.3% | 899,159 | -31,820 | -3.5% | 10.2% | 15.5% | 48.8% |
| MIMAROPA | 2,695 | 864,342 | 3.3% | 887,334 | -22,992 | -2.6% | 7.6% | 14.0% | 49.0% |
| CARAGA | 2,361 | 750,780 | 2.8% | 767,014 | -16,234 | -2.1% | 8.5% | 14.2% | 49.0% |
| CAR | 2,076 | 417,670 | 1.6% | 432,266 | -14,596 | -3.4% | 16.6% | 16.1% | 48.9% |
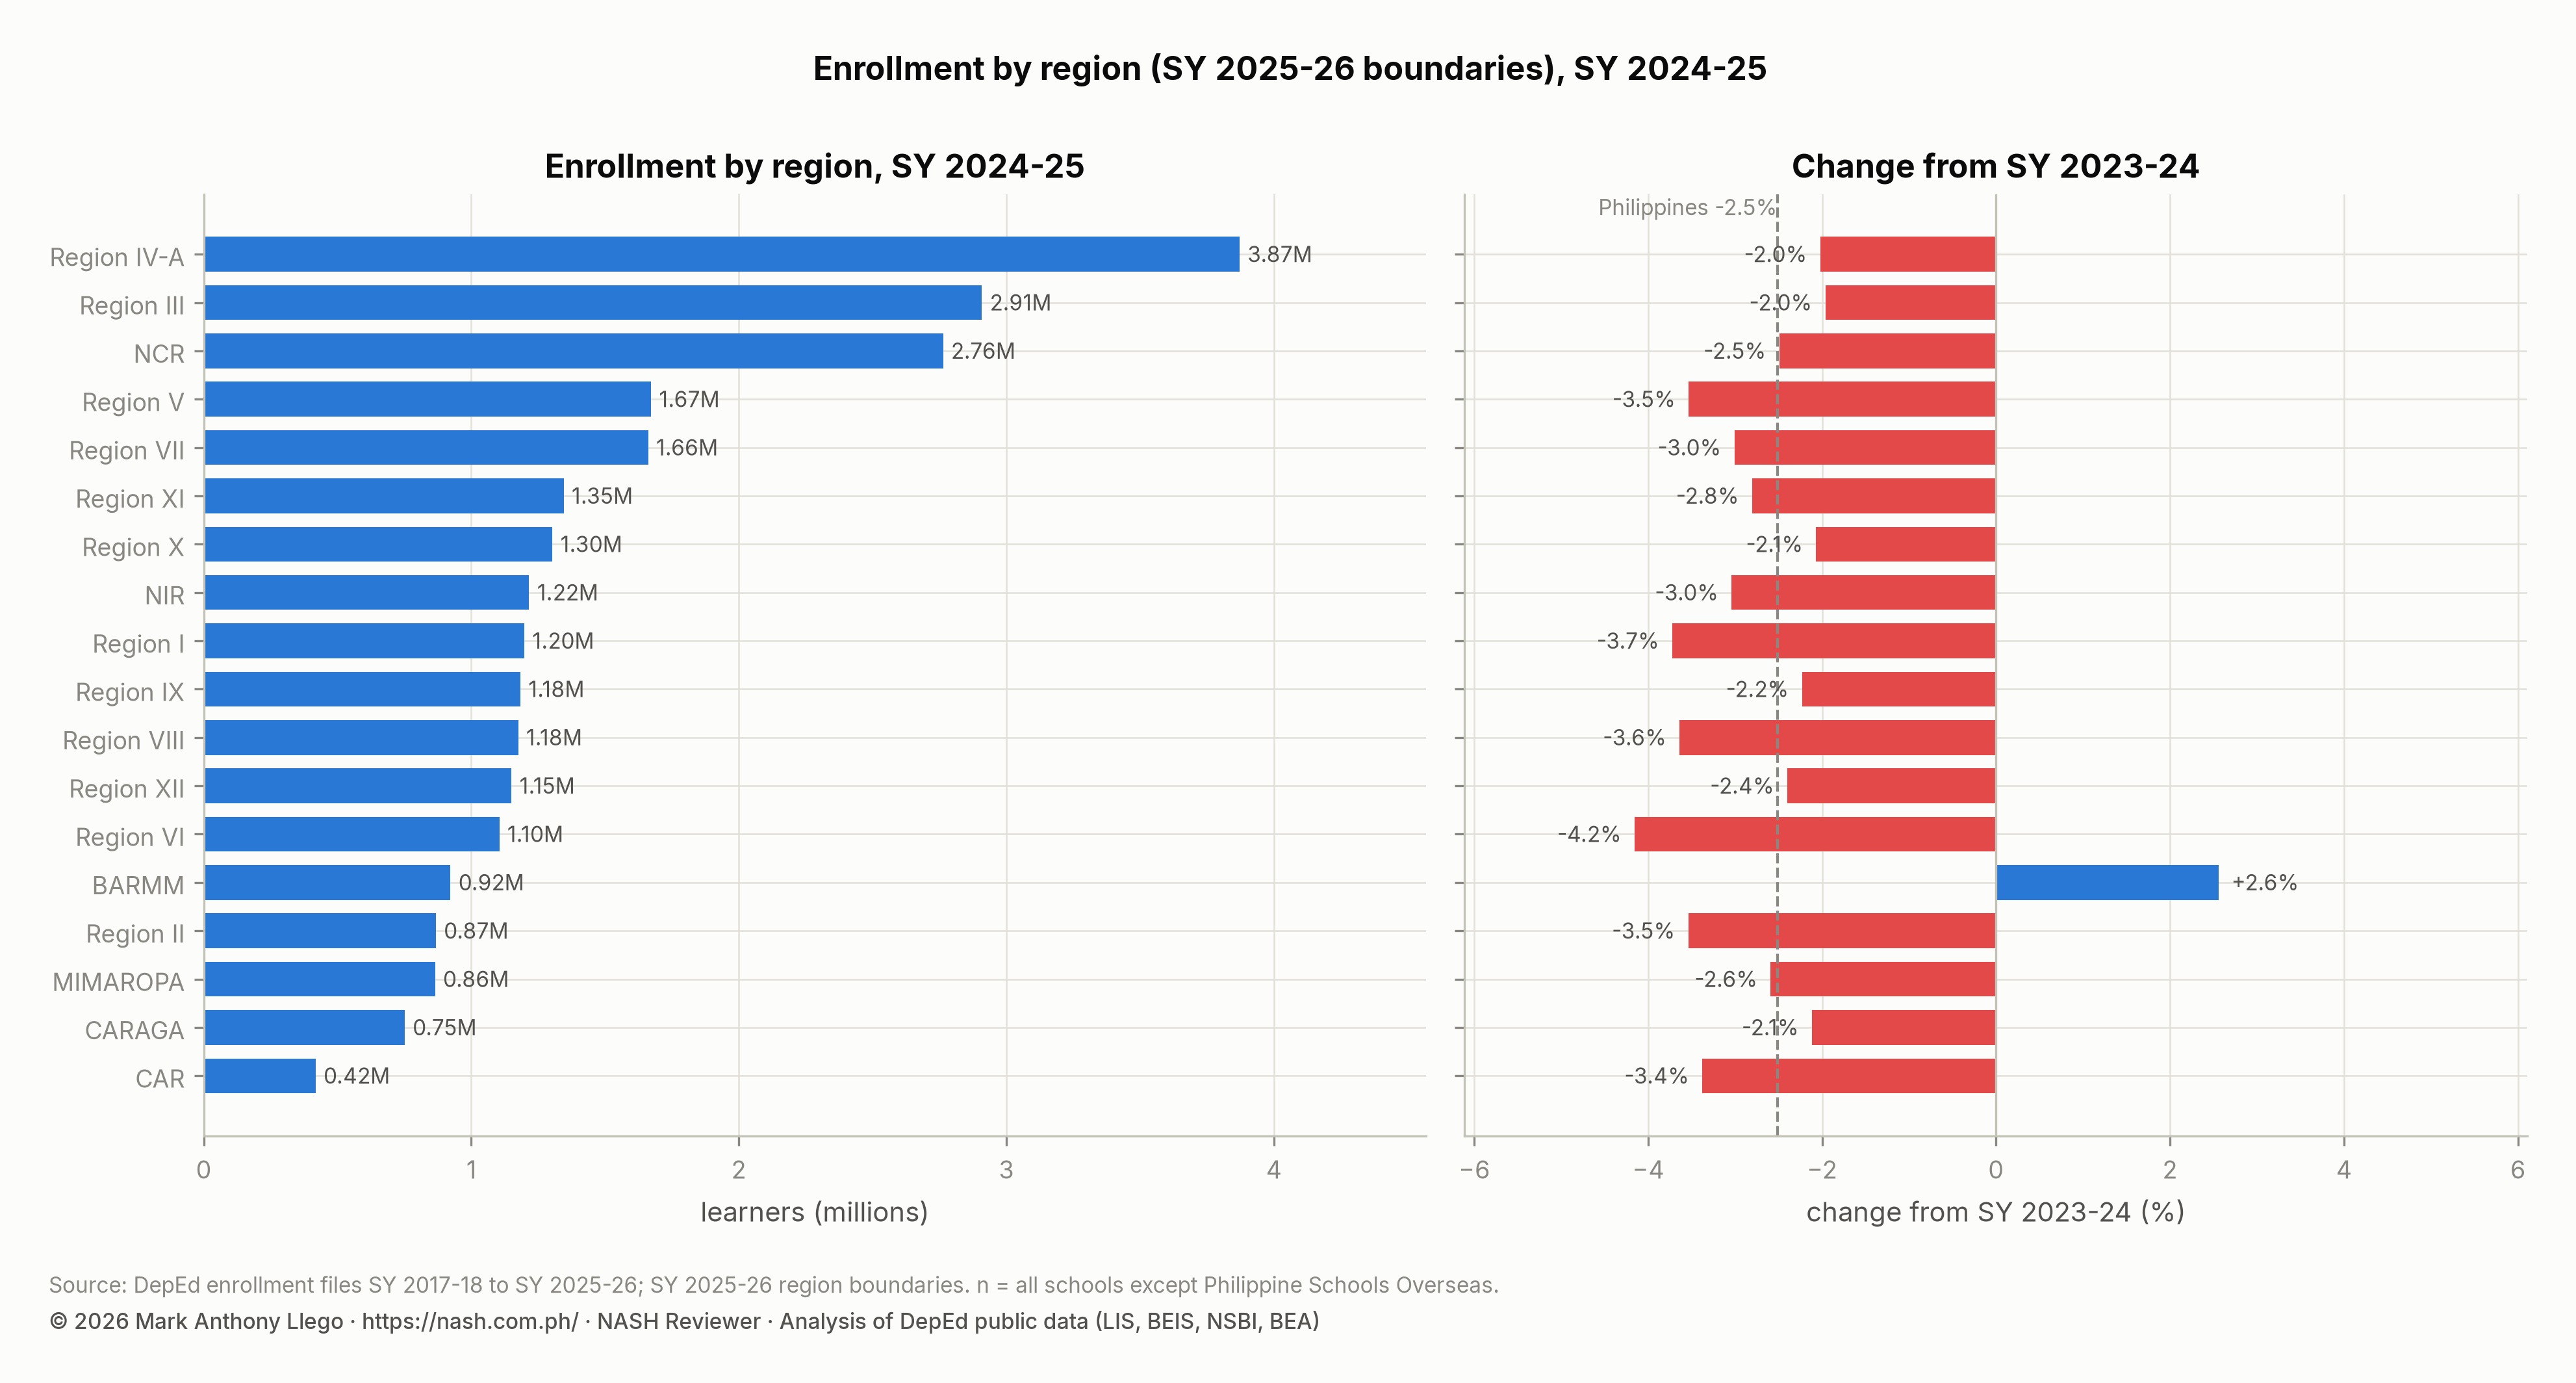
BARMM grew 2.6%, adding 22,986 learners, and was the only region to grow. Four of the five fastest-growing divisions in the country were in BARMM: Maguindanao I (+10.0%, 16,159 learners), Marawi City, Lanao del Sur - II and Tawi-Tawi. The other 17 regions fell by between 2.0% (Region III and Region IV-A) and 4.2% (Region VI). Region IV-A lost the most learners, 79,902. NCR lost 70,647 (−2.5%) and fell below 2.8 million for the first time. Region I (−3.7%), Region VIII (−3.6%), Region II and Region V (−3.5%) continued the decline that the earlier reports trace.
| Division | Region | Schools | Learners, SY 2024-25 | Learners, SY 2023-24 | Change | Change (%) | |
|---|---|---|---|---|---|---|---|
| Fastest growth | Maguindanao I | BARMM | 380 | 178,228 | 162,069 | +16,159 | +10.0% |
| Fastest growth | Marawi City | BARMM | 101 | 55,505 | 54,065 | +1,440 | +2.7% |
| Fastest growth | Lanao del Sur - II | BARMM | 421 | 117,660 | 114,797 | +2,863 | +2.5% |
| Fastest growth | Tawi-Tawi | BARMM | 306 | 94,671 | 92,604 | +2,067 | +2.2% |
| Fastest growth | Bayawan City | NIR | 107 | 43,785 | 42,937 | +848 | +2.0% |
| Steepest decline | Davao Occidental | Region XI | 228 | 76,130 | 80,323 | -4,193 | -5.2% |
| Steepest decline | Navotas | NCR | 37 | 49,638 | 52,318 | -2,680 | -5.1% |
| Steepest decline | Vigan City | Region I | 34 | 16,610 | 17,467 | -857 | -4.9% |
| Steepest decline | Masbate | Region V | 759 | 227,318 | 238,390 | -11,072 | -4.6% |
| Steepest decline | Nueva Vizcaya | Region II | 434 | 118,128 | 123,840 | -5,712 | -4.6% |
The steepest real declines were spread across the country: Davao Occidental (−5.2%), Navotas (−5.1%), Vigan City (−4.9%), Masbate (−4.6%) and Nueva Vizcaya (−4.6%). Masbate had the largest loss of learners, 11,072. One division is new: the City of Baliwag, with 41,215 learners, separated from Bulacan. Bulacan’s enrollment fell 8.0% as a result, and it dropped from third to fourth among the largest divisions, behind Rizal.
Public and private school enrollment: public shrinks, private holds steady
| Sector | Schools | Learners | Share of learners | Kindergarten | Elementary (K to 6) | Junior high | Senior high | Schools, SY 2023-24 | Learners, SY 2023-24 | Change (%) |
|---|---|---|---|---|---|---|---|---|---|---|
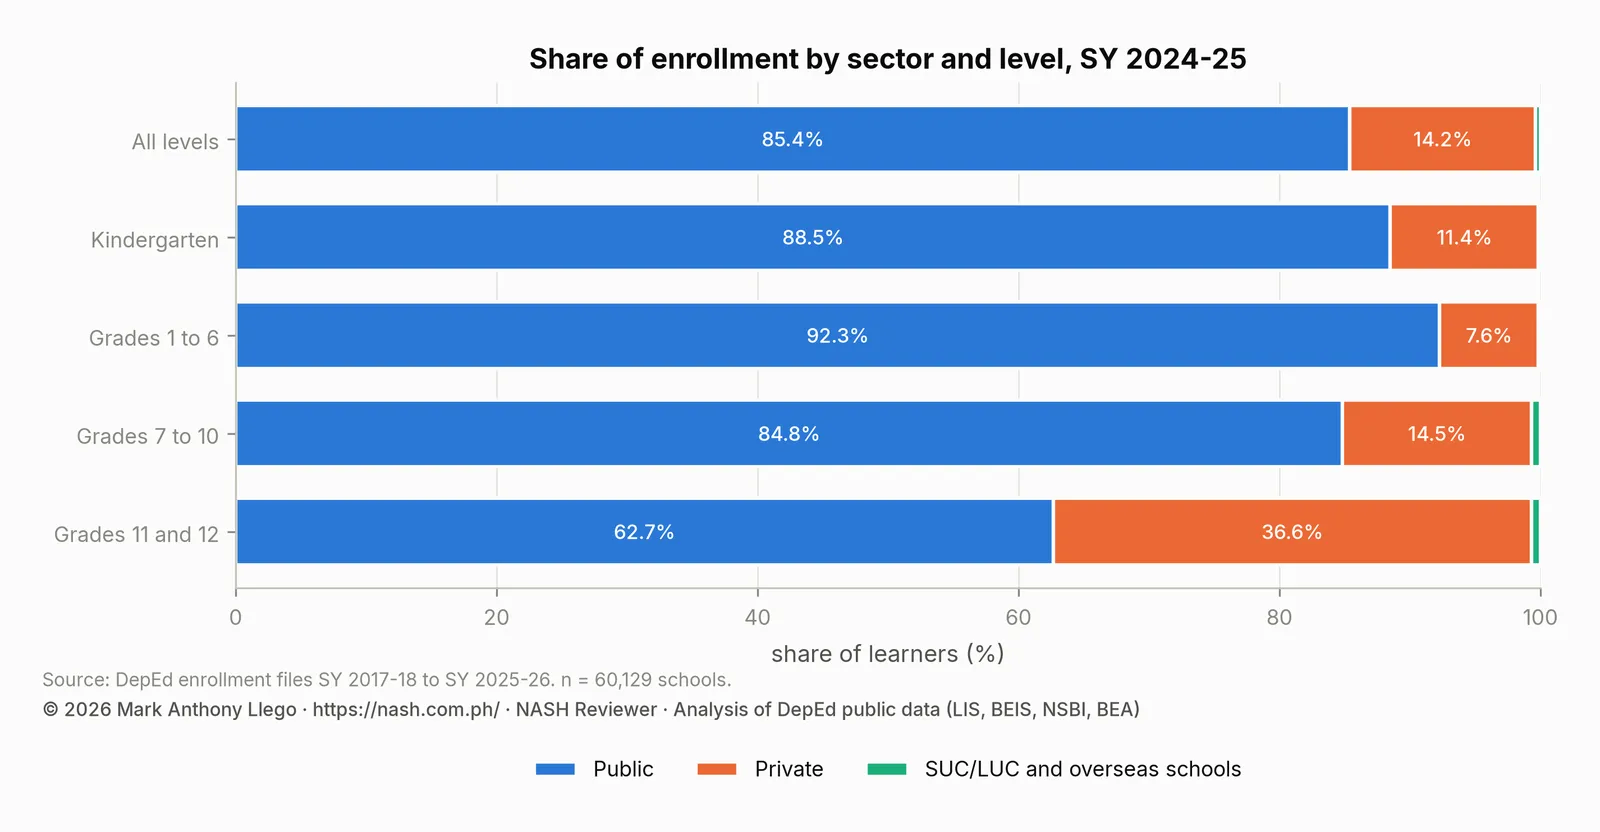
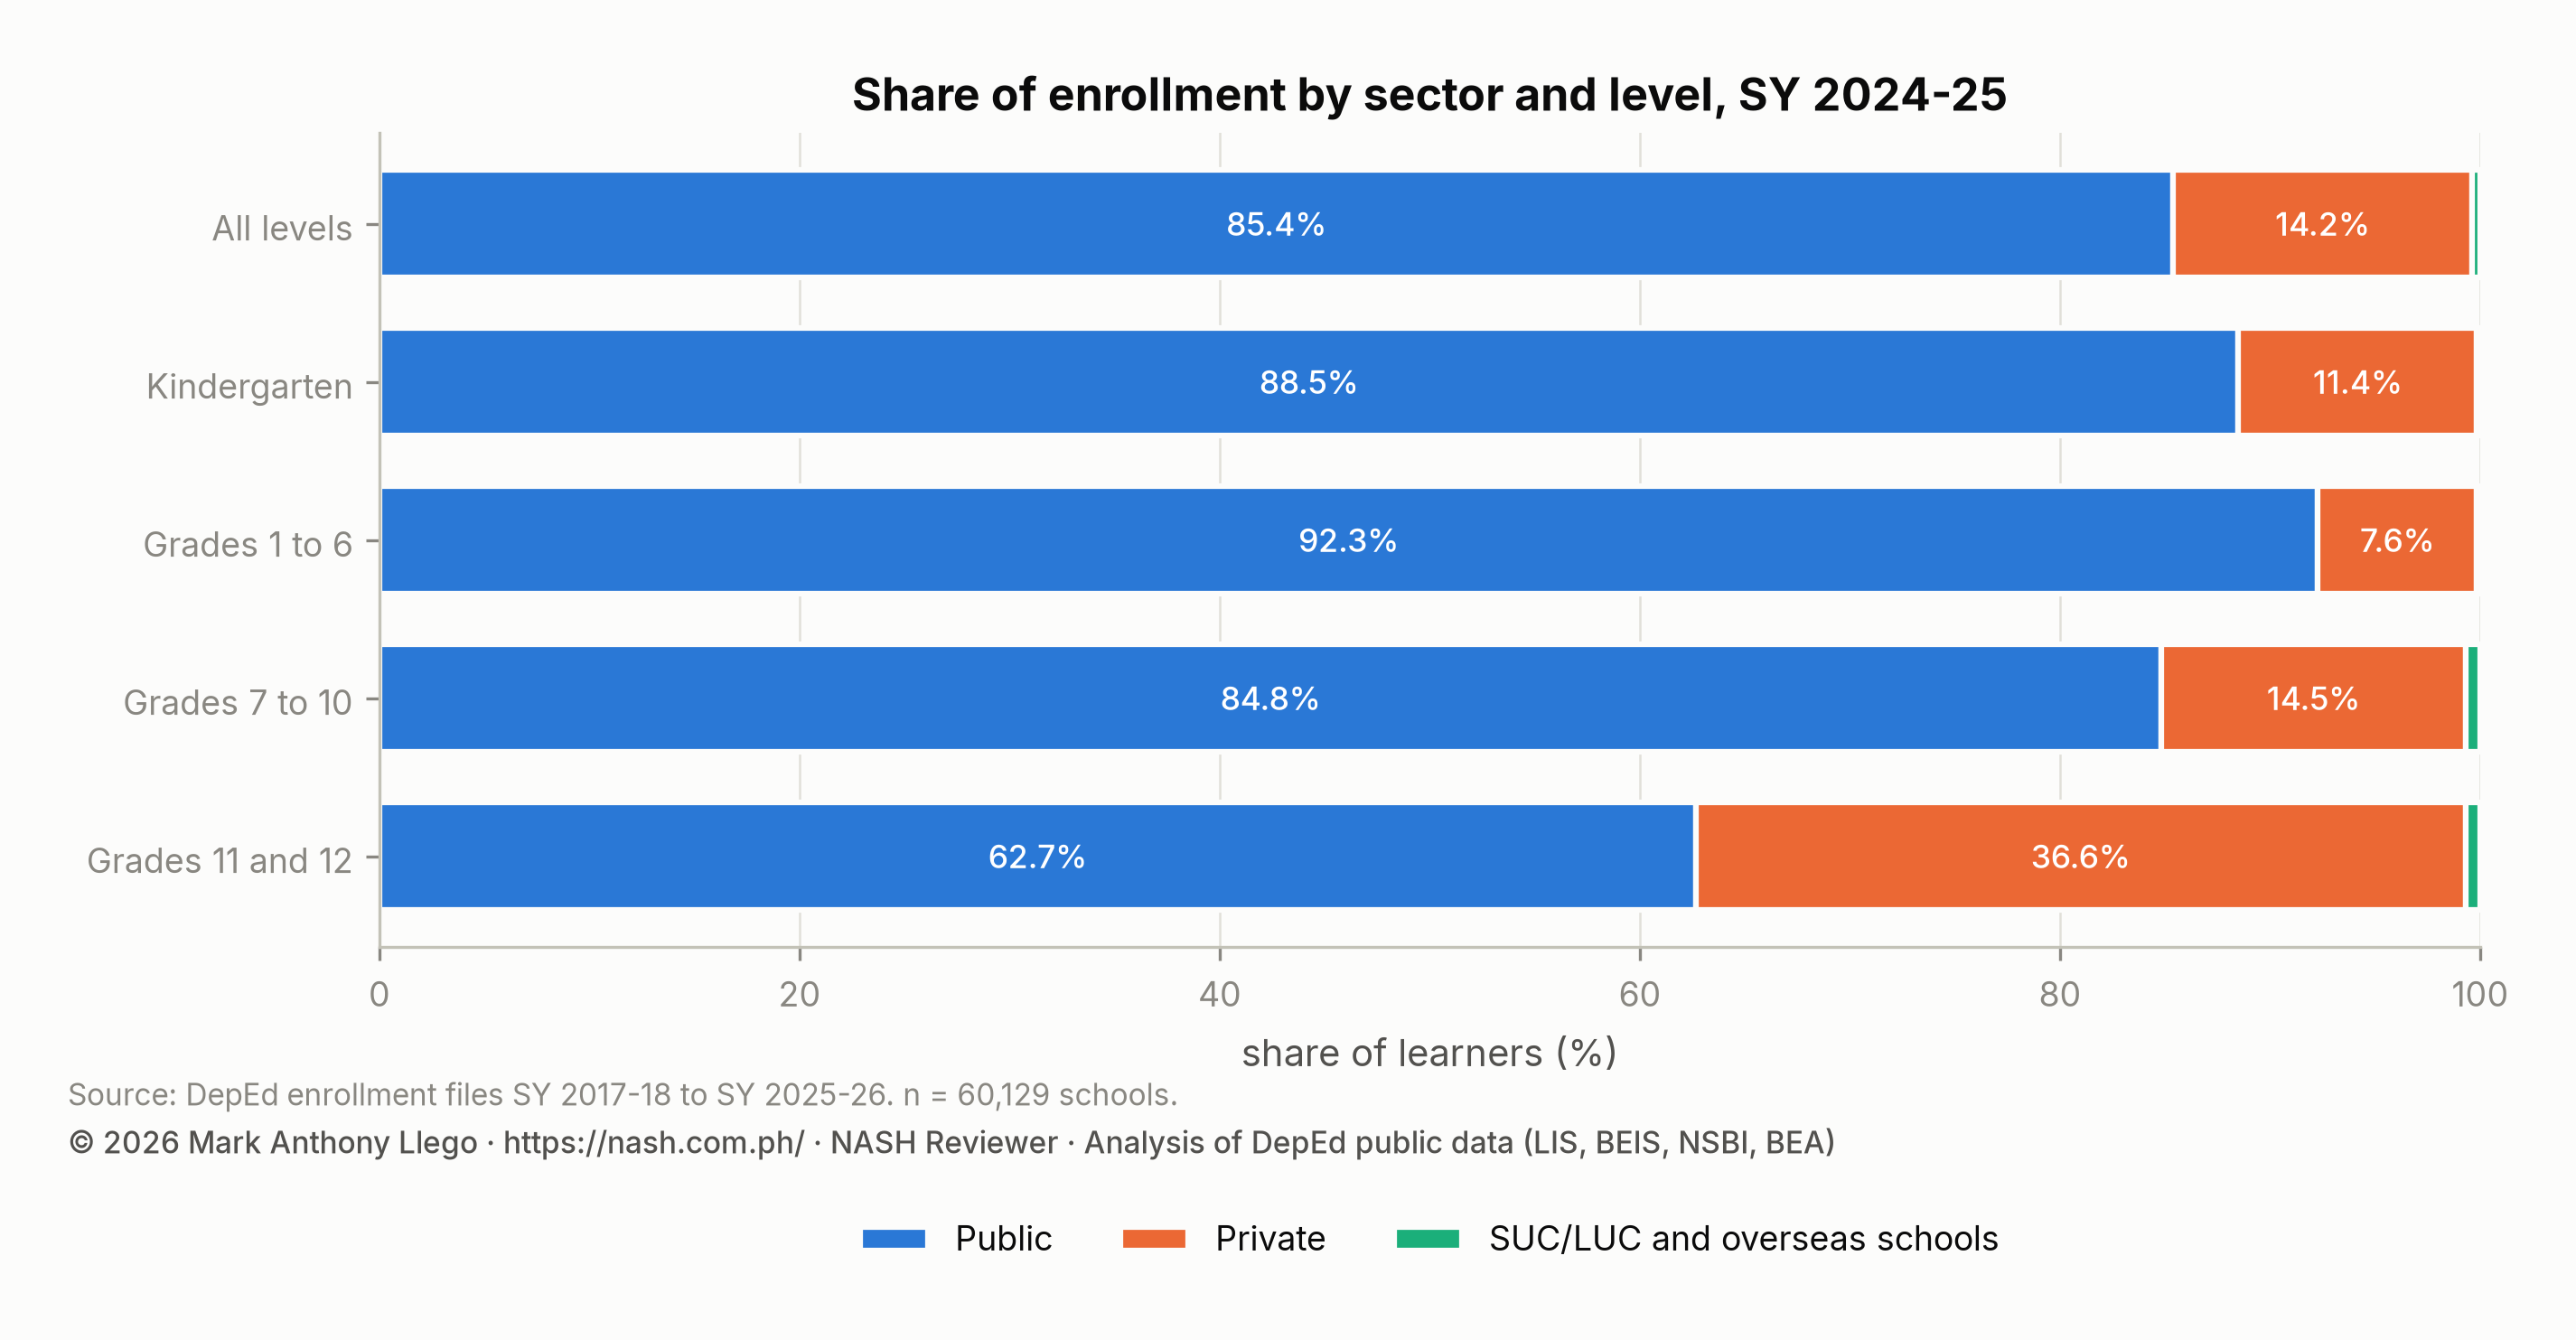
| Public | 47,972 | 22,543,711 | 85.4% | 1,616,979 | 13,543,439 | 6,502,794 | 2,497,478 | 47,818 | 23,225,427 | -2.9% |
| Private | 11,939 | 3,750,251 | 14.2% | 207,480 | 1,181,078 | 1,108,853 | 1,460,320 | 12,113 | 3,731,936 | +0.5% |
| SUC/LUC laboratory schools | 183 | 81,365 | 0.3% | 966 | 9,677 | 46,269 | 25,419 | 203 | 100,481 | -19.0% |
| Philippine Schools Overseas | 35 | 24,855 | 0.1% | 1,833 | 14,570 | 7,690 | 2,595 | 33 | 23,448 | +6.0% |
Public enrollment fell by 681,716 (−2.9%) to 22,543,711. Private enrollment rose by 18,315 (+0.5%) to 3,750,251, in 11,939 schools. The whole of the national decline was in public schools. The private share of all learners rose to 14.2%, and the private share of kindergarten rose to 11.4%, close to its pre-pandemic 12.3%. The laboratory schools of state and local universities and colleges (SUC/LUC) lost 19.0% of their enrollment in one year and were down to 81,365 learners in 183 schools.
The median public school had 224 learners, down from 232 the year before and 239 in SY 2017-2018. The median private school had 120, its largest since the series began. Public schools were getting smaller and private schools larger. The number of schools with 51 to 100 learners rose to 8,378. The 2,219 schools with more than 2,000 learners held 29.1% of all learners. At the peak two years earlier, that share had been 31.0%.
| Learners per school | Schools | Share of schools | Learners | Share of learners | Public schools | Share of public schools | Private schools | Share of private schools |
|---|---|---|---|---|---|---|---|---|
| 1–50 | 6,172 | 10.3% | 173,010 | 0.7% | 2,809 | 5.9% | 3,343 | 28.0% |
| 51–100 | 8,378 | 13.9% | 635,385 | 2.4% | 6,305 | 13.1% | 2,063 | 17.3% |
| 101–200 | 14,902 | 24.8% | 2,179,926 | 8.3% | 12,674 | 26.4% | 2,194 | 18.4% |
| 201–500 | 17,516 | 29.1% | 5,554,212 | 21.0% | 15,081 | 31.4% | 2,354 | 19.7% |
| 501–1,000 | 7,188 | 12.0% | 4,985,785 | 18.9% | 6,019 | 12.5% | 1,121 | 9.4% |
| 1,001–2,000 | 3,754 | 6.2% | 5,190,836 | 19.7% | 3,153 | 6.6% | 582 | 4.9% |
| over 2,000 | 2,219 | 3.7% | 7,681,028 | 29.1% | 1,931 | 4.0% | 282 | 2.4% |
Senior high school strands: GAS loses a fifth, STEM at its peak
| Track or strand | Learners | Share of senior high | SY 2023-24 | Change | Change (%) |
|---|---|---|---|---|---|
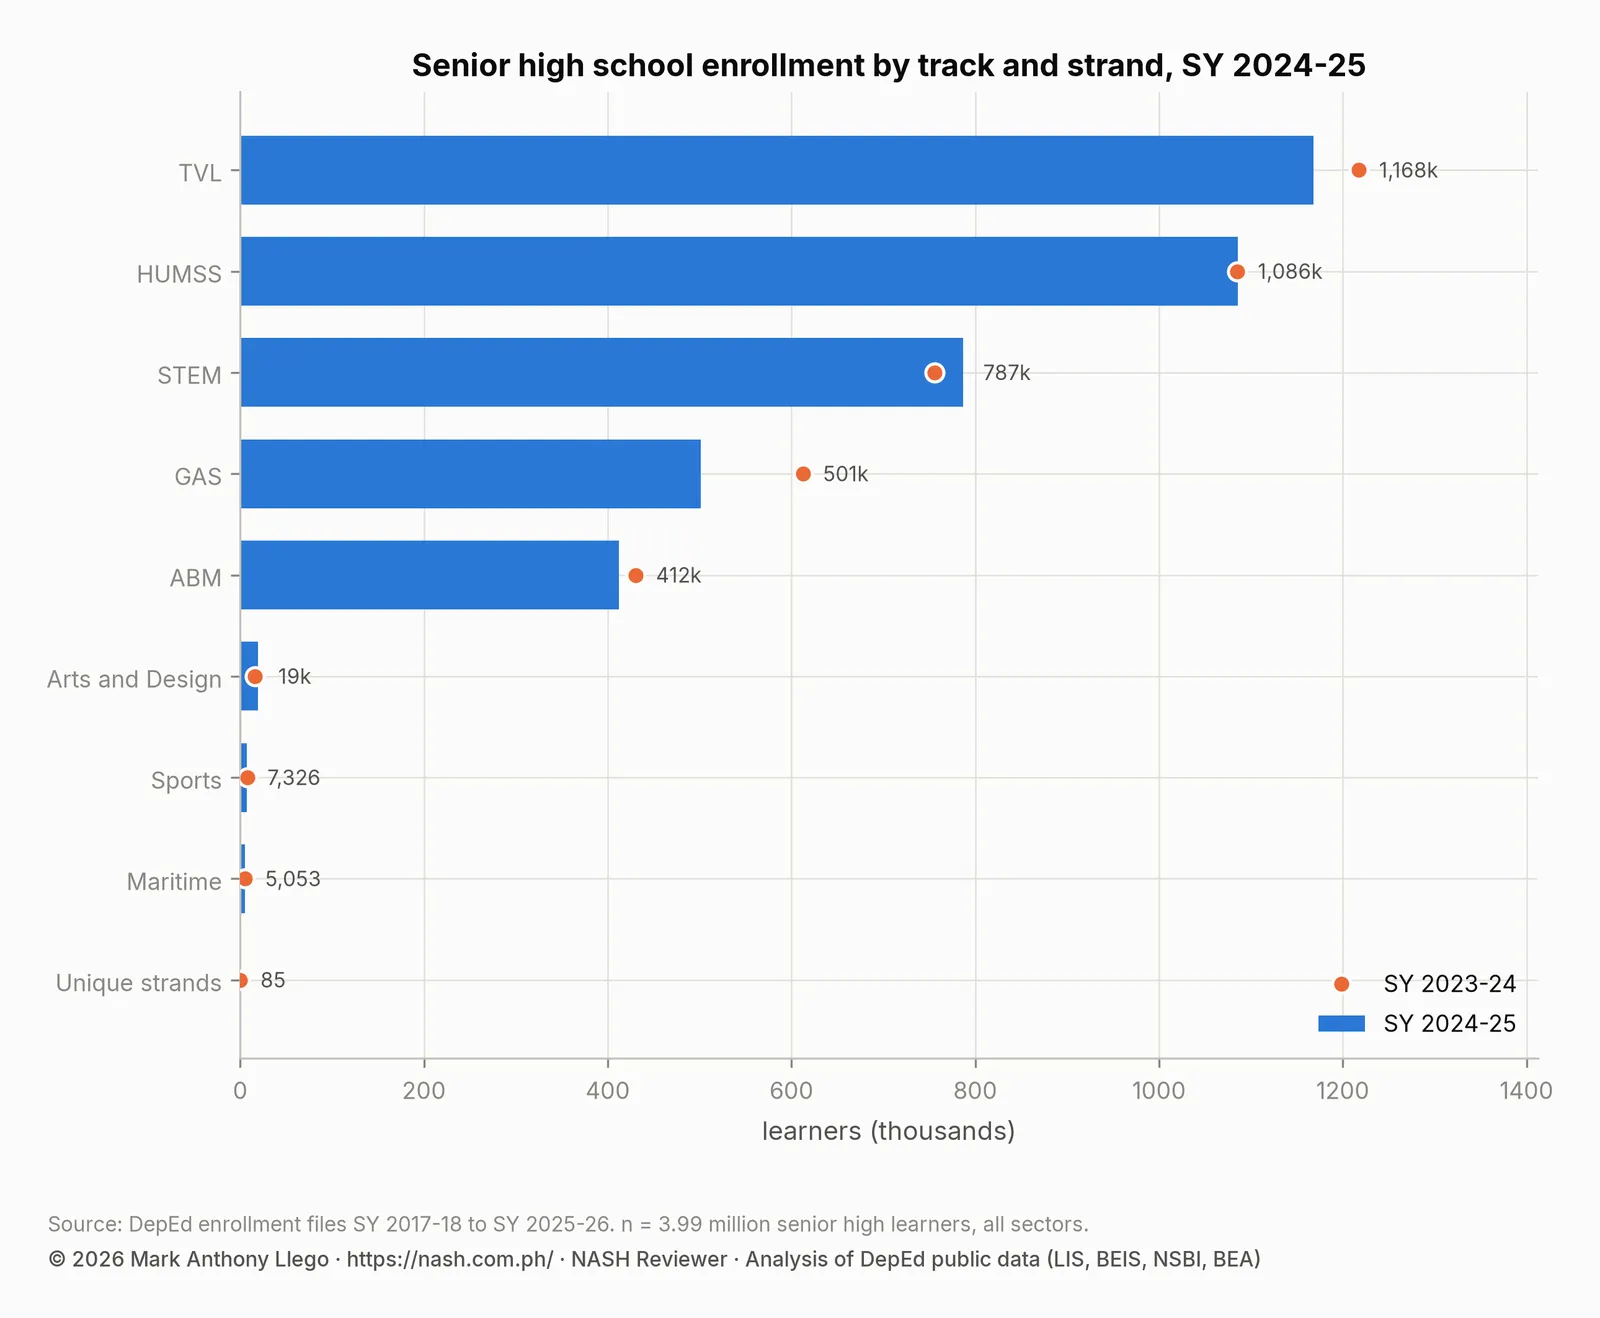
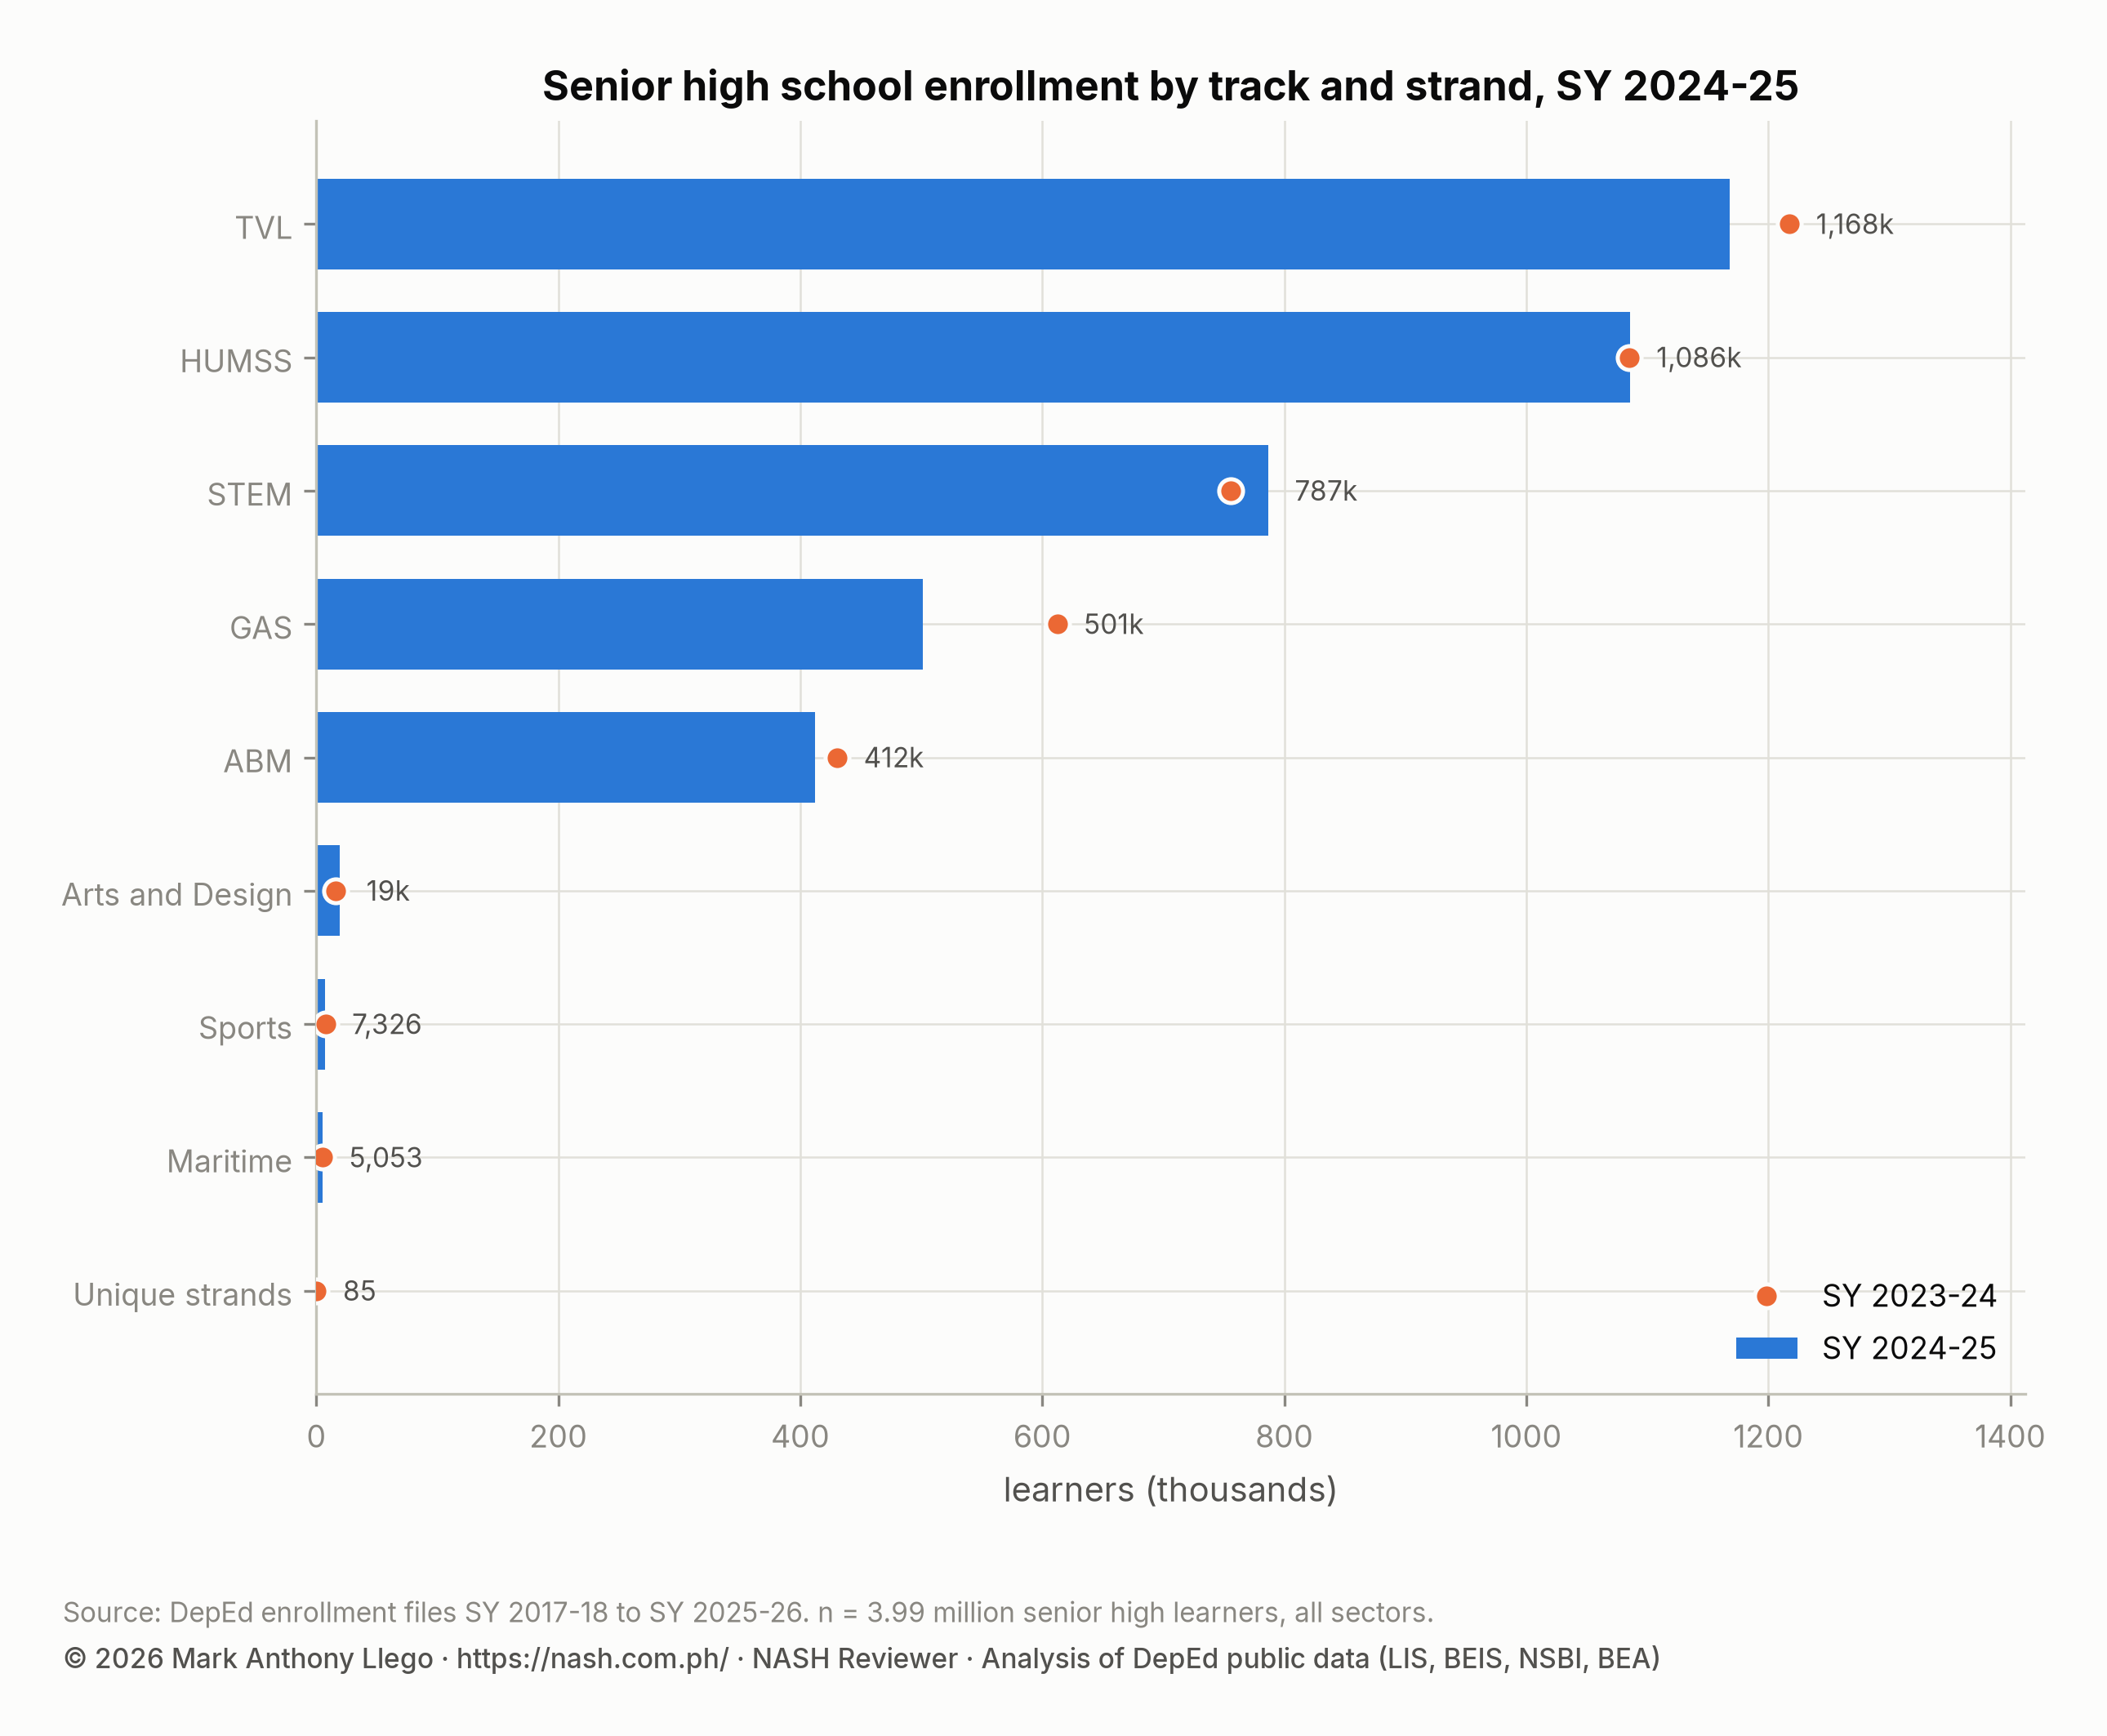
| TVL | 1,168,349 | 29.3% | 1,217,552 | -49,203 | -4.0% |
| HUMSS | 1,085,575 | 27.2% | 1,084,937 | +638 | +0.1% |
| STEM | 786,711 | 19.7% | 755,710 | +31,001 | +4.1% |
| GAS | 500,915 | 12.6% | 612,507 | -111,592 | -18.2% |
| ABM | 412,369 | 10.3% | 430,462 | -18,093 | -4.2% |
| Arts and Design | 19,429 | 0.5% | 16,030 | +3,399 | +21.2% |
| Sports | 7,326 | 0.2% | 7,555 | -229 | -3.0% |
| Maritime | 5,053 | 0.1% | 5,323 | -270 | -5.1% |
| Unique strands | 85 | 0.0% | 0 | +85 |
Senior high enrolled 3,985,812 learners, 15.1% of all learners. The General Academic Strand (GAS) lost 111,592 learners (−18.2%) and, at 500,915, was now smaller than Science, Technology, Engineering and Mathematics (STEM). STEM grew 4.1% to 786,711, its highest count in the series. Technical-Vocational-Livelihood (TVL) fell 4.0% to 1,168,349, and Humanities and Social Sciences (HUMSS) was almost unchanged at 1,085,575. The gap between the two largest tracks narrowed to 82,774 learners. Accountancy, Business and Management (ABM) fell 4.2%. This is the last file in which the five established strands account for all of senior high. The next file introduces the Strengthened Senior High School tracks, so its strand shares cannot be compared with these.
Changes in the SY 2024-2025 file: NIR, no blank cells, new schools
Republic Act No. 12000, signed in June 2024, created the Negros Island Region (NIR), and this is the first enrollment file to list NIR as a region. Its 21 divisions are counted under NIR in every earlier year here, so nothing changes in these tables. The file is also the only one in the series with no blank grade cells. Every grade a school does not offer is written as a zero, where earlier files left blanks and the SY 2025-2026 file returned to them. For the first time, the file carries columns for unique strands in Grades 11 and 12, with 85 learners. Only 24 schools report zero learners, the fewest of any year. New this year were 358 public and 230 private schools. Another 169 public and 295 private schools in this file are absent from the next.
| Sector | Schools in the file | Schools new in SY 2024-25 | Learners in new schools | Schools absent from SY 2025-26 | Their learners in this year |
|---|---|---|---|---|---|
| Public | 47,972 | 358 | 95,370 | 169 | 57,284 |
| Private | 11,939 | 230 | 14,274 | 295 | 18,709 |
| SUC/LUC laboratory schools | 183 | 2 | 140 | 12 | 1,164 |
| Philippine Schools Overseas | 35 | 2 | 108 | 0 | 0 |
Notes on reading the SY 2024-2025 file
- Sulu’s 478 schools are listed under BARMM in this file and counted under Region IX here, as in every year. It is the last file to list Sulu under BARMM.
- Bulacan is left out of the division ranking because the City of Baliwag was separated from it this year.
- The MATATAG curriculum applied to kindergarten and Grades 1, 4 and 7 in this year. The enrollment file does not record which curriculum a learner follows.
- Enrollment is a beginning-of-year count from the Learner Information System (LIS). It cannot show dropouts during the year or completers.
Frequently asked questions
How small was the DepEd kindergarten class in SY 2024-2025?
The SY 2024-2025 kindergarten class had 1,827,258 learners, the smallest of the nine years in DepEd’s open data. It was 10.8% below the previous year and 24% below the SY 2018-2019 peak of 2,409,782.
Which region grew in enrollment in SY 2024-2025?
Only BARMM grew, by 2.6%. Every other region fell, by between 2.0% and 4.2%.
Why did Grade 7 enrollment rise 18% in SY 2024-2025 while total enrollment fell?
Grade 7 rose because the large cohort that entered Grade 1 in SY 2018-2019, when Grade 1 jumped 22%, reached Grade 7. The next grade up, Grade 8, held the small SY 2017-2018 cohort and fell 10%.
Download the data
The cleaned, harmonized DepEd files behind this series are free to download in CSV and Parquet, with a codebook and checksums, under the terms of use set out in the release. Download Cleaned DepEd School Data, SY 2017-18 to 2025-26 documents every file and column. The files themselves are at data.nash.com.ph, starting with the README, the SY 2023-24 school master file (CSV, 8.0 MB) and the nine-year enrollment panel (Parquet, 17.2 MB).
More in this series
- Previous year: DepEd Enrollment SY 2023-2024: The Decline Begins
- Next year: DepEd Enrollment SY 2025-2026: Below the 2017 Level
- The nine-year overview: DepEd Enrollment Trends SY 2017-2018 to SY 2025-2026
- All nine annual reports: SY 2017-18, SY 2018-19, SY 2019-20, SY 2020-21, SY 2021-22, SY 2022-23, SY 2023-24, SY 2024-25, SY 2025-26
- DepEd Data for Aspiring School Heads: Where to Start
- For aspiring school heads: How to Read DepEd Data and the full report, Philippine basic education in numbers
Analysis and charts by Mark Anthony Llego for NASH Reviewer. Data: Department of Education enrollment datasets for SY 2023-24 and SY 2024-25 (Learner Information System). Charts may be reused only with written permission from support@nash.com.ph.