DepEd’s enrollment dataset for SY 2025-2026 is the first count in DepEd’s open data to fall below the level of SY 2017-2018, the first year of the series. Enrollment was 25,935,863 learners, 464,319 fewer than the year before (−1.8%) and 376,086 fewer than in SY 2017-2018. Classes opened on June 16, 2025, the first June opening since 2019. Public enrollment, 22,078,460, was also below its 2017 level. After nine years of growth, a pandemic drop, a rebound and a decline, the system was a little smaller than when the series started. It had 1.1 million more learners in senior high and 1.4 million fewer in elementary.
This is also the most unusual file in the series. It is the first to carry the Strengthened Senior High School tracks, which selected schools piloted this year. It is the first to list Sulu under Region IX, after the Supreme Court ruled in 2024 that the province is not part of BARMM. It is also the first since SY 2023-2024 to leave blanks where earlier files wrote zeros, and 46 schools reported nothing at all. For aspiring school heads, it was also the year DepEd first administered the National Assessment for School Heads (NASH), in September and December 2025.
Key findings
- Enrollment in SY 2025-2026 was 25,935,863 learners, 376,086 fewer than in SY 2017-2018. It fell by 464,319 (−1.8%) in the year, the third year of decline.
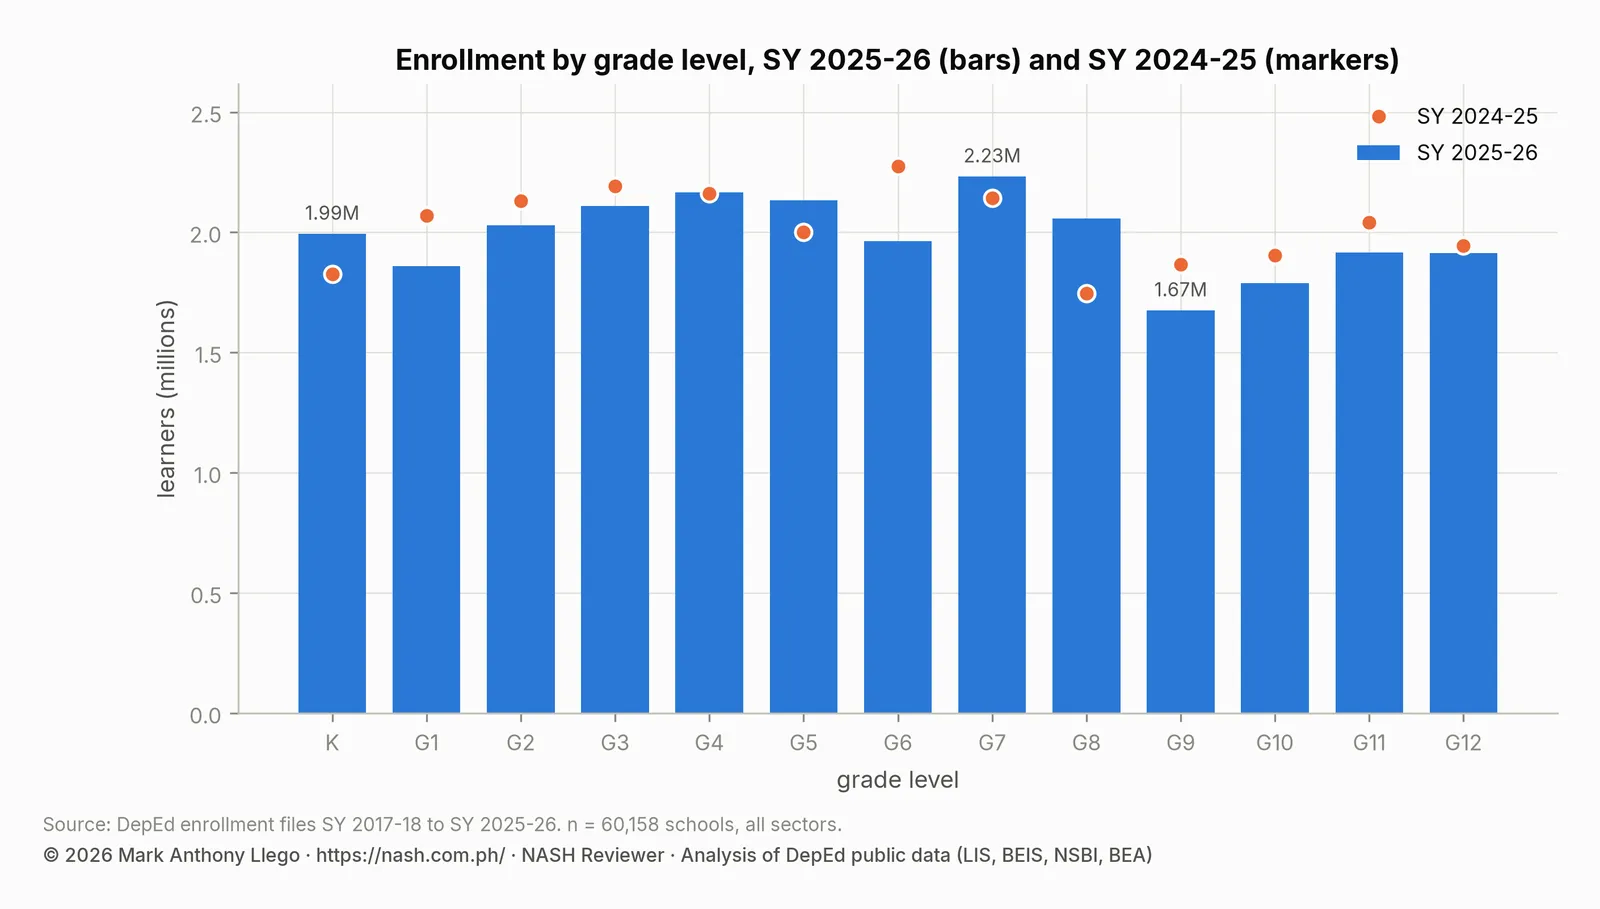
- Kindergarten rose 9.1% to 1,993,117, recovering most of the previous year’s fall. Grade 9, with 1,674,391 learners, was the smallest grade in the system.
- The Strengthened Senior High School pilot put 268,830 learners, 7.0% of senior high, in two new tracks. The shares of the five established strands are not comparable with earlier years.
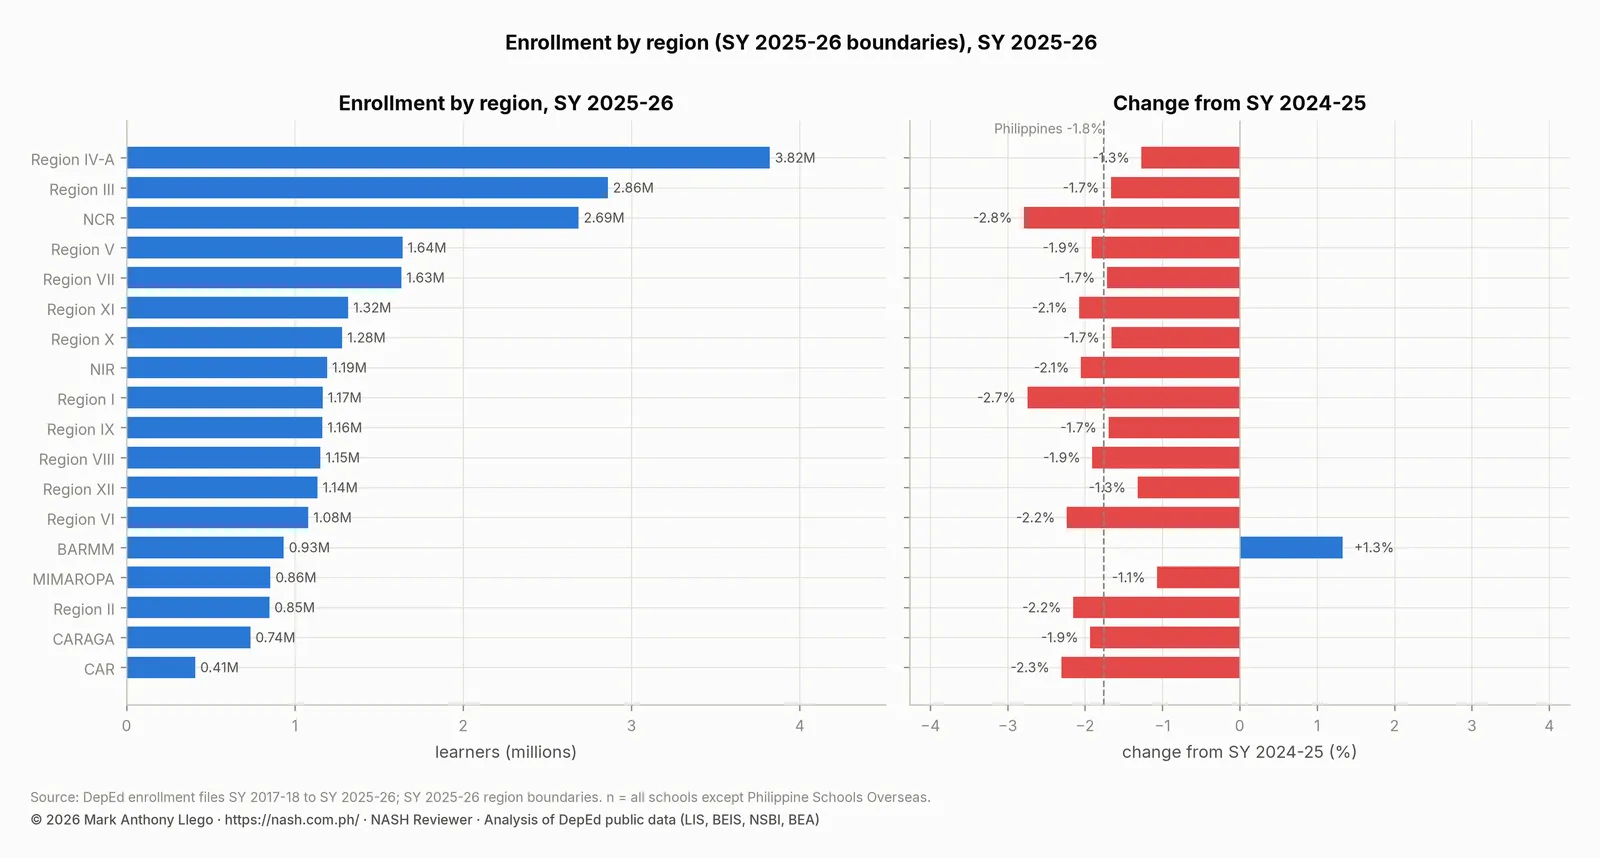
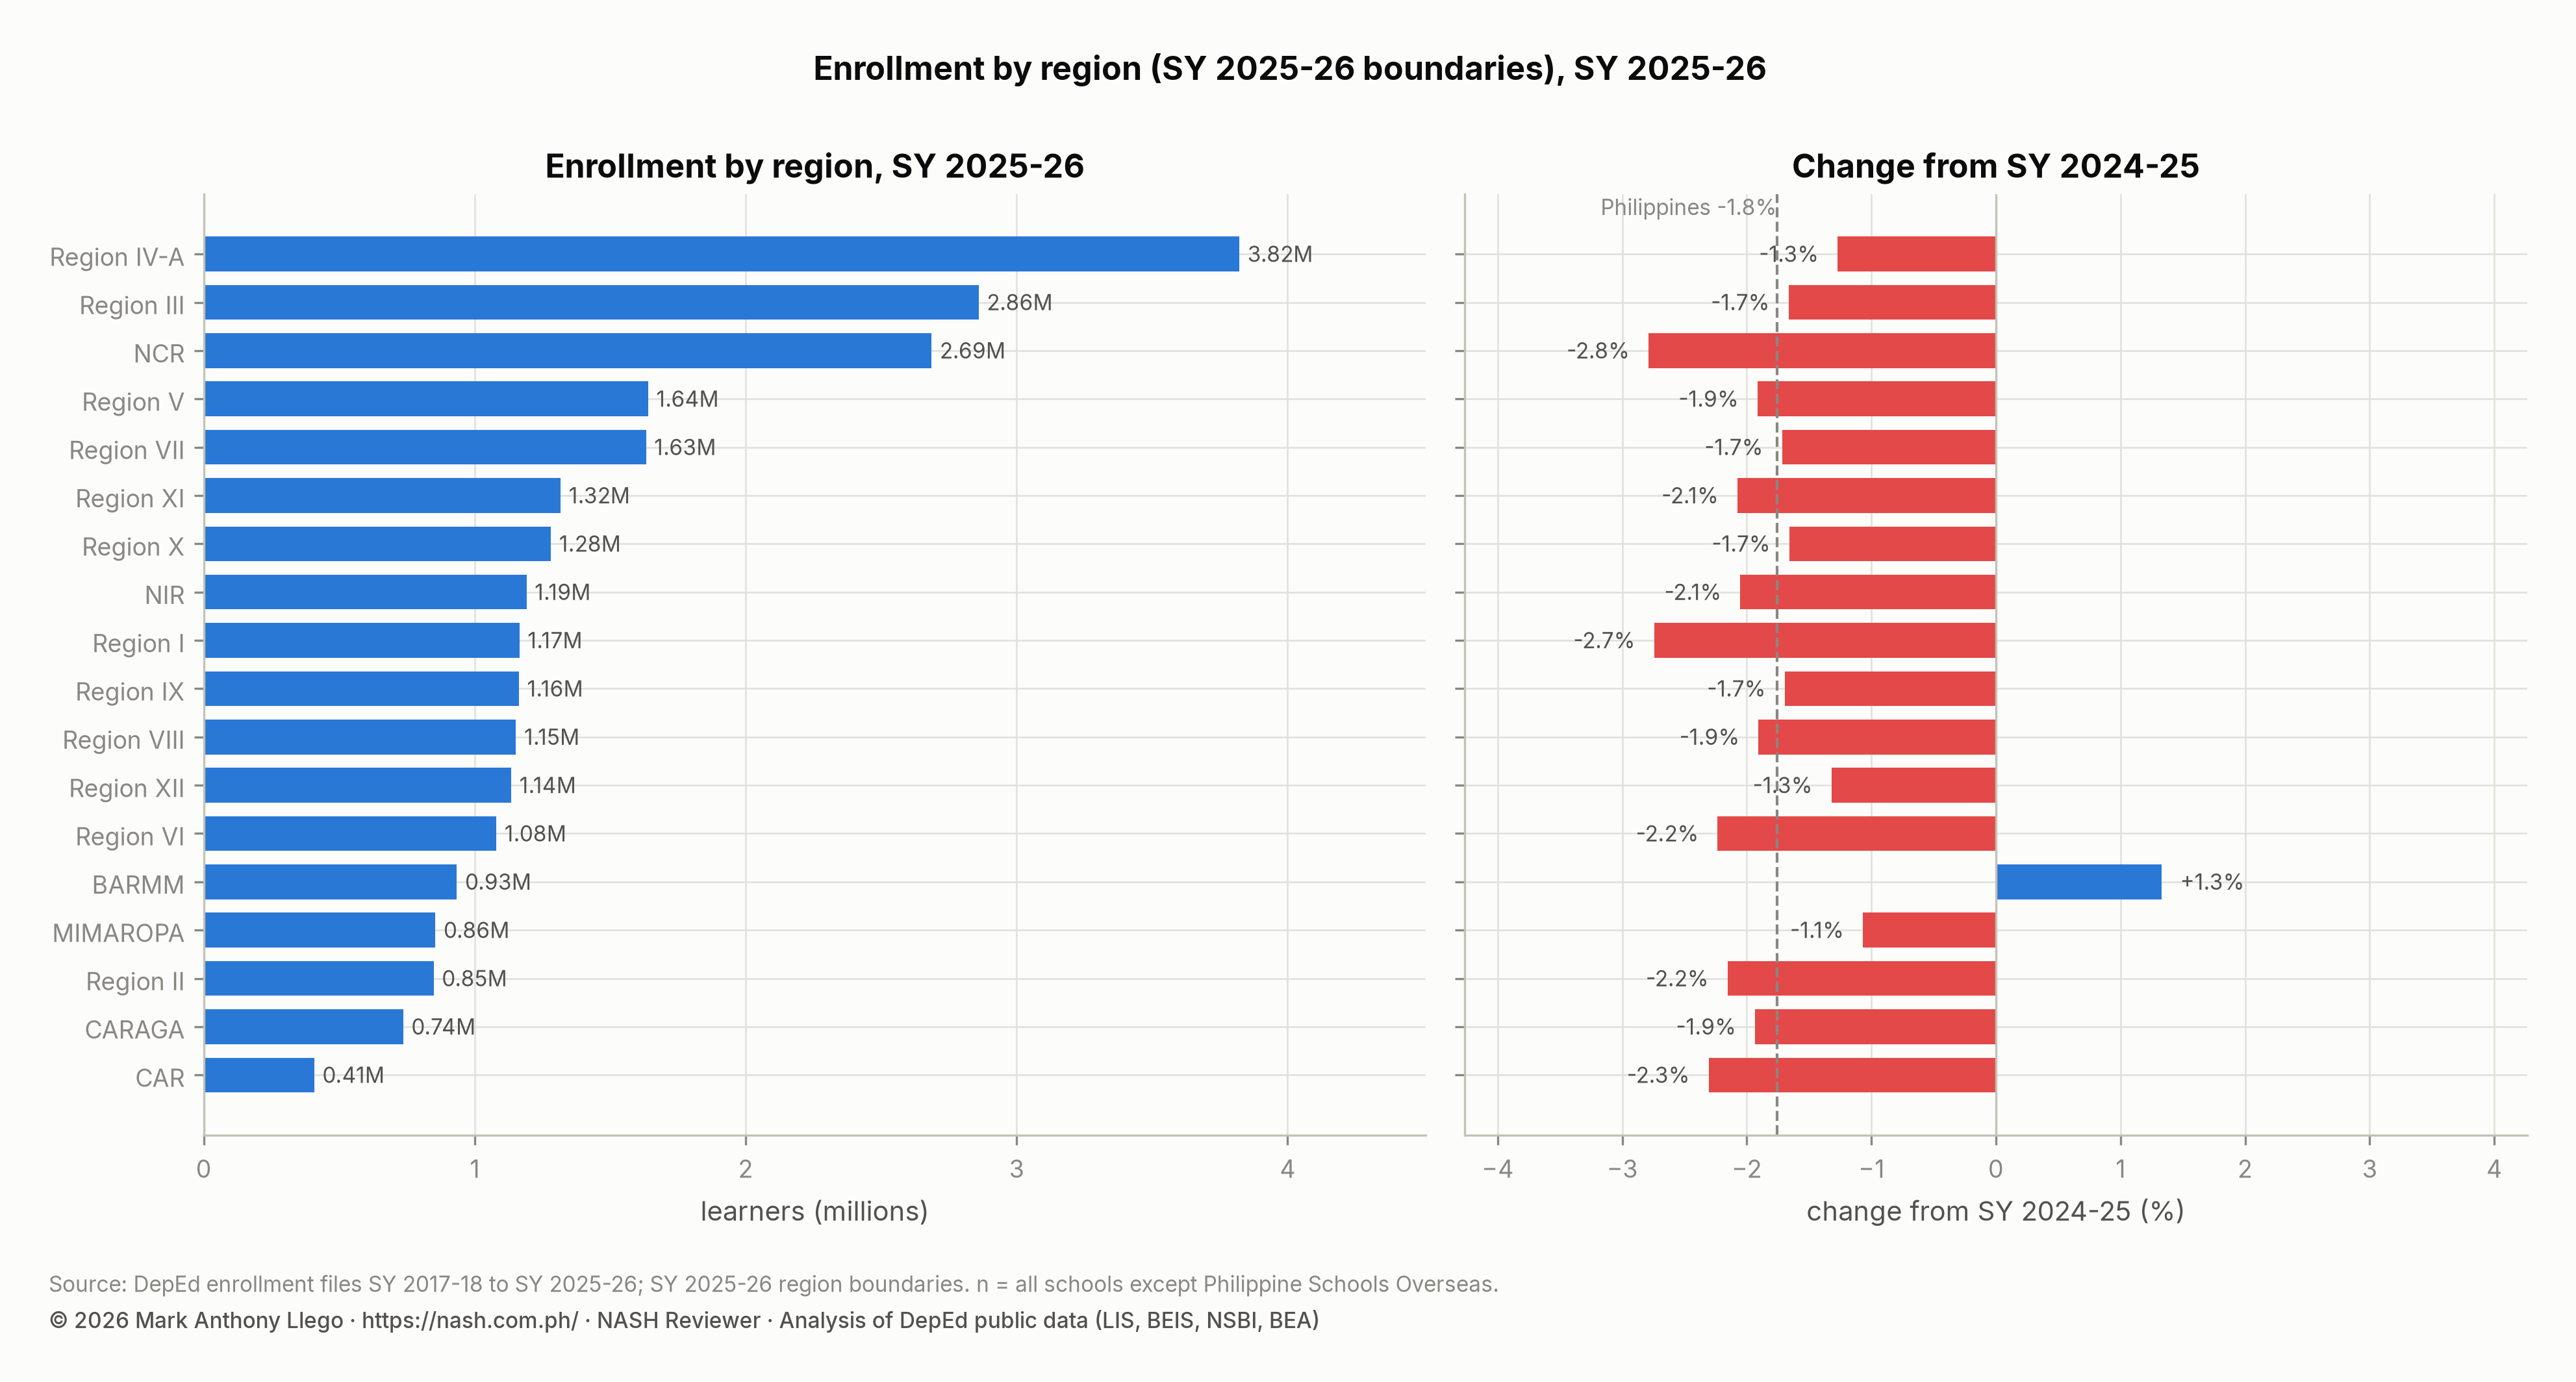
- BARMM was again the only region to grow (+1.3%). NCR fell 2.8%, the steepest regional decline, and was 7.9% below its SY 2019-2020 count.
- The private share of learners rose to 14.5%, the highest since SY 2019-2020. The median public school had 218 learners, the smallest in the series.
| Item | SY 2025-26 | SY 2024-25 | Change | Change (%) |
|---|---|---|---|---|
| Schools in the file | 60,204 | 60,129 | +75 | +0.1% |
| Schools reporting enrollment | 60,158 | 60,129 | +29 | +0.0% |
| Total enrollment | 25,935,863 | 26,400,182 | -464,319 | -1.8% |
| Kindergarten | 1,993,117 | 1,827,258 | +165,859 | +9.1% |
| Grades 1 to 6 | 12,258,106 | 12,831,966 | -573,860 | -4.5% |
| Elementary non-graded | 96,936 | 89,540 | +7,396 | +8.3% |
| Elementary (K to 6 and non-graded) | 14,348,159 | 14,748,764 | -400,605 | -2.7% |
| Junior high school (Grades 7 to 10 and non-graded) | 7,758,408 | 7,665,606 | +92,802 | +1.2% |
| Senior high school (Grades 11 and 12) | 3,829,296 | 3,985,812 | -156,516 | -3.9% |
| Female learners | 12,739,265 | 12,923,116 | -183,851 | -1.4% |
| Male learners | 13,196,598 | 13,477,066 | -280,468 | -2.1% |
| Female share of learners | 49.1% | 49.0% | +0.17 points |
SY 2025-2026 in the nine-year series
| School year | Schools | Total enrollment | Year-on-year | Kindergarten | Elementary (K–6) | Junior high | Senior high | Female share |
|---|---|---|---|---|---|---|---|---|
| SY 2017-18 | 61,563 | 26,311,949 | 2,268,455 | 15,752,075 | 7,826,414 | 2,733,460 | 49.1% | |
| SY 2018-19 | 61,916 | 27,018,509 | +2.7% | 2,409,782 | 15,675,041 | 8,320,627 | 3,022,841 | 49.2% |
| SY 2019-20 | 61,923 | 27,030,391 | +0.0% | 2,044,745 | 15,332,706 | 8,503,650 | 3,194,035 | 49.1% |
| SY 2020-21 | 60,957 | 26,227,022 | -3.0% | 2,055,635 | 14,650,804 | 8,339,391 | 3,236,827 | 49.2% |
| SY 2021-22 | 60,429 | 27,560,661 | +5.1% | 2,181,189 | 14,977,991 | 8,757,957 | 3,824,713 | 49.1% |
| SY 2022-23 | 60,137 | 27,794,282 | +0.8% | 2,149,891 | 15,188,435 | 8,426,203 | 4,179,644 | 48.7% |
| SY 2023-24 | 60,167 | 27,081,292 | -2.6% | 2,047,356 | 15,201,951 | 7,749,265 | 4,130,076 | 48.8% |
| SY 2024-25 | 60,129 | 26,400,182 | -2.5% | 1,827,258 | 14,748,764 | 7,665,606 | 3,985,812 | 49.0% |
| SY 2025-26 | 60,204 | 25,935,863 | -1.8% | 1,993,117 | 14,348,159 | 7,758,408 | 3,829,296 | 49.1% |
Three years of decline took 1.86 million learners off the SY 2022-2023 peak. The decline slowed each year, from 2.6% to 2.5% to 1.8%. In this year it slowed because kindergarten rose. Junior high also grew, by 1.2%, for the first time since the post-pandemic rebound. Elementary (−2.7%) and senior high (−3.9%) accounted for the whole of the fall.
Enrollment by grade: kindergarten up, Grade 9 the smallest
| Grade | Learners | Share of total | SY 2024-25 | Change | Change (%) |
|---|---|---|---|---|---|
| Kindergarten | 1,993,117 | 7.7% | 1,827,258 | +165,859 | +9.1% |
| Grade 1 | 1,858,183 | 7.2% | 2,070,358 | -212,175 | -10.2% |
| Grade 2 | 2,029,668 | 7.8% | 2,131,024 | -101,356 | -4.8% |
| Grade 3 | 2,108,943 | 8.1% | 2,193,031 | -84,088 | -3.8% |
| Grade 4 | 2,165,643 | 8.3% | 2,161,314 | +4,329 | +0.2% |
| Grade 5 | 2,131,958 | 8.2% | 2,000,886 | +131,072 | +6.6% |
| Grade 6 | 1,963,711 | 7.6% | 2,275,353 | -311,642 | -13.7% |
| Grade 7 | 2,231,667 | 8.6% | 2,141,724 | +89,943 | +4.2% |
| Grade 8 | 2,056,457 | 7.9% | 1,746,152 | +310,305 | +17.8% |
| Grade 9 | 1,674,391 | 6.5% | 1,867,514 | -193,123 | -10.3% |
| Grade 10 | 1,789,279 | 6.9% | 1,905,019 | -115,740 | -6.1% |
| Grade 11 | 1,916,843 | 7.4% | 2,041,601 | -124,758 | -6.1% |
| Grade 12 | 1,912,453 | 7.4% | 1,944,211 | -31,758 | -1.6% |
Kindergarten rose by 165,859 learners (+9.1%) to 1,993,117, recovering most of the previous year’s fall. The smallest class of the series therefore looks, for now, like a one-year low. Grade 1 fell 10.2% to 1,858,183 because it received that small class. The ratio was the usual one: 1.017 Grade 1 learners for every kindergarten learner of the year before.
Three older cohorts explain the rest of the grade table. Grade 6 fell 13.7% to 1,963,711 because the pandemic cohort, which entered Grade 1 in SY 2020-2021, had reached the last grade of elementary school. Grade 8 rose 17.8% to 2,056,457 because the large SY 2018-2019 Grade 1 class had moved up from Grade 7. Grade 9 fell 10.3% to 1,674,391, which made it the smallest grade in the entire system. This is the cohort first seen as a 1.93 million Grade 1 class in SY 2017-2018, now eight years later and down to 1.67 million. Next year it reaches Grade 10, and the year after, senior high.
Senior high lost 156,516 learners (−3.9%). Grade 11 fell 6.1% because the Grade 10 class behind it had been 5.0% smaller; the flow from Grade 10 to Grade 11 was 1.006. Grade 12 fell 1.6%, holding 0.937 of the previous year’s Grade 11.
Senior high school strands and the Strengthened Senior High School pilot
| Track or strand | Learners | Share of senior high | SY 2024-25 | Change | Change (%) |
|---|---|---|---|---|---|
| TVL | 1,034,429 | 27.0% | 1,168,349 | -133,920 | -11.5% |
| HUMSS | 1,007,555 | 26.3% | 1,085,575 | -78,020 | -7.2% |
| STEM | 702,410 | 18.3% | 786,711 | -84,301 | -10.7% |
| GAS | 423,479 | 11.1% | 500,915 | -77,436 | -15.5% |
| ABM | 365,597 | 9.5% | 412,369 | -46,772 | -11.3% |
| Strengthened SHS: Academic | 184,122 | 4.8% | 0 | +184,122 | |
| Strengthened SHS: TechPro | 84,708 | 2.2% | 0 | +84,708 | |
| Arts and Design | 17,417 | 0.5% | 19,429 | -2,012 | -10.4% |
| Sports | 5,618 | 0.1% | 7,326 | -1,708 | -23.3% |
| Maritime | 3,781 | 0.1% | 5,053 | -1,272 | -25.2% |
| Unique strands | 180 | 0.0% | 85 | +95 | +111.8% |
At first reading, the strand table says every strand fell sharply. Technical-Vocational-Livelihood (TVL) fell 11.5%, the General Academic Strand (GAS) 15.5% and Accountancy, Business and Management (ABM) 11.3%. Science, Technology, Engineering and Mathematics (STEM) fell 10.7% and Humanities and Social Sciences (HUMSS) 7.2%. Most of that change is reclassification. The two new Strengthened Senior High School tracks, Academic (184,122 learners) and TechPro (84,708), hold 268,830 learners between them, in the schools that piloted the revised curriculum. That is 7.0% of senior high. The five established strands lost 420,449 learners in total, while senior high as a whole lost 156,516. The difference is almost exactly the Strengthened SHS count. The old strands’ shares are therefore not comparable with any earlier year. The next file, in which the pilot either widens or ends, will show how to read them.
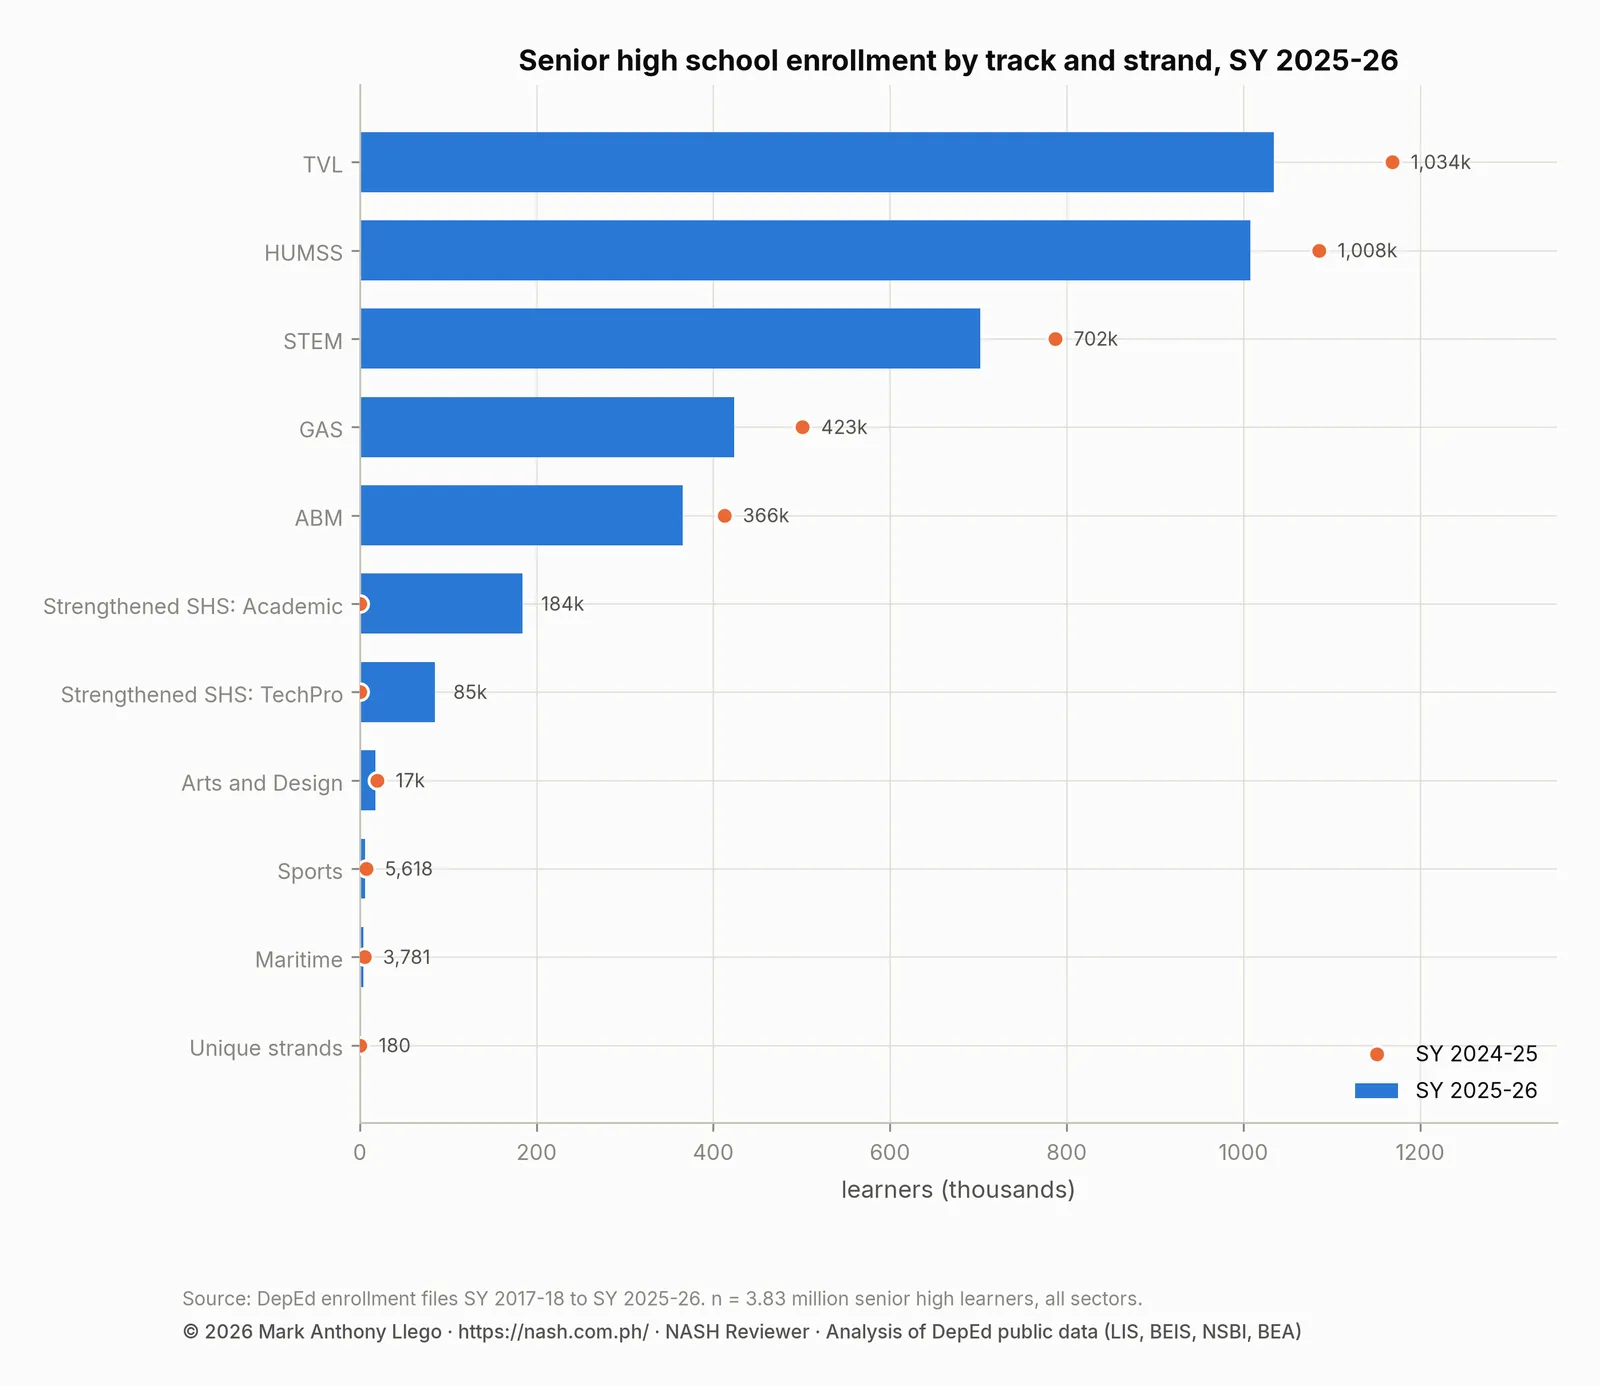
What can be said is that TVL, at 1,034,429, and HUMSS, at 1,007,555, were now within 27,000 learners of each other. The gap had been 705,000 in SY 2017-2018. STEM (702,410) remained the third-largest strand, well ahead of GAS (423,479) and ABM (365,597).
Enrollment by region: only BARMM grows, NCR 7.9% below its pre-pandemic size
| Region (SY 2025-26 boundaries) | Schools | Learners | Share of learners | SY 2024-25 | Change | Change (%) | Private share | Senior high share | Female share |
|---|---|---|---|---|---|---|---|---|---|
| Region IV-A | 6,018 | 3,822,536 | 14.8% | 3,871,761 | -49,225 | -1.3% | 20.5% | 14.7% | 48.8% |
| Region III | 5,213 | 2,860,078 | 11.0% | 2,908,517 | -48,439 | -1.7% | 17.0% | 14.9% | 49.0% |
| NCR | 2,507 | 2,686,394 | 10.4% | 2,763,471 | -77,077 | -2.8% | 26.5% | 17.1% | 49.1% |
| Region V | 4,489 | 1,640,002 | 6.3% | 1,672,003 | -32,001 | -1.9% | 9.0% | 14.1% | 48.8% |
| Region VII | 3,601 | 1,632,444 | 6.3% | 1,660,969 | -28,525 | -1.7% | 15.4% | 15.5% | 48.7% |
| Region XI | 2,706 | 1,317,420 | 5.1% | 1,345,342 | -27,922 | -2.1% | 11.9% | 14.7% | 49.3% |
| Region X | 3,113 | 1,281,565 | 4.9% | 1,303,187 | -21,622 | -1.7% | 12.3% | 13.7% | 49.4% |
| NIR | 2,746 | 1,191,317 | 4.6% | 1,216,279 | -24,962 | -2.1% | 9.7% | 14.4% | 49.1% |
| Region I | 3,389 | 1,165,403 | 4.5% | 1,198,291 | -32,888 | -2.7% | 11.4% | 16.0% | 48.7% |
| Region IX | 3,365 | 1,163,334 | 4.5% | 1,183,411 | -20,077 | -1.7% | 7.8% | 12.9% | 49.9% |
| Region VIII | 4,481 | 1,152,614 | 4.4% | 1,175,013 | -22,399 | -1.9% | 6.3% | 14.0% | 49.1% |
| Region XII | 2,553 | 1,135,036 | 4.4% | 1,150,229 | -15,193 | -1.3% | 10.1% | 14.5% | 49.6% |
| Region VI | 3,444 | 1,079,924 | 4.2% | 1,104,607 | -24,683 | -2.2% | 9.9% | 15.9% | 48.5% |
| BARMM | 2,483 | 934,373 | 3.6% | 922,116 | +12,257 | +1.3% | 15.1% | 11.2% | 51.5% |
| MIMAROPA | 2,714 | 855,106 | 3.3% | 864,342 | -9,236 | -1.1% | 7.8% | 13.8% | 49.1% |
| Region II | 2,909 | 848,648 | 3.3% | 867,339 | -18,691 | -2.2% | 10.5% | 15.3% | 49.0% |
| CARAGA | 2,362 | 736,260 | 2.8% | 750,780 | -14,520 | -1.9% | 8.7% | 14.0% | 49.1% |
| CAR | 2,075 | 408,037 | 1.6% | 417,670 | -9,633 | -2.3% | 16.9% | 15.7% | 49.1% |
BARMM grew 1.3% and was again the only region to grow. It has grown in six of the eight year-on-year changes in the series; the exceptions were SY 2020-2021 and SY 2023-2024. Maguindanao I was the fastest-growing division in the country for the second year in a row (+7.2%, 12,921 learners). NCR fell 2.8%, the steepest regional decline, losing 77,077 learners. At 2,686,394, NCR was 7.9% below its SY 2019-2020 count. The division of Manila alone lost 14,205 learners (−3.9%) in the year. Region I (−2.7%), CAR (−2.3%), Region VI and Region II (−2.2%) followed. MIMAROPA (−1.1%) fell least.
Two divisions appear in the file for the first time, both in Region IV-A: Carmona City (20,569 learners), separated from Cavite, and Calaca City (20,469), separated from Batangas. Cavite and Batangas have lost territory to new city divisions in four of the last eight years, and both are left out of the growth ranking. Batangas, once the ninth-largest division in the country, dropped out of the top ten, and Pampanga (380,844) took its place.
| Rank | Division | Region | Schools | Learners | Share of all learners |
|---|---|---|---|---|---|
| 1 | Cebu | Region VII | 1,361 | 599,719 | 2.3% |
| 2 | Quezon City | NCR | 590 | 575,963 | 2.2% |
| 3 | Rizal | Region IV-A | 709 | 569,368 | 2.2% |
| 4 | Bulacan | Region III | 801 | 554,223 | 2.1% |
| 5 | Cavite | Region IV-A | 599 | 474,184 | 1.8% |
| 6 | Quezon | Region IV-A | 1,133 | 467,431 | 1.8% |
| 7 | Camarines Sur | Region V | 1,285 | 465,402 | 1.8% |
| 8 | Davao City | Region XI | 649 | 447,904 | 1.7% |
| 9 | Iloilo | Region VI | 1,396 | 444,502 | 1.7% |
| 10 | Pampanga | Region III | 722 | 380,844 | 1.5% |
Public and private school enrollment: private share back to 14.5%, smallest public schools yet
| Sector | Schools | Learners | Share of learners | Kindergarten | Elementary (K to 6) | Junior high | Senior high | Schools, SY 2024-25 | Learners, SY 2024-25 | Change (%) |
|---|---|---|---|---|---|---|---|---|---|---|
| Public | 48,129 | 22,078,460 | 85.1% | 1,762,743 | 13,118,320 | 6,551,899 | 2,408,241 | 47,972 | 22,543,711 | -2.1% |
| Private | 11,868 | 3,758,971 | 14.5% | 227,367 | 1,205,603 | 1,152,482 | 1,400,886 | 11,939 | 3,750,251 | +0.2% |
| SUC/LUC laboratory schools | 171 | 73,060 | 0.3% | 1,031 | 9,370 | 46,244 | 17,446 | 183 | 81,365 | -10.2% |
| Philippine Schools Overseas | 36 | 25,372 | 0.1% | 1,976 | 14,866 | 7,783 | 2,723 | 35 | 24,855 | +2.1% |
Private enrollment rose slightly, by 8,720 (+0.2%) to 3,758,971, its highest since the pandemic. The number of private schools, 11,868, was the fewest in the series. The private share of all learners, 14.5%, was the highest since the 15.9% of SY 2019-2020. The private share of senior high, 36.6%, was back to its SY 2020-2021 level. Public enrollment fell 465,251 (−2.1%). The 171 laboratory schools of state and local universities and colleges (SUC/LUC) held 73,060 learners, less than half their SY 2017-2018 enrollment.
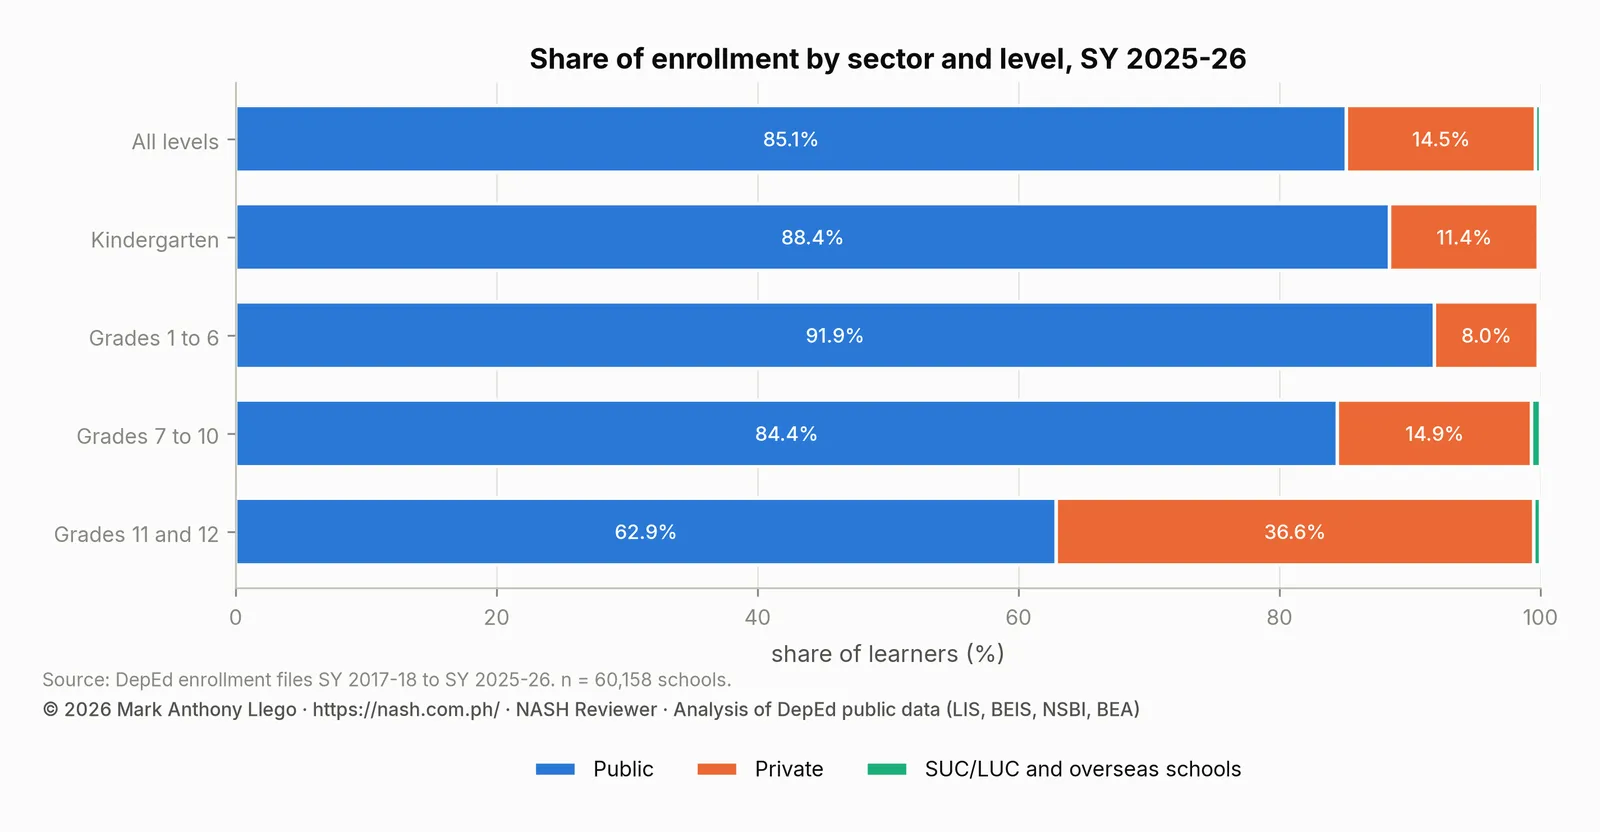
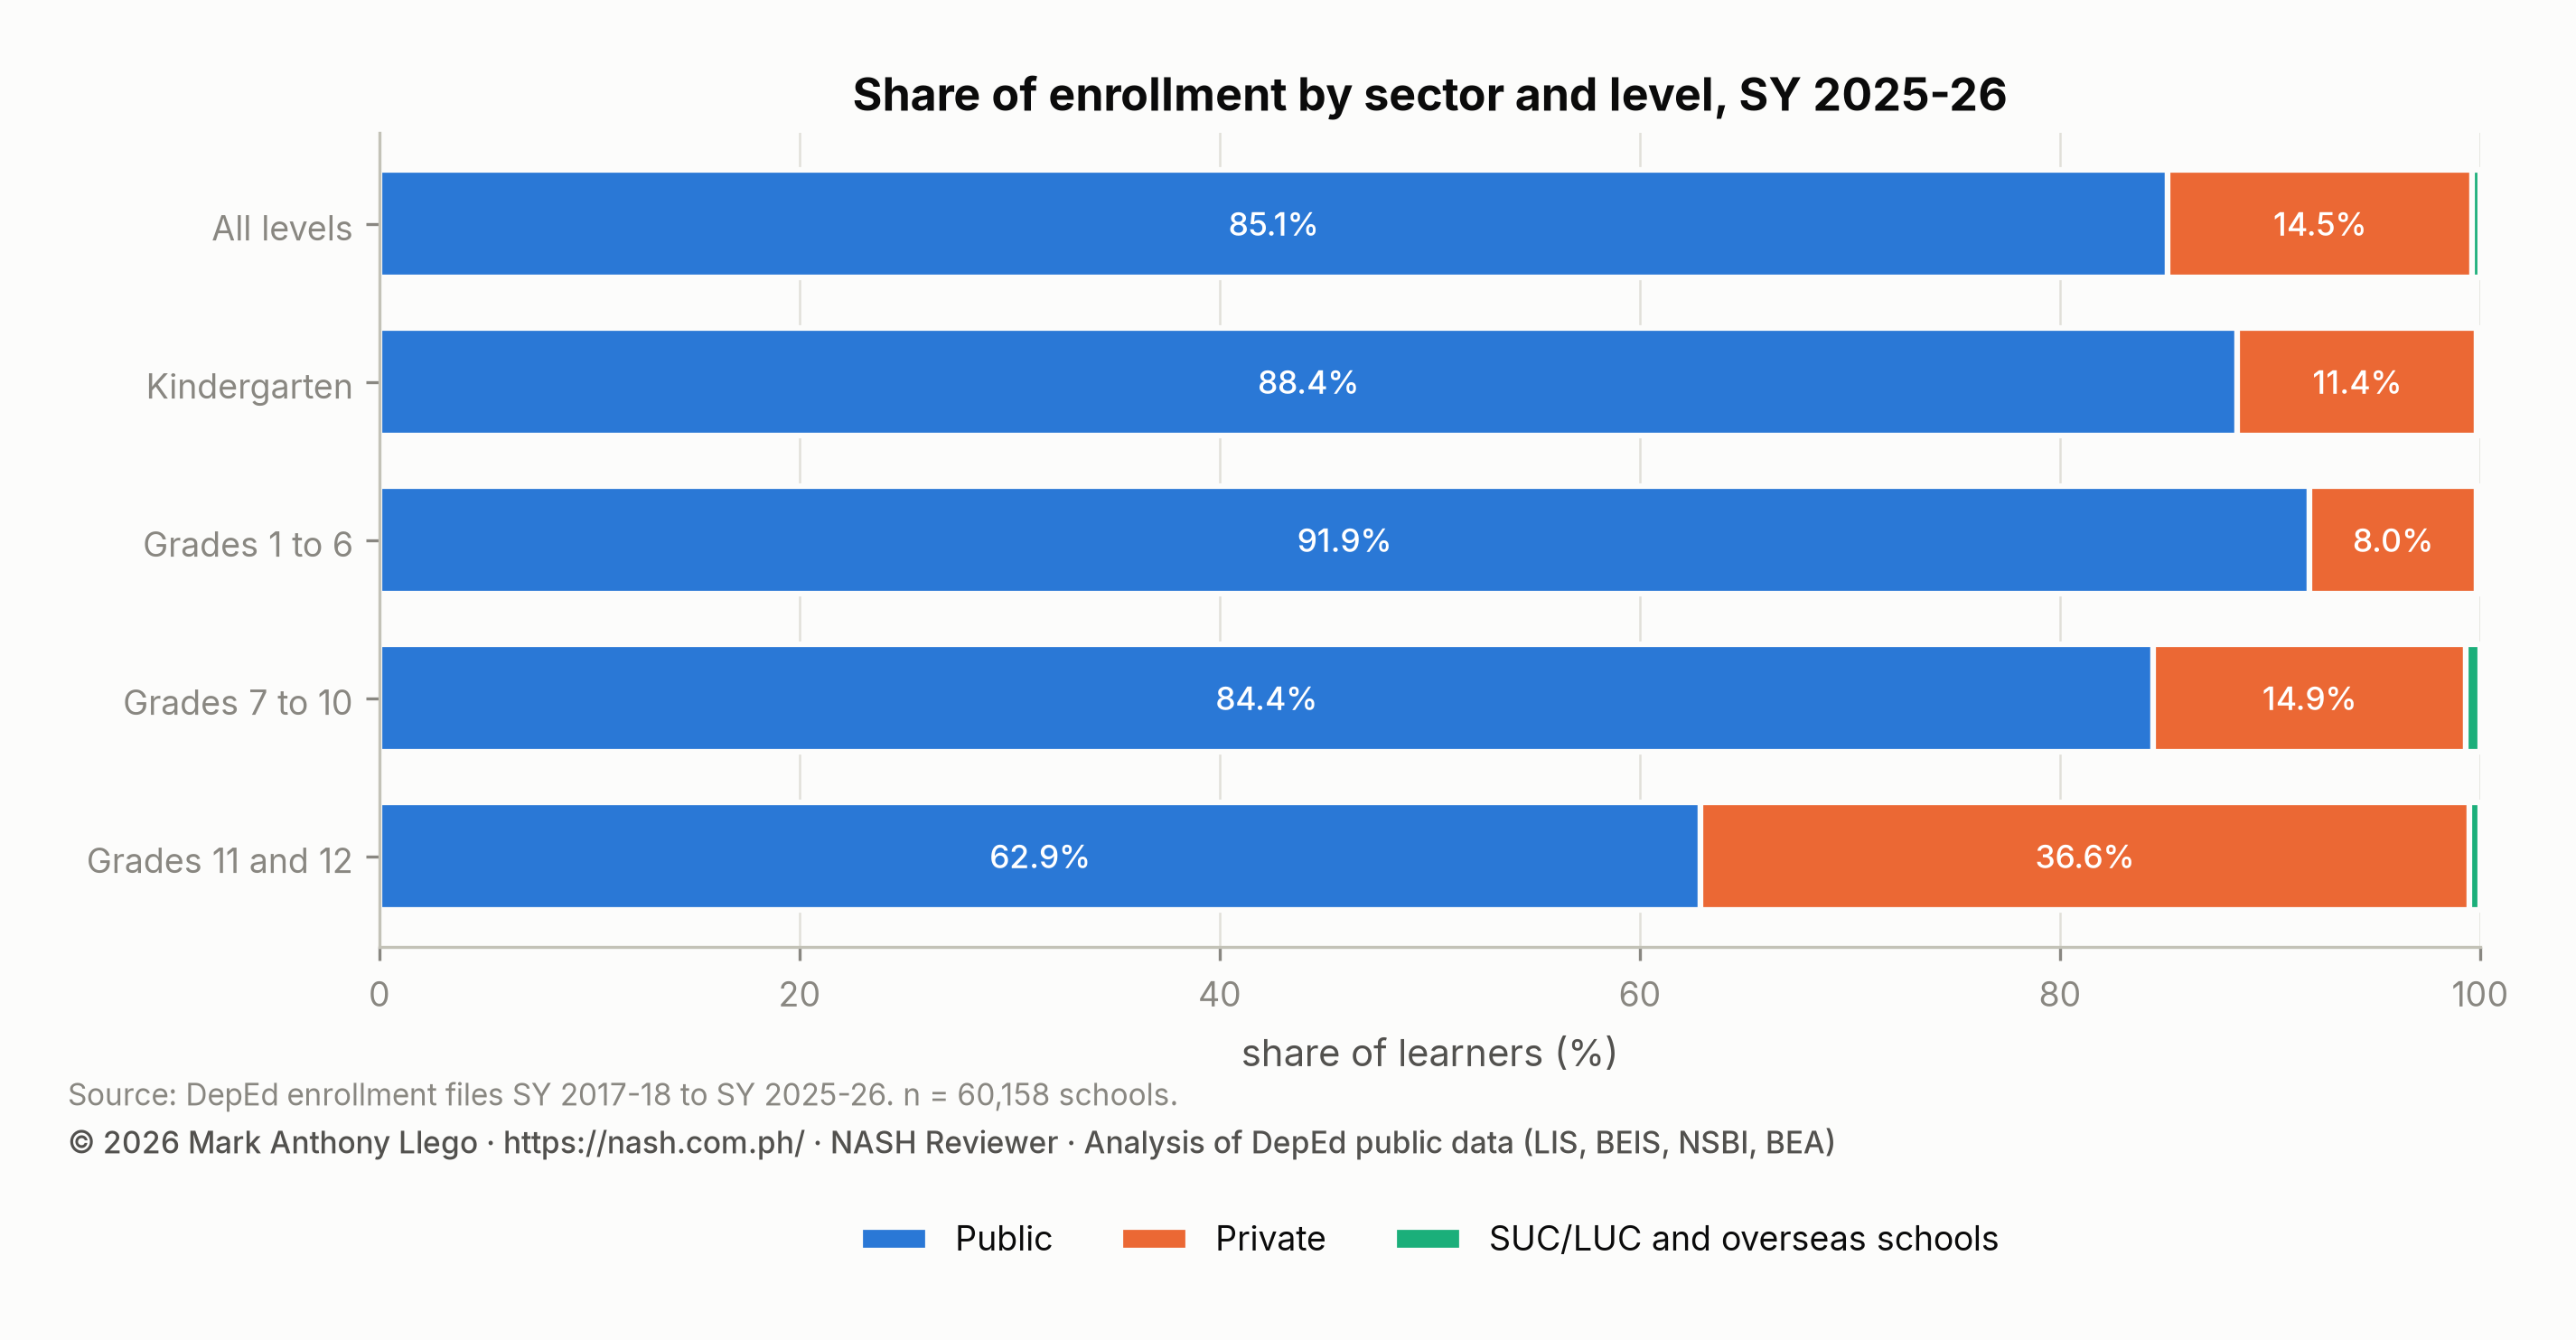
The median public school had 218 learners, the smallest in the series and 21 fewer than in SY 2017-2018. The median private school had 123, the largest in the series. The 2,153 schools with more than 2,000 learners held 28.4% of learners. At the peak, that share had been 31.0%. The 8,752 schools with 51 to 100 learners were the most in any year. In other words, a shrinking public enrollment was spread over a slowly growing number of public schools. There were 48,129 public schools, 1,314 more than in SY 2017-2018, for 18,360 fewer learners.
| Learners per school | Schools | Share of schools | Learners | Share of learners | Public schools | Share of public schools | Private schools | Share of private schools |
|---|---|---|---|---|---|---|---|---|
| 1–50 | 6,125 | 10.2% | 174,943 | 0.7% | 2,958 | 6.1% | 3,159 | 26.7% |
| 51–100 | 8,752 | 14.5% | 663,807 | 2.6% | 6,684 | 13.9% | 2,057 | 17.4% |
| 101–200 | 15,071 | 25.1% | 2,196,786 | 8.5% | 12,785 | 26.6% | 2,250 | 19.0% |
| 201–500 | 17,244 | 28.7% | 5,474,836 | 21.1% | 14,791 | 30.7% | 2,379 | 20.1% |
| 501–1,000 | 7,113 | 11.8% | 4,941,189 | 19.1% | 5,931 | 12.3% | 1,132 | 9.6% |
| 1,001–2,000 | 3,700 | 6.2% | 5,115,793 | 19.7% | 3,103 | 6.4% | 583 | 4.9% |
| over 2,000 | 2,153 | 3.6% | 7,368,509 | 28.4% | 1,874 | 3.9% | 273 | 2.3% |
What is new in the SY 2025-2026 file
- Sulu. The file lists Sulu’s schools under Region IX, following the Supreme Court’s September 2024 ruling. Sulu is counted under Region IX in every year here, so the regional comparisons are unaffected. BARMM’s own figures in the file, however, are not comparable with DepEd’s earlier files.
- Blanks. The file writes blanks where earlier files wrote zeros. A blank for a level a school does not offer is counted as zero. So are the 128 blank cells for levels a school offers, in schools that reported other levels. The 46 schools with every cell blank are excluded from the totals, so the 60,204 schools in the file become 60,158 reporting schools. Those 46 schools held about 465 learners in SY 2024-2025.
- New columns. The file adds the Strengthened SHS Academic and TechPro tracks and a Modified Curricular Offering Classification. Under that classification, 42,118 schools are purely elementary, 7,901 offer junior high with senior high, 3,692 offer all levels, 3,384 offer elementary and junior high, 1,730 are purely junior high and 1,347 are purely senior high.
- New schools only. As the latest file, this one has no school exits to count yet. New this year were 326 public and 224 private schools.
Frequently asked questions
Is DepEd enrollment in SY 2025-2026 lower than in SY 2017-2018?
Yes. Enrollment in SY 2025-2026 was 25,935,863 against 26,311,949 in SY 2017-2018, a difference of 376,086. Public enrollment, 22,078,460, is also below its SY 2017-2018 level of 22,096,820. Senior high enrollment is 1.1 million higher and elementary 1.4 million lower.
Did senior high school strands really fall by 10% to 15% in SY 2025-2026?
Mostly not. The 268,830 learners in the two new Strengthened Senior High School tracks came from the schools that piloted the revised curriculum. They would otherwise have been counted in the established strands. Senior high as a whole fell 3.9%.
Which grade has the fewest learners in SY 2025-2026?
Grade 9, with 1,674,391 learners, is the smallest grade in SY 2025-2026. It is the cohort that entered Grade 1 in SY 2017-2018 as the smallest Grade 1 class in the series. It has been the smallest cohort in the system at every grade since.
Download the data
The cleaned, harmonized DepEd files behind this series are free to download in CSV and Parquet, with a codebook and checksums, under the terms of use set out in the release. Download Cleaned DepEd School Data, SY 2017-18 to 2025-26 documents every file and column. The files themselves are at data.nash.com.ph, starting with the README, the SY 2023-24 school master file (CSV, 8.0 MB) and the nine-year enrollment panel (Parquet, 17.2 MB).
More in this series
- Previous year: DepEd Enrollment SY 2024-2025: Smallest Kindergarten Class
- The nine-year overview: DepEd Enrollment Trends SY 2017-2018 to SY 2025-2026
- All nine annual reports: SY 2017-18, SY 2018-19, SY 2019-20, SY 2020-21, SY 2021-22, SY 2022-23, SY 2023-24, SY 2024-25, SY 2025-26
- DepEd Data for Aspiring School Heads: Where to Start
- For aspiring school heads: How to Read DepEd Data, the NASH 2025 study guide and the full report, Philippine basic education in numbers
Analysis and charts by Mark Anthony Llego for NASH Reviewer. Data: Department of Education enrollment datasets for SY 2024-25 and SY 2025-26 (Learner Information System). Charts may be reused only with written permission from support@nash.com.ph.