DepEd’s enrollment dataset for SY 2023-2024 covers the first year of a decline that has continued in every year since. Enrollment fell by 712,990 learners to 27,081,292, a drop of 2.6% from the peak of SY 2022-2023. Classes had opened on August 29, 2023, with every school in person, so the fall has nothing to do with the pandemic. It is the result of smaller cohorts arriving at each level in turn, and in this year the level that received a small cohort was junior high school.
SY 2023-2024 is also the year that DepEd’s other public files describe. The learner, personnel, facilities, information and communications technology (ICT) and water, sanitation and hygiene (WASH) files all cover this school year. So do the Grade 6 National Achievement Test (NAT) and Grade 3 Early Language, Literacy, and Numeracy Assessment (ELLNA) results. This enrollment count is therefore the denominator behind every ratio in the learner data report, personnel report, facilities report, WASH report and ICT report in this series.
Key findings
- Enrollment fell by 712,990 learners (−2.6%) to 27,081,292 in SY 2023-2024. This was the start of the decline that has continued in every year since.
- Junior high lost 676,938 learners (−8.0%) as the small cohort of SY 2017-2018 reached Grade 7. Grade 7 fell 11.3% to 1,808,212, the smallest Grade 7 in the nine-year series.
- All 18 regions lost learners, for the first time in the series. The losses ranged from 1.0% in NCR to 4.8% in Region VIII.
- Senior high fell for the first time, by 49,568 learners (−1.2%). Grade 12 rose 5.7% to the largest Grade 12 in the series while Grade 11 fell 7.1%.
- Public enrollment fell by 810,824 (−3.4%) while private enrollment rose by 104,430 (+2.9%). Among senior high strands, GAS lost 112,724 learners (−15.5%), by far the largest change.
| Item | SY 2023-24 | SY 2022-23 | Change | Change (%) |
|---|---|---|---|---|
| Schools in the file | 60,167 | 60,137 | +30 | +0.0% |
| Schools reporting enrollment | 60,167 | 60,137 | +30 | +0.0% |
| Total enrollment | 27,081,292 | 27,794,282 | -712,990 | -2.6% |
| Kindergarten | 2,047,356 | 2,149,891 | -102,535 | -4.8% |
| Grades 1 to 6 | 13,073,357 | 12,964,374 | +108,983 | +0.8% |
| Elementary non-graded | 81,238 | 74,170 | +7,068 | +9.5% |
| Elementary (K to 6 and non-graded) | 15,201,951 | 15,188,435 | +13,516 | +0.1% |
| Junior high school (Grades 7 to 10 and non-graded) | 7,749,265 | 8,426,203 | -676,938 | -8.0% |
| Senior high school (Grades 11 and 12) | 4,130,076 | 4,179,644 | -49,568 | -1.2% |
| Female learners | 13,227,202 | 13,549,306 | -322,104 | -2.4% |
| Male learners | 13,854,090 | 14,244,976 | -390,886 | -2.7% |
| Female share of learners | 48.8% | 48.7% | +0.09 points |
Enrollment by grade: the small cohort of SY 2017-2018 reaches junior high
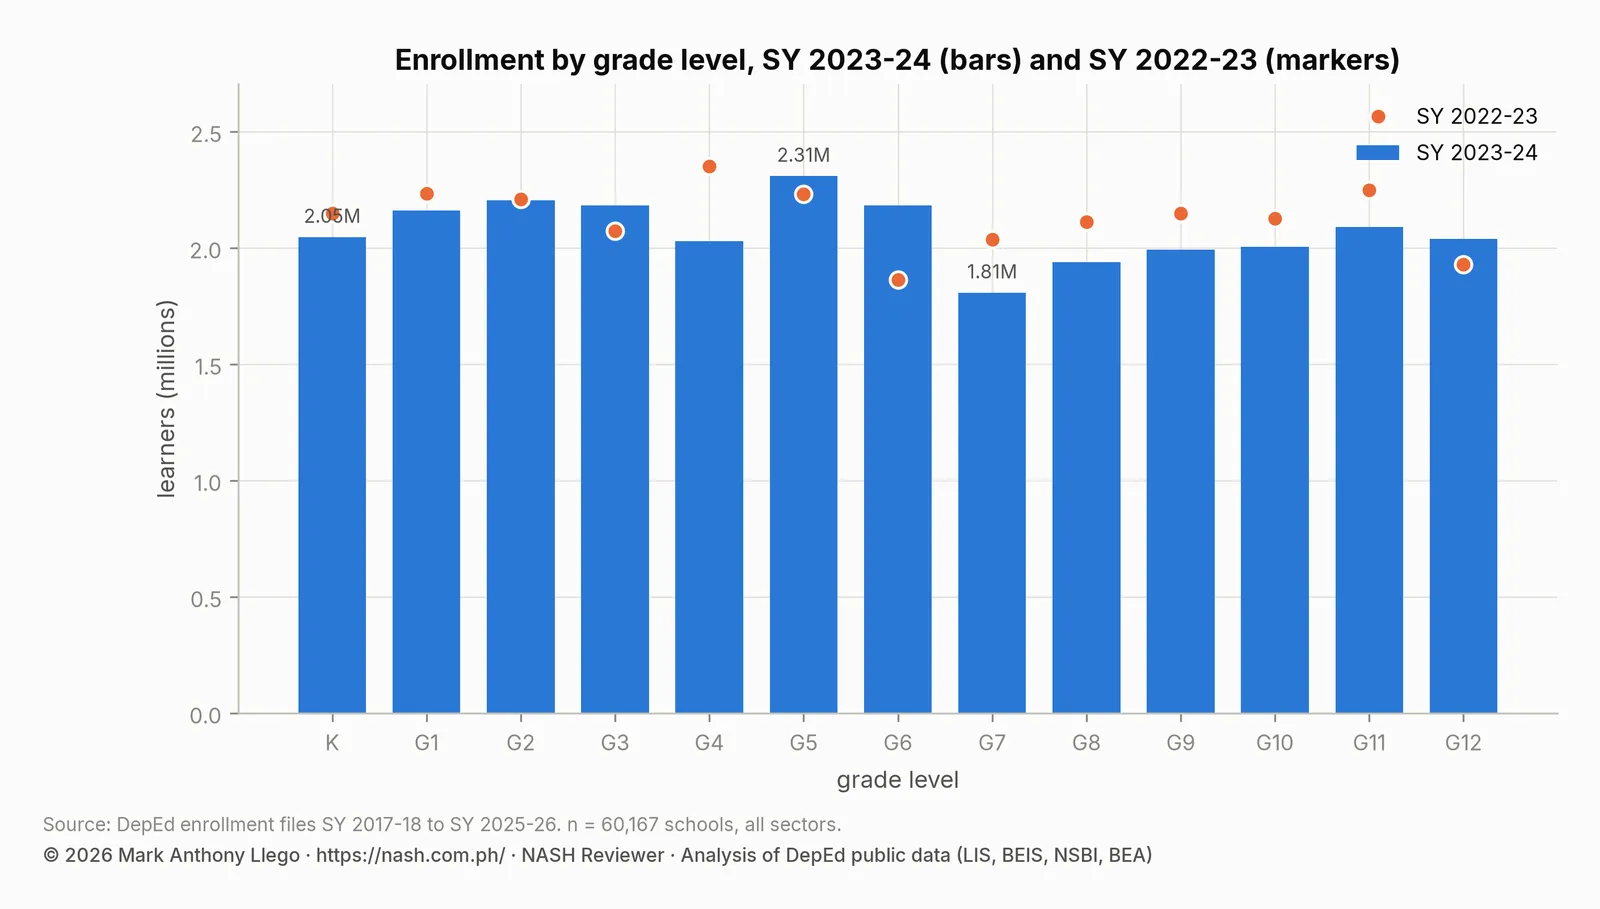
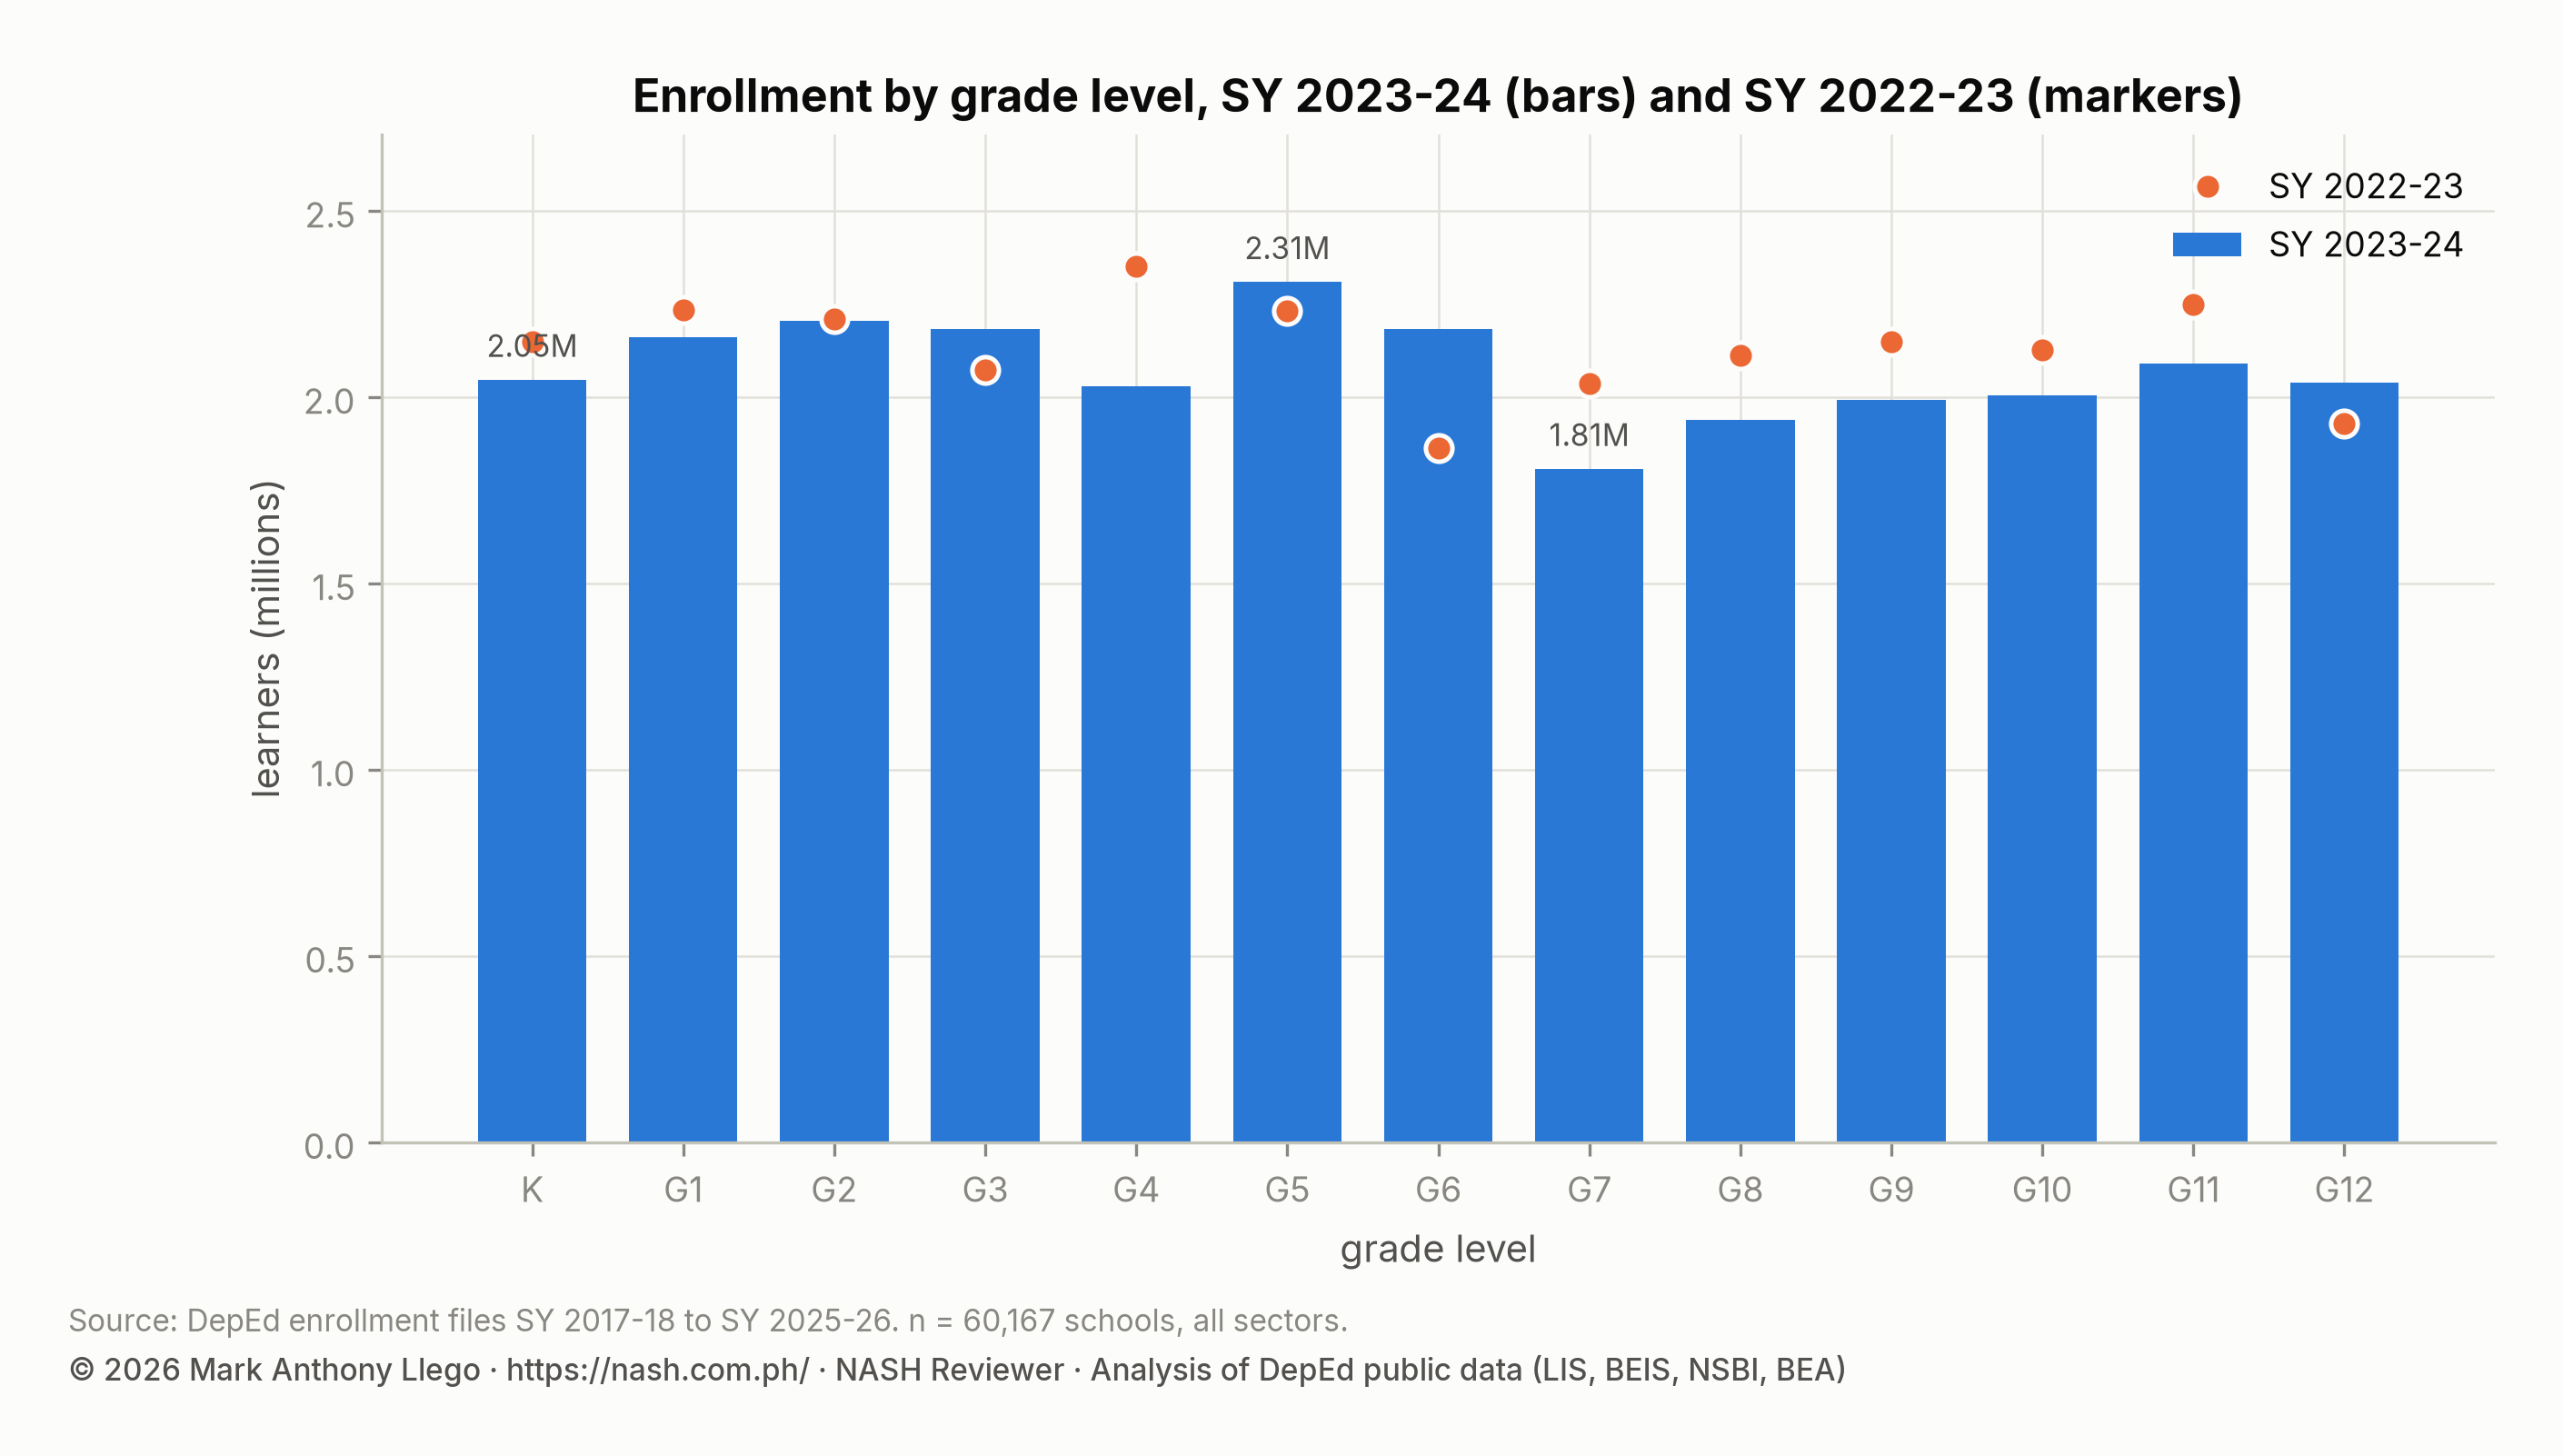
Junior high lost 676,938 learners, 8.0% of its enrollment. All four of its grades fell: Grade 7 by 11.3%, Grade 8 by 8.1%, Grade 9 by 7.3% and Grade 10 by 5.7%. Grade 7 held 1,808,212 learners, the smallest Grade 7 in the nine-year series, by a margin of 229,000.
This is the cohort first seen in the SY 2017-2018 report. It was then a Grade 1 class of 1.93 million, smaller than every grade above it. It spent six years as the smallest cohort in the elementary system, and in this year it moved on to junior high. Grade 7 took 0.971 learners for every Grade 6 learner of the previous year, a normal ratio. The drop is entirely due to the size of the class that arrived. Junior high schools had planned on a Grade 7 intake of 2.0 to 2.1 million, the level of the previous three years, and received 1.8 million.
| Grade | Learners | Share of total | SY 2022-23 | Change | Change (%) |
|---|---|---|---|---|---|
| Kindergarten | 2,047,356 | 7.6% | 2,149,891 | -102,535 | -4.8% |
| Grade 1 | 2,161,371 | 8.0% | 2,235,544 | -74,173 | -3.3% |
| Grade 2 | 2,205,979 | 8.1% | 2,209,138 | -3,159 | -0.1% |
| Grade 3 | 2,183,377 | 8.1% | 2,073,187 | +110,190 | +5.3% |
| Grade 4 | 2,029,448 | 7.5% | 2,352,218 | -322,770 | -13.7% |
| Grade 5 | 2,309,827 | 8.5% | 2,231,378 | +78,449 | +3.5% |
| Grade 6 | 2,183,355 | 8.1% | 1,862,909 | +320,446 | +17.2% |
| Grade 7 | 1,808,212 | 6.7% | 2,037,475 | -229,263 | -11.3% |
| Grade 8 | 1,940,033 | 7.2% | 2,111,293 | -171,260 | -8.1% |
| Grade 9 | 1,992,251 | 7.4% | 2,148,230 | -155,979 | -7.3% |
| Grade 10 | 2,004,570 | 7.4% | 2,126,086 | -121,516 | -5.7% |
| Grade 11 | 2,090,066 | 7.7% | 2,250,085 | -160,019 | -7.1% |
| Grade 12 | 2,040,010 | 7.5% | 1,929,559 | +110,451 | +5.7% |
Elementary was almost unchanged overall (+13,516 learners), but its grades moved in different directions. Kindergarten fell 4.8% to 2,047,356 and Grade 1 fell 3.3%. Grade 4 fell 13.7% to 2,029,448. This is the pandemic cohort: the children who entered Grade 1 in SY 2020-2021, at 2.03 million, when fewer learners entered Grade 1 than had been in kindergarten. It has stayed close to that size ever since. Grade 6 rose 17.2% as the large cohort that entered Grade 1 in SY 2018-2019 reached it. Two small cohorts and one large one were now moving through the system in a fixed order. The next two reports show them arriving at junior high and senior high in turn.
Senior high school enrollment falls for the first time, with Grade 12 at a record
Senior high enrollment fell for the first time, by 49,568 learners (−1.2%) to 4,130,076, but its two grades moved in opposite directions. Grade 12 rose 5.7% to 2,040,010, the largest Grade 12 in the series, as the returnee class of SY 2021-2022 completed its second year. Grade 11 fell 7.1% to 2,090,066 for two reasons. The Grade 10 class behind it had been 4.1% smaller, and the flow from Grade 10 to Grade 11 fell back below one, to 0.983, after two years above it. The post-pandemic return was over. From this year on, senior high enrollment would follow the size of the junior high cohorts behind it, which were falling.
Girls were exactly half of senior high learners, 50.0%, down from 52.9% in SY 2017-2018. The female majority of the first senior high cohorts was gone.
Enrollment by region: all 18 regions fell
| Region (SY 2025-26 boundaries) | Schools | Learners | Share of learners | SY 2022-23 | Change | Change (%) | Private share | Senior high share | Female share |
|---|---|---|---|---|---|---|---|---|---|
| Region IV-A | 6,007 | 3,951,663 | 14.6% | 3,994,312 | -42,649 | -1.1% | 19.1% | 14.8% | 48.6% |
| Region III | 5,194 | 2,966,748 | 11.0% | 3,024,831 | -58,083 | -1.9% | 16.2% | 15.4% | 48.7% |
| NCR | 2,687 | 2,834,118 | 10.5% | 2,864,029 | -29,911 | -1.0% | 25.5% | 17.3% | 49.0% |
| Region V | 4,467 | 1,733,251 | 6.4% | 1,803,644 | -70,393 | -3.9% | 8.6% | 15.4% | 48.5% |
| Region VII | 3,574 | 1,712,480 | 6.3% | 1,747,928 | -35,448 | -2.0% | 14.9% | 16.5% | 48.4% |
| Region XI | 2,704 | 1,384,153 | 5.1% | 1,425,893 | -41,740 | -2.9% | 11.9% | 15.5% | 49.1% |
| Region X | 3,106 | 1,330,705 | 4.9% | 1,367,333 | -36,628 | -2.7% | 12.4% | 14.5% | 49.1% |
| NIR | 2,725 | 1,254,413 | 4.6% | 1,289,180 | -34,767 | -2.7% | 9.5% | 15.4% | 48.7% |
| Region I | 3,393 | 1,244,604 | 4.6% | 1,296,195 | -51,591 | -4.0% | 11.1% | 16.7% | 48.4% |
| Region VIII | 4,466 | 1,219,378 | 4.5% | 1,281,005 | -61,627 | -4.8% | 5.9% | 14.8% | 48.6% |
| Region IX | 3,337 | 1,210,424 | 4.5% | 1,254,073 | -43,649 | -3.5% | 7.6% | 13.8% | 49.6% |
| Region XII | 2,541 | 1,178,506 | 4.4% | 1,214,498 | -35,992 | -3.0% | 9.6% | 14.6% | 49.2% |
| Region VI | 3,435 | 1,152,498 | 4.3% | 1,200,467 | -47,969 | -4.0% | 9.4% | 16.8% | 48.1% |
| Region II | 2,916 | 899,159 | 3.3% | 926,788 | -27,629 | -3.0% | 10.0% | 15.4% | 48.6% |
| BARMM | 2,463 | 899,130 | 3.3% | 919,674 | -20,544 | -2.2% | 11.9% | 8.9% | 51.4% |
| MIMAROPA | 2,684 | 887,334 | 3.3% | 919,612 | -32,278 | -3.5% | 7.4% | 14.1% | 48.9% |
| CARAGA | 2,355 | 767,014 | 2.8% | 798,540 | -31,526 | -3.9% | 8.6% | 14.2% | 48.8% |
| CAR | 2,080 | 432,266 | 1.6% | 445,069 | -12,803 | -2.9% | 16.3% | 16.3% | 48.6% |
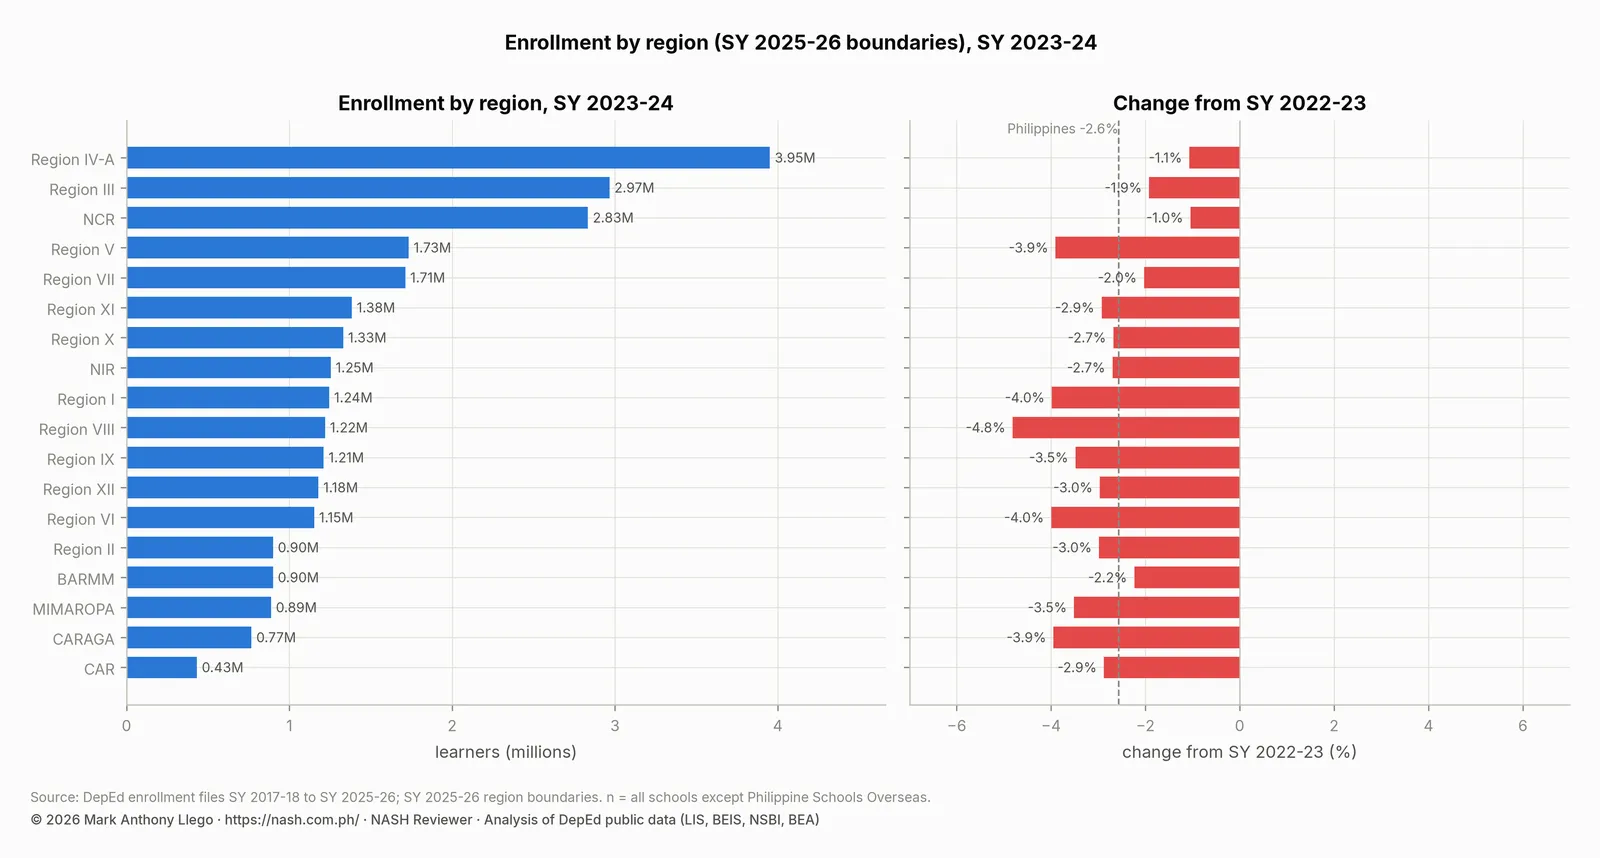
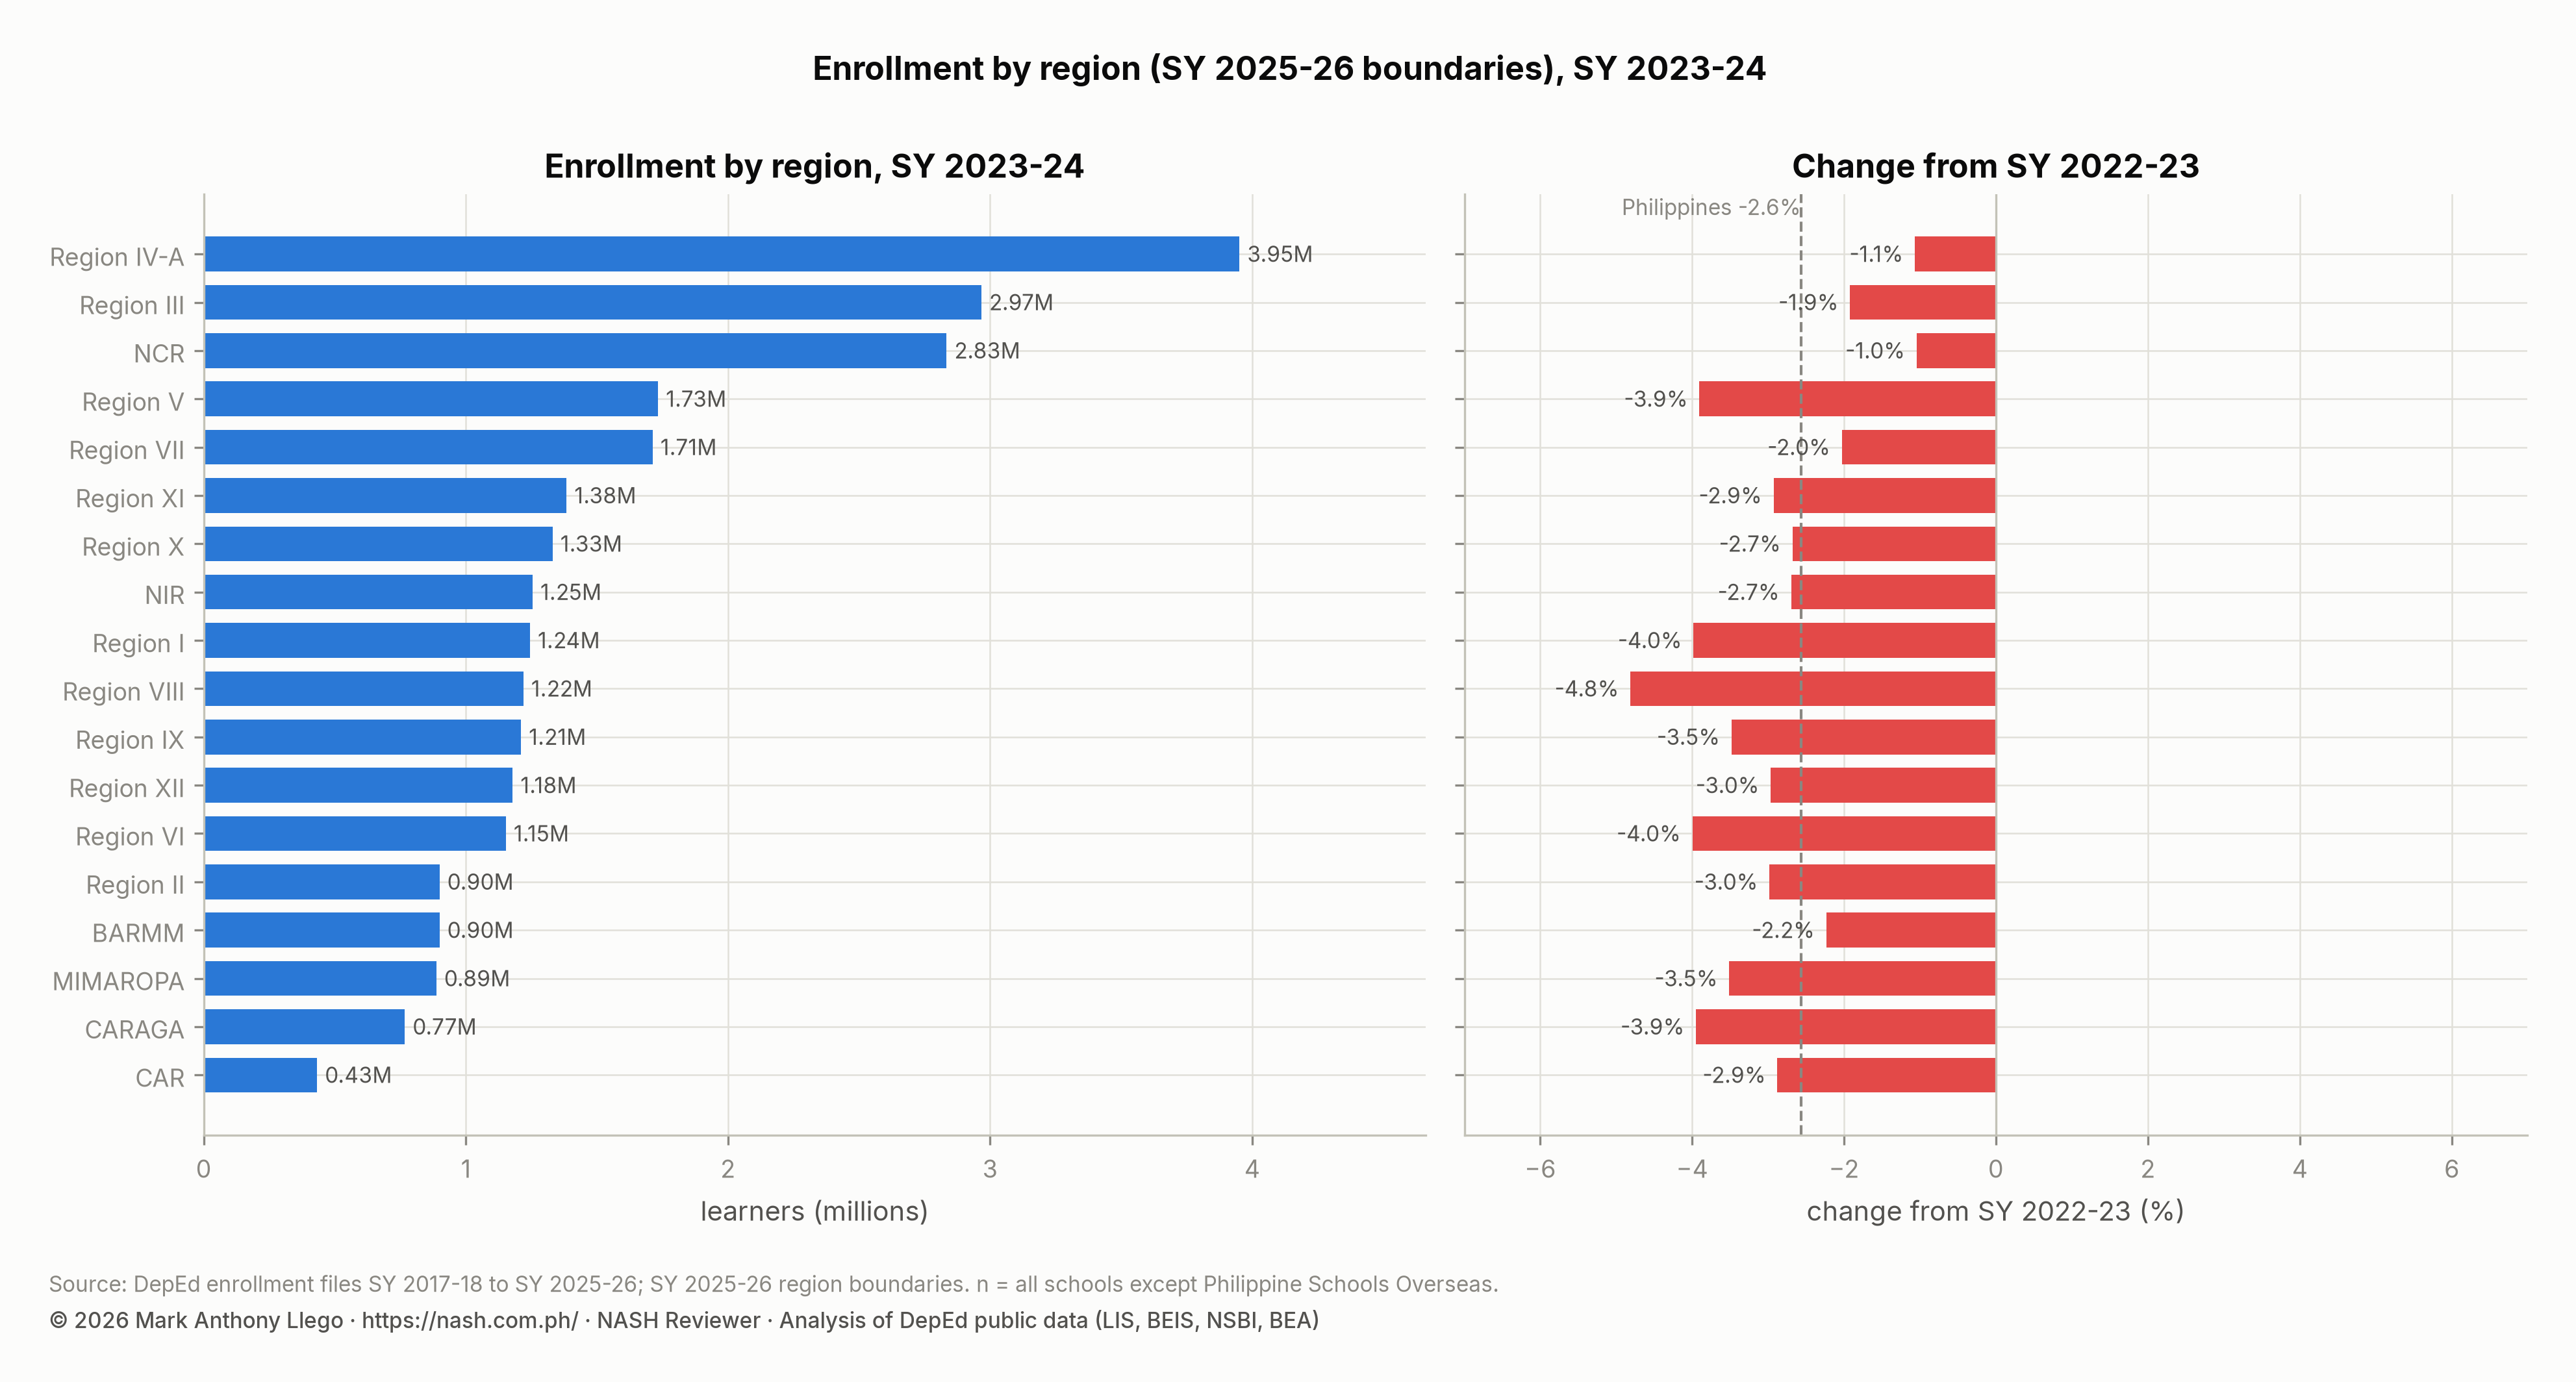
For the first time in the series, no region grew. Even BARMM, which had grown in every year except the first pandemic year, lost 2.2%. The declines were smallest in the three largest regions: NCR (−1.0%), Region IV-A (−1.1%) and Region III (−1.9%). They were largest in Region VIII (−4.8%), Region VI (−4.0%), Region I (−4.0%), Region V (−3.9%) and CARAGA (−3.9%). Region V lost the most learners, 70,393, followed by Region VIII with 61,627. The regions that had been shrinking since before the pandemic were now shrinking fastest, and the regions that had been growing had stopped.
Public and private school enrollment: public loses 811,000, private gains 104,000
| Sector | Schools | Learners | Share of learners | Kindergarten | Elementary (K to 6) | Junior high | Senior high | Schools, SY 2022-23 | Learners, SY 2022-23 | Change (%) |
|---|---|---|---|---|---|---|---|---|---|---|
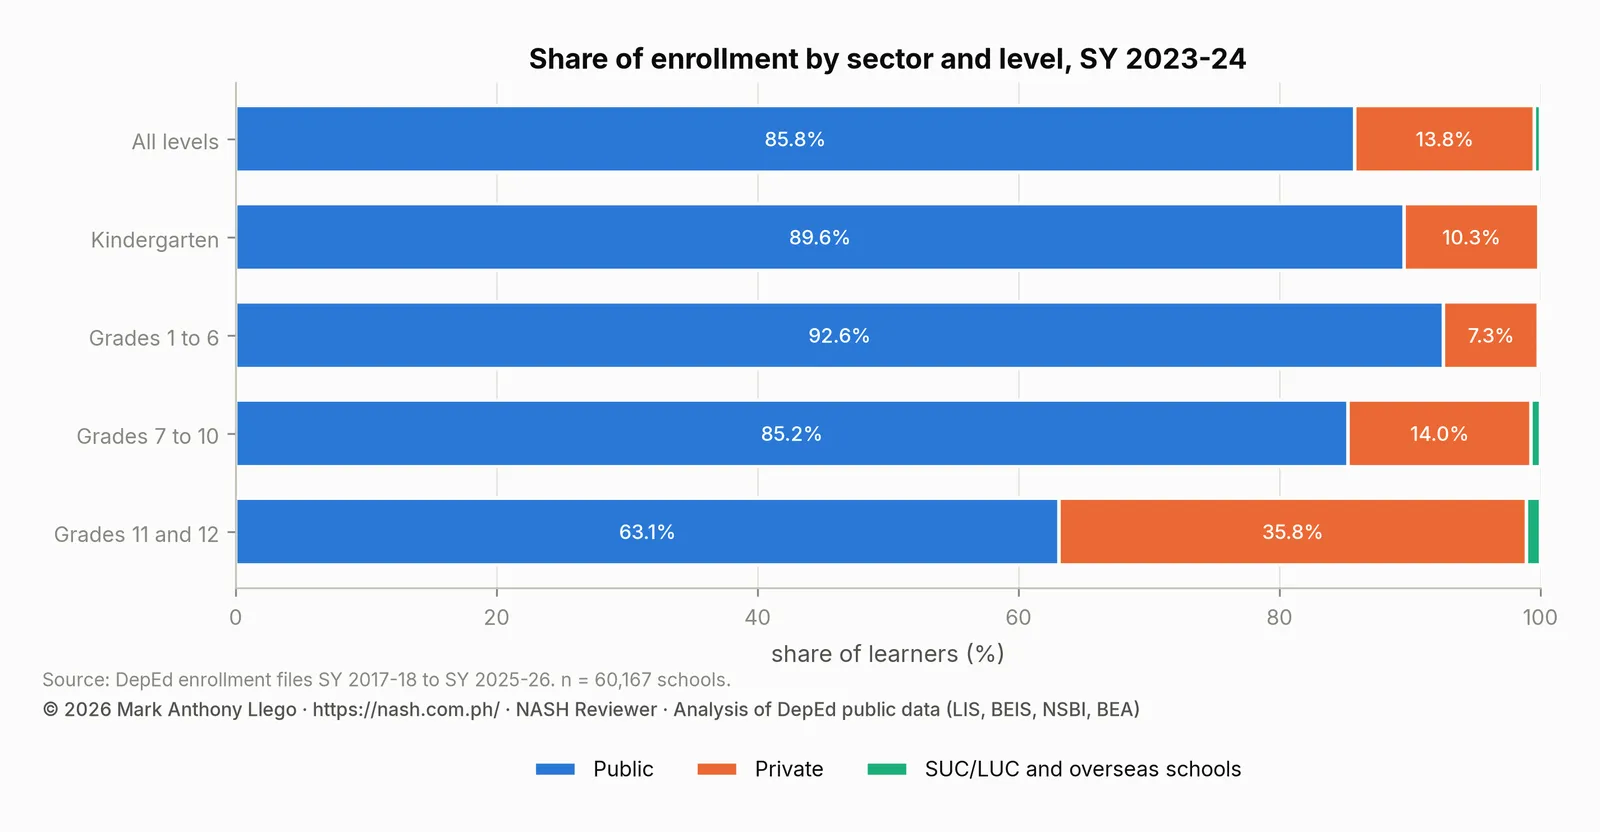
| Public | 47,818 | 23,225,427 | 85.8% | 1,833,526 | 14,013,242 | 6,605,539 | 2,606,646 | 47,678 | 24,036,251 | -3.4% |
| Private | 12,113 | 3,731,936 | 13.8% | 210,769 | 1,164,739 | 1,088,660 | 1,478,537 | 12,212 | 3,627,506 | +2.9% |
| SUC/LUC laboratory schools | 203 | 100,481 | 0.4% | 1,061 | 10,066 | 47,783 | 42,632 | 215 | 109,314 | -8.1% |
| Philippine Schools Overseas | 33 | 23,448 | 0.1% | 2,000 | 13,904 | 7,283 | 2,261 | 32 | 21,211 | +10.5% |
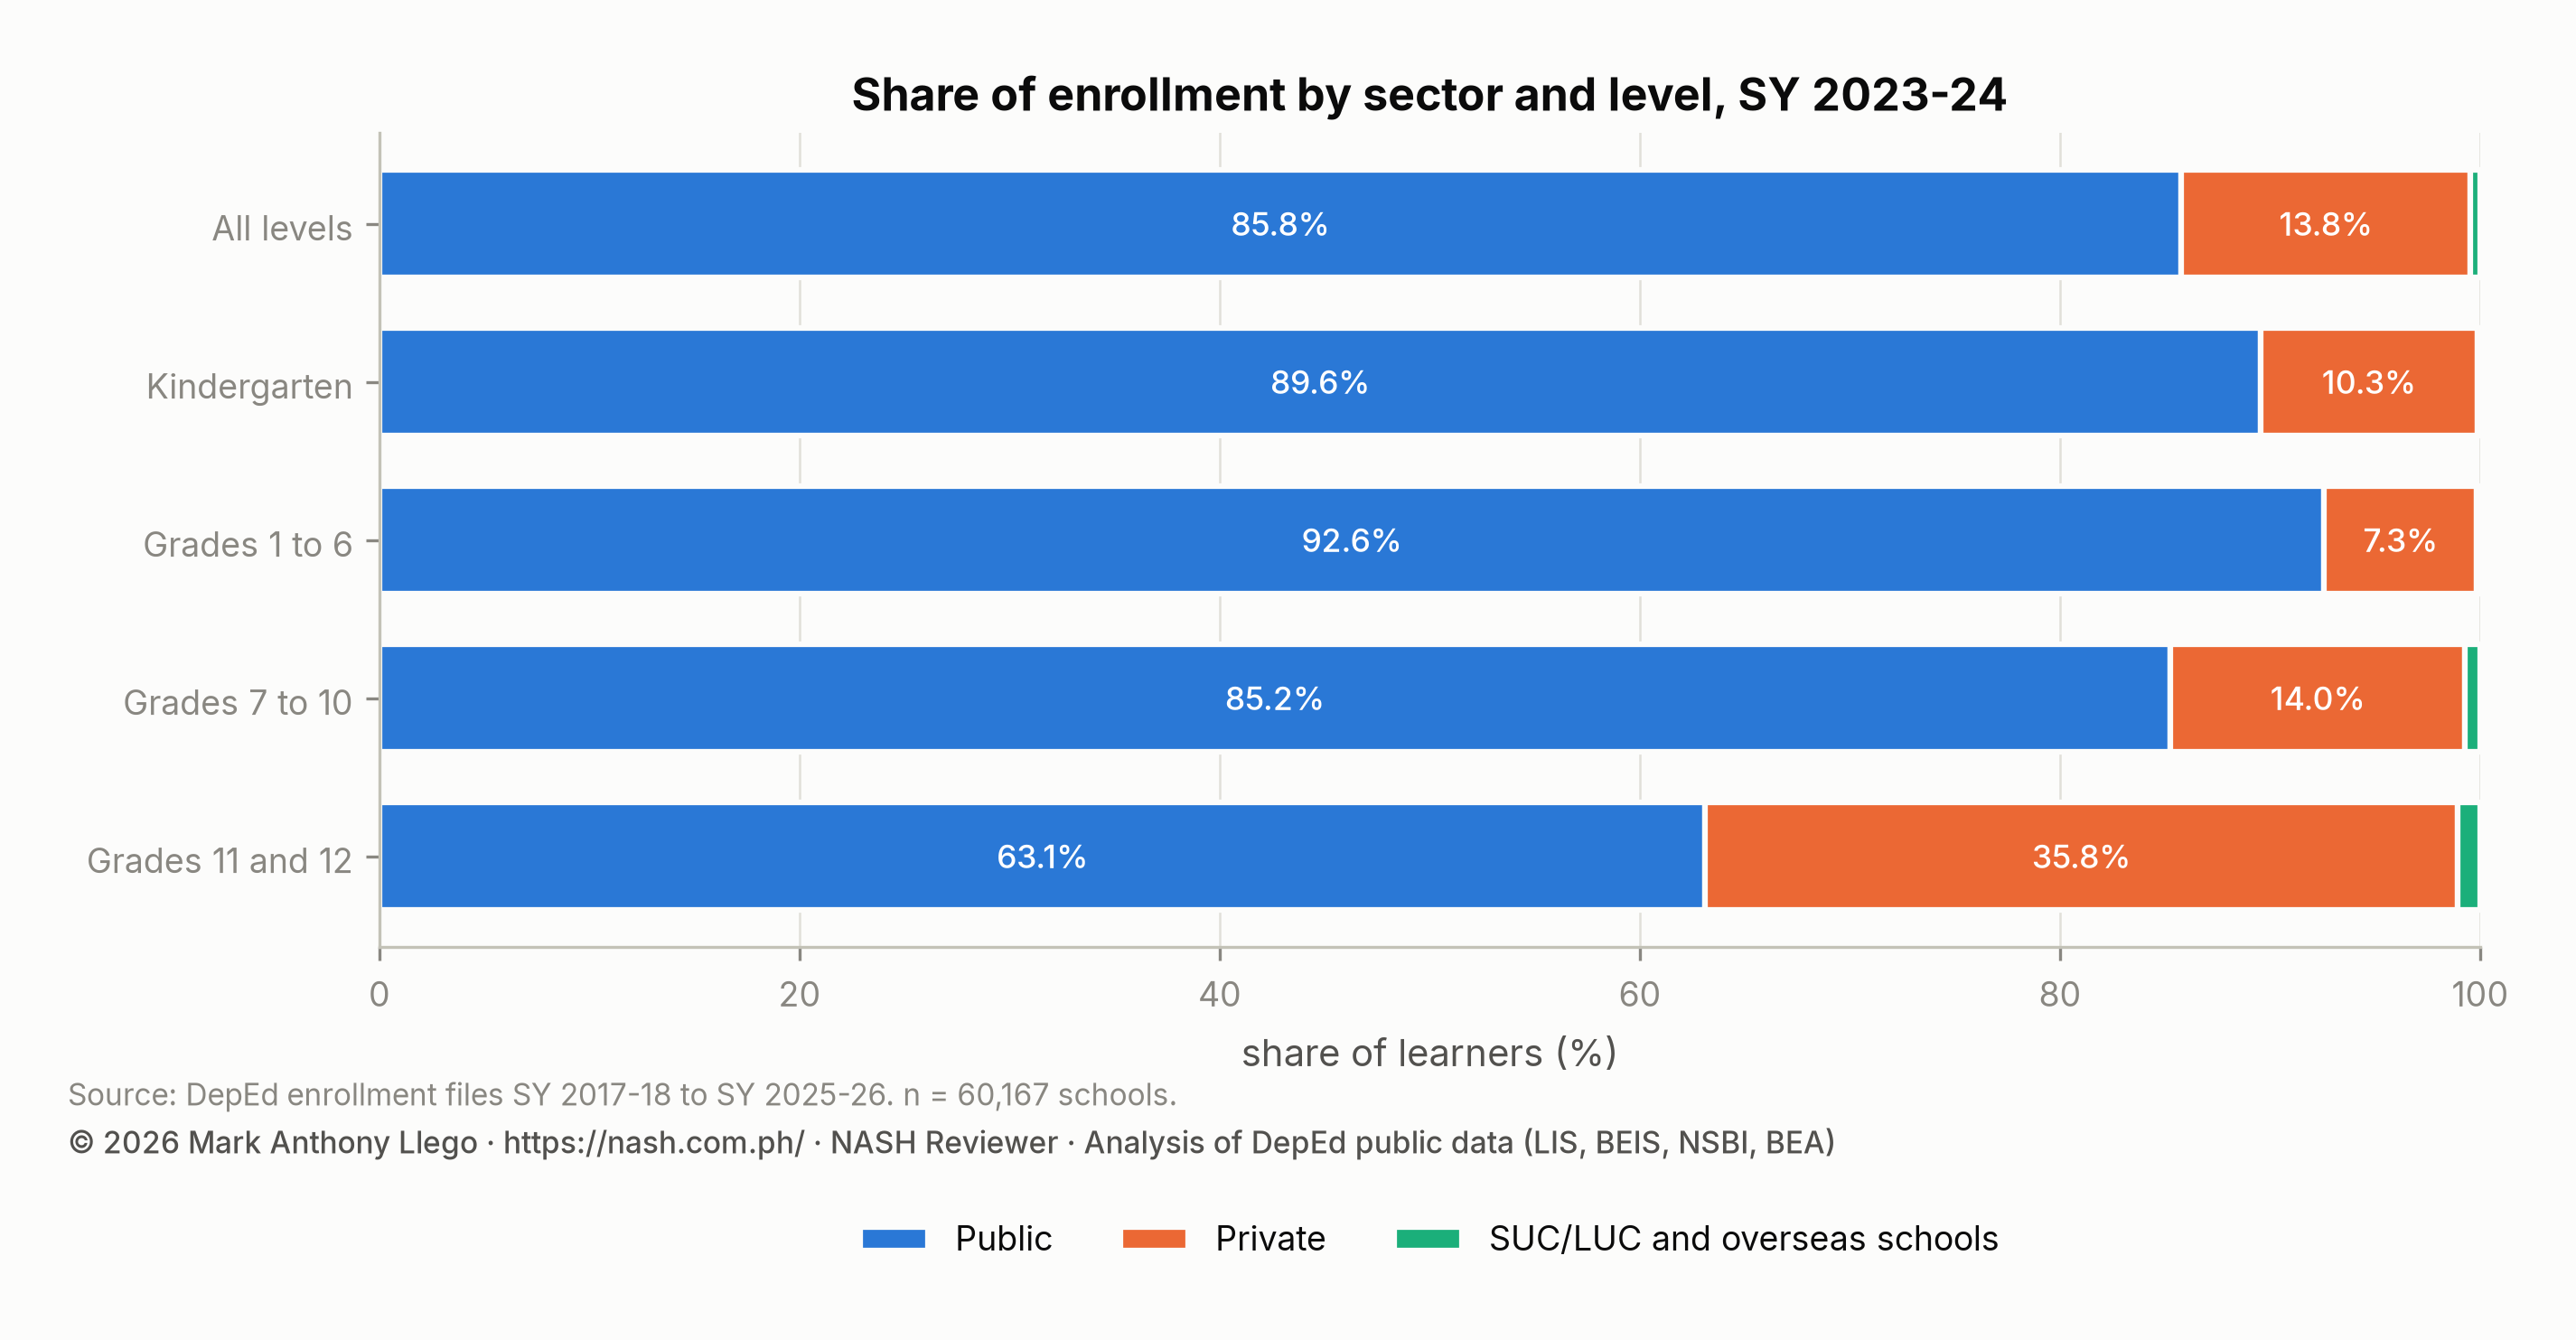
Public enrollment fell by 810,824 (−3.4%) to 23,225,427. That loss is larger than the national one because private enrollment rose by 104,430 (+2.9%) to 3,731,936. The private share of all learners rose to 13.8%, and the private share of kindergarten rose to 10.3%. Private kindergarten grew 9.1% in a year in which public kindergarten fell 6.2%. For a second year, families kept returning to private schools after the pandemic, and private schools kept regaining the youngest learners first.
Division changes: 43,947 learners move from Makati to Taguig
| Division | Region | Schools | Learners, SY 2023-24 | Learners, SY 2022-23 | Change | Change (%) | |
|---|---|---|---|---|---|---|---|
| Fastest growth | Taguig City and Pateros | NCR | 225 | 252,834 | 207,368 | +45,466 | +21.9% |
| Fastest growth | City of San Juan | NCR | 34 | 22,648 | 21,813 | +835 | +3.8% |
| Fastest growth | General Trias City | Region IV-A | 107 | 102,815 | 99,301 | +3,514 | +3.5% |
| Fastest growth | Maguindanao II | BARMM | 347 | 138,922 | 135,884 | +3,038 | +2.2% |
| Fastest growth | Tanauan City | Region IV-A | 91 | 57,955 | 57,162 | +793 | +1.4% |
| Steepest decline | Makati City | NCR | 84 | 52,881 | 96,828 | -43,947 | -45.4% |
| Steepest decline | Special Geographic Area Division | BARMM | 112 | 39,517 | 42,937 | -3,420 | -8.0% |
| Steepest decline | Davao Occidental | Region XI | 225 | 80,323 | 87,144 | -6,821 | -7.8% |
| Steepest decline | Cavite City | Region IV-A | 28 | 21,686 | 23,255 | -1,569 | -6.7% |
| Steepest decline | Bayugan City | CARAGA | 85 | 33,211 | 35,471 | -2,260 | -6.4% |
The division table shows Taguig City and Pateros growing by 21.9%, or 45,466 learners. It shows Makati City shrinking by 45.4%, or 43,947 learners. Neither is a real enrollment change. The Supreme Court ruled on the boundary between Makati and Taguig, and ten barangays passed from Makati to Taguig. Their schools were transferred between the two divisions in this school year, and the learners went with them. Makati City’s division had 118 schools and 96,828 learners in SY 2022-2023. In this file it had 84 schools and 52,881 learners.
Two other divisions appear in the file for the first time. Sto. Tomas City (41,365 learners) was separated from Batangas, whose enrollment fell 11.2% as a result. Canlaon City (15,472 learners) was separated from Negros Oriental, which fell 9.8%. Both parent divisions are left out of the ranking. The two largest divisions were Cebu (626,725) and Quezon City (617,326), which regained second place from Bulacan.
Senior high school strands: GAS down 15.5%, STEM up 9.7%
| Track or strand | Learners | Share of senior high | SY 2022-23 | Change | Change (%) |
|---|---|---|---|---|---|
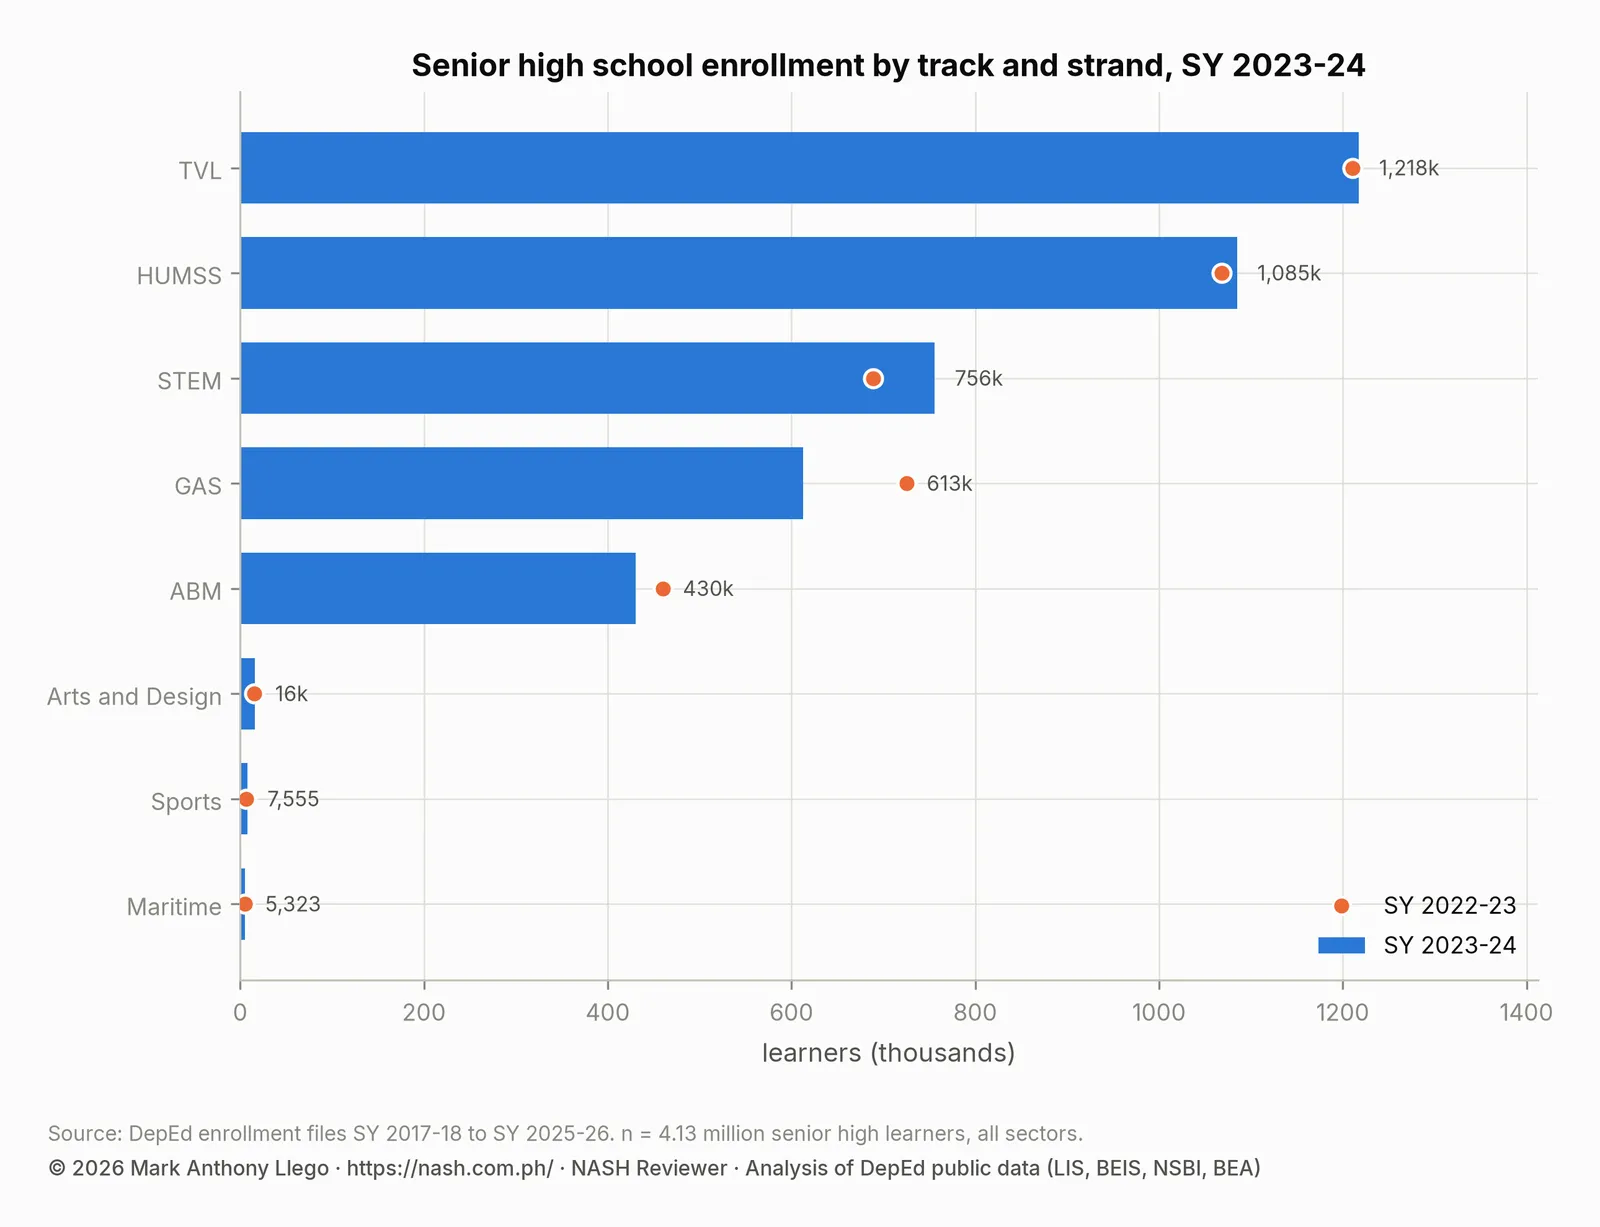
| TVL | 1,217,552 | 29.5% | 1,210,330 | +7,222 | +0.6% |
| HUMSS | 1,084,937 | 26.3% | 1,068,169 | +16,768 | +1.6% |
| STEM | 755,710 | 18.3% | 688,983 | +66,727 | +9.7% |
| GAS | 612,507 | 14.8% | 725,231 | -112,724 | -15.5% |
| ABM | 430,462 | 10.4% | 459,753 | -29,291 | -6.4% |
| Arts and Design | 16,030 | 0.4% | 15,269 | +761 | +5.0% |
| Sports | 7,555 | 0.2% | 6,674 | +881 | +13.2% |
| Maritime | 5,323 | 0.1% | 5,235 | +88 | +1.7% |
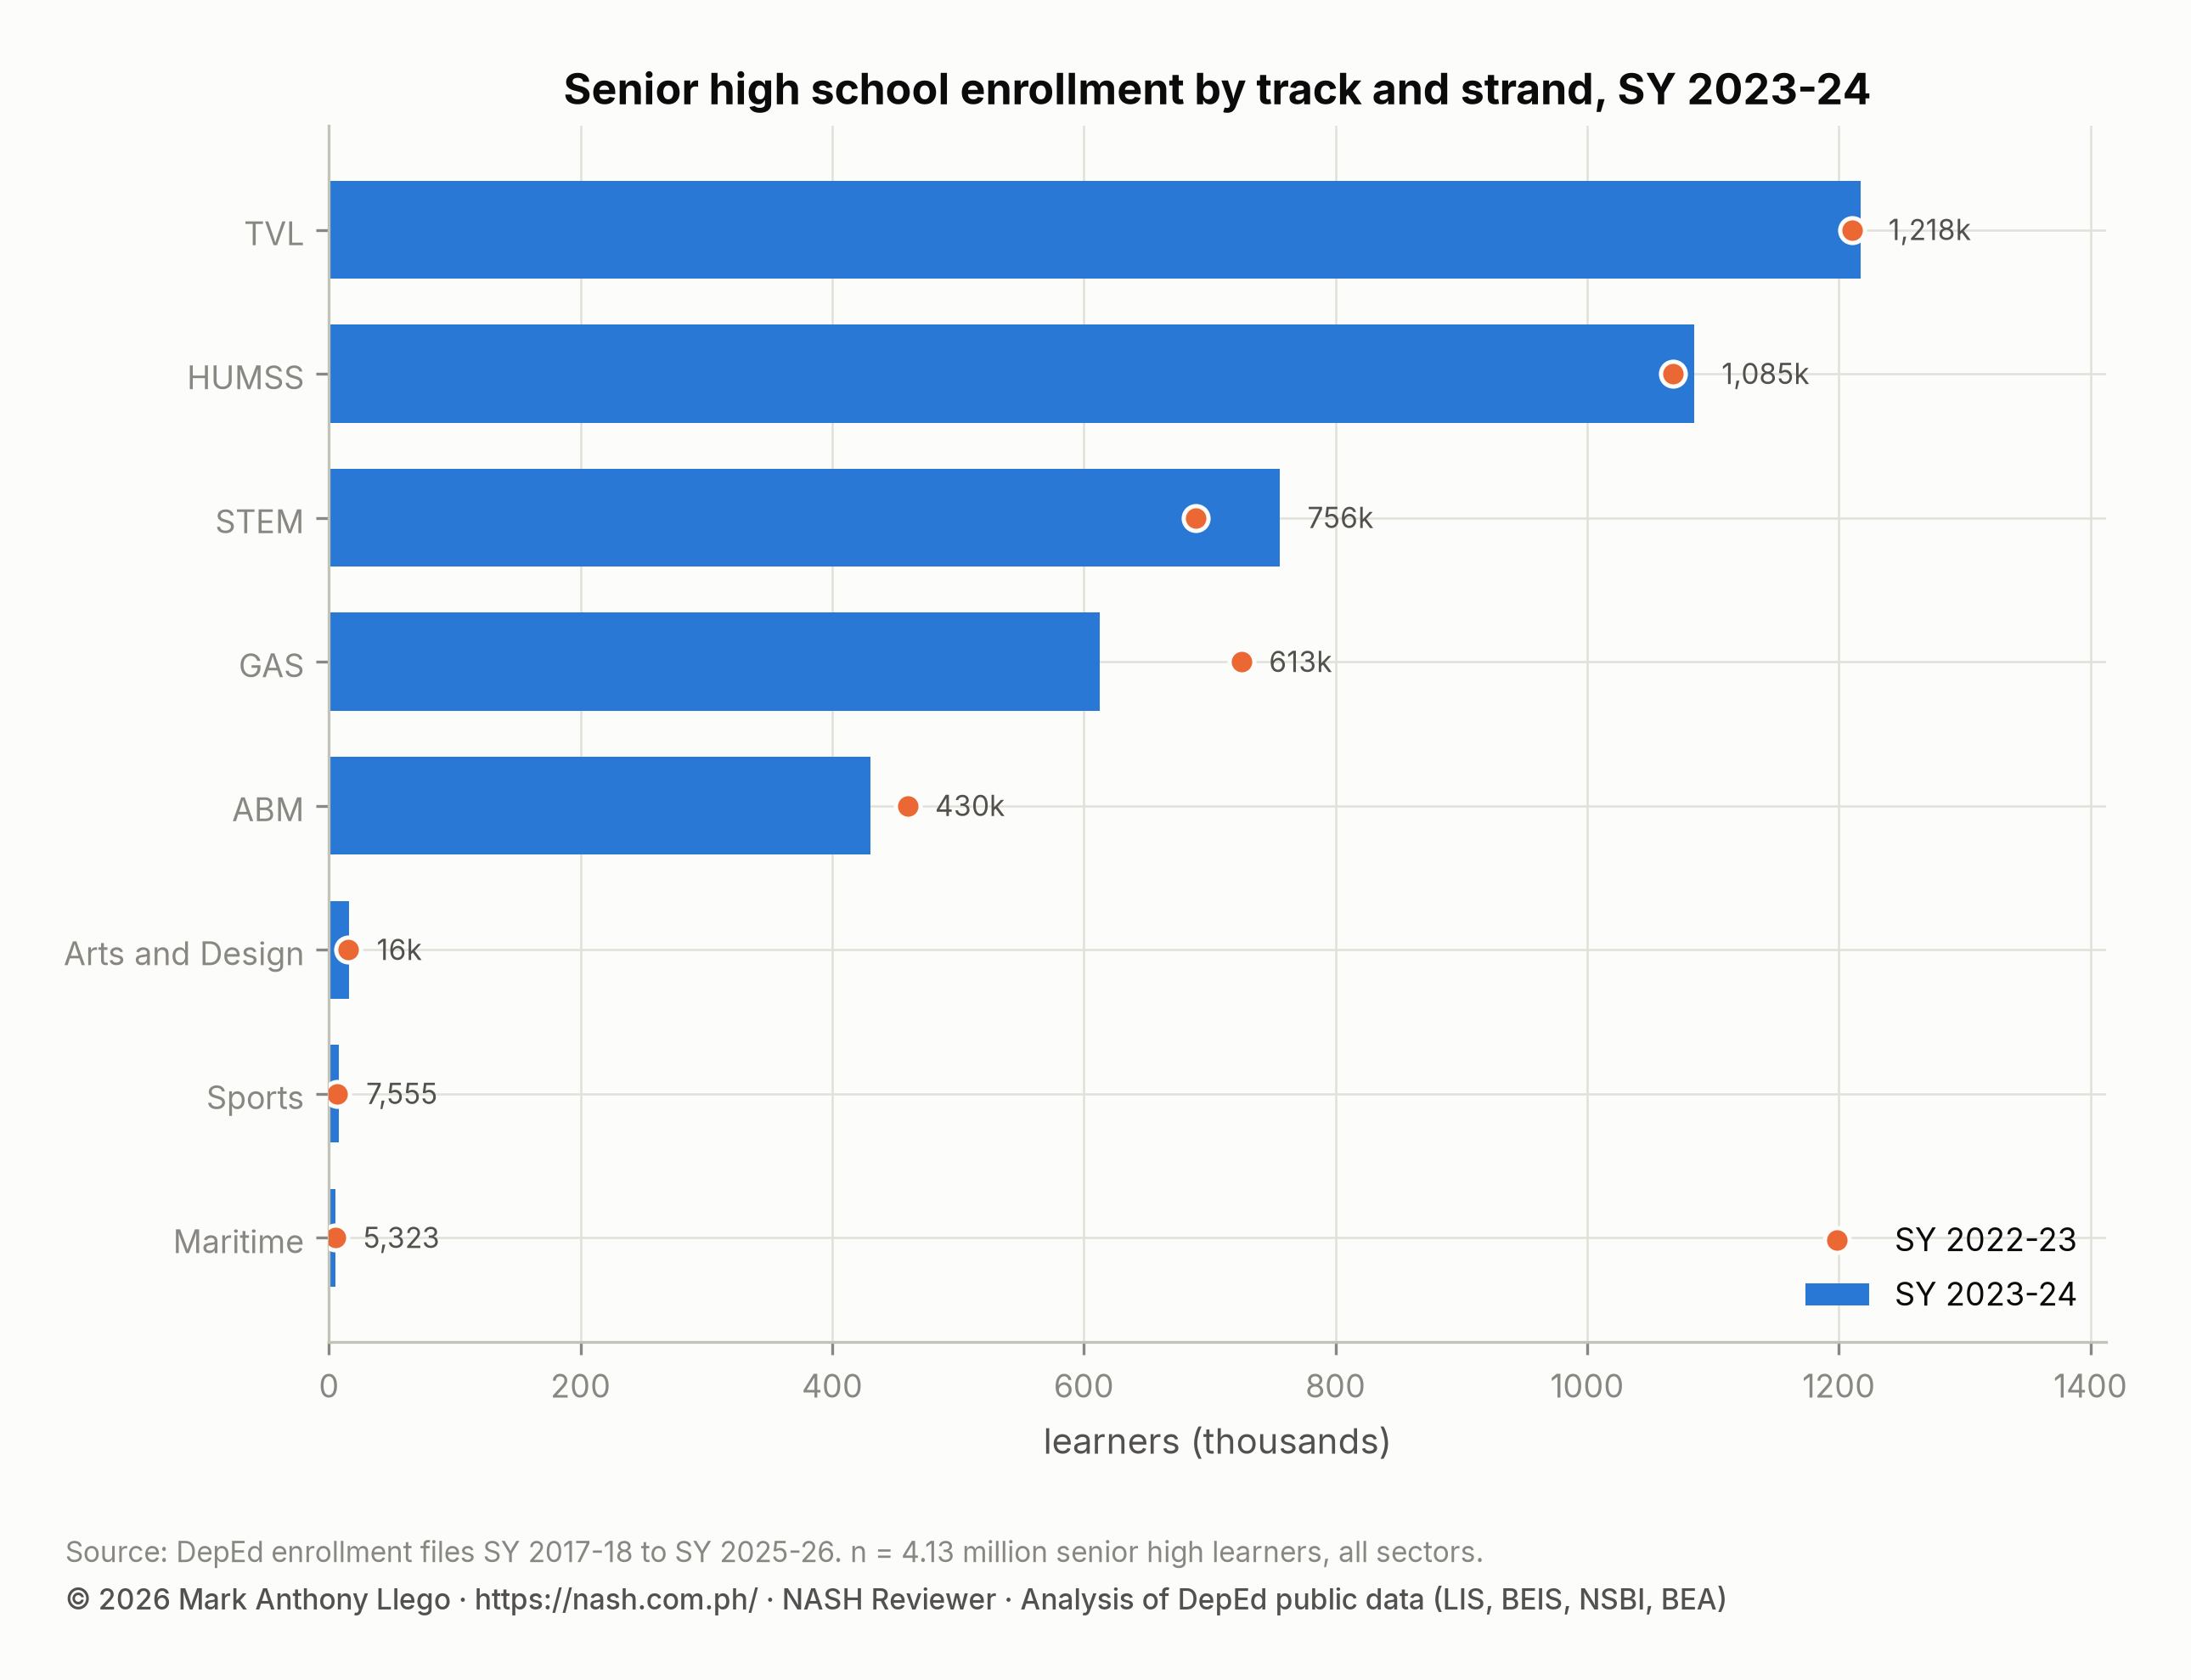
Senior high was only slightly smaller, so the strand table mostly shows learners moving between strands. The General Academic Strand (GAS) lost 112,724 learners (−15.5%), by far the largest change, and Accountancy, Business and Management (ABM) lost 6.4%. Science, Technology, Engineering and Mathematics (STEM) gained 66,727 (+9.7%) to 755,710. Technical-Vocational-Livelihood (TVL) grew 0.6% to 1,217,552, its highest count in the series, and Humanities and Social Sciences (HUMSS) grew 1.6% to its second highest. GAS is the strand for learners who have not chosen a specialization. The shift away from it continued in the next two files until GAS was the smallest of the five major strands.
Number of schools and school size
The file lists 60,167 schools, 30 more than the year before, of which 115 report zero learners. Private schools numbered 12,113, the fewest to that point, even though private enrollment was rising. The median private school had 116 learners, larger than before the pandemic, and the median public school had 232. Schools with more than 2,000 learners numbered 2,319, down from 2,414 at the peak. They held 29.9% of all learners. New this year were 431 public schools and 295 private ones. Another 204 public and 404 private schools in this file are absent from the next.
| Learners per school | Schools | Share of schools | Learners | Share of learners | Public schools | Share of public schools | Private schools | Share of private schools |
|---|---|---|---|---|---|---|---|---|
| 1–50 | 6,119 | 10.2% | 167,593 | 0.6% | 2,632 | 5.5% | 3,463 | 28.6% |
| 51–100 | 8,041 | 13.4% | 611,080 | 2.3% | 5,902 | 12.3% | 2,128 | 17.6% |
| 101–200 | 14,768 | 24.5% | 2,171,511 | 8.0% | 12,528 | 26.2% | 2,200 | 18.2% |
| 201–500 | 17,693 | 29.4% | 5,616,060 | 20.7% | 15,289 | 32.0% | 2,333 | 19.3% |
| 501–1,000 | 7,388 | 12.3% | 5,117,264 | 18.9% | 6,185 | 12.9% | 1,144 | 9.4% |
| 1,001–2,000 | 3,839 | 6.4% | 5,305,101 | 19.6% | 3,248 | 6.8% | 568 | 4.7% |
| over 2,000 | 2,319 | 3.9% | 8,092,683 | 29.9% | 2,034 | 4.3% | 277 | 2.3% |
Notes on reading the SY 2023-2024 file
- DepEd’s learner, personnel, facilities, ICT and WASH files cover the same school year and share this file’s school IDs. The school master file in the data release joins them.
- The division table shows Makati City and Taguig City and Pateros as the file records them. The transfer between them is administrative, not a change in enrollment.
- Batangas and Negros Oriental are left out of the division ranking because new divisions were separated from them this year.
- Regions are on SY 2025-2026 boundaries: Sulu’s 469 schools are counted under Region IX, and the Negros divisions under NIR.
Frequently asked questions
Why did DepEd enrollment fall in SY 2023-2024?
Enrollment fell by 712,990 learners (−2.6%) for two reasons. The small cohort that entered Grade 1 in SY 2017-2018 reached junior high school, where Grade 7 fell 11.3%, and kindergarten and Grade 1 intakes were falling. Public enrollment fell 810,824 while private enrollment rose 104,430.
Did every region lose learners in SY 2023-2024?
Yes. All 18 regions lost learners, for the first time in the series. The losses ranged from 1.0% in NCR to 4.8% in Region VIII, and BARMM lost 2.2%.
Why does Makati City show a 45% drop in enrollment in SY 2023-2024?
Makati City shows the drop because the schools of the ten barangays transferred from Makati to Taguig were moved between the two divisions this year. Taguig City and Pateros gained 45,466 learners and Makati City lost 43,947.
Download the data
The cleaned, harmonized DepEd files behind this series are free to download in CSV and Parquet, with a codebook and checksums, under the terms of use set out in the release. Download Cleaned DepEd School Data, SY 2017-18 to 2025-26 documents every file and column. The files themselves are at data.nash.com.ph, starting with the README, the SY 2023-24 school master file (CSV, 8.0 MB) and the nine-year enrollment panel (Parquet, 17.2 MB).
More in this series
- Previous year: DepEd Enrollment SY 2022-2023: The Peak at 27.8 Million
- Next year: DepEd Enrollment SY 2024-2025: Smallest Kindergarten Class
- The nine-year overview: DepEd Enrollment Trends SY 2017-2018 to SY 2025-2026
- All nine annual reports: SY 2017-18, SY 2018-19, SY 2019-20, SY 2020-21, SY 2021-22, SY 2022-23, SY 2023-24, SY 2024-25, SY 2025-26
- DepEd Data for Aspiring School Heads: Where to Start
- For aspiring school heads: How to Read DepEd Data and the full report, Philippine basic education in numbers
Analysis and charts by Mark Anthony Llego for NASH Reviewer. Data: Department of Education enrollment datasets for SY 2022-23 and SY 2023-24 (Learner Information System). Charts may be reused only with written permission from support@nash.com.ph.