DepEd’s WASH (water, sanitation and hygiene) and Utilities dataset for SY 2023-2024 shows how many learners share each toilet in public schools, and how many schools have handwashing facilities, water, electricity and internet. It covers the 47,814 public schools with learners, by region and by level.
For every public school, the file records functional and non-functional toilet bowls by level and by attachment, group and individual handwashing facilities with and without soap, and water outlets and faucets. It also records whether each level reports a water supply, grid or off-grid electricity, and internet for instruction and administration. These are the items a school improvement plan mentions least and a learner notices first.
The companion report, Philippine basic education in numbers, holds the method notes and the data behind every chart.
Key findings
- 836,572 functional toilet bowls serve 23.2 million learners, or 27.5 learners per bowl by DepEd’s definition. The median school has 21.7. BARMM (50.5) and NCR (47.6) have twice the ratio of CAR, Region I and Region II (about 20).
- 1,360 public schools (2.8%) report no functional toilet bowl at all. They are small schools: together they hold 1.1% of learners. In BARMM, 19.1% of schools have none, and in Region IX, 8.6%.
- 11.1% of all toilet bowls are non-functional (104,058 bowls). BARMM (17.6%), Region IX and Region XI (14.0%) have the highest shares, and Region VI (7.0%) the lowest.
- Public schools have 3.3 functional handwashing facilities per 100 learners, and 94.7% of the elementary ones have soap. Region VI (5.4 per 100) has three times NCR’s rate (1.8).
- Water and electricity are nearly universal: 98% of learners attend a school that reports each. Internet reaches 90% of learners but only 78% of schools. The unconnected schools are small, rural and concentrated in Region IX, Region V and MIMAROPA.
Learners per toilet bowl in public schools
DepEd’s toilet-bowl-learner ratio is total enrollment divided by functional toilet bowls. The count includes male, female, PWD and shared bowls, attached and standalone, at every level. Public schools report 836,572 functional bowls and 104,058 non-functional ones.
The national ratio is 27.5 learners per functional bowl. The median school has 21.7, and 5% of schools have more than 86.
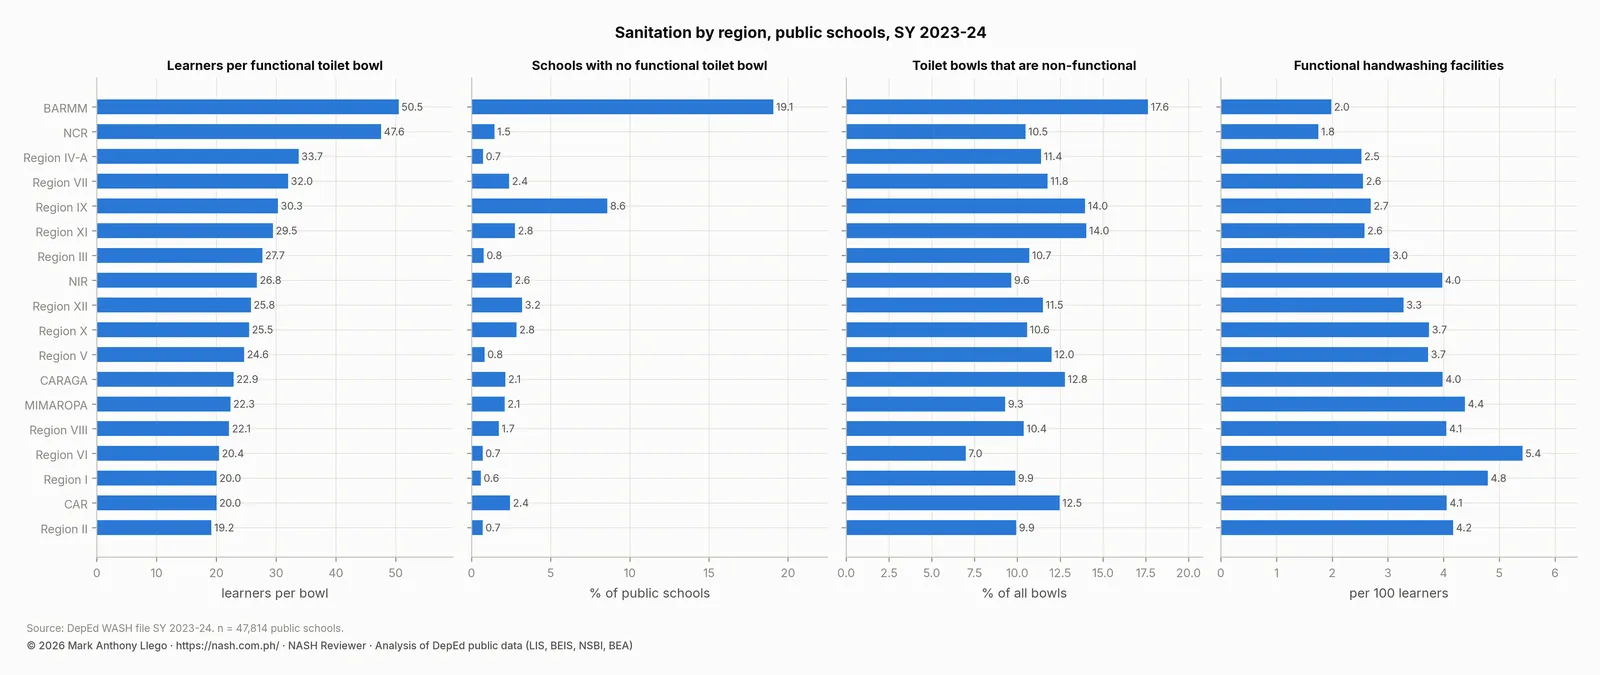
Two regions have far higher ratios than the rest. BARMM has 50.5 learners per bowl, 19.1% of its schools have no functional bowl, and 17.6% of its bowls are out of service. NCR has 47.6 learners per bowl for the opposite reason: its schools are very large, so almost every school has toilets (only 1.5% have none) but still too few of them.
Region IV-A (33.7), Region VII (32.0) and Region IX (30.3) come next. Region II (19.2), CAR (20.0) and Region I (20.0) have the most bowls per learner.
| Region | Learners per functional toilet bowl | Schools with no functional bowl | Bowls that are non-functional | Handwashing facilities per 100 learners | ES handwashing facilities with soap | Learners with water | Learners with electricity | Learners with internet | Schools with internet |
|---|---|---|---|---|---|---|---|---|---|
| BARMM | 50.5 | 19.1% | 17.6% | 2 | 91.6% | 95.6% | 94.1% | 79.4% | 73.8% |
| CAR | 20 | 2.4% | 12.5% | 4.1 | 91.0% | 99.8% | 99.0% | 85.1% | 71.5% |
| CARAGA | 22.9 | 2.1% | 12.8% | 4 | 93.6% | 99.0% | 99.3% | 92.0% | 83.5% |
| MIMAROPA | 22.3 | 2.1% | 9.3% | 4.4 | 95.1% | 96.3% | 96.4% | 78.7% | 69.1% |
| NCR | 47.6 | 1.5% | 10.5% | 1.8 | 95.1% | 97.0% | 96.9% | 97.7% | 97.8% |
| NIR | 26.8 | 2.6% | 9.6% | 4 | 96.7% | 99.1% | 99.1% | 87.4% | 72.3% |
| Region I | 20 | 0.6% | 9.9% | 4.8 | 95.5% | 99.3% | 99.3% | 97.5% | 93.2% |
| Region II | 19.2 | 0.7% | 9.9% | 4.2 | 93.3% | 98.9% | 99.1% | 95.7% | 91.7% |
| Region III | 27.7 | 0.8% | 10.7% | 3 | 94.1% | 99.2% | 99.0% | 98.4% | 95.0% |
| Region IV-A | 33.7 | 0.7% | 11.4% | 2.5 | 95.9% | 98.6% | 98.9% | 96.5% | 87.9% |
| Region IX | 30.3 | 8.6% | 14.0% | 2.7 | 92.6% | 95.1% | 95.7% | 77.7% | 62.3% |
| Region V | 24.6 | 0.8% | 12.0% | 3.7 | 95.0% | 98.9% | 98.8% | 79.6% | 63.4% |
| Region VI | 20.4 | 0.7% | 7.0% | 5.4 | 96.6% | 99.4% | 99.6% | 89.1% | 75.8% |
| Region VII | 32 | 2.4% | 11.8% | 2.6 | 92.5% | 98.6% | 98.7% | 93.5% | 82.6% |
| Region VIII | 22.1 | 1.7% | 10.4% | 4.1 | 95.3% | 98.9% | 99.3% | 85.5% | 72.6% |
| Region X | 25.5 | 2.8% | 10.6% | 3.7 | 95.9% | 98.9% | 98.5% | 87.2% | 73.8% |
| Region XI | 29.5 | 2.8% | 14.0% | 2.6 | 93.4% | 99.3% | 99.4% | 88.4% | 73.2% |
| Region XII | 25.8 | 3.2% | 11.5% | 3.3 | 92.3% | 96.5% | 96.4% | 86.7% | 76.3% |
| Philippines (public) | 27.5 | 2.8% | 11.1% | 3.3 | 94.7% | 98.3% | 98.3% | 90.4% | 78.1% |
The 1,360 schools with no functional bowl are the clearest single target in the file. They are mostly small schools: 2.8% of schools but 1.1% of learners.
Handwashing facilities and soap
The file counts two kinds of handwashing facility. Group facilities serve supervised handwashing or toothbrushing, for at least 10 learners in elementary schools. Individual facilities stand in classrooms or near toilets or canteens. Each is recorded as functional with soap, functional without soap, or non-functional.
Public schools report 722,457 functional facilities, or 3.3 per 100 learners, and 94.7% of the elementary ones have soap. Region VI (5.4 per 100), Region I (4.8) and MIMAROPA (4.4) are best supplied. NCR (1.8), BARMM (2.0), Region IV-A (2.5), Region VII (2.6) and Region XI (2.6) have the fewest, again the regions with large schools and BARMM.
In the five regions with test data, handwashing facilities per 100 learners are the one sanitation input with a positive association with Grade 3 Early Language, Literacy and Numeracy Assessment (ELLNA) scores: +0.7 points per standard deviation, borderline after adjustment. The most likely reason is that soap and sinks mark a well-run school, not that they raise scores. The analysis of school inputs and test results has the models.
Water, electricity and internet in public schools
Each level of a school reports whether it has a water supply, grid electricity, off-grid electricity and internet, and whether the internet is used for instruction and administration. This report counts a school as served when any level it offers reports the service.
On that count, 97.6% of public schools and 98.3% of learners have water. 97.4% of schools and 98.3% of learners have electricity, grid or off-grid. 78.1% of schools and 90.4% of learners have internet.
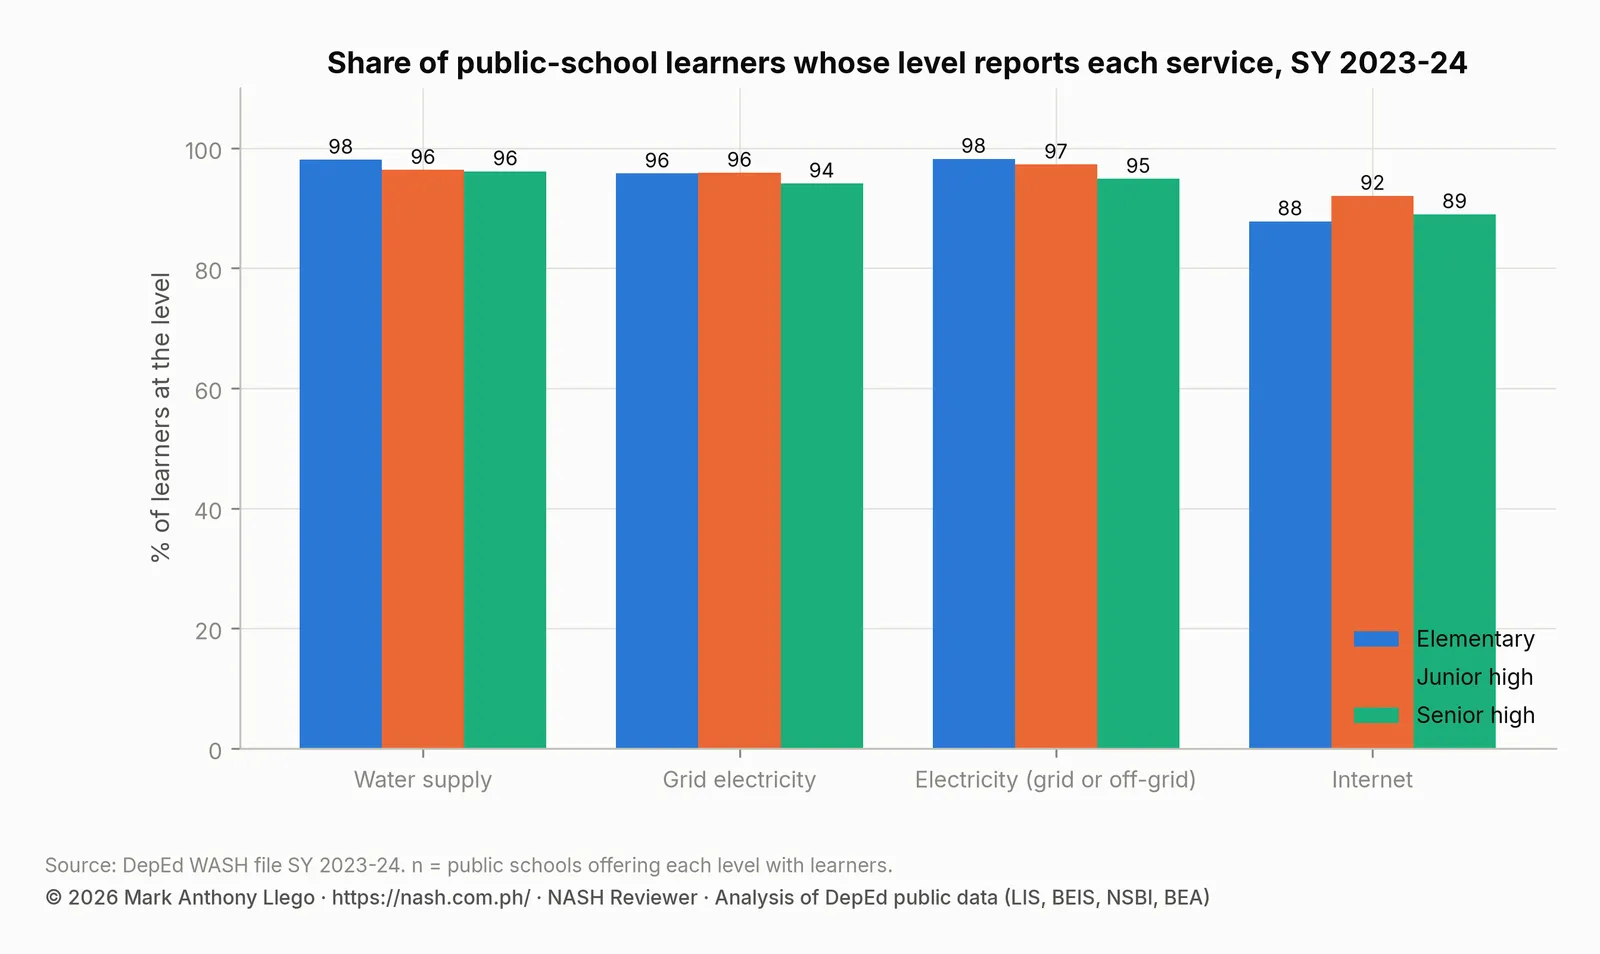
The gap between the share of schools and the share of learners shows that the unserved schools are small and remote: the 22% of schools without internet hold 10% of learners. Grid electricity reaches 91.9% of elementary schools, and off-grid supply (solar panels and generators) raises the total to 97.4%. By level, junior high schools are the best connected (81.3% of schools, 92.1% of learners) and elementary schools the least (76.2% of schools, 87.8% of learners).
| Level | Service | Schools | Share of schools | Share of learners |
|---|---|---|---|---|
| Elementary | Water supply | 39,340 | 97.6% | 98.1% |
| Elementary | Grid electricity | 39,340 | 91.9% | 95.8% |
| Elementary | Electricity (grid or off-grid) | 39,340 | 97.4% | 98.2% |
| Elementary | Internet | 39,340 | 76.2% | 87.8% |
| Junior high | Water supply | 10,550 | 93.4% | 96.4% |
| Junior high | Grid electricity | 10,550 | 91.9% | 95.9% |
| Junior high | Electricity (grid or off-grid) | 10,550 | 95.7% | 97.3% |
| Junior high | Internet | 10,550 | 81.3% | 92.1% |
| Senior high | Water supply | 7,687 | 95.4% | 96.1% |
| Senior high | Grid electricity | 7,687 | 92.0% | 94.1% |
| Senior high | Electricity (grid or off-grid) | 7,687 | 94.0% | 94.9% |
| Senior high | Internet | 7,687 | 80.0% | 89.0% |
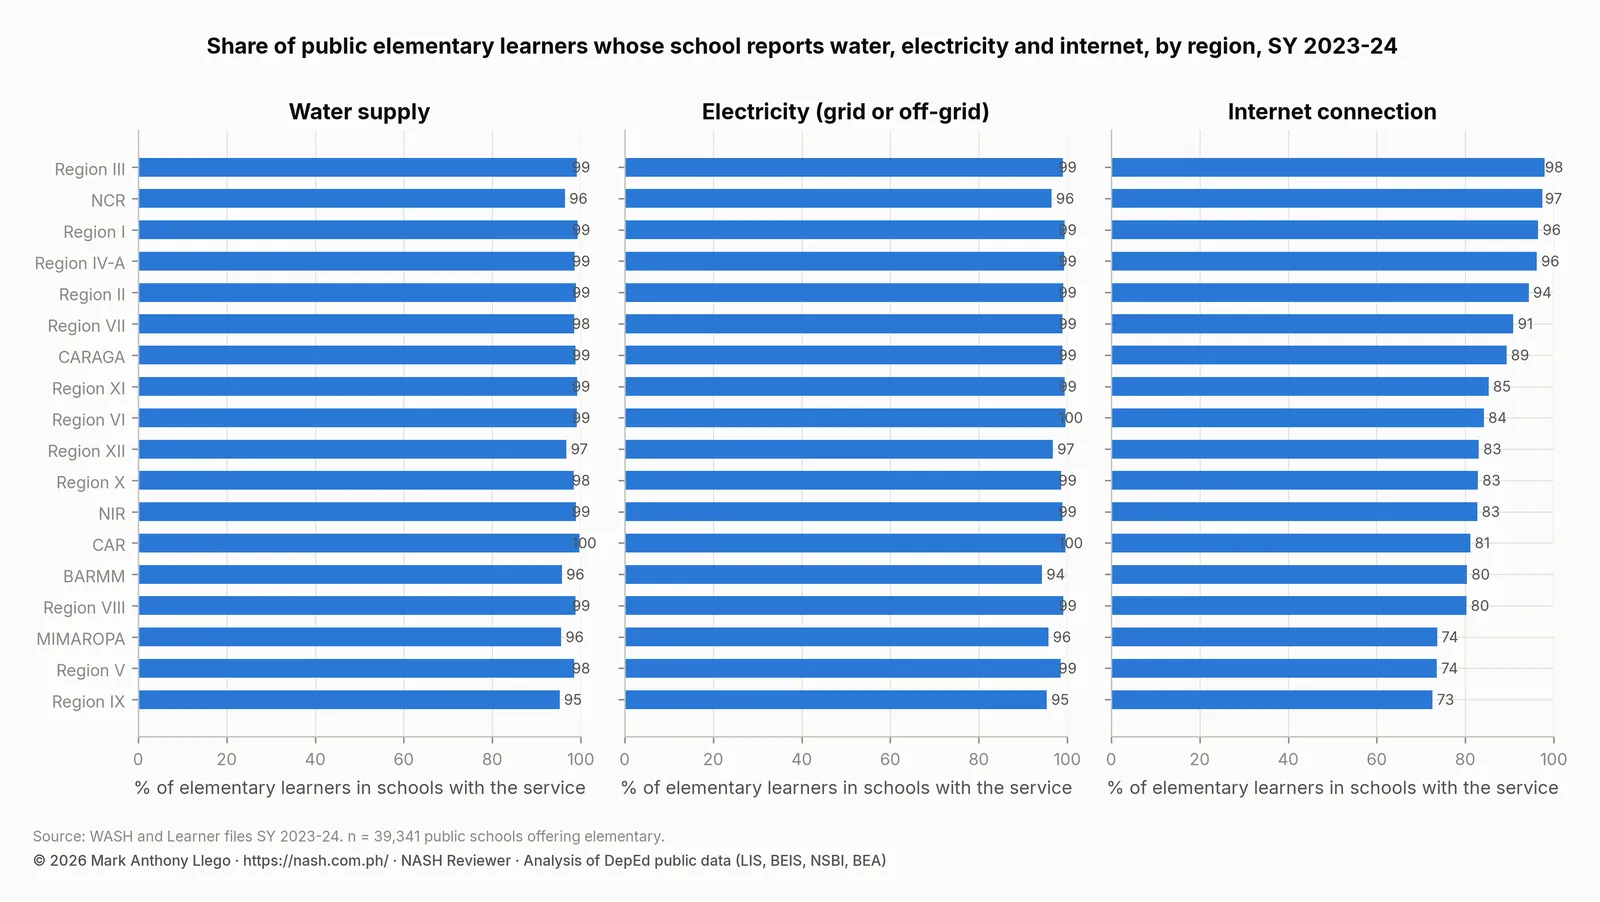
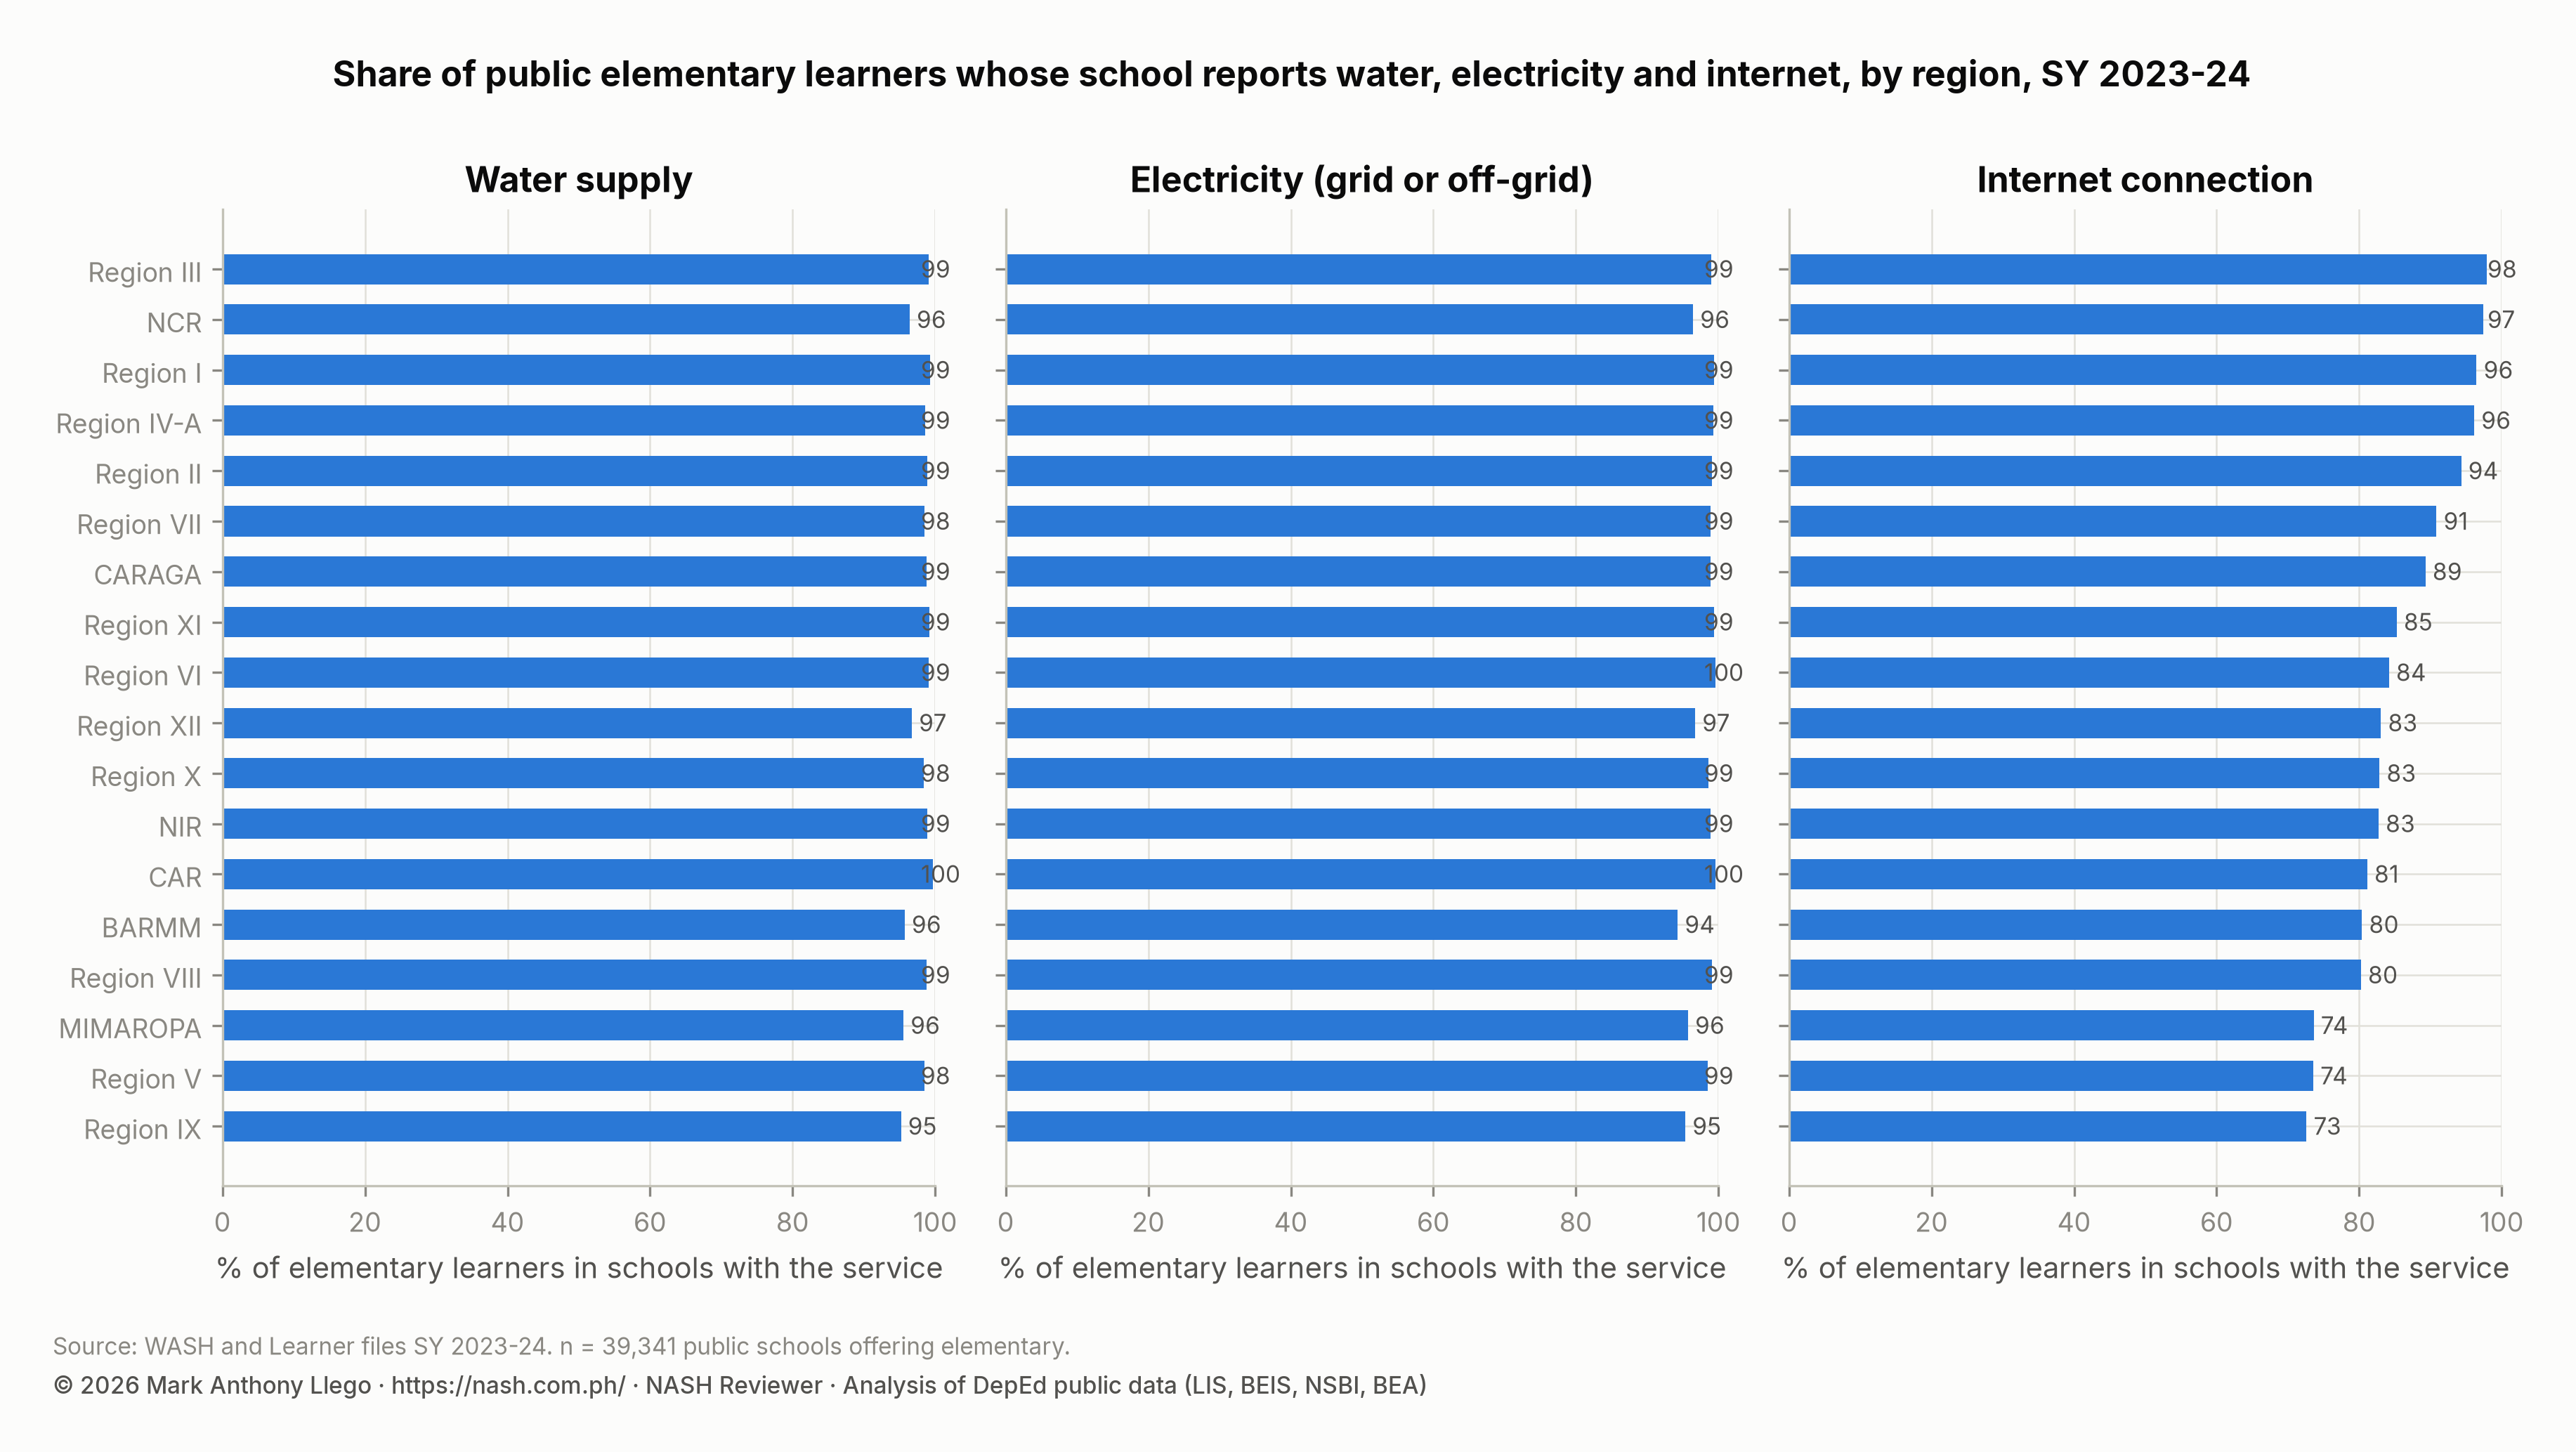
By region, water and electricity reach more than 94% of elementary learners everywhere. The lowest shares are in BARMM (96% water, 94% electricity) and Region IX (95% for both). Internet is where regions differ. It reaches 98% of elementary learners in Region III, 97% in NCR and 96% in Regions I and IV-A. It reaches only 73% in Region IX, 74% in Region V and MIMAROPA, and 80% in BARMM and Region VIII.
Internet access is also the one utility with a measurable association with results. A connected school scores about +2.6 Grade 6 National Achievement Test (NAT) points and has +1.5 percentage points more Grade 1 to 3 readers at grade level than an unconnected school in the same division.
| Indicator | Schools with data | Share of schools | Share of learners |
|---|---|---|---|
| water supply (ES) | 39,341 | 97.6% | 98.1% |
| electricity, grid or off-grid (ES) | 39,343 | 97.4% | 98.2% |
| internet (ES) | 39,341 | 76.2% | 87.7% |
| water supply (any level) | 47,813 | 97.6% | 98.3% |
| electricity (any level) | 47,813 | 97.4% | 98.3% |
| internet (any level) | 47,813 | 78.1% | 90.4% |
| at least one academic computer | 47,813 | 75.4% | 86.9% |
| no functional toilet bowl | 47,814 | 2.8% | 1.1% |
What this means for school heads
- The toilet ratio is a safety and attendance issue first. Girls’ attendance in particular depends on functional, private toilets. A school at 50 learners per bowl reaches 60 as soon as one bowl breaks.
- Treat non-functional bowls as work orders. One bowl in nine is out of service nationally, and one in six in BARMM. Repair is cheaper than construction, and the result appears in next year’s inventory.
- The data record whether soap is present. 94.7% of elementary handwashing facilities have soap. The 5% without soap are a supervision problem, not a budget problem.
- Internet is now the utility that separates schools. Water and electricity are nearly universal. The 22% of schools without internet, mostly small and rural, cannot use DepEd’s online systems and learning resources.
How these numbers were made
- Source: DepEd’s WASH and Utilities dataset for SY 2023-2024 (BEIS), joined to the learner file on school ID; public schools only.
- Functional toilet bowls = male + female + PWD + shared bowls, attached and standalone, for elementary, junior high and senior high. The learner-toilet ratio is total enrollment ÷ functional bowls for schools with both above zero; regional ratios are sums over sums.
- Handwashing facilities = group and individual facilities that are functional, with or without soap.
- Water, electricity and internet are the file’s yes/no fields per level; “any level” counts a school as served if any offered level reports the service; the elementary figures use the elementary field only.
- Shares of learners weight each school by its enrollment.
Limits
The file covers public schools only. It reports counts at the start of the school year as school heads entered them, so it does not say how many bowls are usable on a given day or where the water comes from. “Has internet” says nothing about speed or reliability. Three to four elementary schools that offer the level have a blank utility field and are treated as missing.
Frequently asked questions
How many learners share a toilet in DepEd public schools?
Public schools had 27.5 learners per functional toilet bowl in SY 2023-2024, by DepEd’s definition. The median school has 21.7. BARMM (50.5) and NCR (47.6) are the highest regions.
How many DepEd public schools have no toilet?
1,360 public schools, or 2.8%, reported no functional toilet bowl in SY 2023-2024. They hold 1.1% of learners. In BARMM, 19.1% of schools have none.
What share of DepEd public schools have internet?
78.1% of public schools, holding 90.4% of learners, reported an internet connection at some level in SY 2023-2024. Among elementary schools, it is 76.2% of schools and 87.8% of learners.
Download the data
The cleaned, harmonized DepEd files behind this series are free to download in CSV and Parquet, with a codebook and checksums, under the terms of use set out in the release. Download Cleaned DepEd School Data, SY 2017-18 to 2025-26 documents every file and column. The files themselves are at data.nash.com.ph, starting with the README, the SY 2023-24 school master file (CSV, 8.0 MB) and the nine-year enrollment panel (Parquet, 17.2 MB).
More in this series
- DepEd Enrollment Trends SY 2017-2018 to SY 2025-2026
- Enrollment by school year: SY 2017-18, SY 2018-19, SY 2019-20, SY 2020-21, SY 2021-22, SY 2022-23, SY 2023-24, SY 2024-25, SY 2025-26
- DepEd Learner Data SY 2023-2024: IP, ALIVE and School Size
- DepEd Teachers and School Personnel Data, SY 2023-2024
- DepEd Classroom and School Building Data, SY 2023-2024
- DepEd ICT Data SY 2023-2024: Computers and Internet
- NAT Grade 6 Results SY 2023-2024: DepEd Division Scores
- ELLNA Grade 3 Results SY 2023-2024: DepEd Division Scores
- CRLA Results SY 2025-2026: Reading Levels in Grades 1 to 3
- DepEd School Inputs vs Test Results: Multigrade and Internet
- DepEd Open Data Quality: Errors, Blanks and Coverage Limits
- Download Cleaned DepEd School Data, SY 2017-18 to 2025-26
- The full report: Philippine basic education in numbers
Guides for aspiring school heads
- DepEd Data for Aspiring School Heads: Where to Start
- NASH Practice Questions With Answers: 50 Items on the PPSSH
- How to Read DepEd Data: A Guide for Aspiring School Heads
- EDCOM II Final Report: Guide for Aspiring School Heads
- National Education Plan 2026-2035: Guide for School Heads
- NASH Study Guide: DepEd Memorandum 069, s. 2025 and PPSSH
- PPSSH Domain 1: Leading Strategically With DepEd Data
- PPSSH Domain 2: Managing School Operations With DepEd Data
- PPSSH Domain 3: Teaching and Learning With DepEd Data
- PPSSH Domain 4: Developing Self and Others With DepEd Data
- PPSSH Domain 5: Building Connections With DepEd Data
Analysis and charts by Mark Anthony Llego for NASH Reviewer. Data: Department of Education public datasets. Charts may be reused only with written permission from support@nash.com.ph.