Domain 5 of the Philippine Professional Standards for School Heads (PPSSH), Building Connections, has five strands. For teachers preparing for the National Assessment for School Heads (NASH, formerly the NQESH), each one at Career Stage 1 can be read with the Department of Education’s (DepEd) public learner, personnel and funding data, which show, for example, that Indigenous Peoples (IP) are 9.3% of public-school learners.
Domain 5 rests on the PPSSH’s second guiding principle: school heads “build and strengthen a network of organizational supports”. The PPSSH booklet, adopted by DepEd Order No. 024, s. 2020, says school heads in this domain “engage stakeholders in initiatives towards the improvement of school communities”. It says they “possess skills in relating with, dealing with, and in forging relationships with people” and are “committed in advocating that education is everyone’s responsibility”.
The Final Report of the Second Congressional Commission on Education (EDCOM II) makes the case that this domain is as demanding as the other four. Its evidence on learning says parental engagement independently reduces the risk of low performance. Its evidence on money says local governments hold a Special Education Fund (SEF) that varies 394-fold per learner. Its evidence on inclusion says Indigenous and Muslim learners face barriers that begin with a missing birth certificate. Below, each strand’s Career Stage 1 indicator is paired with those findings and with the learner, personnel and funding data for public schools.
Key findings
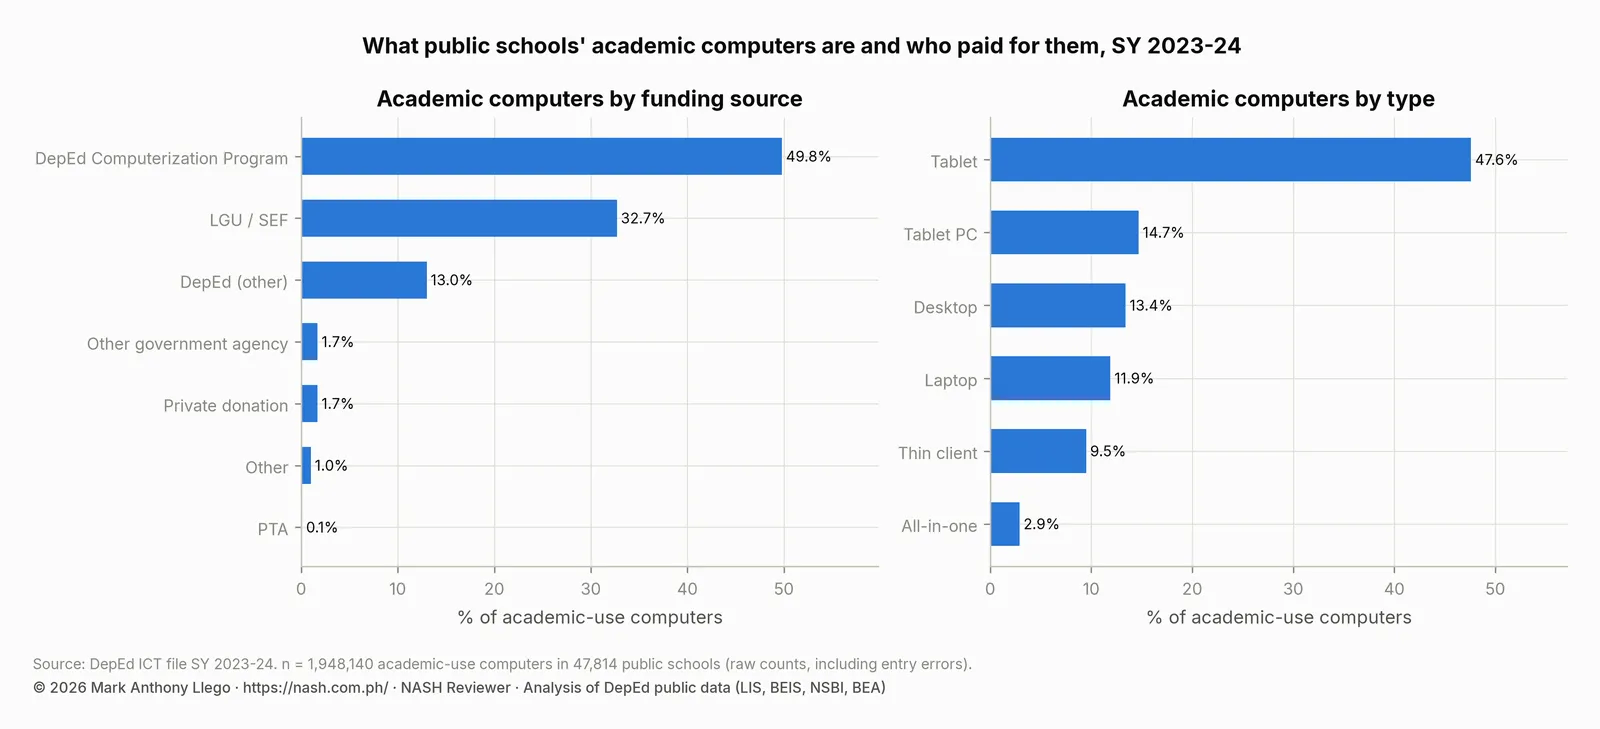
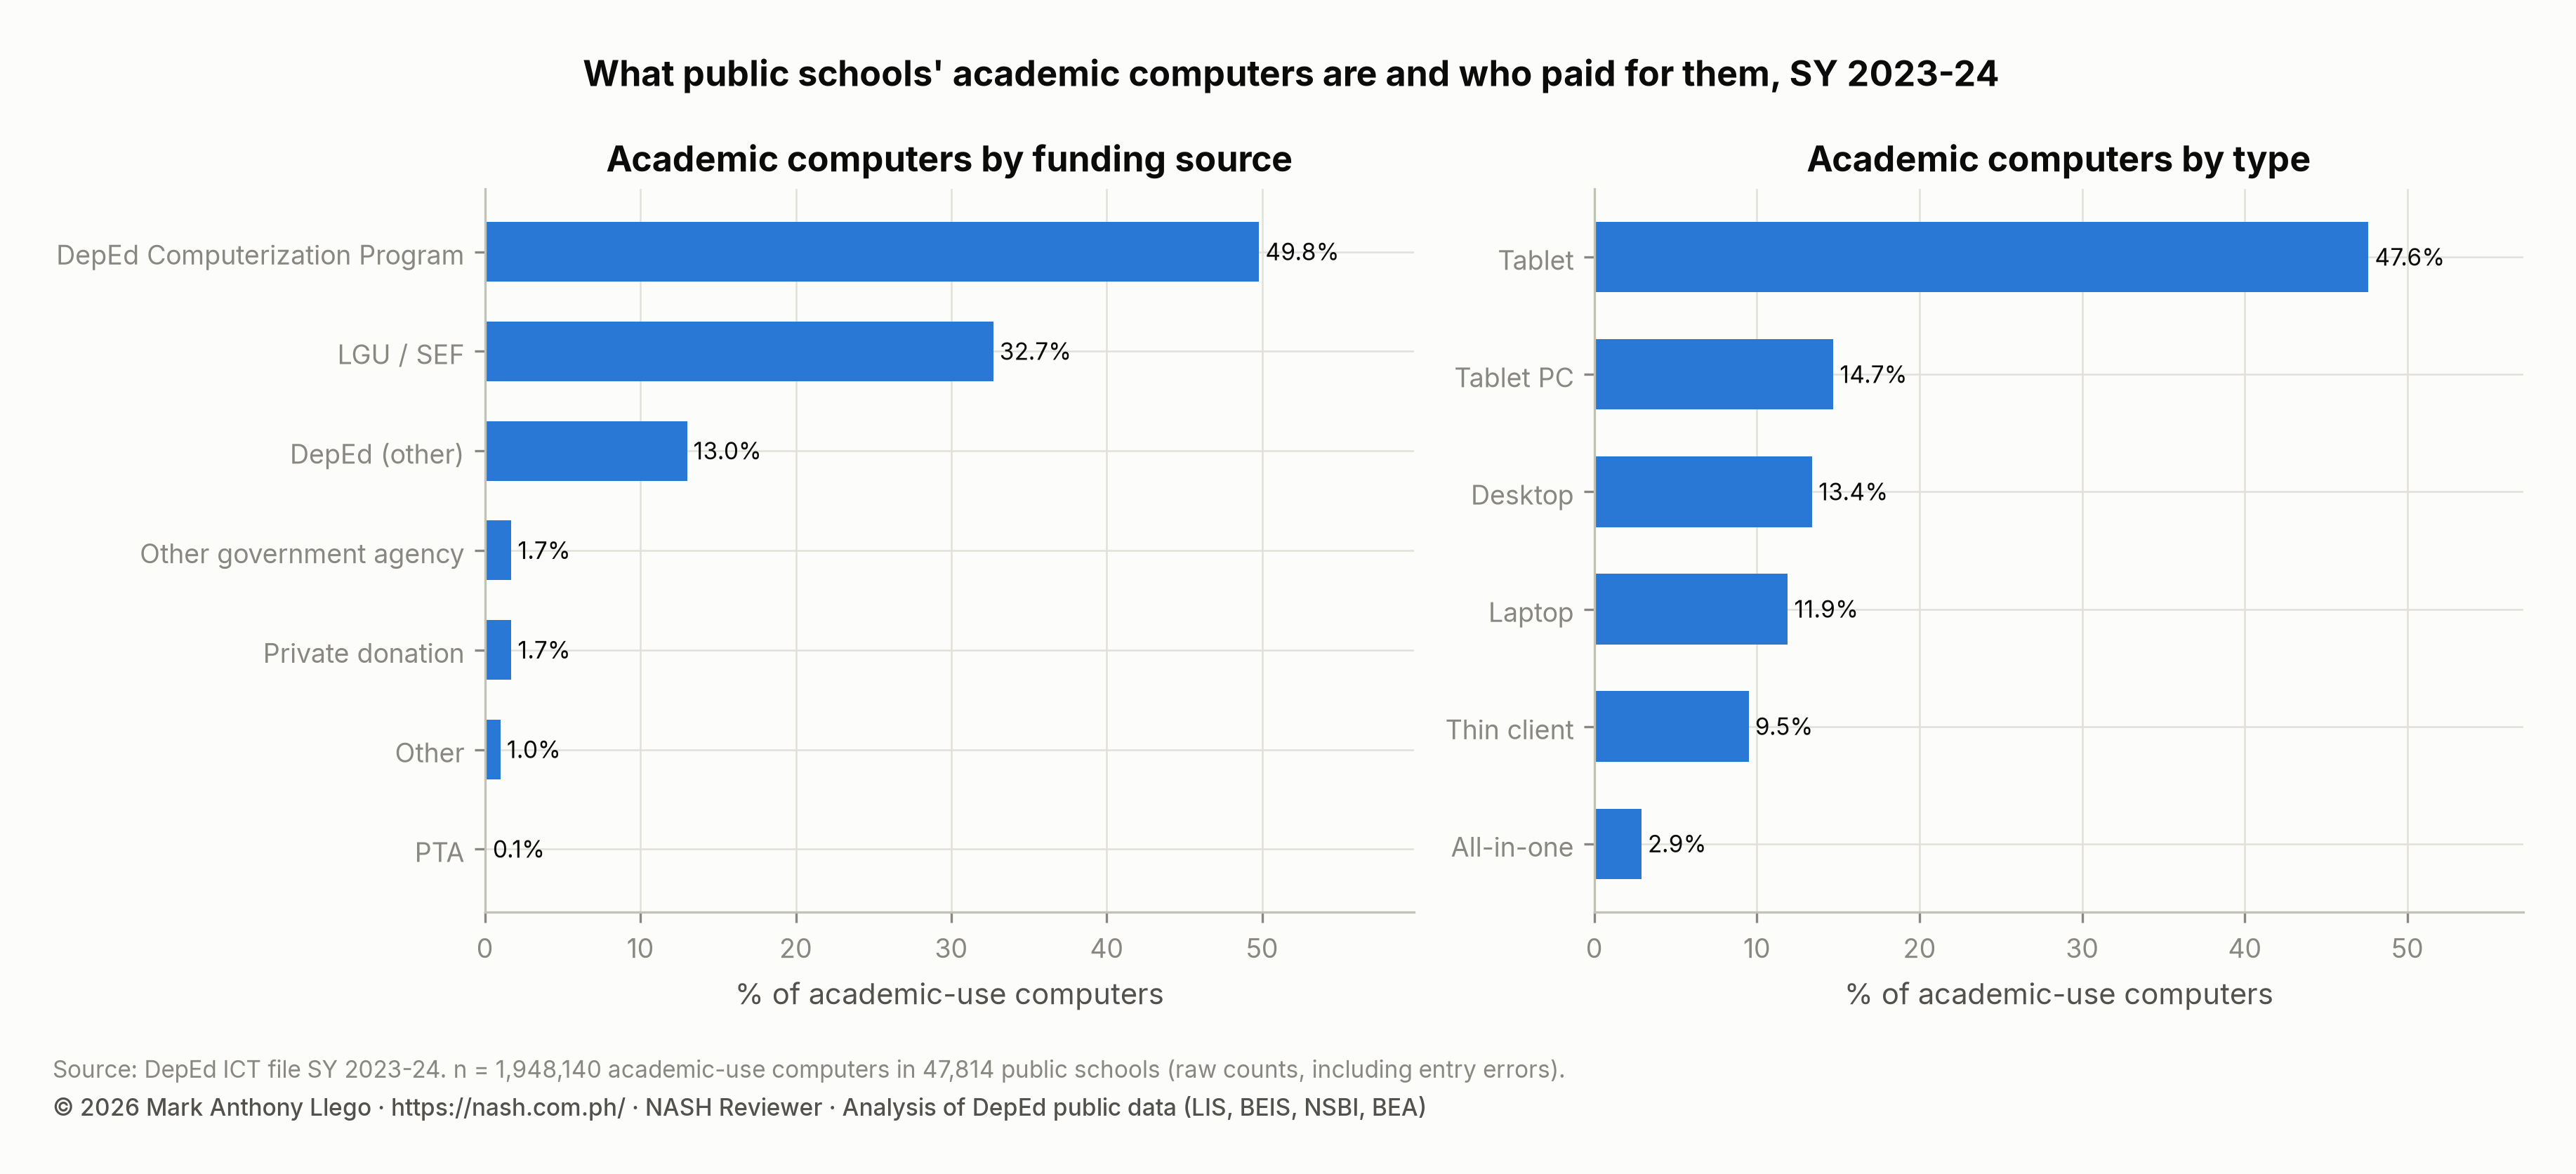
- The stakeholders can be counted. Each Schools Division Office (SDO) averages 98 staff for 33 schools and a 1:1,237 staff-to-learner ratio; Leyte oversees 1,363 schools and Isabela City 74. Local government units (LGUs) paid for 12.6% of BARMM’s teachers and, with the SEF, for 32.7% of all public schools’ academic computers. Parent-teacher associations (PTAs) paid for 0.1%.
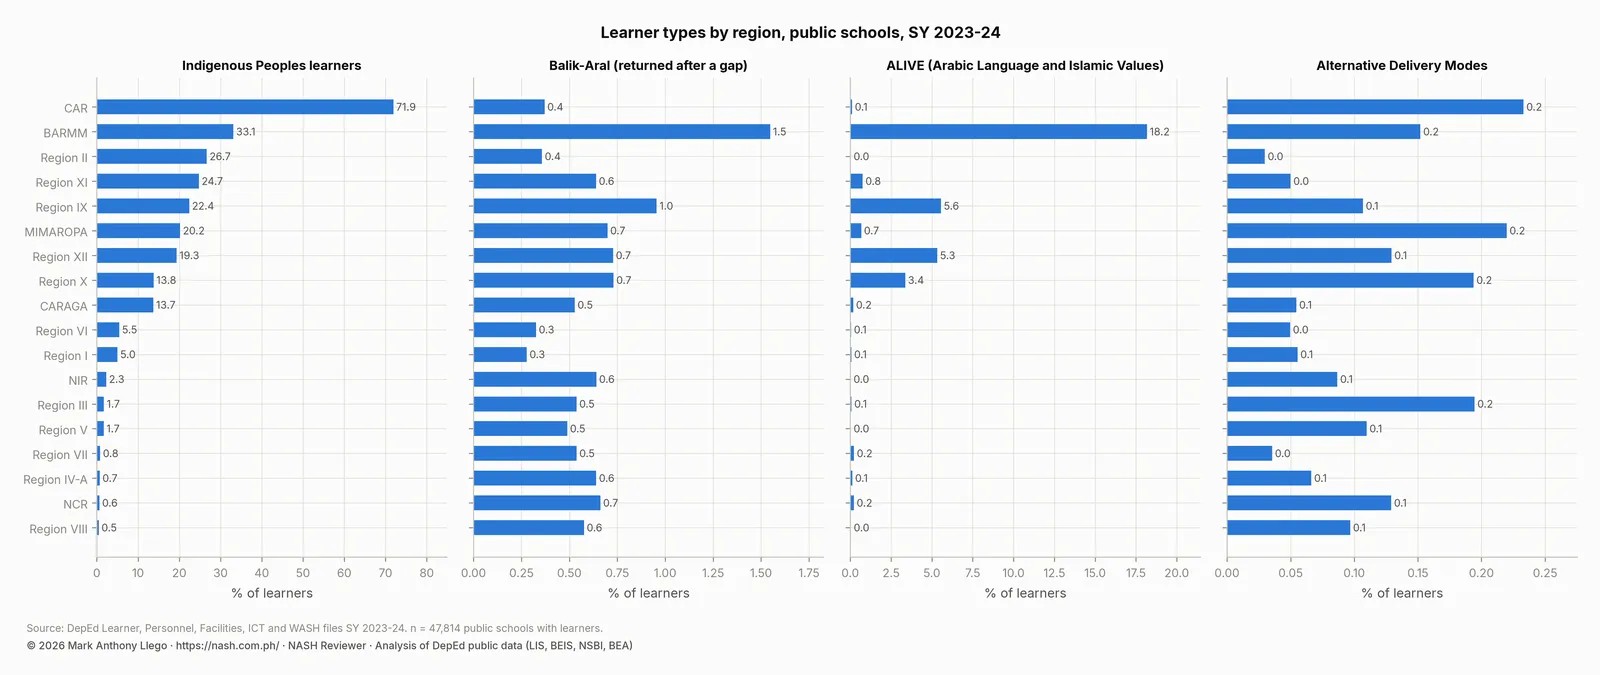
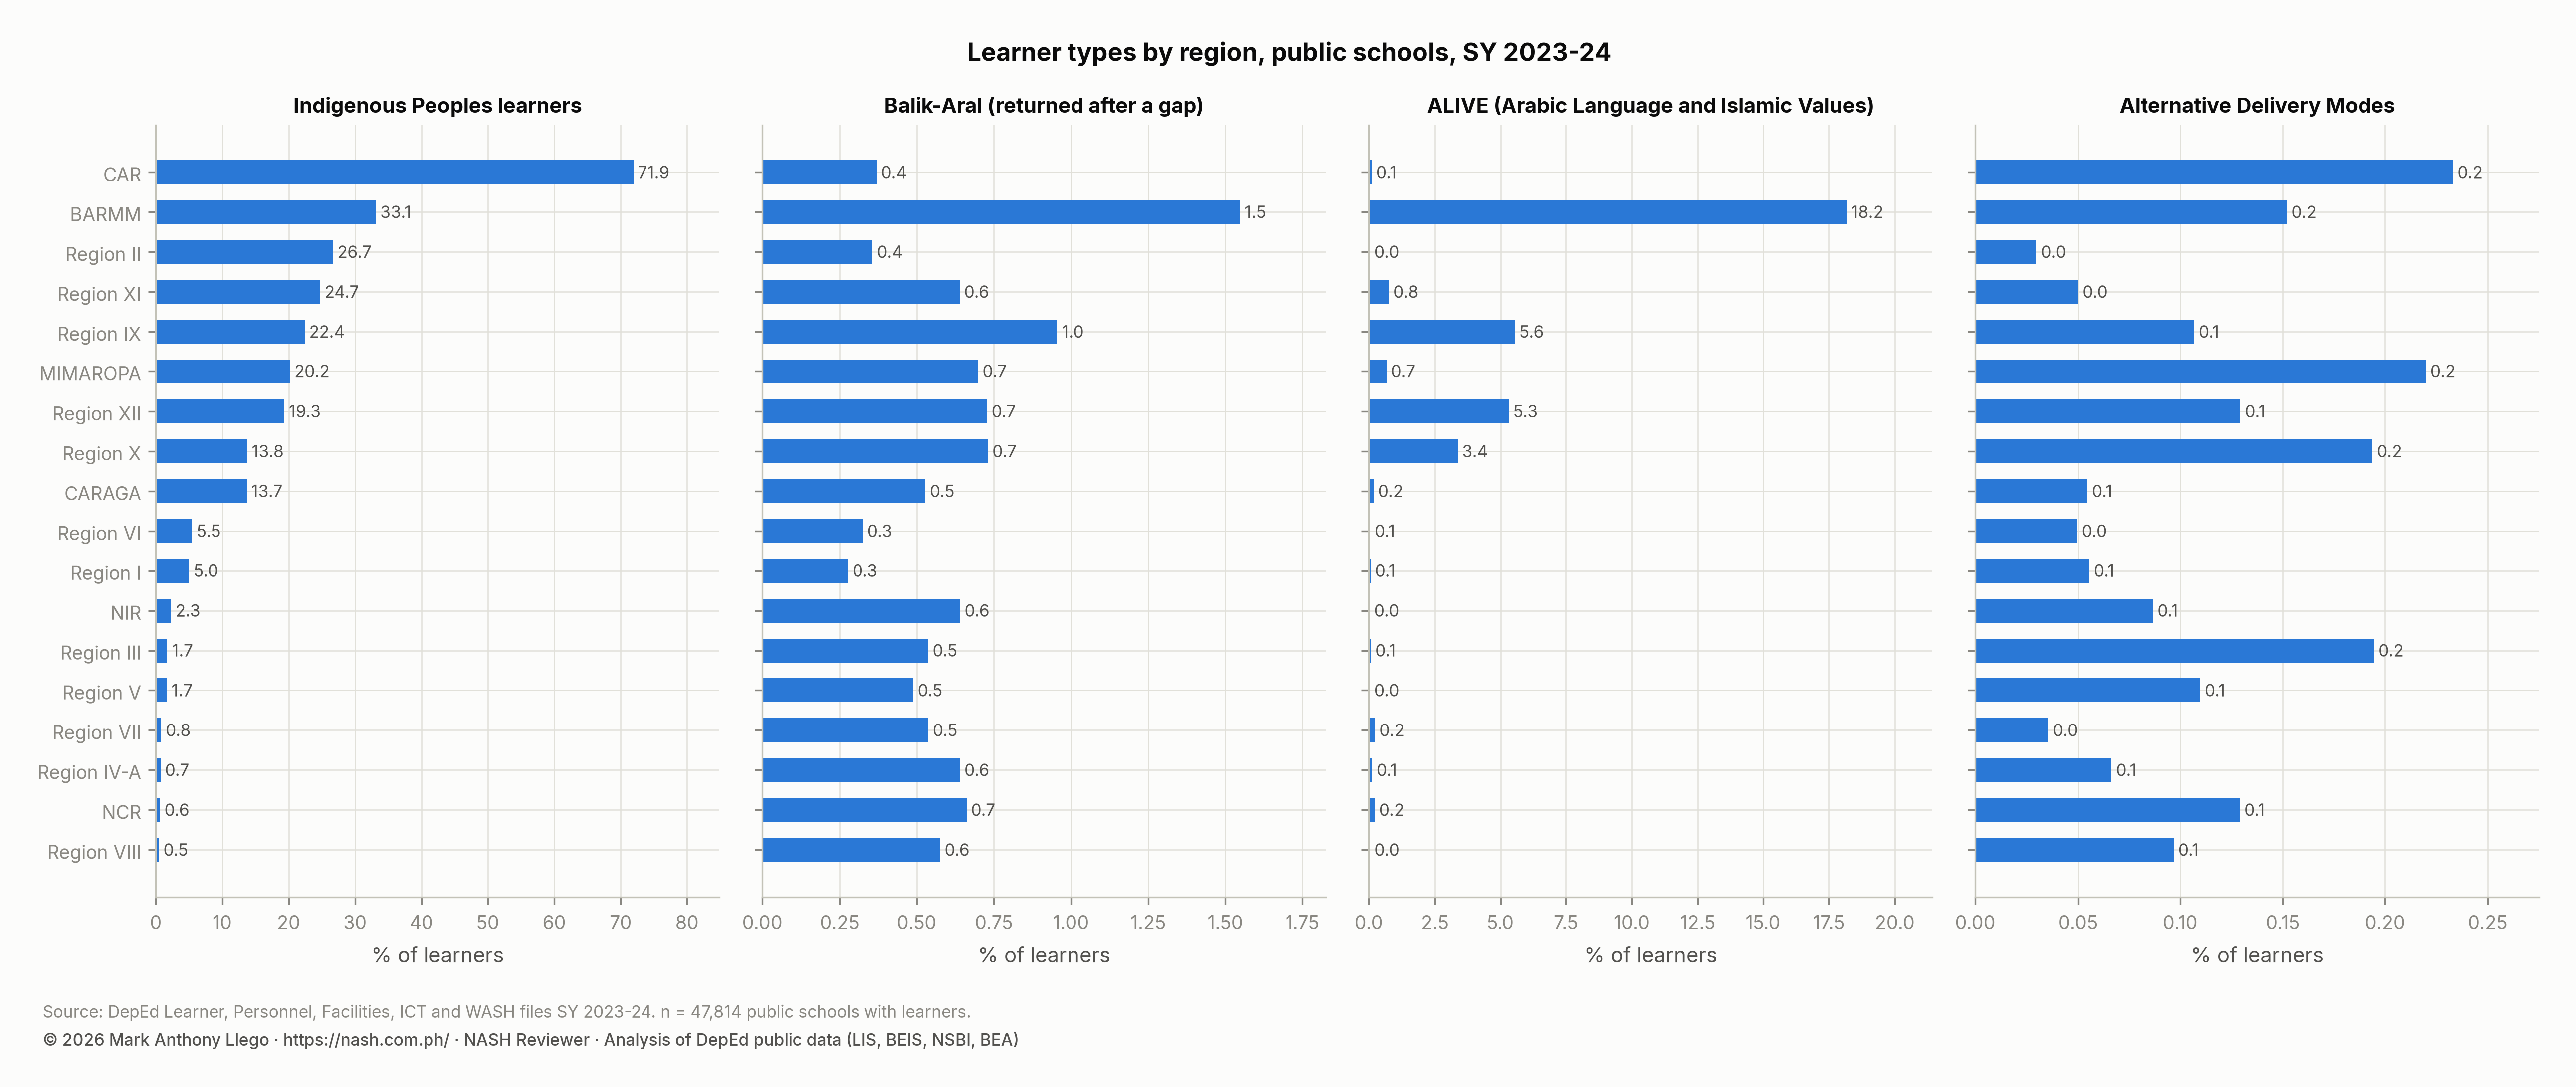
- Inclusion concerns a large share of every school. Indigenous Peoples are 9.3% of public-school learners (71.9% in CAR, 33.1% in BARMM), Arabic Language and Islamic Values Education (ALIVE) learners 1.4%, and Balik-Aral returnees 0.6%. EDCOM II reports that about half of Indigenous and Muslim learners do not progress beyond elementary school.
- The communication standard changed in 2025. Project BUKAS made school-level data public, and EDCOM II asks that reporting be standardized “so LGUs, parents, and civil society organizations can use diagnostic data”.
- Community partnerships have measured results. EDCOM II cites Pasay City’s LGU-funded reading teachers, the Bayang Bumabasa literacy grants of up to PHP 1 million for 131 priority schools, and LGU-led classroom construction as the remedies that work.
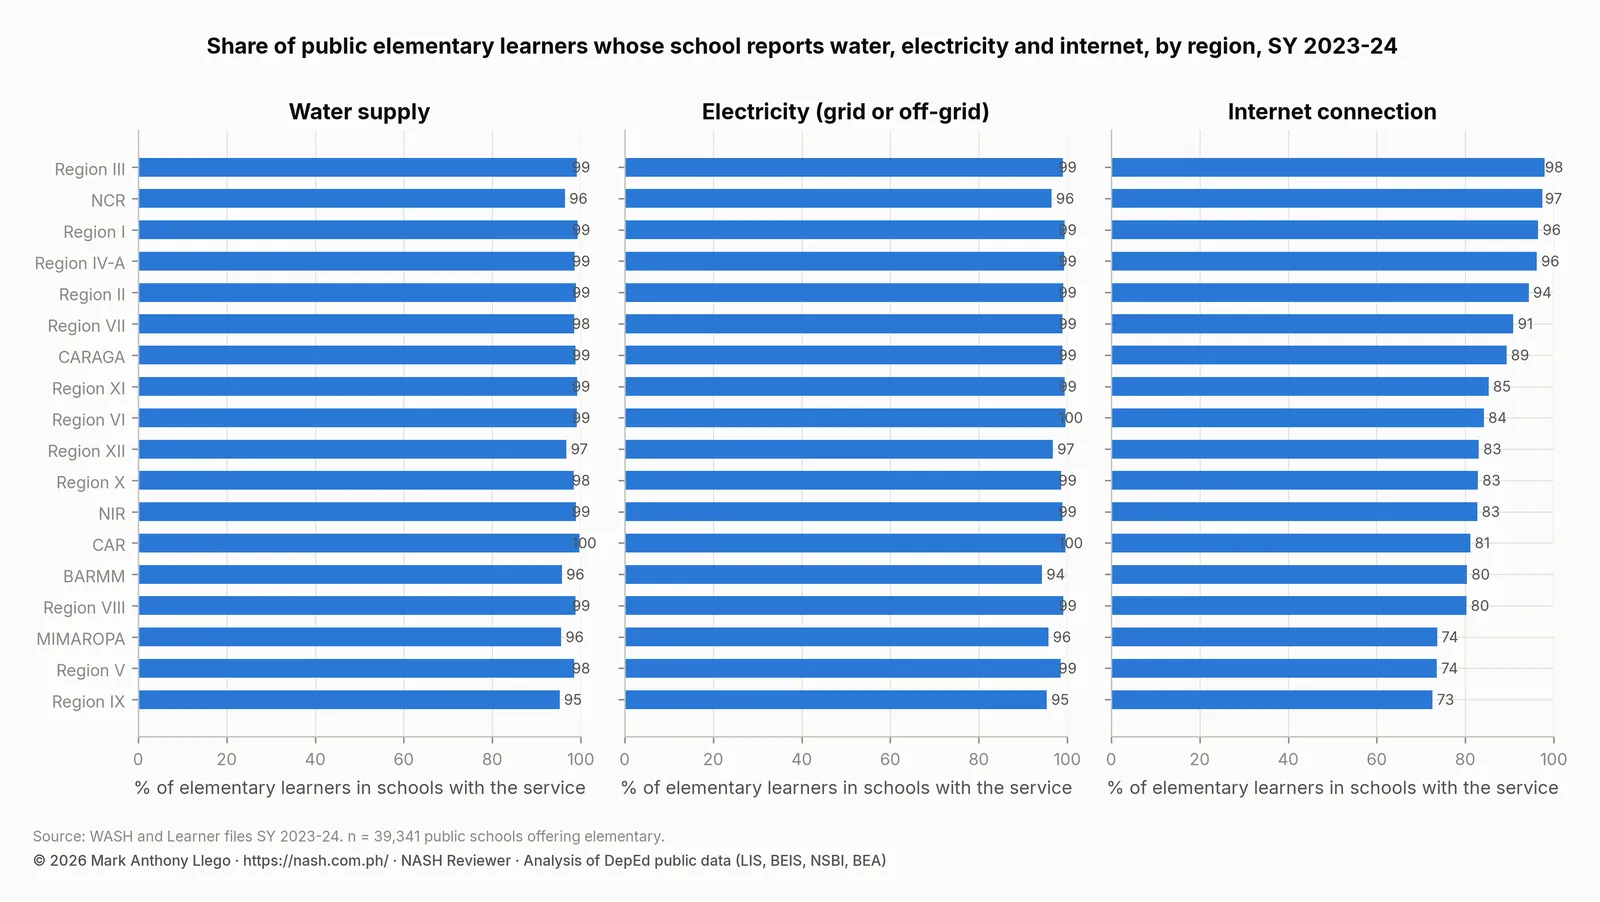
- Access is part of connection. Among public elementary schools, 10% are reachable by boat, 66% by habal-habal and 73% by paved road. The schools without internet are small, rural and concentrated in Region IX, Region V and MIMAROPA.
The five strands of Domain 5 at Career Stage 1
| Strand | Career Stage 1 indicator |
|---|---|
| 5.1 Management of diverse relationships | 5.1.1 Demonstrate skills in dealing with authorities, colleagues, parents and other stakeholders to encourage an enabling and supportive environment for learners. |
| 5.2 Management of school organizations | 5.2.1 Demonstrate knowledge and understanding of policies and guidelines on managing school organizations, such as learner organizations, faculty clubs and parent-teacher associations, in support of the attainment of institutional goals. |
| 5.3 Inclusive practice | 5.3.1 Demonstrate knowledge and understanding of inclusive practices, such as gender sensitivity, physical and mental health awareness and culture responsiveness, to foster awareness, acceptance and respect. |
| 5.4 Communication | 5.4.1 Demonstrate competent skills in speaking and writing, as well as in utilizing communication platforms, in communicating with teachers, learners, parents and other stakeholders. |
| 5.5 Community engagement | 5.5.1 Involve the community, such as parents, alumni, authorities, industries and other stakeholders, in school programs, projects and activities to gain support for learner development, as well as school and community improvement. |
Three of the five (5.1.1, 5.4.1 and 5.5.1) ask for skills or actions at Career Stage 1 rather than knowledge. The domain assumes an aspiring school head has already dealt with authorities, written for parents and involved a community.
5.1 Management of diverse relationships
The “authorities” in indicator 5.1.1 are, first, the Schools Division Office. EDCOM II’s Priority Area 27 describes the SDO’s situation. Across 228 SDOs, 22,356 staff supervise the schools, while the Central and Regional Offices employ 3,011. Each SDO averages 98 staff for 33 schools, a 1:1,237 staff-to-learner ratio. Leyte’s SDO oversees 1,363 schools and Isabela City’s 74 under the same structure, because Section 7-c of Republic Act No. 9155 gives every division the same staffing frame. Another 45 divisions lack engineers. And 94.1% of schools are not implementing units, so their Maintenance and Other Operating Expenses (MOOE) pass through an SDO “stretched thin and inconsistent in [its] practices”.
The Public Schools District Supervisor (PSDS) and the division engineer are the two relationships that decide whether a request moves. EDCOM II’s recommendation 8, for an Instructional Leadership Framework, would define the roles of the Schools Division Superintendent (SDS), the PSDS and the school head, which today overlap.
The second authority is the local government. The Local School Board controls the SEF, which EDCOM II finds varies from PHP 25,587 per learner in Makati City to PHP 65 in Guihulngan City. First-class LGUs had 68 times the SEF of sixth-class municipalities, and PHP 16.3 billion went unspent in 2022. DepEd, the Department of Budget and Management (DBM), the Department of the Interior and Local Government (DILG) and the Department of Finance (DOF) signed revised SEF guidelines, Joint Circular No. 01, s. 2025, on December 3, 2025. A memorandum of April 2025 between DepEd and the Department of Human Settlements and Urban Development (DHSUD) would put DepEd on local housing boards, so that resettlement projects come with school sites. A school head’s relationship with the mayor and the Local School Board is a relationship with the only discretionary education money in the locality.
The third authority is parents. The Southeast Asia Primary Learning Metrics (SEA-PLM) 2024 regression analysis found that “learners who report that parents or caregivers frequently talk, read, or engage with them about schoolwork have lower odds of being in the lowest proficiency bands”. It also found that grade repetition (28% of Grade 5 learners) and child work raise those odds. EDCOM II records the adversarial side too. Teachers are “confronted or threatened by parents when they assign failing marks”, home visits and parent conferences are done “using their own time and resources”, and the report notes the absence of “a structured framework for parental engagement”. The constraint EDCOM II found most often in the Academic Recovery and Accessible Learning (ARAL) Program was attendance. Its remedy was “parent support and barangay level advocacy to ensure that children actually show up”.
When relationships with teachers break down, the line between firm management and oppression matters; see Oppression Cases: How Principals Must Treat Teachers.
5.2 Management of school organizations
Indicator 5.2.1 names learner organizations, faculty clubs and parent-teacher associations. The data put the PTA’s role in proportion. PTAs paid for 0.1% of public schools’ academic computers, private donations for 1.7% and other government agencies for 1.7%. The DepEd Computerization Program (DCP) paid for 49.8%, and LGUs and the SEF for 32.7%. A PTA is not an equipment fund. Its value, in EDCOM II’s evidence, is the parental engagement that improves reading outcomes, the attendance that makes ARAL work, and the “barangay level advocacy” that gets flagged learners to remediation.
Learner organizations are the structure behind strand 1.6 on learner voice. EDCOM II’s bullying evidence shows why a Supreme Pupil or Student Government is a safety mechanism and not a ceremonial one. In SEA-PLM 2024, the Philippine figure for head teachers reporting bullying among pupils at least once a month was 50%, down from 63% in 2019, against 4% to 20% in Cambodia, Lao PDR and Viet Nam. Under the revised performance management EDCOM II proposes, faculty clubs are the professional learning community in which classroom observation and coaching are discussed.
Initiation rites of learner organizations fall under the Anti-Hazing Act of 2018 (RA 11053), which also keeps school authorities liable as accomplices and adds a duty to report hazing; see Harassment, Child Abuse and Hazing: Cases on School Heads.
5.3 Inclusive practice
Indicator 5.3.1 lists gender sensitivity, physical and mental health awareness and culture responsiveness. The learner file shows who those learners are.
| Region | Public schools | Learners | Indigenous Peoples | Balik-Aral | ALIVE | Alternative delivery modes | ES learners in multigrade classes | Schools offering multigrade |
|---|---|---|---|---|---|---|---|---|
| BARMM | 2,155 | 769,022 | 33.1% | 1.55% | 18.2% | 0.15% | 3.4% | 11.2% |
| CAR | 1,844 | 358,204 | 71.9% | 0.37% | 0.1% | 0.23% | 9.9% | 39.7% |
| CARAGA | 2,099 | 700,496 | 13.7% | 0.53% | 0.2% | 0.05% | 3.9% | 20.8% |
| MIMAROPA | 2,382 | 817,395 | 20.2% | 0.70% | 0.7% | 0.22% | 4.0% | 19.7% |
| NCR | 827 | 2,101,985 | 0.6% | 0.66% | 0.2% | 0.13% | 0.0% | 0.6% |
| NIR | 2,231 | 1,134,333 | 2.3% | 0.64% | 0.0% | 0.09% | 0.9% | 7.3% |
| Region I | 2,861 | 1,101,162 | 5.0% | 0.28% | 0.1% | 0.06% | 1.8% | 12.0% |
| Region II | 2,539 | 809,342 | 26.7% | 0.36% | 0.0% | 0.03% | 3.8% | 18.9% |
| Region III | 3,729 | 2,478,610 | 1.7% | 0.54% | 0.1% | 0.19% | 0.2% | 2.6% |
| Region IV-A | 3,564 | 3,188,202 | 0.7% | 0.64% | 0.1% | 0.07% | 0.3% | 4.8% |
| Region IX | 2,993 | 1,106,260 | 22.4% | 0.96% | 5.6% | 0.11% | 3.3% | 16.8% |
| Region V | 3,862 | 1,581,329 | 1.7% | 0.49% | 0.0% | 0.11% | 1.6% | 10.7% |
| Region VI | 2,835 | 1,040,714 | 5.5% | 0.33% | 0.1% | 0.05% | 1.9% | 12.8% |
| Region VII | 2,810 | 1,456,462 | 0.8% | 0.54% | 0.2% | 0.04% | 1.1% | 11.3% |
| Region VIII | 4,179 | 1,141,816 | 0.5% | 0.58% | 0.0% | 0.10% | 8.5% | 33.1% |
| Region X | 2,531 | 1,159,212 | 13.8% | 0.73% | 3.4% | 0.19% | 3.0% | 18.9% |
| Region XI | 2,218 | 1,218,778 | 24.7% | 0.64% | 0.8% | 0.05% | 1.6% | 12.7% |
| Region XII | 2,155 | 1,062,105 | 19.3% | 0.73% | 5.3% | 0.13% | 1.8% | 11.9% |
| Philippines (public) | 47,814 | 23,225,427 | 9.3% | 0.62% | 1.4% | 0.11% | 2.0% | 15.2% |
Indigenous Peoples learners number 2,162,636, or 9.3% of public-school learners. They are 71.9% of learners in CAR and 33.1% in BARMM, and under 1% in NCR, Region IV-A, Region VII and Region VIII. ALIVE learners number 329,954, or 1.4%, with 18.2% of BARMM’s learners, 5.6% in Region IX and 5.3% in Region XII. Balik-Aral learners, who return after a year or more away, number 143,558 (0.6%) and are most common in BARMM and Region IX. Alternative delivery modes reach 24,956 learners. Girls are 48% of elementary and 50% to 51% of senior-high learners in every year.
EDCOM II’s chapter on Indigenous Peoples education supplies what the counts cannot. About 20% of Muslim ethnic groups and 10% of IPs lack birth registration, “restricting access to school enrollment, social protection programs, and identity documentation”. About half of Indigenous and Muslim learners do not progress beyond elementary education, against less than a third of their peers. IP participation runs from 87% in SOCCSKSARGEN to 62% in BARMM.
On the Grade 10 National Achievement Test (NAT) of SY 2022-2023, only 2,847 of all test-takers reached proficiency. In priority schools the counts were 69 learners in schools in geographically isolated and disadvantaged areas (GIDA) and 42 in Last Mile schools. There were 18 in Hardship Post schools, 4 in Indigenous Peoples Education (IPEd) schools and 133 in schools with Madrasah programs. Severe disability affects 39% of people with no formal education and 6% of college graduates. Waray speakers show a disability prevalence of 21%, and 31% among women. Inclusive Learning Resource Centers under Republic Act No. 11650 “remain unevenly staffed and under-resourced”. Teachers “often lack the training and tools necessary to differentiate between disability-related needs, trauma responses, and chronic stress behaviors”. RA 11650 and Learners With Disabilities covers EDCOM II’s findings on learners with disabilities and on Indigenous and Muslim learners.
The report’s prescriptions for a school are specific. The first is standardized screening tools and teacher training on identification, accommodation and referral. The second is “culturally responsive pedagogy, materials, school-community partnerships, and coordination with PSA and LGUs to resolve documentation barriers such as missing birth registration”. The third is a multi-tiered system of support “based on data rather than ad hoc responses”. The fourth, under Republic Act No. 12027, is school-level language plans. The Comprehensive Rapid Literacy Assessment (CRLA) shows why the language plan is a matter of inclusion. Shares at grade level differ by language of instruction, from 19.4% in Kapampangan schools to 12.0% in Waray schools, and the order on the Early Language, Literacy, and Numeracy Assessment (ELLNA) is almost the reverse.
5.4 Communication
Indicator 5.4.1 asks for competent speaking, writing and use of platforms with teachers, learners, parents and other stakeholders. Since September 2025, the standard includes communicating data. EDCOM II credits Project BUKAS as a “cultural reform in data openness”, which published “datasets on assessment results, enrollment, school resources, spending patterns, and teacher-to-student ratios” for the first five regions. It recommends standardized reporting formats “so LGUs, parents, and civil society organizations can use diagnostic data when designing local programs or supporting struggling learners”. It also asks for equity indicators “integrated into both national assessment reports and local school dashboards”.
Honest communication of school data follows three rules. First, say what the number is a share of: DepEd’s pupil-teacher ratio is all learners over all teachers, 25.5 nationally, while the median school’s is 22.7. Second, say how uncertain it is: a division NAT estimate has an interval about a point wide, while a school mean from six test-takers has one of several points. Third, say what it cannot show: the inputs analysis finds associations, not effects, and division explains more than any input. A school report card written by these rules tells parents the CRLA profile by grade, the school’s building condition and classroom ratio, and the targets. It does not rank the school on a NAT mean. SIP Communication Plan: Structure, Style and a Sample applies these rules to a school’s plan for sharing its SIP across the year.
5.5 Community engagement
Indicator 5.5.1 asks you to involve parents, alumni, authorities, industries and others in school programs. The data show where the community is already involved, and the report shows what the best partnerships deliver.
Locally funded teachers are 2.0% of the public teaching force nationally, but 12.6% in BARMM and about a tenth in Region II. The SY 2023-2024 teachers and school personnel report calls local funding “a lever” that can add classrooms’ worth of teachers. LGUs and the SEF are the second-largest source of academic computers. Physical access is the first condition of engagement. Among public elementary schools, 86% are reachable on foot, 84% by private four-wheel vehicle, 73% by paved road, 70% by tricycle, 66% by habal-habal and 10% by boat. An entrance gate is reported by 89% of these schools and a permanent perimeter fence by 48%.
| Indicator | Schools with data | Share of schools | Share of learners |
|---|---|---|---|
| water supply (ES) | 39,341 | 97.6% | 98.1% |
| electricity, grid or off-grid (ES) | 39,343 | 97.4% | 98.2% |
| internet (ES) | 39,341 | 76.2% | 87.7% |
| water supply (any level) | 47,813 | 97.6% | 98.3% |
| electricity (any level) | 47,813 | 97.4% | 98.3% |
| internet (any level) | 47,813 | 78.1% | 90.4% |
| at least one academic computer | 47,813 | 75.4% | 86.9% |
| no functional toilet bowl | 47,814 | 2.8% | 1.1% |
Internet reaches 90% of learners but only 78% of schools, and the unconnected schools are concentrated in Region IX, Region V and MIMAROPA. The SY 2023-2024 report on information and communications technology (ICT) in public schools notes three routes a school head can pursue. They are an LGU line, a free Wi-Fi site of the Department of Information and Communications Technology (DICT), or a DepEd connectivity program. It also notes that connectivity is the input with the clearest association with results.
EDCOM II’s models of engagement are specific. Pasay City “has maintained a two decade partnership with the local government to deploy dedicated reading teachers, use CRLA and Phil IRI results to group learners by level, and run daily pull out sessions”. Its school heads reported almost all flagged non-readers progressing at least one level. Bayang Bumabasa was launched in December 2025 on the Commission’s Mayors for Literacy campaign. It lets 131 priority schools identified from CRLA profiles apply for up to PHP 1 million for reading tutors, decodable texts, remedial classes and teacher training, “reinforced through LGU and civil society engagement to sustain reading beyond school hours”. Local Education Models in EDCOM II covers Pasay City’s partnership and other local models, with the evidence behind each.
On classrooms, EDCOM II proposes a nationwide counterpart program in which larger cities pay up to 50% of construction costs. Senate Bill No. 1482’s Classroom Building Acceleration Program would let LGUs and civil society organizations build to DepEd standards. On congestion, the report maps unused private seats, while warning of “access deserts” where no private partner exists. Before approaching partners, Stakeholder Analysis for DepEd School Heads: A Guide shows how to list them and map their power and interest.
How the NASH may test Domain 5
A situational item might describe a 400-learner elementary school where 35% of learners are Indigenous Peoples, a fifth of Grade 1 enrollees lack birth certificates, the barangay has no paved road, and the Local School Board has unspent SEF. A relational answer pairs each problem with its partner. The Local Civil Registrar and the Philippine Statistics Authority (PSA) handle registration. The IPEd coordinator and community elders handle the language plan and materials. The Local School Board funds a reading teacher or a connectivity line from the SEF. The barangay provides attendance advocacy during ARAL, and the PTA provides the engagement that improves reading outcomes, rather than equipment. An extended abstract answer explains why the same plan in a congested NCR school would be about voucher slots and shifts, not registration and roads. NCR is a region where 87% of schools have a principal and the SEF is large.
Before you apply
- Read your prospective school’s learner-type rows: IP, ALIVE, Balik-Aral, multigrade, and the language of instruction.
- Know who holds the local money: the Local School Board, the SEF rules as revised, and what the LGU already funds at the school.
- Learn the access facts (road, boat, connectivity) and what EDCOM II’s minimum service package would require.
- Practice writing a one-page school report card from public data that a parent can read and that makes no claim the data cannot support.
Frequently asked questions
What is PPSSH Domain 5, Building Connections?
PPSSH Domain 5, Building Connections, has five strands: management of diverse relationships, management of school organizations, inclusive practice, communication, and community engagement. Career Stage 1 asks aspiring school heads to demonstrate skills in dealing with stakeholders and to involve the community.
What share of DepEd public-school learners are Indigenous Peoples?
Indigenous Peoples were 9.3% of public-school learners in SY 2023-2024 (2,162,636 learners), with 71.9% in CAR and 33.1% in BARMM. ALIVE learners are 1.4% and Balik-Aral learners 0.6%.
What does EDCOM II say about local governments and schools?
EDCOM II finds that the Special Education Fund varies 394-fold per learner across LGUs and that PHP 16.3 billion of it was unspent in 2022. It finds that LGU partnerships such as Pasay City’s reading teachers deliver measurable literacy gains. It recommends that LGU-led classroom construction and counterpart funding complement delivery by the Department of Public Works and Highways (DPWH).
Download the data
The cleaned, harmonized DepEd files behind this series are free to download in CSV and Parquet, with a codebook and checksums, under the terms of use set out in the release. Download Cleaned DepEd School Data, SY 2017-18 to 2025-26 documents every file and column. The files themselves are at data.nash.com.ph, starting with the README, the SY 2023-24 school master file (CSV, 8.0 MB) and the nine-year enrollment panel (Parquet, 17.2 MB).
Guides for aspiring school heads
- DepEd Data for Aspiring School Heads: Where to Start
- NASH Practice Questions With Answers: 50 Items on the PPSSH
- How to Read DepEd Data: A Guide for Aspiring School Heads
- EDCOM II Final Report: Guide for Aspiring School Heads
- National Education Plan 2026-2035: Guide for School Heads
- NASH Study Guide: DepEd Memorandum 069, s. 2025 and PPSSH
- PPSSH Domain 1: Leading Strategically With DepEd Data
- PPSSH Domain 2: Managing School Operations With DepEd Data
- PPSSH Domain 3: Teaching and Learning With DepEd Data
- PPSSH Domain 4: Developing Self and Others With DepEd Data
- Stakeholder Analysis for DepEd School Heads: A Guide
- SIP Communication Plan: Structure, Style and a Sample
- On the app: the NASH guide, the PPSSH guide, the principal shortage and the full data report, Philippine basic education in numbers
The data reports
- DepEd Enrollment Trends SY 2017-2018 to SY 2025-2026
- Enrollment by school year: SY 2017-18, SY 2018-19, SY 2019-20, SY 2020-21, SY 2021-22, SY 2022-23, SY 2023-24, SY 2024-25, SY 2025-26
- DepEd Learner Data SY 2023-2024: IP, ALIVE and School Size
- DepEd Teachers and School Personnel Data, SY 2023-2024
- DepEd Classroom and School Building Data, SY 2023-2024
- DepEd WASH Data SY 2023-2024: Toilets, Water, Electricity
- DepEd ICT Data SY 2023-2024: Computers and Internet
- NAT Grade 6 Results SY 2023-2024: DepEd Division Scores
- ELLNA Grade 3 Results SY 2023-2024: DepEd Division Scores
- CRLA Results SY 2025-2026: Reading Levels in Grades 1 to 3
- DepEd School Inputs vs Test Results: Multigrade and Internet
- DepEd Open Data Quality: Errors, Blanks and Coverage Limits
- Download Cleaned DepEd School Data, SY 2017-18 to 2025-26
Written by Mark Anthony Llego for NASH Reviewer. Sources: DepEd Order No. 024, s. 2020 and the PPSSH booklet; DepEd Memorandum No. 069, s. 2025; EDCOM II Final Report, January 2026; DepEd public datasets. Charts may be reused only with written permission from support@nash.com.ph.