DepEd’s School Facilities dataset for SY 2023-2024 shows how many learners share each classroom in public schools and what condition school buildings are in. The dataset comes from the National School Building Inventory (NSBI) and covers the 47,814 public schools with learners.
For each school, the file records its instructional and non-instructional rooms and the condition of each building. It also counts makeshift rooms and temporary learning spaces, lists amenities such as covered courts and flood markers, and records how learners reach the school. Teachers can be hired or moved, but classrooms and buildings cannot, so a school head works with the rooms the school already has.
The companion report, Philippine basic education in numbers, holds the method notes and the data behind every chart.
Key findings
- Public schools have 35.1 learners per instructional room nationally, by DepEd’s definition (all learners divided by all rooms). The median school has 27.2. NCR (55.1), BARMM (46.4) and Region IV-A (45.1) are the most crowded regions; CAR (24.1) is the least crowded.
- Only 30% of public school buildings are in good condition. 31% need minor repair, 29% need major repair, 7% are for condemnation and 2% are for demolition. NCR has 53% of its buildings in good condition; BARMM and Region X have 21%.
- Nearly three in ten public schools (29.1%) use makeshift rooms. Schools report 34,372 makeshift rooms and 11,634 temporary learning spaces nationally. In BARMM, 42% of schools have makeshift rooms.
- 267 public schools report learners but no instructional room, and 608 have no classroom count at all.
- Amenities are uneven. 89% of public elementary schools have a school garden and an entrance gate, 71% have a playground, 48% a permanent perimeter fence, 36% a covered court and 4% a gymnasium.
Learners per classroom in public schools
DepEd’s classroom-learner ratio is total enrollment divided by the number of instructional rooms. Only kindergarten to Grade 12 classrooms count. Across the 46,939 public schools with learners and at least one instructional room, the national ratio is 35.1, and the median school has 27.2.
The gap between the two figures comes from large schools, as it does for teachers. Half of all learners are in the 11% of schools with more than 1,000 learners, and those schools are the crowded ones.
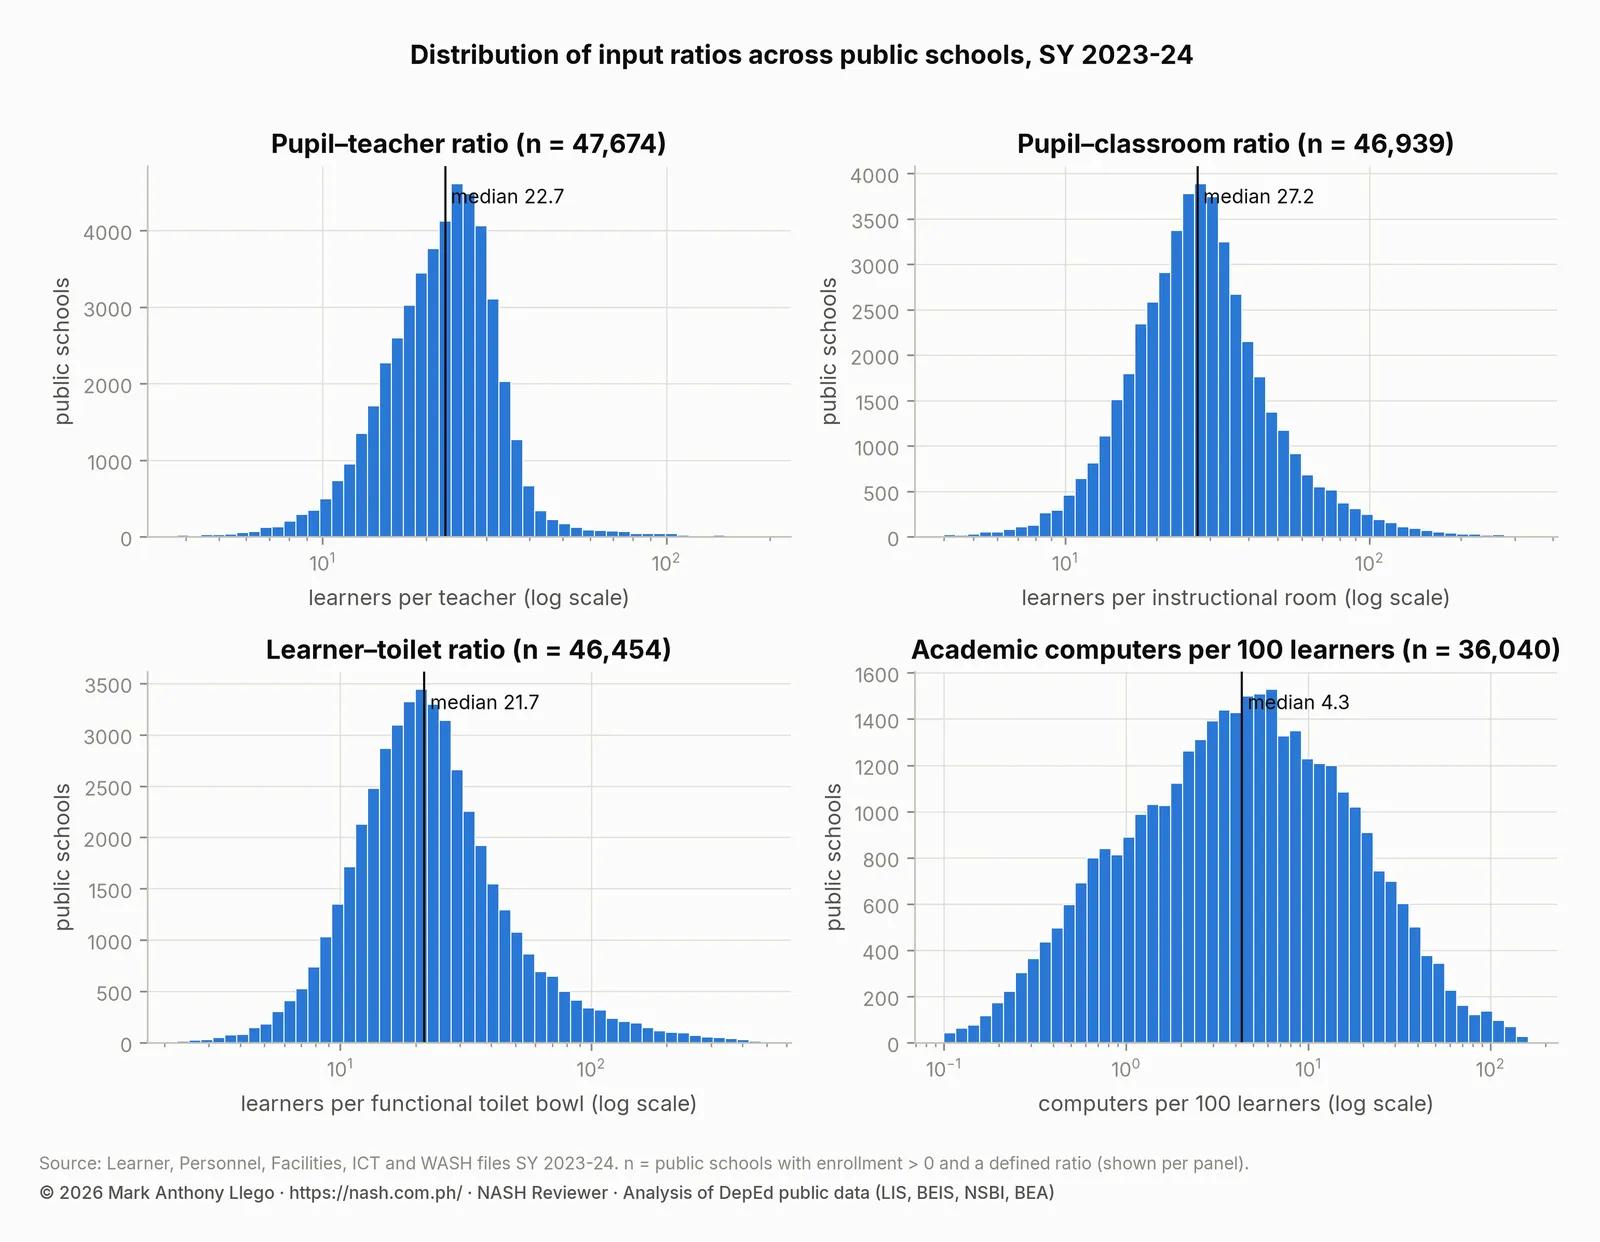
Regional differences are wider for classrooms than for teachers. NCR has 55.1 learners per room, and 59.7% of its schools are above 45. BARMM has 46.4 learners per room, with 45.8% of its schools above 45, and Region IV-A has 45.1, with 26.6% above 45. CAR (24.1), Region VIII (27.0), Region VI (27.3) and Region II (27.5) have the fewest learners per room.
| Region | Public schools | Learners per instructional room | Schools above 45 learners per room | Schools with makeshift rooms | Makeshift rooms | Temporary learning spaces |
|---|---|---|---|---|---|---|
| NCR | 827 | 55.1 | 59.7% | 11.5% | 348 | 81 |
| BARMM | 2,155 | 46.4 | 45.8% | 42.5% | 2,355 | 733 |
| Region IV-A | 3,564 | 45.1 | 26.6% | 21.6% | 2,389 | 767 |
| Region XII | 2,155 | 36.7 | 20.7% | 40.5% | 2,474 | 1,403 |
| Region VII | 2,810 | 36.5 | 16.7% | 31.8% | 2,176 | 623 |
| Region XI | 2,218 | 36.3 | 16.9% | 36.7% | 2,635 | 1,262 |
| Region X | 2,531 | 36.2 | 20.3% | 34.8% | 2,328 | 519 |
| Region III | 3,729 | 36 | 16.3% | 11.0% | 1,043 | 409 |
| Region IX | 2,993 | 34 | 17.0% | 36.7% | 2,695 | 730 |
| NIR | 2,231 | 32.4 | 10.7% | 37.0% | 2,016 | 409 |
| Region V | 3,862 | 31.2 | 8.6% | 33.1% | 2,846 | 1,270 |
| MIMAROPA | 2,382 | 30.8 | 12.6% | 34.2% | 2,076 | 352 |
| CARAGA | 2,099 | 30.6 | 11.1% | 33.3% | 1,546 | 735 |
| Region I | 2,861 | 28 | 6.3% | 12.2% | 938 | 406 |
| Region II | 2,539 | 27.5 | 7.0% | 16.8% | 862 | 401 |
| Region VI | 2,835 | 27.3 | 4.6% | 25.5% | 1,637 | 413 |
| Region VIII | 4,179 | 26.9 | 5.4% | 34.3% | 2,594 | 705 |
| CAR | 1,844 | 24.1 | 6.2% | 33.5% | 1,414 | 416 |
A single school can be far from its region’s figure. The 5th percentile across schools is 12.0 learners per room and the 95th percentile is 71.5. 267 public schools report learners but no instructional room, and 608 have no room count. Both groups are left out of the ratio rather than counted as zero.
Condition of public school buildings
The inventory puts every building in one of seven classes:
- good condition;
- needs minor repair: components not under structural load, under PHP 50,000;
- needs major repair: structural components, PHP 50,000 or more;
- for condemnation: unsafe and unused, but not yet declared so;
- for demolition: declared dangerous by the city or municipal engineer;
- ongoing construction; and
- for completion.
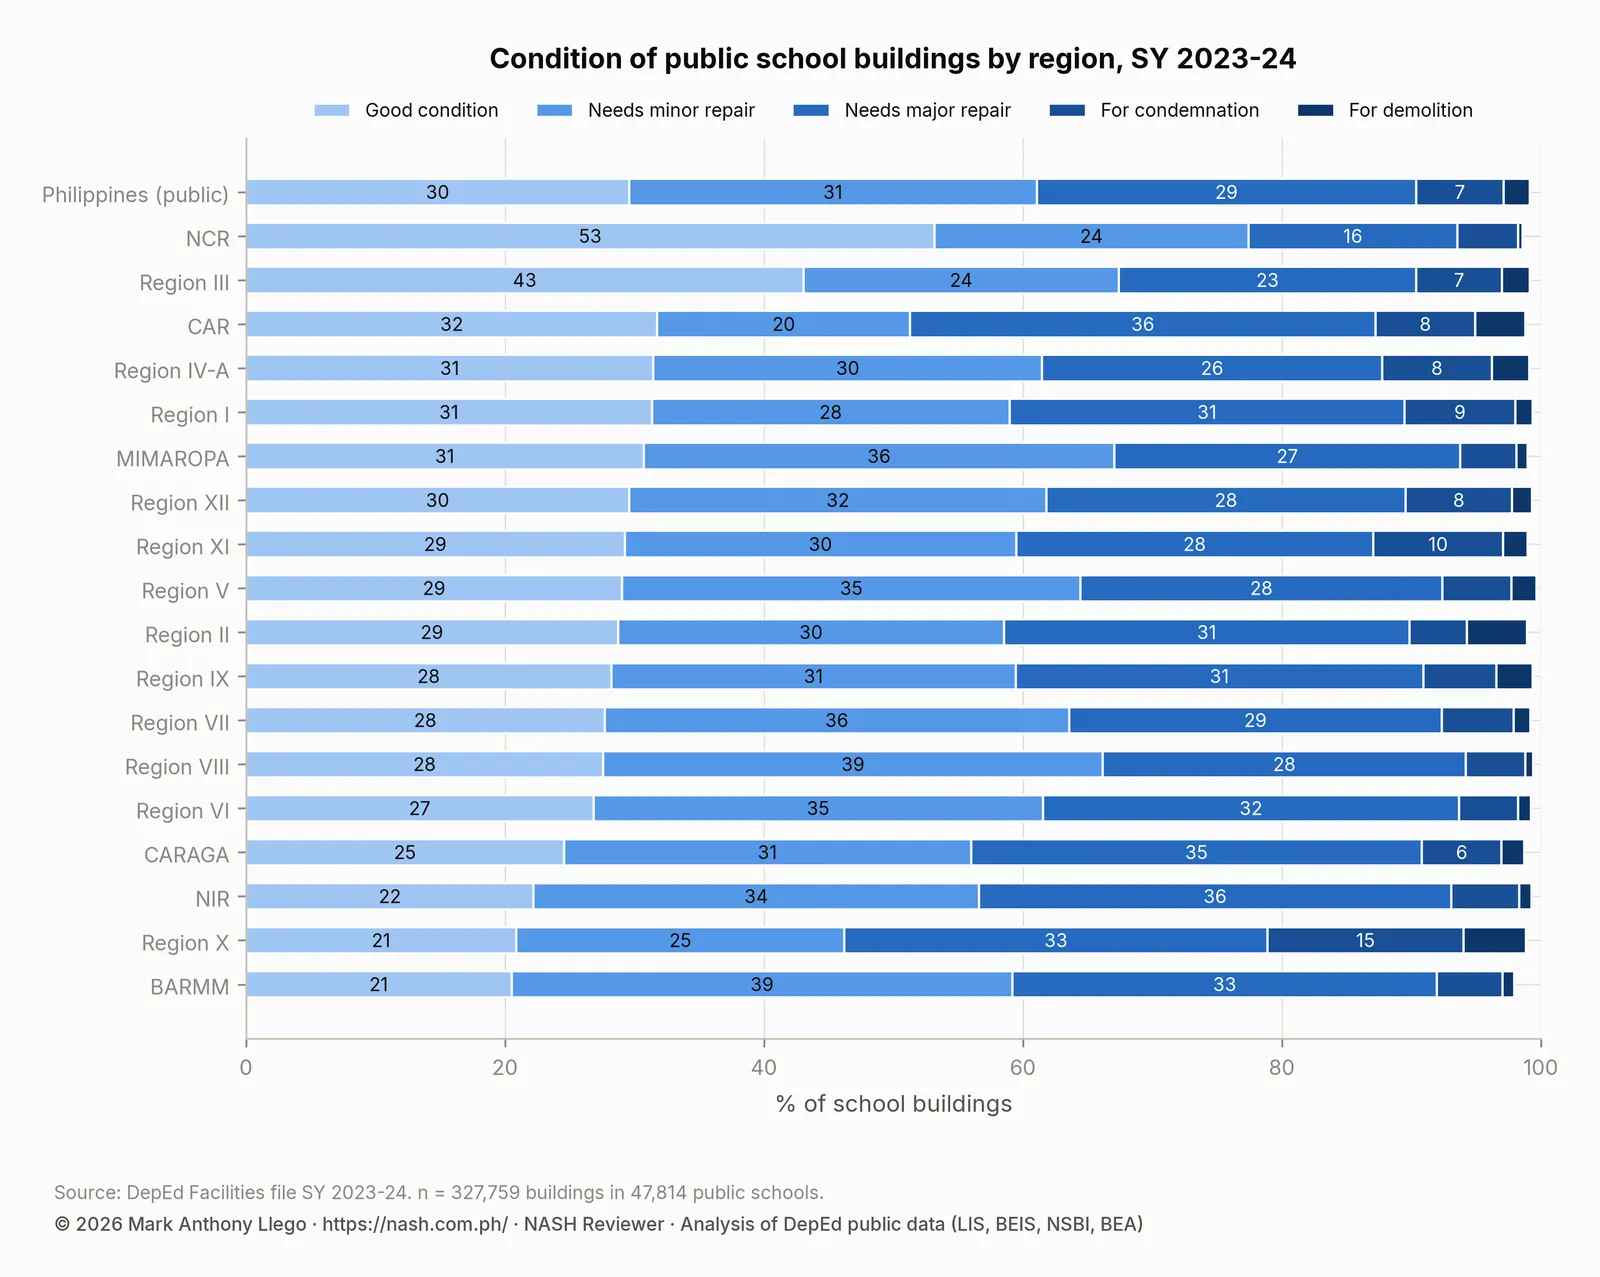
Public schools have 327,759 buildings. Of these, 29.6% are in good condition, 31.5% need minor repair and 29.3% need major repair. Another 6.8% are for condemnation, 2.0% are for demolition, and 0.8% are under construction or awaiting completion. In other words, 38% of public school buildings need major repair or are unsafe.
NCR (53.2% in good condition) and Region III (43.1%) have the best buildings. BARMM (20.5% in good condition), Region X (20.9%) and NIR (22.2%) have the worst. In BARMM, 38.7% of buildings need minor repair, and in Region X, 15.1% are for condemnation. CAR has the highest share needing major repair, 36.0%.
| Region | Buildings | Good condition | Needs minor repair | Needs major repair | For condemnation | For demolition | Under construction | For completion |
|---|---|---|---|---|---|---|---|---|
| BARMM | 8,728 | 20.5% | 38.7% | 32.8% | 5.1% | 0.9% | 0.6% | 1.5% |
| CAR | 8,283 | 31.8% | 19.5% | 36.0% | 7.7% | 3.9% | 0.6% | 0.6% |
| CARAGA | 13,790 | 24.6% | 31.4% | 34.8% | 6.1% | 1.7% | 0.7% | 0.6% |
| MIMAROPA | 16,123 | 30.7% | 36.4% | 26.7% | 4.3% | 0.9% | 0.3% | 0.8% |
| NCR | 4,172 | 53.2% | 24.2% | 16.1% | 4.7% | 0.4% | 0.9% | 0.5% |
| NIR | 18,377 | 22.2% | 34.4% | 36.4% | 5.3% | 0.9% | 0.4% | 0.4% |
| Region I | 21,868 | 31.4% | 27.6% | 30.5% | 8.6% | 1.3% | 0.3% | 0.3% |
| Region II | 18,230 | 28.7% | 29.8% | 31.3% | 4.4% | 4.6% | 0.4% | 0.7% |
| Region III | 30,472 | 43.1% | 24.4% | 22.9% | 6.6% | 2.2% | 0.6% | 0.2% |
| Region IV-A | 29,330 | 31.5% | 30.0% | 26.3% | 8.5% | 2.9% | 0.5% | 0.4% |
| Region IX | 16,655 | 28.2% | 31.2% | 31.5% | 5.7% | 2.8% | 0.4% | 0.3% |
| Region V | 29,092 | 29.1% | 35.4% | 28.0% | 5.3% | 1.9% | 0.2% | 0.1% |
| Region VI | 20,787 | 26.8% | 34.7% | 32.1% | 4.6% | 1.0% | 0.3% | 0.5% |
| Region VII | 18,559 | 27.7% | 35.9% | 28.8% | 5.6% | 1.3% | 0.3% | 0.5% |
| Region VIII | 23,923 | 27.6% | 38.6% | 28.0% | 4.6% | 0.6% | 0.4% | 0.2% |
| Region X | 17,730 | 20.9% | 25.3% | 32.7% | 15.1% | 4.8% | 0.6% | 0.5% |
| Region XI | 16,316 | 29.2% | 30.2% | 27.6% | 10.0% | 1.9% | 0.4% | 0.6% |
| Region XII | 15,324 | 29.6% | 32.2% | 27.7% | 8.2% | 1.6% | 0.3% | 0.3% |
| Philippines (public) | 327,759 | 29.6% | 31.5% | 29.3% | 6.8% | 2.0% | 0.4% | 0.4% |
Makeshift rooms and temporary learning spaces
Makeshift rooms are classrooms built from non-standard or salvaged materials. Temporary learning spaces are structures given to schools hit by calamities while permanent classrooms are built. Both are in wide use.
Public schools report 34,372 makeshift rooms, and 29.1% of schools have at least one. The share is 42.5% in BARMM, 40.5% in Region XII, 37.0% in NIR, 36.7% in Region XI and 36.7% in Region IX. Schools also use 11,634 temporary learning spaces, most of them in Region XII (1,403), Region V (1,270) and Region XI (1,262).
Amenities and access in public elementary schools
The facilities file records amenities separately for the elementary and the high school parts of a school. Among the 39,340 public elementary schools with data, 89.0% have a school garden and 88.9% an entrance gate. 70.8% have a playground and 48.1% a permanent perimeter fence. Fewer have a paved pathway (38.0%), a covered court (36.3%), a solar panel (14.0%), a flood marker (4.6%) or a gymnasium (3.9%).
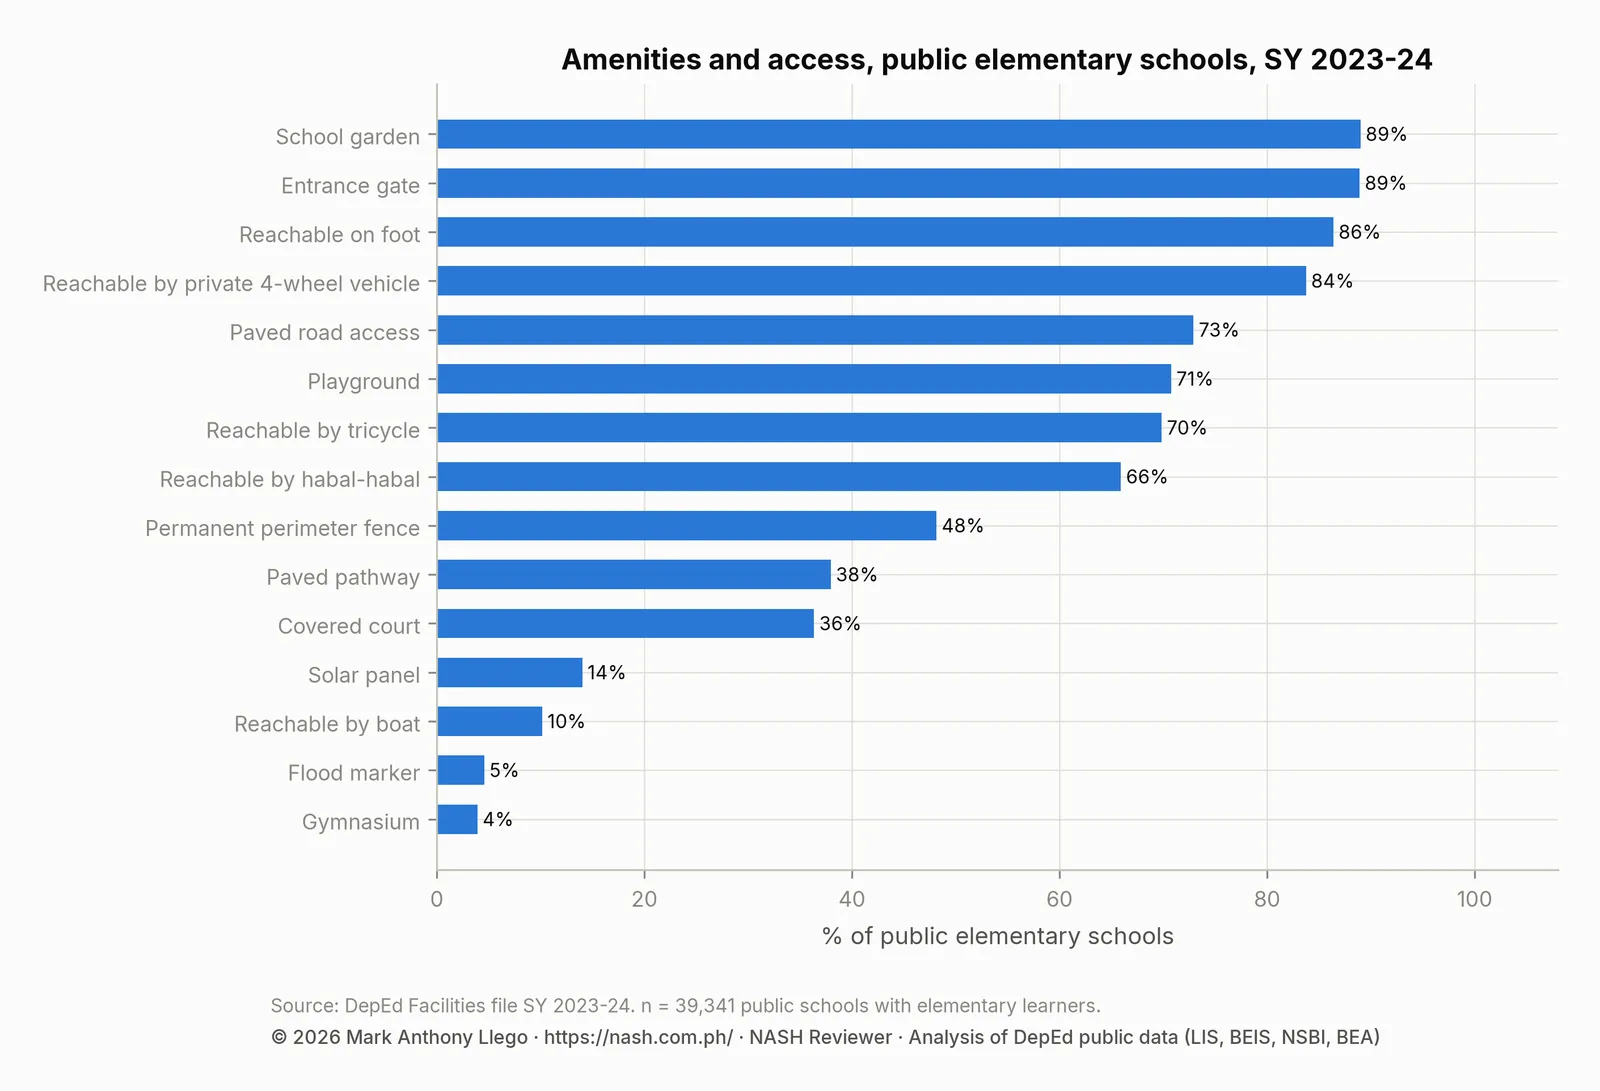
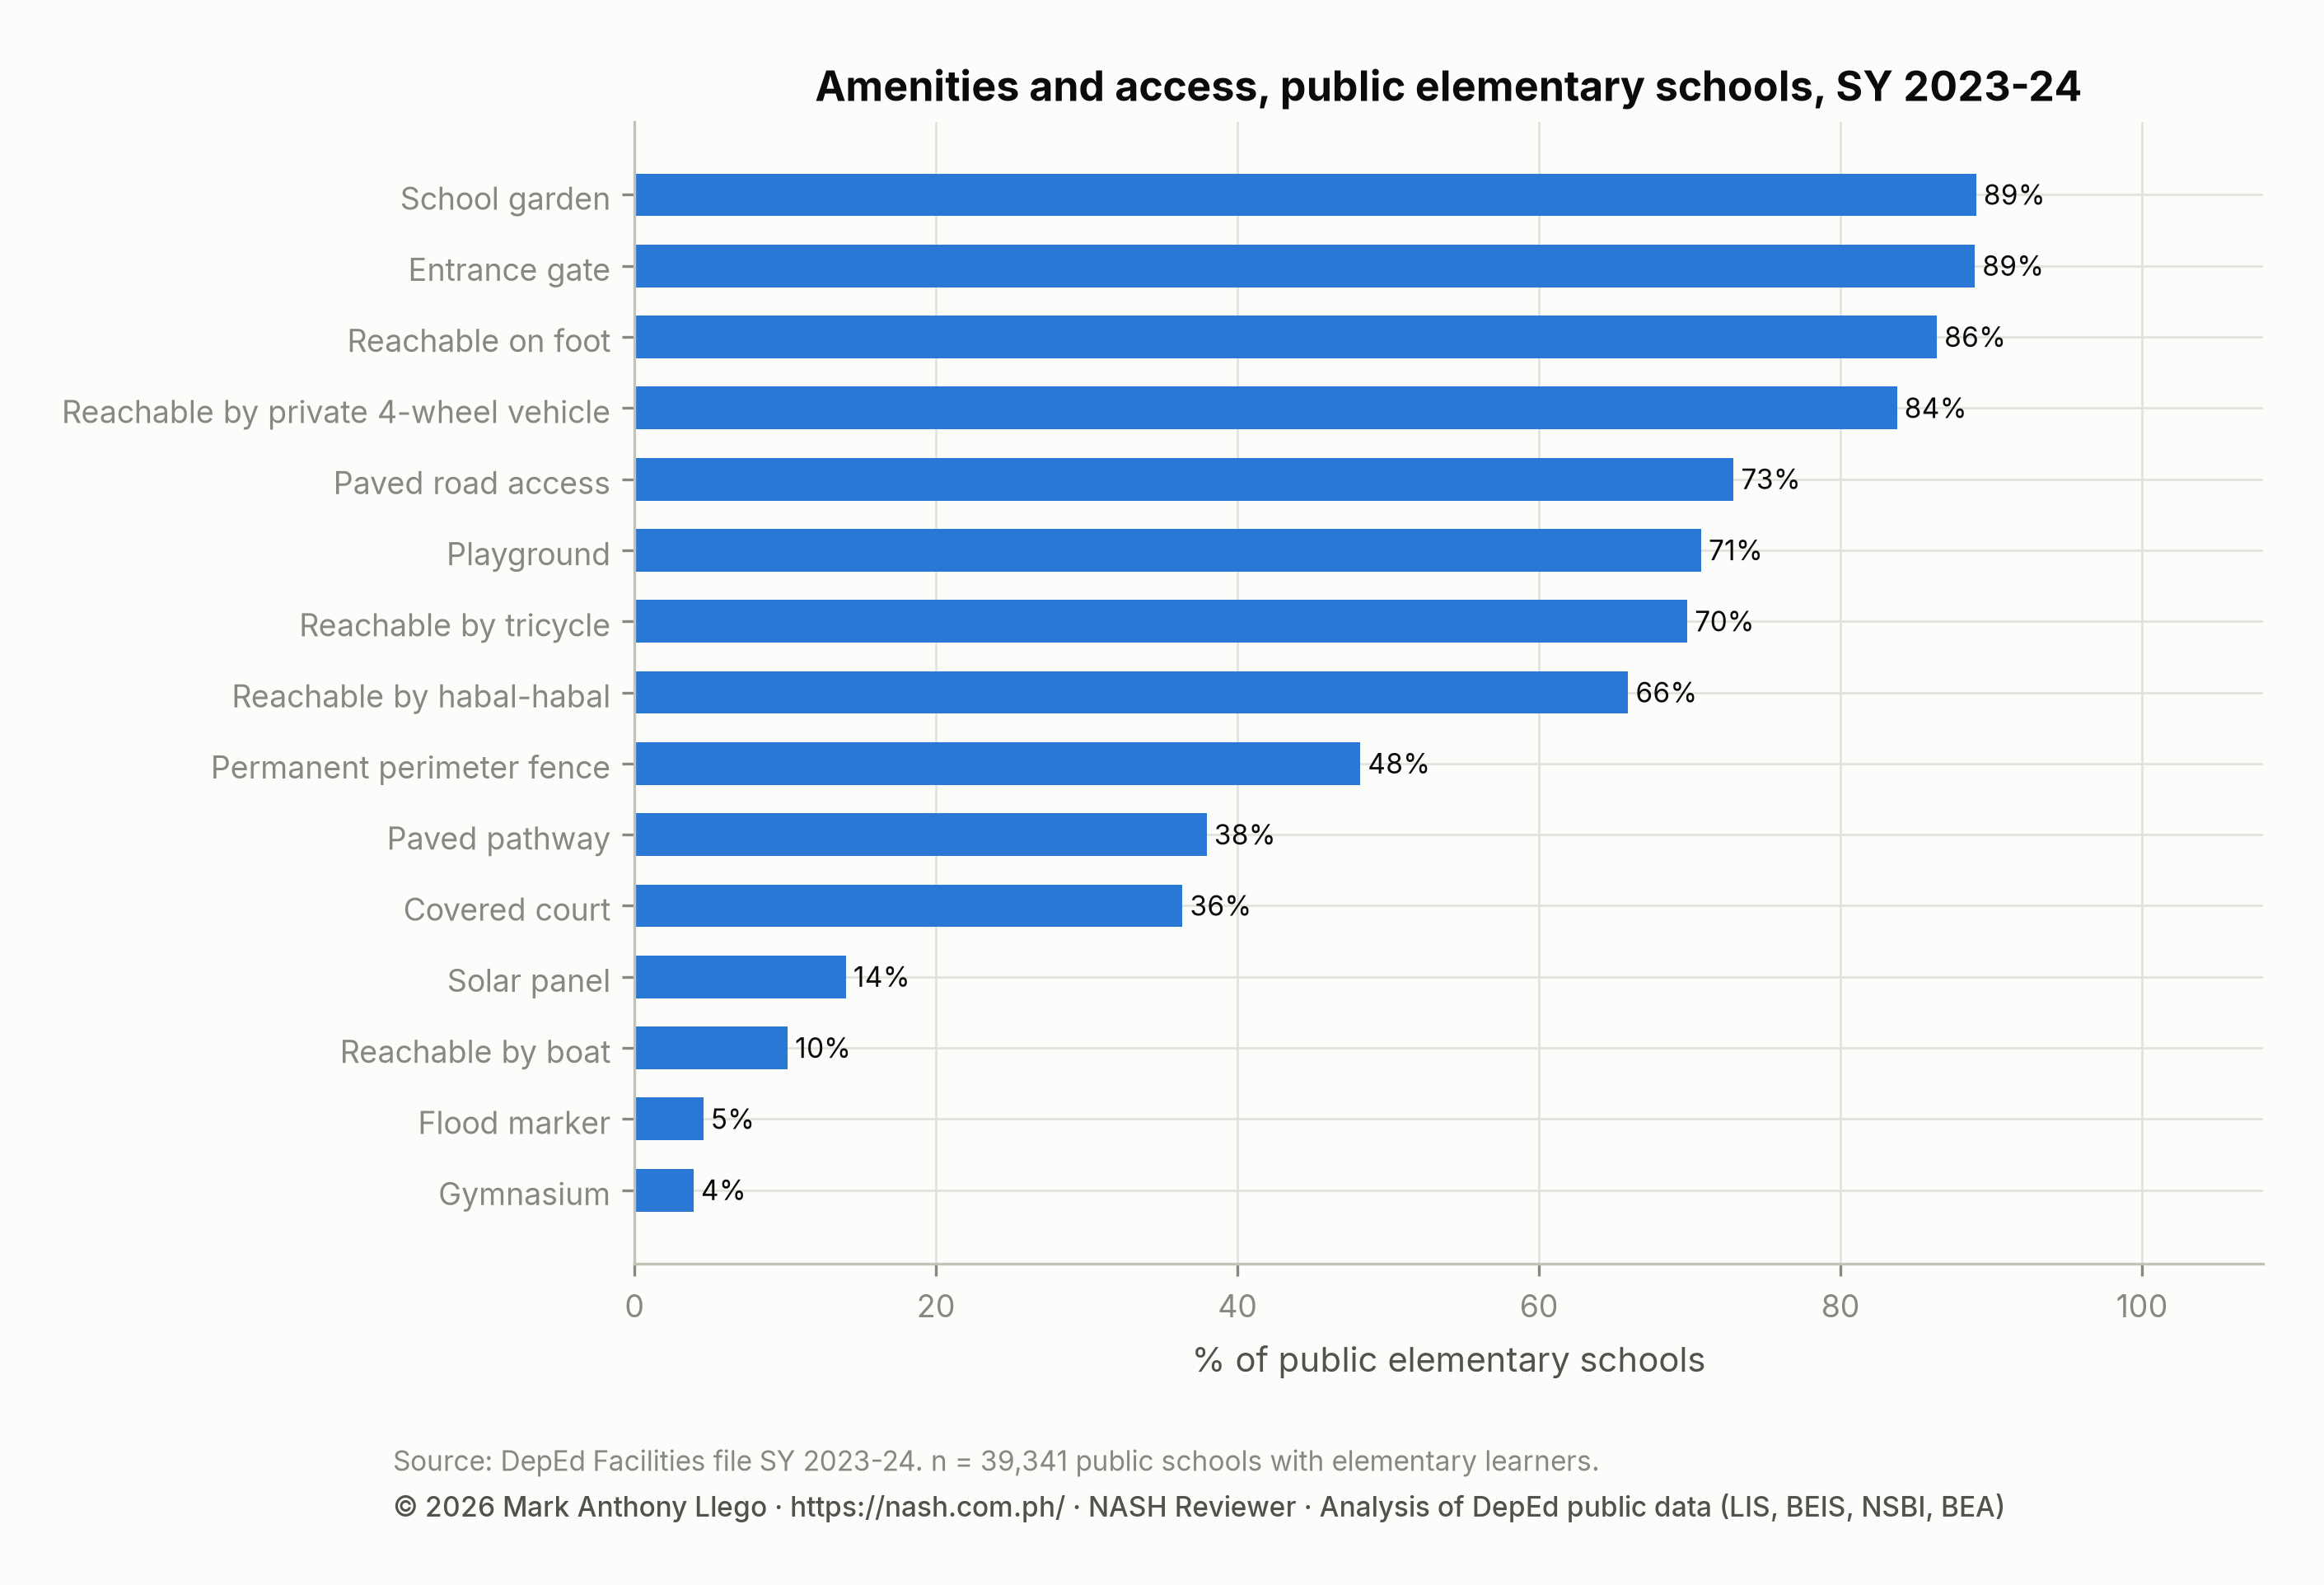
Only 2,344 elementary schools reported access data, so the access shares describe those schools rather than the country. Of them, 86.4% can be reached on foot, 83.7% by private four-wheel vehicle and 72.9% by paved road. 69.8% can be reached by tricycle, 65.9% by habal-habal and 10.2% by boat.
| Amenity or access | Share of public elementary schools | Schools with data |
|---|---|---|
| Covered court | 36.3% | 39,340 |
| Gymnasium | 3.9% | 39,340 |
| Permanent perimeter fence | 48.1% | 39,340 |
| Entrance gate | 88.9% | 39,340 |
| Playground | 70.8% | 39,340 |
| School garden | 89.0% | 39,340 |
| Solar panel | 14.0% | 39,340 |
| Paved pathway | 38.0% | 39,340 |
| Flood marker | 4.6% | 39,340 |
| Paved road access | 72.9% | 2,344 |
| Reachable by private 4-wheel vehicle | 83.7% | 2,344 |
| Reachable by tricycle | 69.8% | 2,344 |
| Reachable by boat | 10.2% | 2,344 |
| Reachable by habal-habal | 65.9% | 2,344 |
| Reachable on foot | 86.4% | 2,344 |
Classroom crowding and test results
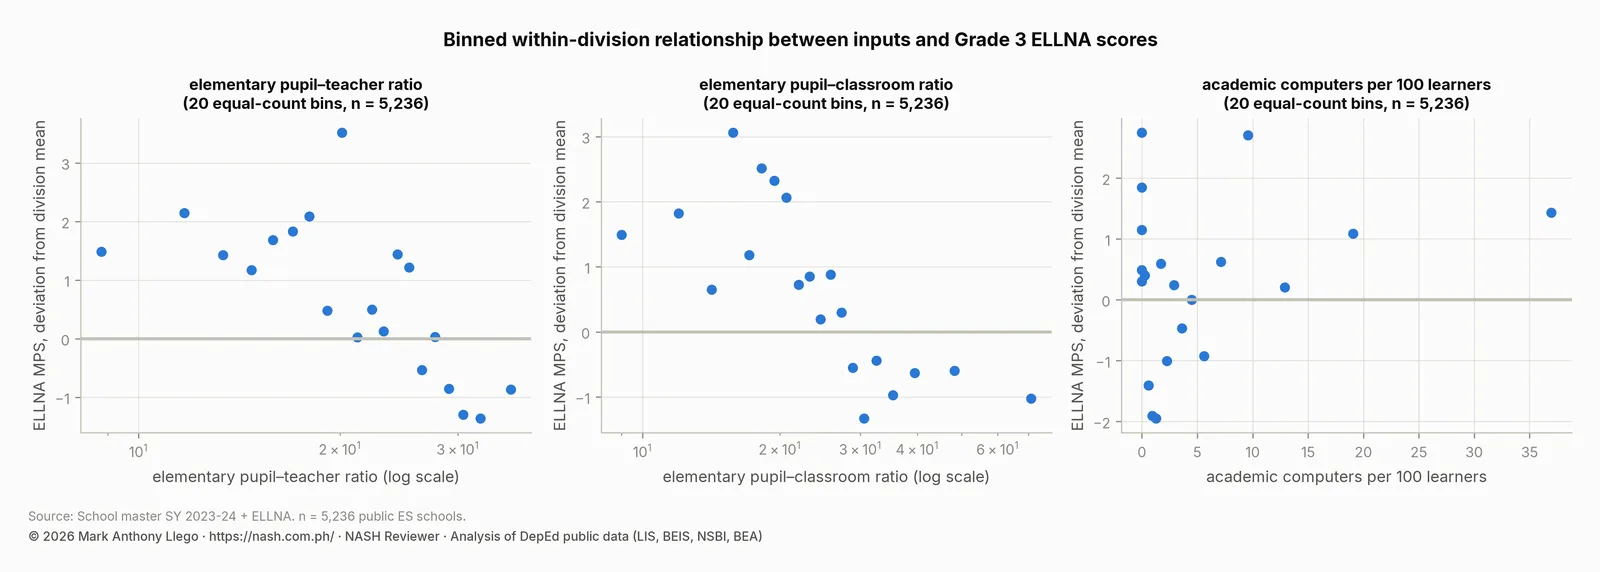
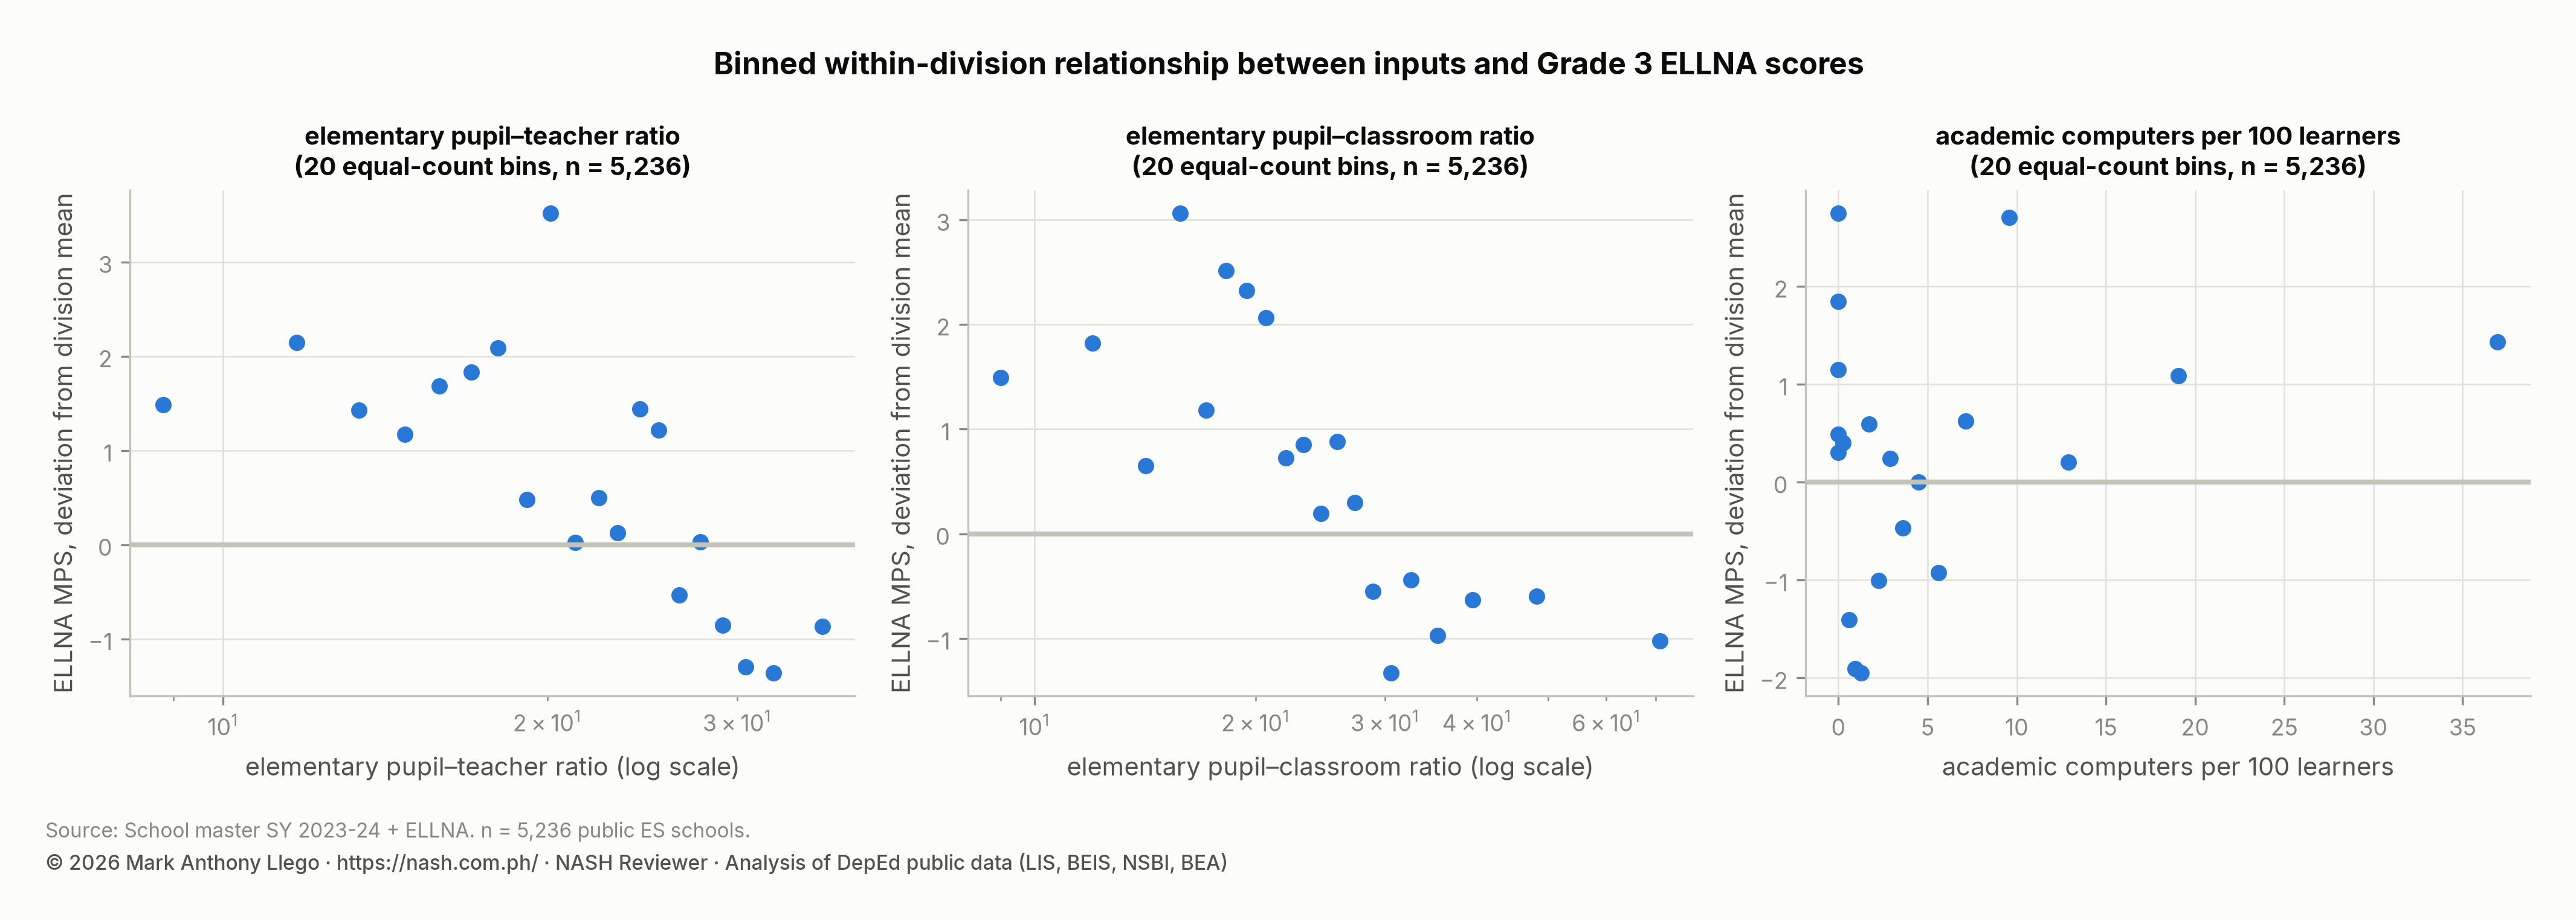
In the five regions with test data, the pupil-classroom ratio shows no detectable association with Grade 3 Early Language, Literacy and Numeracy Assessment (ELLNA) or Grade 6 National Achievement Test (NAT) results once schools are compared within the same division. It shows only a weak negative association with Grade 1 to 3 reading levels. The binned chart below shows the Grade 3 pattern: a gentle downward slope that stays within about two points of the division mean across the whole range of crowding.
In these files, crowded classrooms are a welfare and safety problem before they are a measurable test-score problem. The analysis of school inputs and test results has the full models.
What this means for school heads
- Count rooms the way the NSBI does. Only instructional rooms count. A library or a faculty room does not lower the ratio.
- Know the classification of each building. A building marked for condemnation is unsafe and unused, and a school head who keeps classes in one is responsible for the risk. The repair categories decide a school’s place in the Basic Education Facilities Fund queue.
- Makeshift rooms are common and should be temporary. Three in ten schools have them. The school’s plan should say when and how each one will be replaced.
- Amenities are usually community projects. Fences, covered courts and gardens are where PTA and LGU contributions appear in the data.
How these numbers were made
- Source: DepEd’s School Facilities dataset for SY 2023-2024 (NSBI), joined to the learner file on school ID; public schools only.
- Pupil-classroom ratio = total enrollment ÷ (elementary + junior-high + senior-high instructional rooms), for schools with both above zero; regional ratios are sums over sums.
- Building shares are each category’s count divided by all buildings in the region.
- Amenity shares are for the 39,340 public schools with elementary learners and amenity data; access shares for the 2,344 with access data.
- 669 public elementary schools with no classroom count are missing for the elementary ratio, never zero.
Limits
The NSBI covers public schools only, so there is no facilities data for private schools. The file has no seat counts, so DepEd’s seat-learner ratio cannot be computed. Room counts are by level and cannot be split by grade. School heads report building condition themselves against DepEd’s definitions, and few schools fill in the access fields.
Frequently asked questions
How many learners per classroom are there in DepEd public schools?
Public schools had 35.1 learners per instructional room nationally in SY 2023-2024, counting all learners over all instructional rooms. The median school has 27.2. NCR (55.1) and BARMM (46.4) are the most crowded regions.
What share of DepEd school buildings need repair?
70% of public school buildings were not in good condition in SY 2023-2024. 31% need minor repair, 29% need major repair, 7% are for condemnation and 2% are for demolition.
How many DepEd schools use makeshift classrooms?
29.1% of public schools have at least one makeshift room. Schools use 34,372 makeshift rooms nationally. By share of schools, BARMM, Region XII and NIR have the most.
Download the data
The cleaned, harmonized DepEd files behind this series are free to download in CSV and Parquet, with a codebook and checksums, under the terms of use set out in the release. Download Cleaned DepEd School Data, SY 2017-18 to 2025-26 documents every file and column. The files themselves are at data.nash.com.ph, starting with the README, the SY 2023-24 school master file (CSV, 8.0 MB) and the nine-year enrollment panel (Parquet, 17.2 MB).
More in this series
- DepEd Enrollment Trends SY 2017-2018 to SY 2025-2026
- Enrollment by school year: SY 2017-18, SY 2018-19, SY 2019-20, SY 2020-21, SY 2021-22, SY 2022-23, SY 2023-24, SY 2024-25, SY 2025-26
- DepEd Learner Data SY 2023-2024: IP, ALIVE and School Size
- DepEd Teachers and School Personnel Data, SY 2023-2024
- DepEd WASH Data SY 2023-2024: Toilets, Water, Electricity
- DepEd ICT Data SY 2023-2024: Computers and Internet
- NAT Grade 6 Results SY 2023-2024: DepEd Division Scores
- ELLNA Grade 3 Results SY 2023-2024: DepEd Division Scores
- CRLA Results SY 2025-2026: Reading Levels in Grades 1 to 3
- DepEd School Inputs vs Test Results: Multigrade and Internet
- DepEd Open Data Quality: Errors, Blanks and Coverage Limits
- Download Cleaned DepEd School Data, SY 2017-18 to 2025-26
- The full report: Philippine basic education in numbers
Guides for aspiring school heads
- DepEd Data for Aspiring School Heads: Where to Start
- NASH Practice Questions With Answers: 50 Items on the PPSSH
- How to Read DepEd Data: A Guide for Aspiring School Heads
- EDCOM II Final Report: Guide for Aspiring School Heads
- National Education Plan 2026-2035: Guide for School Heads
- NASH Study Guide: DepEd Memorandum 069, s. 2025 and PPSSH
- PPSSH Domain 1: Leading Strategically With DepEd Data
- PPSSH Domain 2: Managing School Operations With DepEd Data
- PPSSH Domain 3: Teaching and Learning With DepEd Data
- PPSSH Domain 4: Developing Self and Others With DepEd Data
- PPSSH Domain 5: Building Connections With DepEd Data
Analysis and charts by Mark Anthony Llego for NASH Reviewer. Data: Department of Education public datasets. Charts may be reused only with written permission from support@nash.com.ph.