Learning Continuity Spaces (LCS) are DepEd’s prefabricated, modular classrooms for schools hit by disasters or short of rooms, as news reports describe them: semi-permanent units of two to five classrooms with toilets and WASH (water, sanitation and hygiene) facilities, installed in four to eight weeks, built to withstand winds of 250 km/h, and funded by a PHP 3.5 billion allocation under the Basic Education Facilities Fund (Alcober, 2026; Apacible, 2026; DepEd Accelerates Rollout, 2026). Daily Tribune reported on 23 October 2026 that DepEd had completed 391 and had another 150 under construction, and that 878 units were in the pipeline under the first two phases of the program.
The School Building Program (SBP) 2026 masterlist, as published in the EDCOM II classroom construction dashboard, has 798 DepEd LCS lines at 797 schools, with 805 units and PHP 2.17 billion, 2.5% of the list’s classrooms. The masterlist counts 795 of the lines as one classroom each, while the news describes units of two to five classrooms, and the lines’ budgets come in steps of about PHP 2.15 million; the masterlist does not say how many classrooms a unit holds. Region V (Bicol) has the most lines, 157, and NCR and BARMM have none. Compared with other schools, those with an LCS line are more often rural, more often Last Mile Schools and more often users of makeshift rooms.
The news counts and the masterlist’s come from different sources, at different dates and in different units. The post is written for teachers, school heads and aspiring school heads whose school has, or hopes for, a Learning Continuity Space, and for anyone citing the program in a school improvement plan, a thesis or an action research paper. Every file behind it is listed on the EDCOM II classroom data page.
Key findings
- News reports describe Learning Continuity Spaces as prefabricated, modular, semi-permanent units of two to five classrooms with toilets and WASH facilities, installed in four to eight weeks and built for winds of 250 km/h.
- Daily Tribune reported on 23 October 2026 that 391 LCS were completed and 150 under construction, with 878 units in the pipeline under the first two phases; these counts come from a different source and date than the masterlist’s.
- The SBP 2026 masterlist has 798 DepEd LCS lines at 797 schools, with 805 units and PHP 2.17 billion, 2.5% of the list’s classrooms.
- The masterlist counts 795 of the 798 lines as one classroom each, and their budgets fall in steps of about PHP 2.15 million: 595 lines (74.6%) at one step and 139 at two.
- Region V has the most LCS lines, 157 (19.7%), with Camarines Sur alone at 50, while NCR and BARMM have none.
- Schools with an LCS line are 1.85 times as likely as other schools to be Last Mile Schools (33.8% against 18.3%) and 1.34 times as likely to use makeshift rooms (38.8% against 28.9%).
- They are about as likely as other schools to have a building for condemnation or demolition, 29.6% against 28.9% (risk ratio 1.02, 95% interval 0.92 to 1.14).
What Learning Continuity Spaces are, from the news
The Manila Times described Learning Continuity Spaces on 12 July 2026 as prefabricated, disaster-resilient classrooms “to address immediate classroom needs in disaster-affected areas”: “semi-permanent, modular classrooms” installed within four to eight weeks, able to withstand winds of up to 250 kilometers per hour and meeting Seismic Zone 4 structural standards, in layouts from two-classroom buildings to five-room facilities. The Education Secretary called them “vital stopgaps to address severe classroom shortages over a short period” (DepEd Accelerates Rollout, 2026).
Daily Tribune gave a fuller picture of each unit on 23 October 2026:
“Called Learning Continuity Space (LCS), each modular structure features flexible layouts housing two to five classrooms, depending on what the school needs, three toilets, WASH facilities, and provisions for rainwater storage.” (Alcober, 2026)
The same report said the units are built to withstand 250 km/h winds and strong earthquakes and are designed for rapid deployment in four to eight weeks. On funding, Daily Tribune reported on 24 April 2026 that “The initiative, backed by a P3.5-billion allocation under the Basic Education Facilities Fund, targets schools facing severe classroom shortages and those vulnerable to typhoons and other disruptions.” Funds are downloaded directly to schools division offices (SDOs) for faster local procurement, the program prioritizes local materials and labor, and early installations were in Bogo City, Cebu; Masbate; and Tagum City, Davao (Apacible, 2026).
The reports also give counts, each at its own date:
| Date | Source | What it reports |
|---|---|---|
| 24 April 2026 | Daily Tribune | A PHP 3.5 billion allocation under the Basic Education Facilities Fund; early installations in Bogo City, Cebu; Masbate; and Tagum City, Davao |
| 12 July 2026 | The Manila Times | 878 LCS units under the first two phases underway: 453 under construction, 391 in procurement and 34 completed; separately, 109 more ready-to-assemble classrooms across seven regions, 83 of them in the Davao Region for earthquake-affected schools |
| 20 October 2026 | EDCOM II news release | For FY 2027, the National Expenditure Program proposes PHP 30.55 billion for classroom construction, with an additional request of PHP 23.5 billion from DepEd, for 2,385 new classrooms, 69 Last Mile School buildings, 500 Learning Continuity Spaces and the repair of 3,500 classrooms, among others |
| 23 October 2026 | Daily Tribune | 391 completed and another 150 under construction; 878 units in the pipeline under the first two phases |
Read each count with its date and source. The Manila Times article uses both “units” and “classrooms” for its counts, so a count of units may be a count of classrooms, and none of the reports says how many classrooms the 878 units hold in all. These counts and the masterlist’s come from different sources, at different dates, and may count different things.
Learning Continuity Spaces in the SBP 2026 masterlist: lines, units and budgets
The masterlist has 798 lines implemented by DepEd under its LCS modality, at 797 schools, with 805 units and PHP 2.17 billion under the General Appropriations Act (GAA) 2026. The masterlist gives 2026 as their expected start year. The dashboard counts LCS units as classrooms, so they make up 2.5% of the list’s 32,419 classrooms; DepEd School Building Program 2026 in Numbers describes the whole list.
How many classrooms is a line? The masterlist counts 795 of the 798 lines as one classroom each. The news reports describe each unit as two to five classrooms. The masterlist does not state how many classrooms a unit holds, so its 805 are best read as units, not classrooms.
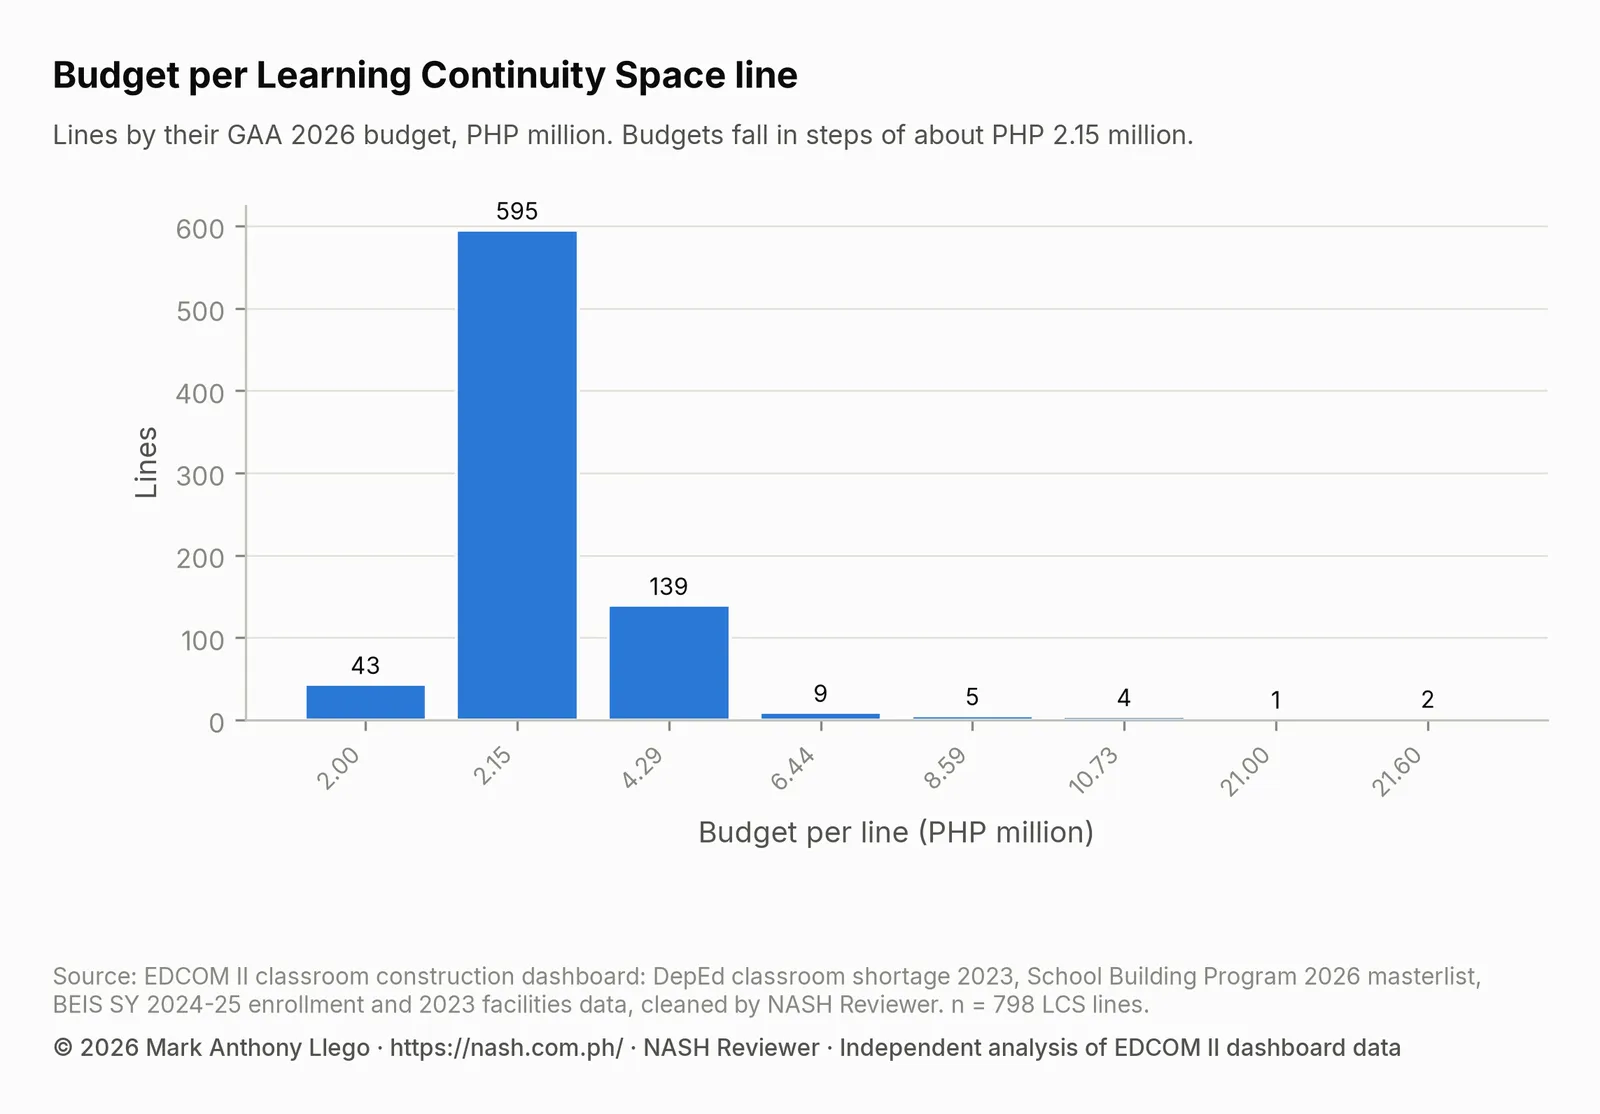
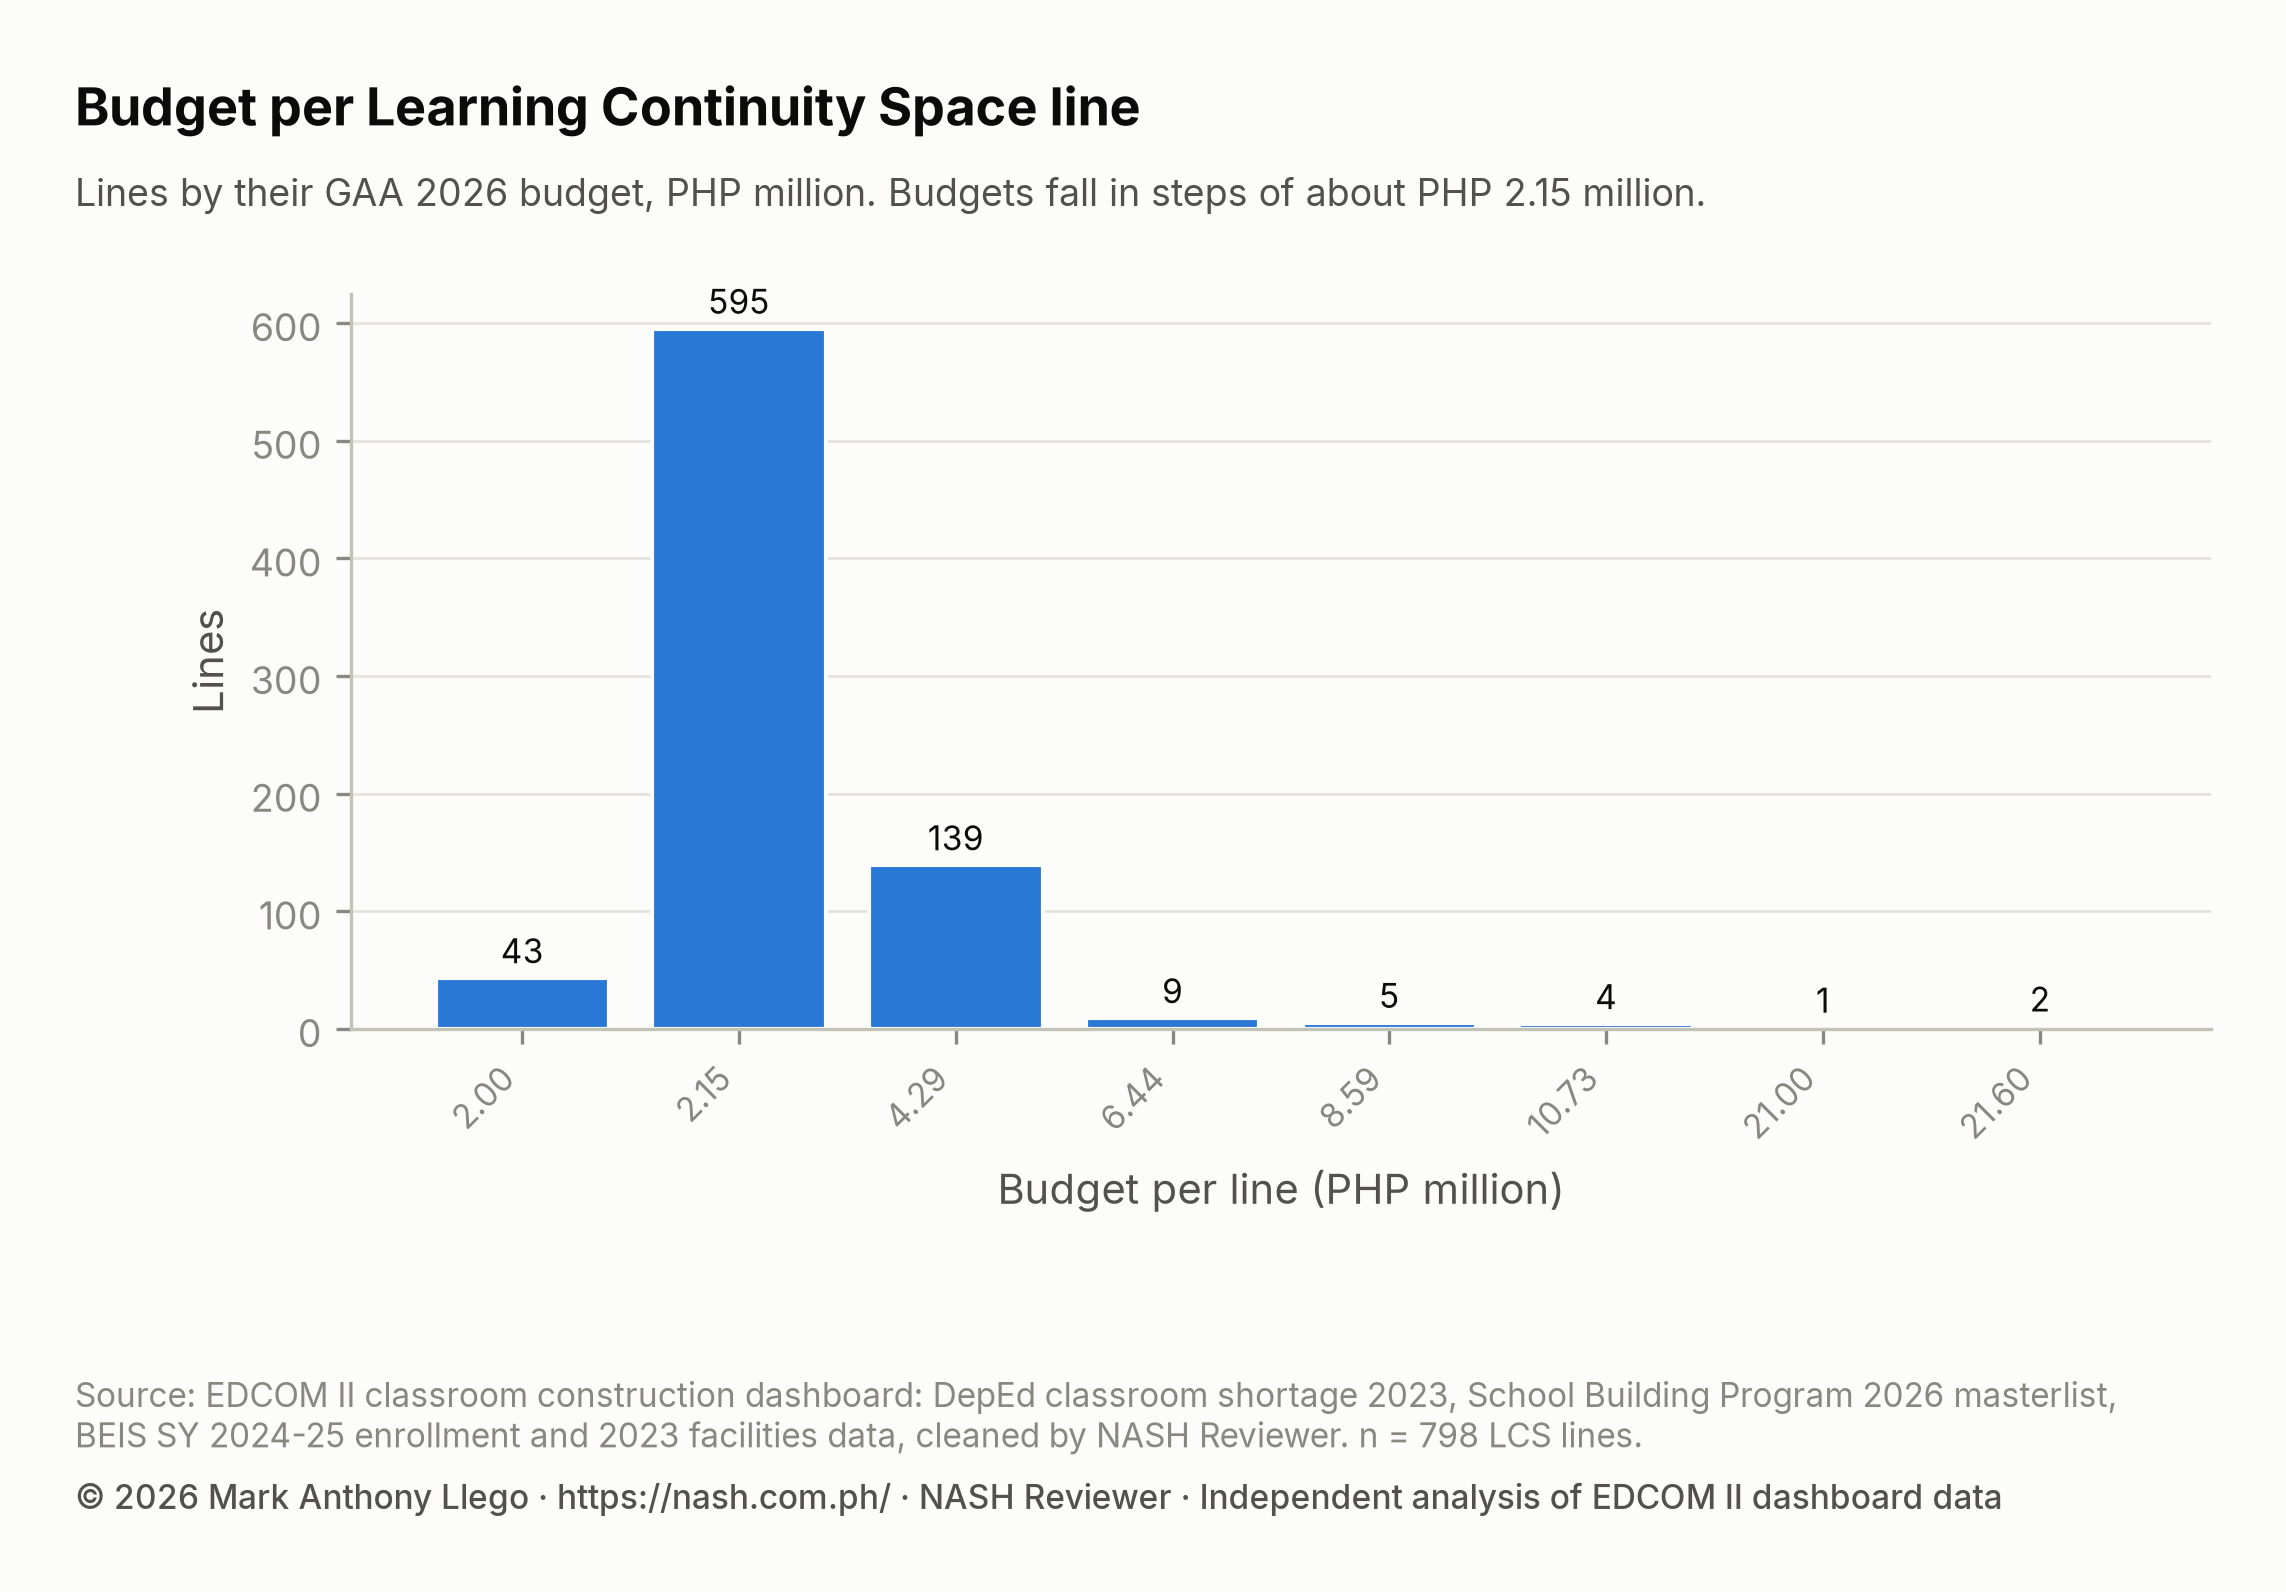
The budgets are not spread out; they come in steps. The 752 lines whose scope of work reads only “Construction and Installation of Learning Continuity Spaces” have budgets that are whole multiples of about PHP 2.15 million: 595 lines (74.6%) at one step, 139 at two, 9 at three, 5 at four and 4 at five. Another 43 lines read “Installation of 1 unit/s of Learning Continuity Space with attached toilets” and carry PHP 2 million each. The few remaining lines describe larger prefabricated buildings in their own words.
Every line on a step, whatever its number of steps, is counted as one classroom. The masterlist does not say what a step stands for, whether a classroom, a unit or something else. Only 44 lines name a toilet in their scope of work; the news reports describe three toilets as part of each unit.
The median budget is PHP 2.15 million per line and the mean PHP 2.72 million. How Much Does a Classroom Cost in the Philippines? divides each line’s budget by its units: the median is PHP 2.15 million per unit, and the total budget divided by the total units is PHP 2.69 million. These are allocations, not prices, and since the size of a unit is not stated, they cannot be read as a cost per classroom.
Daily Tribune reported a PHP 3.5 billion allocation for the program, and the masterlist’s LCS lines carry PHP 2.17 billion. The two figures come from different sources.
Where the Learning Continuity Spaces go: regions and provinces
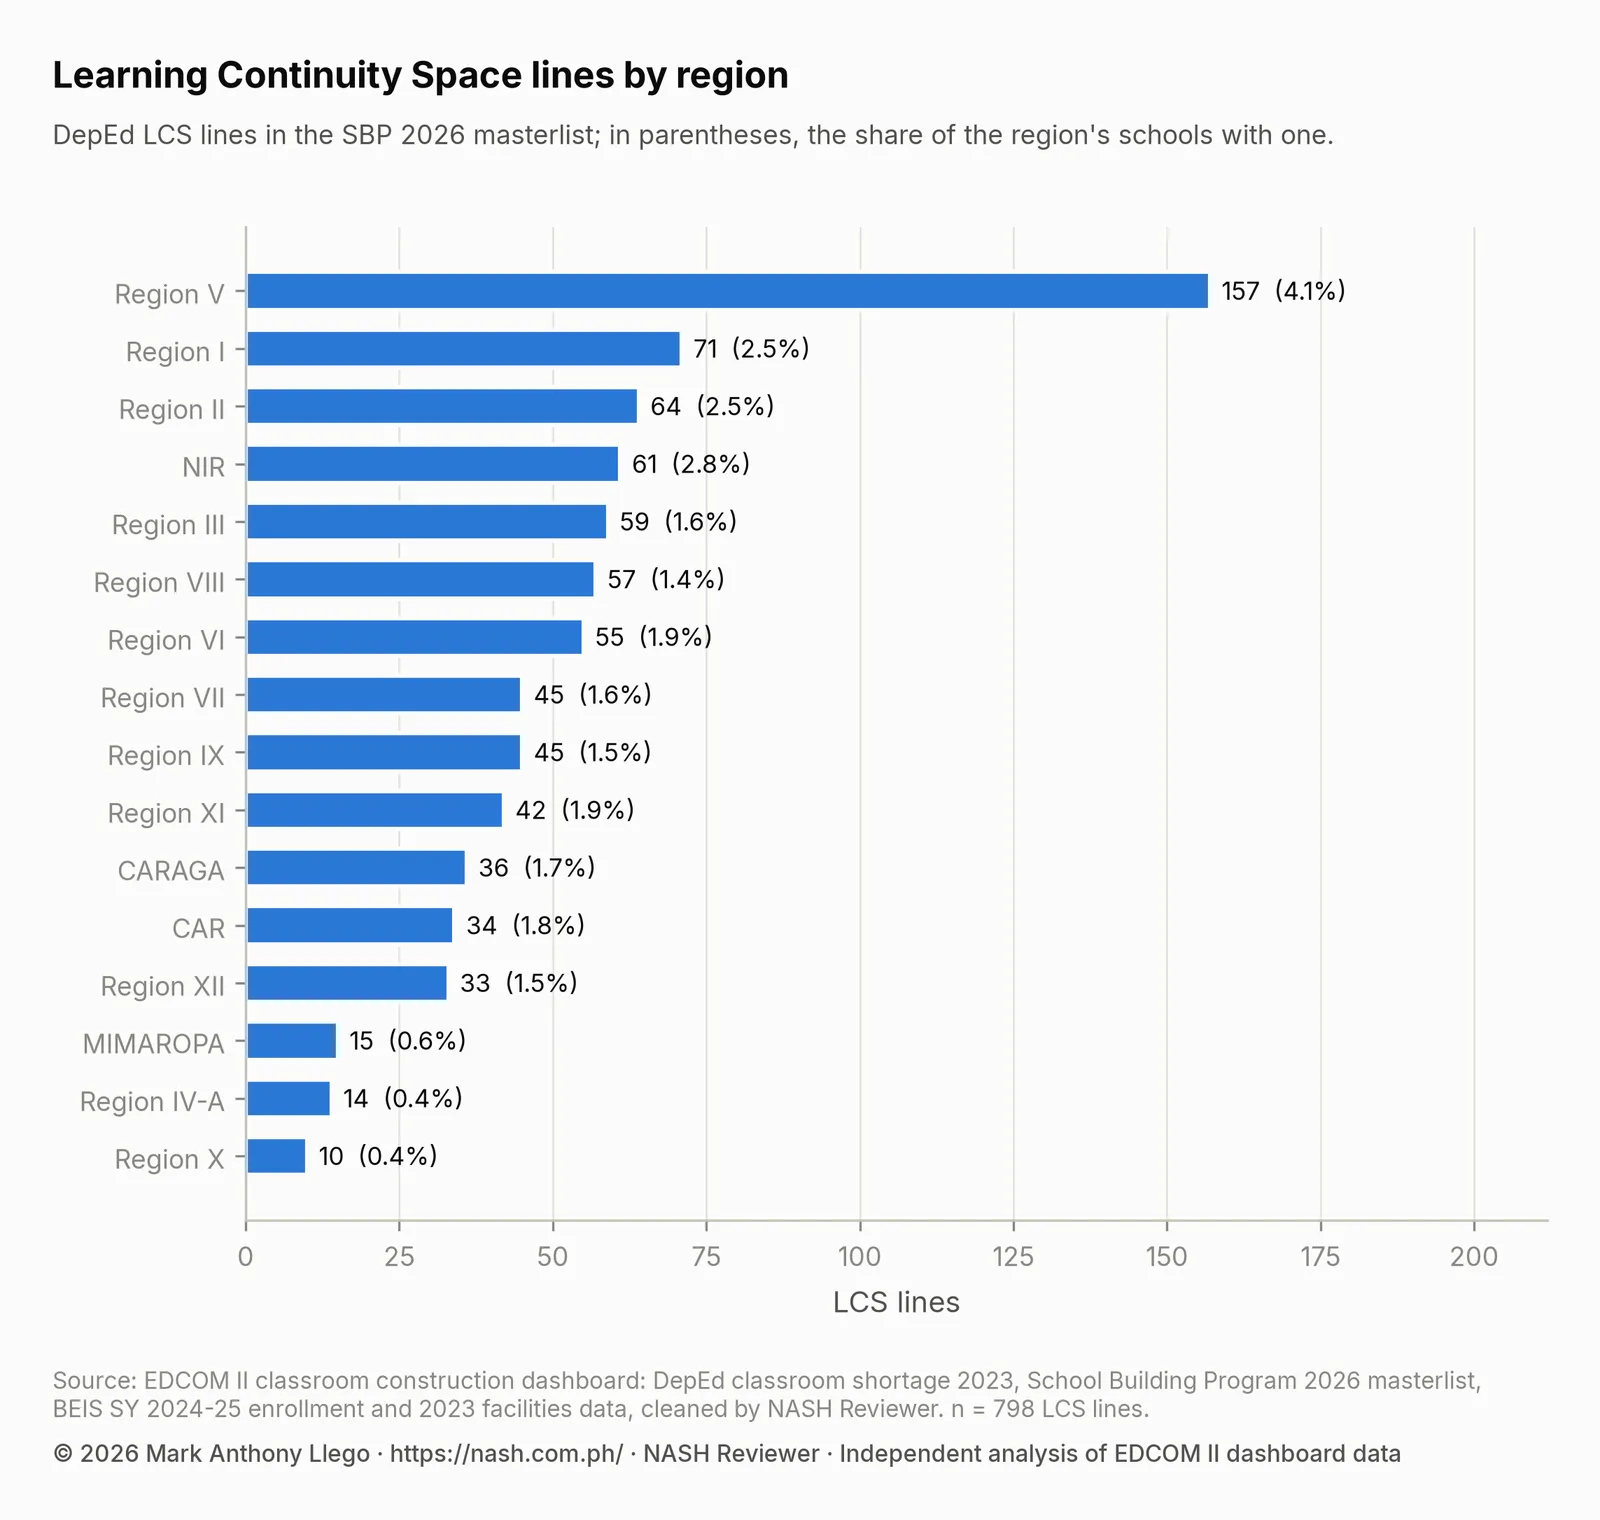
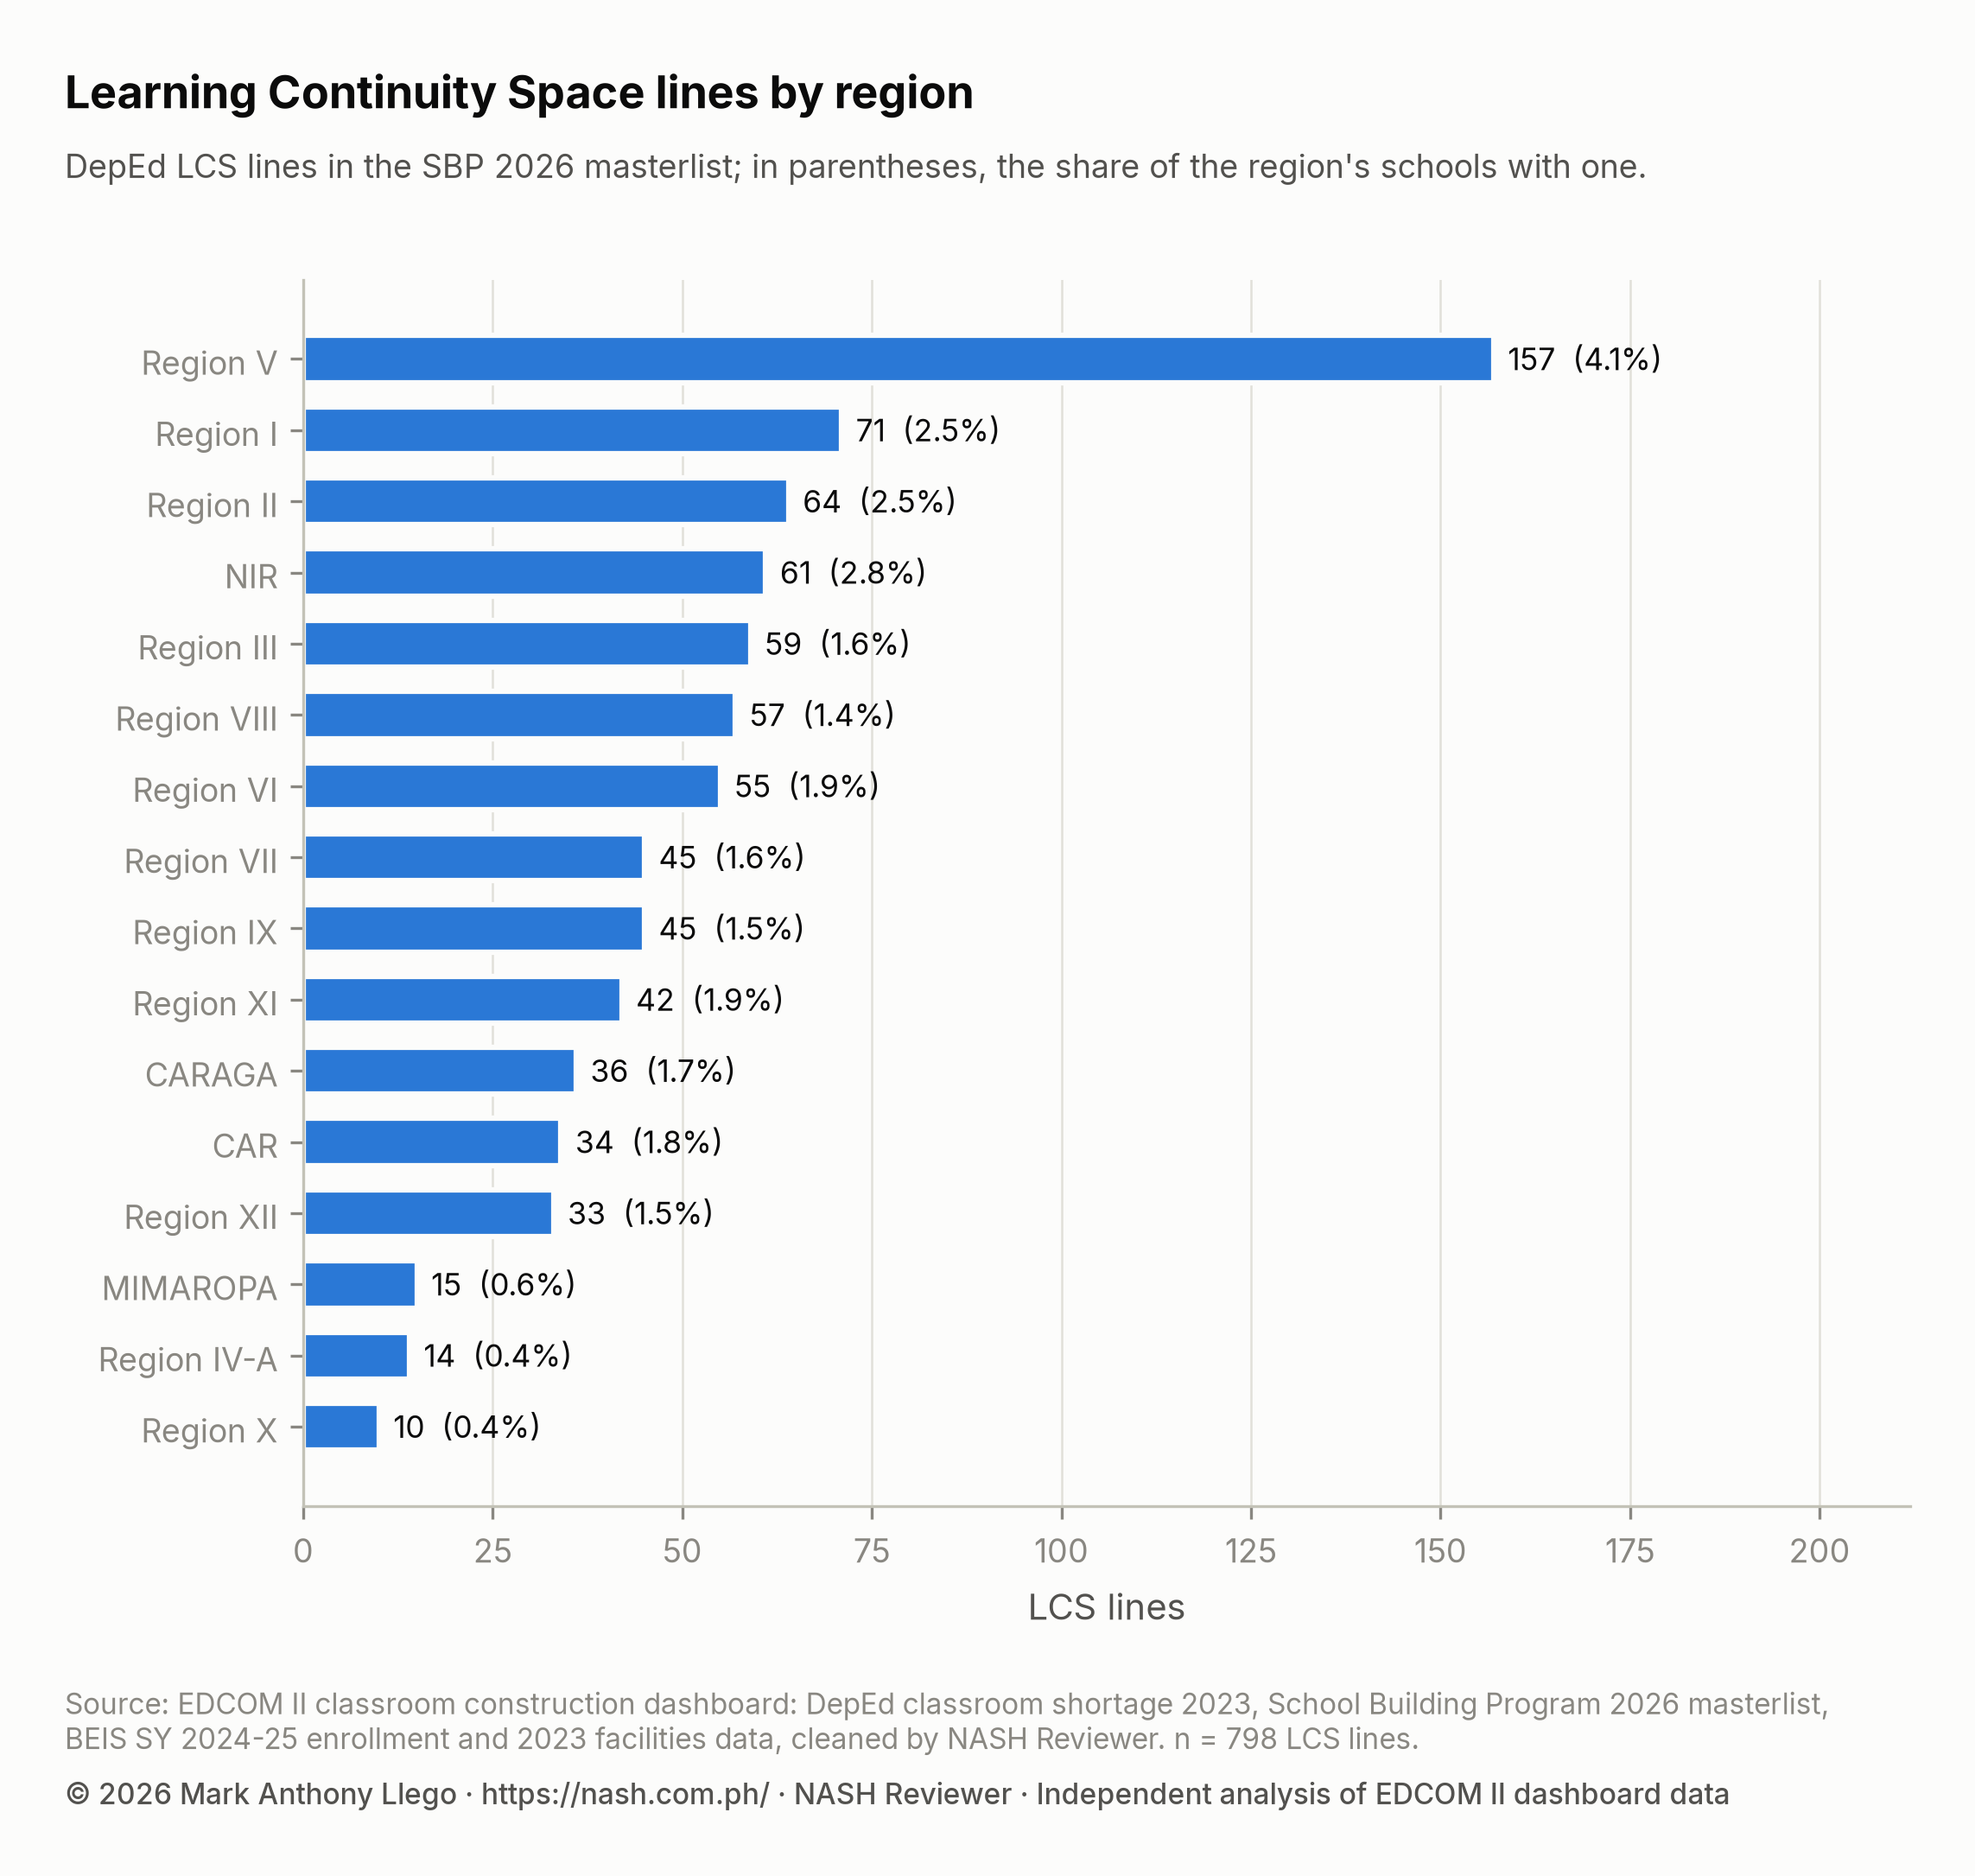
Region V (Bicol) stands out. It has 157 lines, 19.7% of all LCS lines and more than twice as many as any other region, and 4.1% of its schools have one, the highest share. NIR has the second-highest share, 2.8%. At the other end, Region X (10 lines), Region IV-A (14) and MIMAROPA (15) have the fewest, and NCR and BARMM have none.
| Region | LCS lines | Budget | Share of the region’s schools with an LCS line |
|---|---|---|---|
| NCR | 0 | None | 0.0% |
| CAR | 34 | PHP 0.10 billion | 1.8% |
| Region I | 71 | PHP 0.17 billion | 2.5% |
| Region II | 64 | PHP 0.16 billion | 2.5% |
| Region III | 59 | PHP 0.14 billion | 1.6% |
| Region IV-A | 14 | PHP 0.04 billion | 0.4% |
| MIMAROPA | 15 | PHP 0.03 billion | 0.6% |
| Region V | 157 | PHP 0.40 billion | 4.1% |
| Region VI | 55 | PHP 0.14 billion | 1.9% |
| NIR | 61 | PHP 0.15 billion | 2.8% |
| Region VII | 45 | PHP 0.12 billion | 1.6% |
| Region VIII | 57 | PHP 0.13 billion | 1.4% |
| Region IX | 45 | PHP 0.14 billion | 1.5% |
| Region X | 10 | PHP 0.02 billion | 0.4% |
| Region XI | 42 | PHP 0.21 billion | 1.9% |
| Region XII | 33 | PHP 0.12 billion | 1.5% |
| CARAGA | 36 | PHP 0.09 billion | 1.7% |
| BARMM | 0 | None | 0.0% |
Budgets do not follow the line counts exactly: Region XI’s 42 lines carry PHP 0.21 billion, more than Region I’s 71 lines (PHP 0.17 billion). Sulu is counted in Region IX here, since its schools division moved to DepEd Region IX on 20 October 2026. Region V’s report reads that region’s schools and SBP lines in detail.
By province, the lines gather in a few places. Camarines Sur alone has 50, and three Bicol provinces, Camarines Sur, Masbate and Albay, are among the ten with the most.
| Province or city | LCS lines |
|---|---|
| Camarines Sur | 50 |
| Masbate | 35 |
| Negros Oriental | 34 |
| Isabela | 33 |
| Samar | 29 |
| Iloilo | 29 |
| Bohol | 27 |
| Albay | 27 |
| Ilocos Norte | 24 |
| Davao Occidental | 23 |
Daily Tribune’s April 2026 report named Masbate among the places with early installations (Apacible, 2026); the masterlist does not say whether its Masbate lines are those installations. The news reports say LCS are meant for disaster-affected and typhoon-vulnerable schools as well as those with severe shortages, but the data here do not record typhoon or earthquake damage, so they cannot show how far the regional pattern follows disasters. The data show where the lines are, not why.
Which schools receive a Learning Continuity Space
Of the 797 schools with an LCS line, 781 are in DepEd’s 2023 shortage table. The table compares them with the other schools in that table on five traits.
| Indicator | Schools with an LCS line | Other schools | Risk ratio (95% interval) |
|---|---|---|---|
| Has a classroom shortage (2023) | 61.2% (478 of 781) | 54.1% (25,345 of 46,878) | 1.13 (1.07 to 1.20) |
| Uses makeshift rooms (2023) | 38.8% (303 of 781) | 28.9% (13,503 of 46,800) | 1.34 (1.23 to 1.47) |
| Has a building for condemnation or demolition | 29.6% (231 of 781) | 28.9% (13,519 of 46,799) | 1.02 (0.92 to 1.14) |
| Last Mile School | 33.8% (264 of 781) | 18.3% (8,556 of 46,878) | 1.85 (1.68 to 2.05) |
| Rural | 89.9% (702 of 781) | 76.8% (35,874 of 46,714) | 1.17 (1.14 to 1.20) |
The last column is a risk ratio: the share of schools with an LCS line that have the trait, divided by the share of other schools that have it. A ratio of 1 means the two shares are equal; 1.85 means schools with an LCS line are 1.85 times as likely to have the trait. The 95% interval, computed with the log method of Katz and colleagues (1978), shows how precisely the ratio is known. When the whole interval lies above 1, the difference is clear; when it includes 1, the data cannot tell the two groups apart on that trait.
Two traits set the LCS schools apart most clearly. 33.8% are Last Mile Schools, against 18.3% of other schools (risk ratio 1.85, 1.68 to 2.05), and 38.8% used makeshift rooms in 2023, against 28.9% (1.34, 1.23 to 1.47). They are also more often rural, 89.9% against 76.8% (1.17, 1.14 to 1.20), and somewhat more often short of classrooms, 61.2% against 54.1% (1.13, 1.07 to 1.20). On buildings for condemnation or demolition they hardly differ: 29.6% against 28.9%, a risk ratio of 1.02 whose interval, 0.92 to 1.14, includes 1.
Schools with an LCS line are smaller than other schools: the median one has 175 learners in SY 2024-25, against 226. Both groups have a median 2023 shortage of 1.0 classroom, and together the 781 schools had a 2023 shortage of 1,799 classrooms. Of them, 77 (9.9%) also have another SBP 2026 line. Last Mile Schools are in Geographically Isolated and Disadvantaged and Conflict-Affected Areas (GIDCAs) and hardship posts (EDCOM II, 2026); Last Mile Schools: Classroom Need and 2026 Allocation looks at them in detail.
Do 2026 Classrooms Go Where the Shortage Is? found that DepEd’s own lines, LCS and Last Mile School lines together, follow the 2023 shortage least of the four groups of implementers, with a concentration index of 0.09. That fits what the table shows: the LCS lines lean toward remote, rural schools and schools using makeshift rooms, more than toward the largest shortages. Remoteness and disaster damage are not what the 2023 shortage counts, so a low index is not, on its own, evidence of poor targeting.
What this means for school heads
- Treat an LCS as a stopgap and keep planning permanent rooms. The news reports describe Learning Continuity Spaces as semi-permanent, and the Education Secretary called them “vital stopgaps”. Keep the need for permanent classrooms in your school improvement plan and AIP even when a unit arrives.
- Check your school’s line. Download the SBP lines file and filter it by your school ID: an LCS line has
implementation_modality“DEPED - LCS”, with its budget and scope of work. In the school table,sbp_classrooms_lcsgives your school’s LCS units. - Ask your schools division office what the unit will hold. The masterlist does not say how many classrooms a unit has, and only 44 lines name a toilet. Daily Tribune reported that funds go directly to SDOs for local procurement, so the SDO is the office to ask about the number of rooms, the toilets and water, and what the school must prepare.
- Document damage and makeshift rooms as they happen. Schools with an LCS line more often use makeshift rooms, and the 2023 data cannot show damage from later typhoons or earthquakes. Record damaged rooms and makeshift classes with dates and photos, during Brigada Eskwela and after each calamity, so the division has current evidence.
- Cite the counts with their dates. In a thesis or an action research paper, give the news counts (for example, 391 completed and 150 under construction by 23 October 2026, as Daily Tribune reported) and the masterlist’s 798 lines and 805 units separately, each with its source. How to Read DepEd Data: A Guide for Aspiring School Heads explains how to read such tables.
How these numbers were made
The data are the SBP 2026 masterlist and the school table from the EDCOM II classroom construction dashboard, cleaned for this series; How the EDCOM Classroom Data Was Cleaned documents every cleaning rule. The analysis was done in Python with pandas and SciPy, and the charts drawn with Matplotlib.
- LCS lines. Lines with
implementation_modality“DEPED - LCS”: 798, at 797 distinct schools. Units are the sum of theclassroomscolumn, as the dashboard counts them. - Budgets. The
budget_phpof each line: the total, the median and the mean per line. - Budget steps. Each budget is rounded to the nearest ten thousand pesos and compared with whole multiples of about PHP 2.15 million; a line is on a step when its budget is within twenty thousand pesos of one. Lines at PHP 2 million are counted separately.
- Toilets. Lines whose
scope_of_workcontains the word “toilet”. - Regions and provinces. Lines are placed by the school’s DepEd region and province (or highly urbanized city). A region’s share is its LCS lines divided by its schools in DepEd’s 2023 shortage table.
- Comparison of schools. The 781 schools with an LCS line that are in the 2023 shortage table, against the other schools in the table. A school has a shortage when its 2023 shortage is above zero; uses makeshift rooms when the 2023 facilities data record at least one elementary or high school makeshift room; has a building for condemnation or demolition when the dashboard’s count of such buildings is above zero; and is rural by the school table’s urban or rural code. Schools missing a trait’s data are left out of that row, so the totals differ slightly by row.
- Risk ratios. The share with the trait among LCS schools divided by the share among other schools, with a 95% interval from the log method (Katz et al., 1978).
Limits
The news counts and the masterlist’s come from different sources at different dates and may count different things: units, buildings or classrooms. In the masterlist, nearly every LCS line counts as one classroom, while the news describes units of two to five classrooms, and the masterlist does not say how many classrooms each unit holds; any count of LCS classrooms from the masterlist should be read as a count of units.
The masterlist shows allocations, not completed units, and the budgets are allocations, not contract prices. Budgets fall in steps, which the masterlist does not explain. The comparison of schools uses DepEd’s 2023 shortage and facilities data and SY 2024-25 enrollment, which cannot show damage from later typhoons or earthquakes, a main purpose of the program in the news reports. The few LCS schools not in the 2023 shortage table are left out of the comparison. The risk ratios show associations, not the reasons a school received a unit, which the masterlist does not record.
Frequently asked questions
What is a Learning Continuity Space?
A Learning Continuity Space (LCS) is a prefabricated, modular, semi-permanent classroom structure that DepEd installs in schools hit by disasters or facing severe classroom shortages. News reports describe each as housing two to five classrooms, with toilets and WASH facilities, installed in four to eight weeks and built to withstand winds of 250 km/h.
How many classrooms are in a Learning Continuity Space?
Daily Tribune and The Manila Times reported that each unit houses two to five classrooms, depending on what the school needs. The SBP 2026 masterlist counts nearly every LCS line as one classroom and does not state how many classrooms each unit holds.
How many Learning Continuity Spaces has DepEd built?
Daily Tribune reported on 23 October 2026 that DepEd had completed 391, with another 150 under construction, and 878 units in the pipeline under the first two phases. The SBP 2026 masterlist, a list of allocations rather than completed units, has 798 LCS lines with 805 units at 797 schools.
How much does a Learning Continuity Space cost?
In the SBP 2026 masterlist, the median LCS line has a budget of PHP 2.15 million, and budgets fall in steps of about that amount; the 798 lines total PHP 2.17 billion. Daily Tribune reported a PHP 3.5 billion allocation for the program under the Basic Education Facilities Fund. These are allocations, not final costs.
Download the data and cite this post
The cleaned EDCOM II classroom data behind this series are free to download for personal study; to reuse them, email support@nash.com.ph for written permission first. How the EDCOM Classroom Data Was Cleaned explains every table and cleaning rule. The files are at data.nash.com.ph: start with the README, then the school table (Parquet, or CSV), the School Building Program lines (CSV), the city and municipality table (CSV), and every table for Stata and SPSS. Every masterlist figure in this post can be computed from the School Building Program lines, using implementation_modality, classrooms, budget_php, scope_of_work and deped_region, and the comparison of schools from the school table, using sbp_classrooms_lcs, shortage_total, es_makeshift_rooms, hs_makeshift_rooms, buildings_condemn_demolish, last_mile_school and urban_rural.
Every file, with its rows, columns and checksum, is listed on the EDCOM II classroom data page. To cite the data: Llego, M. A. (2026). EDCOM II classroom construction dashboard data, cleaned, version 1.1. NASH Reviewer. https://nash.com.ph/edcom-classroom-data
To cite this post: Llego, M. A. (2026, October 28). DepEd Learning Continuity Spaces in the SBP 2026 list. NASH Reviewer Blog. https://nash.com.ph/blog/learning-continuity-spaces-sbp-2026
References
- Alcober, N. (2026, October 23). DepEd completes 391 disaster-resilient school buildings. Daily Tribune. https://tribune.net.ph/2026/10/23/deped-completes-391-disaster-resilient-school-buildings
- Apacible, L. M. (2026, April 24). P3.5B program to speed up deployment of disaster-proof classrooms — DepEd. Daily Tribune. https://tribune.net.ph/2026/04/24/p35b-program-to-speed-up-deployment-of-disaster-proof-classrooms-deped
- DepEd accelerates rollout of Learning Continuity Spaces nationwide. (2026, July 12). The Manila Times. https://www.manilatimes.net/2026/07/12/tmt-newswire/deped-accelerates-rollout-of-learning-continuity-spaces-nationwide/2382863
- Katz, D., Baptista, J., Azen, S. P., & Pike, M. C. (1978). Obtaining confidence intervals for the risk ratio in cohort studies. Biometrics, 34(3), 469–474.
- Llego, M. A. (2026). EDCOM II classroom construction dashboard data, cleaned, version 1.1 [Data set]. NASH Reviewer. https://nash.com.ph/edcom-classroom-data
- Second Congressional Commission on Education (EDCOM II). (2026). National Education Plan 2026–2035 (Year Three report).
- Second Congressional Commission on Education (EDCOM II). (2026, October 20). Put classrooms where they’re needed most, EDCOM 2 tells DepEd [News release]. https://edcom2.gov.ph/put-classrooms-where-theyre-needed-most-edcom-2-tells-deped/
More in this series
- How the EDCOM Classroom Data Was Cleaned
- Philippine Classroom Shortage 2023: Where the Gap Is
- DepEd School Building Program 2026 in Numbers
- Do 2026 Classrooms Go Where the Shortage Is?
- Classroom Allocation by LGU Income Class, 2026
- Class Shifts and Crowded Classrooms in DepEd Schools
- Last Mile Schools: Classroom Need and 2026 Allocation
- Regional reports: NCR, CAR, Region I, Region II, Region III, Region IV-A, MIMAROPA, Region V, Region VI, NIR, Region VII, Region VIII, Region IX, Region X, Region XI, Region XII, Caraga, BARMM
- Rankings and deep dives: Congressional districts, Top 20 cities and municipalities, Rizal, Quezon City, City of Manila, Tawi-Tawi, Cavite, Cost of a classroom
- Explainers: PSIP III, Senior high shortage, Junior high shortage, Excess classrooms, Learning Continuity Spaces, How learners reach school
- For teachers and school heads: Action research and thesis topics
- Related: DepEd Classroom and School Building Data, SY 2023-2024, EDCOM II Final Report: Guide for Aspiring School Heads, National Education Plan 2026-2035: Guide for School Heads, DepEd School Improvement Plan (SIP): Steps, AIP and SRC, How to Read DepEd Data: A Guide for Aspiring School Heads
Analysis and charts by Mark Anthony Llego for NASH Reviewer. Data: EDCOM II classroom construction dashboard and Department of Education data. NASH Reviewer is not affiliated with EDCOM II or DepEd. Charts may be reused only with written permission from support@nash.com.ph.