The EDCOM classroom data come from the classroom construction dashboard of the Second Congressional Commission on Education (EDCOM II), a Tableau workbook that sets DepEd’s 2023 classroom shortage beside the classrooms planned under the School Building Program (SBP) 2026. NASH Reviewer extracted the five tables inside it, 209,142 rows in all, cleaned them, and recorded every changed value in a cleaning log of 31,415 entries. The cleaned data passed all 19 validation checks and reproduce every dashboard figure exactly, from the shortage of 165,443 classrooms at 25,823 schools to the allocation coverage of 19.6%.
The problems moved figures between places, not the totals. The dashboard places schools through its 2022 coordinate table, so 360 schools with new IDs lost data in its join, and 938 SBP classrooms at schools missing from that table landed in no region. The 2022 table had no Negros Island Region (NIR), Sulu was still under BARMM, and garbled characters broke names. The dashboard’s “Remaining Unfunded” of 133,024 classrooms also nets one school’s surplus against another’s need; counted school by school, the unmet shortage is 148,276.
This post is the data release for NASH Reviewer’s classroom series: what the dashboard holds, how it was cleaned and checked, and the files in Parquet, Stata, SPSS, CSV and Excel, which are free to download and may be reused only with our written permission. Its last part is for teachers and school heads using the data in action research or a thesis. NASH Reviewer is not affiliated with EDCOM II or DepEd.
Key findings
- The workbook holds 5 tables with 209,142 rows behind two dashboards, 15 worksheets and 25 calculated fields, and all were extracted unfiltered and matched the workbook’s own row counts.
- The cleaned data passed all 19 checks and reproduce every dashboard figure, including 32,419 SBP classrooms, 16,114 of them funded under the General Appropriations Act (GAA) 2026.
- Of the 31,415 log entries, 13,139 are address placeholders emptied; the changes that move figures are 4,589 region labels standardized, 1,353 Sulu records moved to Region IX and 882 rows mapped to a school’s current ID.
- 48,003 schools (99.7%) take their PSGC barangay from validated school-to-barangay links, 38 of them corrected on 28 October 2026, and the other 128 are matched to a municipality by name.
- Counted school by school, 148,276 classrooms of shortage remain unmet, not the dashboard’s 133,024, because 14,741 SBP classrooms go beyond the receiving school’s own 2023 shortage.
- 103 PSIP III lines, carrying 1,554 classrooms, are exact copies of an earlier line; they are kept and flagged so that a sensitivity check can drop them.
What the EDCOM II classroom construction dashboard holds
The dashboard is a Tableau workbook from EDCOM II with two dashboards. School Level Classroom Construction maps each school’s allocation beside its classroom need; LGU Breakdown sums the same figures by city or municipality and by implementation modality. They draw on 15 worksheets that can be filtered by place, LGU income class, funding source and implementing agency. The workbook defines 25 calculated fields and one parameter, Total Classrooms for Allocation, set to 32,419, the classroom total of the SBP masterlist.
Five embedded tables feed every worksheet, each from a different year. The base table holds DepEd’s school coordinates from the National School Building Inventory (NSBI) for SY 2022-23. The other four join to it on the school ID: school facilities for 2023, all sectors; enrollment and class shifts for SY 2024-25 from the Basic Education Information System (BEIS); DepEd’s 2023 classroom shortage, split into Kindergarten to Grade 10 (K–10) and senior high school (SHS); and the SBP 2026 masterlist, one line per project.
| Table | Rows | Columns |
|---|---|---|
| School coordinates 2022 | 47,689 | 18 |
| Facilities 2023 | 60,167 | 87 |
| Enrollment and class shifts, SY 2024-25 | 47,972 | 42 |
| Classroom shortage 2023 | 47,662 | 19 |
| School Building Program 2026 masterlist | 5,652 | 14 |
How the tables were extracted
The tables were read from the workbook’s Hyper extract, Tableau’s internal data store, with Hyper’s own CSV export, not copied from the screen. Nothing was filtered: the extract is complete and every worksheet filter keeps all values. Row counts and column headers match Hyper’s, and each file has a checksum; a rerun gives byte-identical files. The raw extract in the download is that export, unchanged, with the dashboard’s formulas.
The dashboard’s formulas in plain words
The dashboard’s headline figures come from a few calculated fields:
- Total Classroom Shortage adds up each school’s 2023 shortage: 165,443 classrooms. The exact sum is 165,442.67, because DepEd splits a room shared by K–10 and SHS between the two, leaving fractions at 3,097 schools. EDCOM II’s National Education Plan 2026–2035 gives the same 165,443 as the current backlog.
- Schools with Shortages counts the schools with a shortage above zero: 25,823.
- Classrooms for Allocation adds up the classrooms on every masterlist line: 32,419.
- Classrooms WITH allocation adds up only the lines with GAA funding: 16,114. The other 16,305 are in the third Public-Private Partnership for School Infrastructure Project (PSIP III), still for bidding, with construction expected from March 2027 to July 2028.
- Allocation Coverage divides Classrooms for Allocation by the shortage: 19.6%, PSIP III included.
- Remaining Unfunded subtracts Classrooms for Allocation from the shortage: 133,024.
- Student–Classroom Ratio divides a level’s SY 2024-25 learners by its 2023 instructional classrooms; the overall ratio counts learners only at levels that have classrooms.
The cleaned data reproduce every one of these figures exactly, and the dashboard_kpis table sets each, computed the dashboard’s way on the raw extract, beside the cleaned figure.
What was wrong and how it was fixed, rule by rule
The cleaning never estimates data. Each rule does one narrow thing: it repairs garbled text, empties a placeholder or an impossible value, maps an old school ID to its new one, makes a label consistent, or adds a column or a flag. Every changed value is a row in the cleaning log, with its table, record, rule, field, old value and new value.
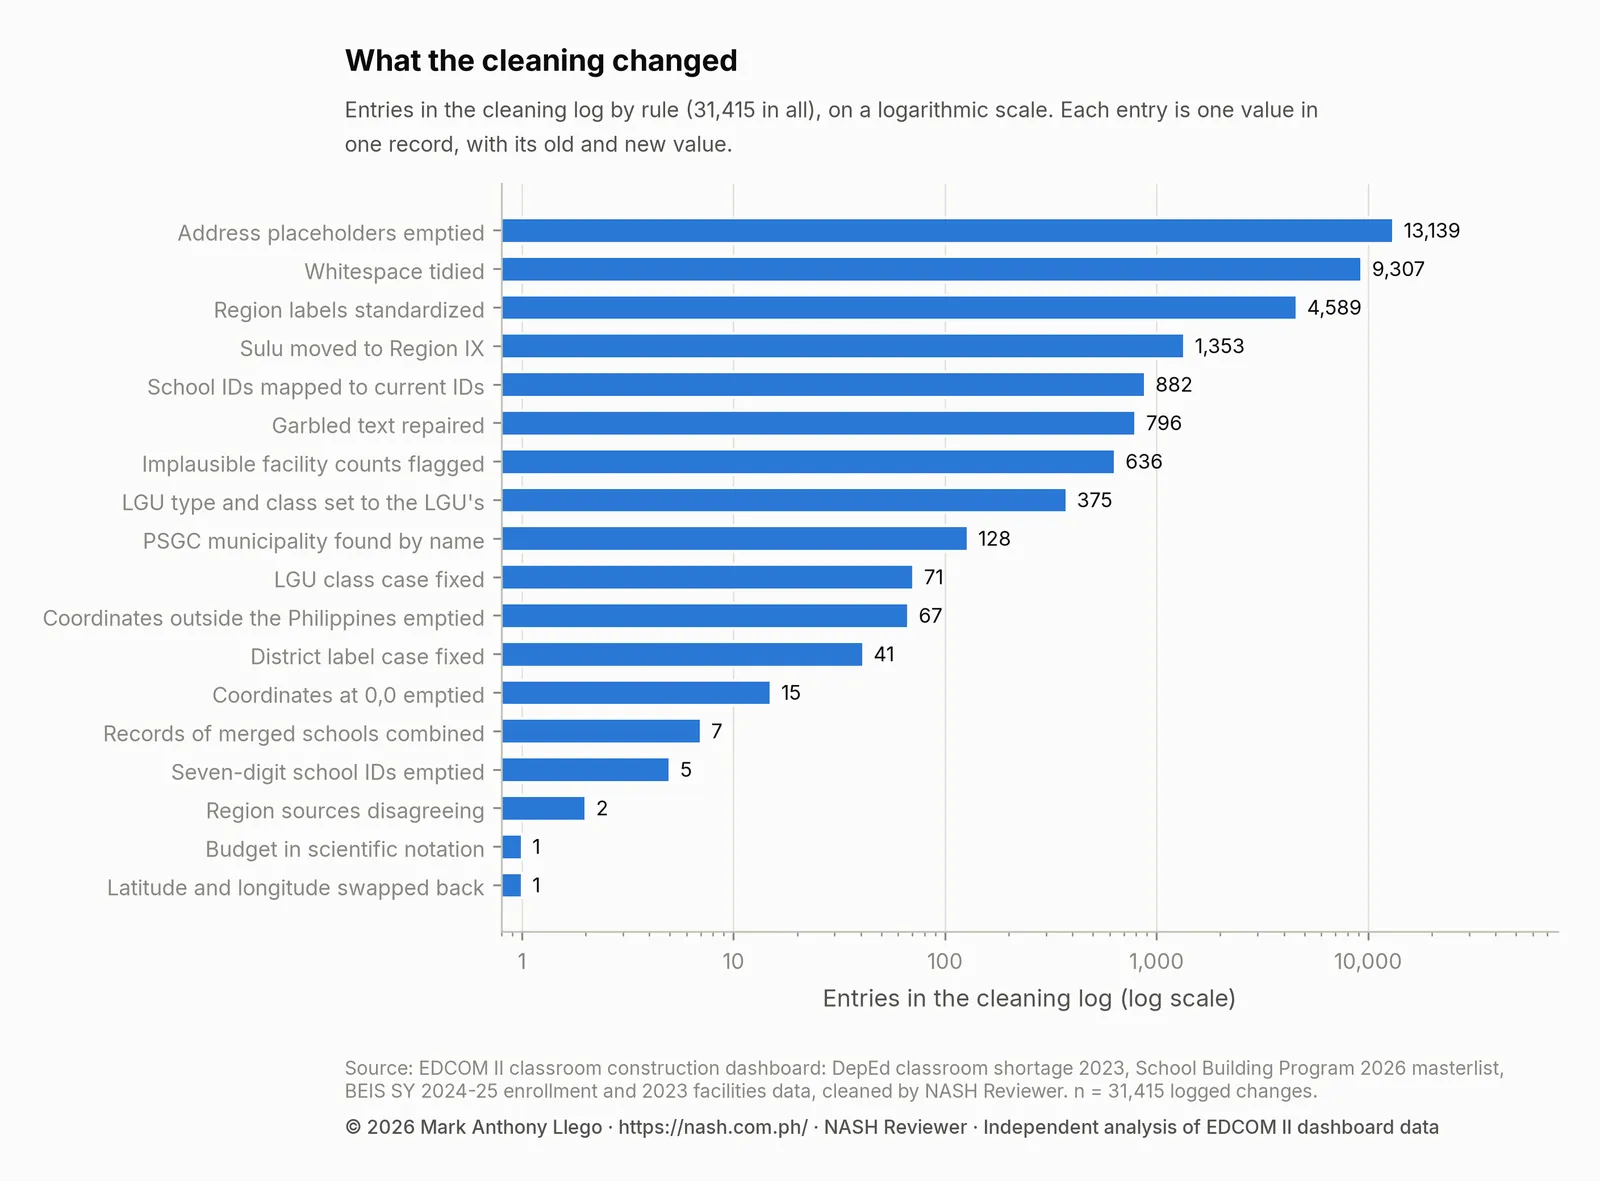
Tidying (placeholders, stray spaces and region spellings) makes up most of the log. The rules that move figures between places, led by the Sulu records and the school IDs, are smaller. PSGC codes are new columns, so only the 128 municipalities found by name are logged.
School IDs mapped through the source’s own crosswalk
360 schools received a new ID after 2023, most of them on becoming integrated schools. The 2022 and 2023 tables carry the old ID and the SY 2024-25 enrollment the new one, so the dashboard’s ID join lost the enrollment of all but one of them, and SBP lines under a new ID found no region. The 2023 shortage table itself names each school’s new ID. That crosswalk mapped 882 rows to the current ID, and the old ID stays in school_id_2023. Pequit ES and Pequit NHS, merged into Pequit IS, were combined (7 entries), and 5 seven-digit mother-school IDs were emptied, since school IDs have six digits.
Region labels, NIR and Sulu in Region IX
The 2022 table used Region IV-B for MIMAROPA and still placed Negros Occidental, Negros Oriental and Siquijor in Region VI or Region VII, as before NIR was created in 2024. The cleaning relabeled 4,589 rows to match the other sources.
Sulu is in Region IX. The 2024 Supreme Court ruling took it out of BARMM, Executive Order No. 91, s. 2025 integrated it into Region IX, and its schools division formally moved from the Bangsamoro education ministry (MBHTE-BARMM) to DepEd Region IX on 20 October 2026 (DepEd; Daily Tribune). Every source predates the move, so 1,353 rows covering 460 schools were moved, with the old label kept in region_source. On the dashboard, Sulu’s 2,173 classrooms of shortage sit under BARMM and almost all of NIR’s 4,579 under Regions VI and VII. For 2 schools whose sources disagree, the region that matches the PSGC location is used.
Version 1.1: LGU types and district labels
Version 1.1 of the data, released on 28 October 2026, corrects three labels; no other value changed. DepEd’s 2023 shortage table gives each school’s LGU type and income class row by row, and some rows in a city say “Municipality”. In the City of Manila, every row does, so version 1 typed the whole city as a municipality. Each school now takes its city’s or municipality’s type and class, the most common among its schools, and the City of Manila is a city, as the PSGC and the SBP masterlist type it: 375 values in all. Eleven congressional district labels differed only in capitalization (“Lanao Del Sur, 1st District” beside “Lanao del Sur, 1st District”); 41 rows now take each label’s most common spelling. Version 1 stays online, and the release README lists the changes.
Garbled text, spaces and placeholders
Garbled text, often called mojibake, appears when text saved in one character encoding is read as another. The cleaning repaired 796 values, mostly barangay and school names: SABAÑGAN became SABAÑGAN and Osme¤a became Osmeña. It tidied 9,307 values with repeated spaces or line breaks, emptied 13,139 street-address placeholders such as - and n/a, and fixed the case of 71 LGU income classes.
Coordinates emptied, and the one swapped pair
Coordinates are never estimated. The cleaning emptied 82 impossible ones: 15 at 0,0 and 67 outside the Philippines, 21 of them on one default point in the South China Sea. Only one pair was moved: Pag-asa ES in Bataan had its latitude and longitude swapped. In coord_status, 46,456 schools are valid, 1,147 are missing and 445 are absent from the 2022 table. Flags mark 1,416 schools more than 10 km from the center of their barangay and 199 that share a point with another school.
Budgets as text and the duplicate PSIP III lines
The masterlist stores budgets as text, and the cleaning made them numeric. The 1,274 PSIP III lines read “N/A (For Bidding)”, so their budget is empty, though their classrooms count in the 32,419. One budget stored in scientific notation was converted and flagged, since its last digits are lost in the source.
103 lines, all PSIP III, are exact copies of an earlier line, carrying 1,554 classrooms. The masterlist has no project ID, so a second identical building at the same school cannot be told apart from a double entry. The copies are kept, as the dashboard counts them, and flagged in duplicate_of_line.
Elementary non-instructional rooms read as zero
The facilities survey never records a 0 for elementary rooms, although the junior and senior high rows do. So a blank count of elementary non-instructional rooms beside a known instructional count is read as 0, at 12,393 schools; a blank instructional count stays missing. Another 636 implausible counts of classes in makeshift or temporary rooms are flagged, not changed.
PSGC codes and barangay links
Each school carries Philippine Standard Geographic Code (PSGC) codes for its barangay, municipality, province and region, the keys for joining census, poverty or LGU income data. 48,003 schools (99.7%) take their barangay from the validated school-to-barangay links built for the EDCOM literacy data, described in How the EDCOM Dashboard Data Was Cleaned. The other 128 are matched to a municipality by name, most of them through the names that linked schools in the same source carry, when at least 90% of those schools agree. Manila’s 14 districts are rolled up to the city, giving one row for each of 1,642 LGUs.
On 28 October 2026, 38 links in that shared list were corrected and both data packages rebuilt. 20 had been matched by name to a barangay in another town, although the school’s validated code, recent DepEd records and coordinates agreed on a different one; 18 moved to the barangay of their own validated code in the same town. 8 remain unsettled, 5 of them among Bacoor’s closely spaced, renumbered barangays. Separately, 26 schools have a validated barangay in a different municipality from the one their DepEd names suggest; the link is kept and flagged in psgc_lgu_conflict.
Validation and the dashboard’s Remaining Unfunded
The build writes nothing unless all 19 checks pass, and all of them passed. They confirm that school IDs are unique and every source’s IDs are found; that the shortage, the enrollment and the 32,419 SBP classrooms equal the raw totals, with every SBP line kept; that K–10 and SHS shortages add up and no number is negative; that every school’s DepEd and PSA regions agree with its PSGC codes, with Sulu in Region IX; and that coordinates are valid or empty, no garbled text is left, and the LGU and regional tables add up.
The dashboard’s Remaining Unfunded subtracts all SBP classrooms from the national shortage. That lets a surplus at one school cancel need at another, and it counts the 16,305 PSIP III classrooms still for bidding as allocated. School by school, each school’s shortage minus its SBP classrooms, never below zero, adds up to 148,276 classrooms, not 133,024. The difference is the 14,741 SBP classrooms that go beyond the receiving school’s own 2023 shortage; Do 2026 Classrooms Go Where the Shortage Is? looks at where they went.
Placement changes too. The dashboard places shortages and SBP lines in a region only through the 2022 coordinates, so 938 SBP classrooms and 6 classrooms of shortage fall in no region. The cleaned school table takes each school’s region from whichever source holds the school, so every classroom now has a region, and Region I’s coverage ratio rises to 1.01. The region_reconciliation table shows each region both ways.
The files, the formats and how to load them
Start with three tables. schools (48,131 rows, 104 columns) has one row per public school with the five sources joined: geography and PSGC codes, enrollment and shifts, classrooms and buildings, shortage, SBP allocation, ratios and quality flags. sbp_projects (5,652 rows) has every SBP line, and lgu_summary (1,642 rows) the dashboard’s LGU breakdown plus the school-by-school gap. The five cleaned source tables, the ID crosswalk (360 rows), dashboard_kpis and region_reconciliation complete the set.
Every table comes as Stata .dta and SPSS .sav with variable labels and as gzipped CSV, the three main tables also as Parquet, and all of them are sheets in one Excel workbook (37.3 MB). Parquet, Stata and SPSS keep the column types and the leading zeros of PSGC codes; from CSV, read those codes as text. The data dictionary (363 rows) explains every column, and the cleaning log lists all 31,415 changes.
# R: Parquet with arrow, or the Stata file (from classroom_tables_stata.zip) with havenlibrary(arrow)download.file("https://data.nash.com.ph/edcom-classroom-data/v1.1/schools.parquet", "schools.parquet", mode = "wb")schools <- read_parquet("schools.parquet")library(haven)schools <- read_dta("classroom_tables_stata/schools.dta")# Pythonimport pandas as pdschools = pd.read_parquet("https://data.nash.com.ph/edcom-classroom-data/v1.1/schools.parquet")* Stata, after unzipping classroom_tables_stata.zipuse "classroom_tables_stata/schools.dta", clear* SPSS, after unzipping classroom_tables_spss.zip.GET FILE='classroom_tables_spss/schools.sav'.Using the data for the SIP, action research or a thesis
A school head can find the school’s row in schools by its school ID; the in_* columns show which sources hold it, and the flags show what to read with care.
- School improvement plan and AIP. Shortage, learners per classroom, shifts and building condition give a dated baseline for the School Improvement Plan.
- Talking with the LGU and the division.
lgu_summarysets the school’s town beside others of its income class, andsbp_projectsshows which lines reach it. - Brigada Eskwela and repairs. Buildings for condemnation or demolition and makeshift rooms show where repairs matter most.
- Correcting the record. A wrong barangay or count can be traced in the cleaning log and reported to the division.
Research questions the data can answer
- Does the 2026 allocation follow the 2023 shortage? In
schools, relatesbp_classroomstoshortage_total, or model whethersbp_classroomsis above zero among schools wherehas_shortageis true. - How much need is left, and where? Compare
shortage_unmetandsbp_beyond_shortageacross divisions. - Do schools with class shifts get classrooms? Compare
learners_per_classroom_allandsbp_classroomsbymulti_shift. - Are Last Mile Schools reached? Compare
shortage_total,sbp_classroomsandshortage_unmetbylast_mile_school, within divisions. - Does an LGU’s income class go with its allocation? In
lgu_summary, relatesbp_classroomsandsbp_classrooms_funded_gaatoshortage_totalacrosslgu_income_class. - Which implementing agencies build where the need is? In
sbp_projects, compareclassroomsandbudget_per_classroom_phpbymodality_group, againstschool_shortage_total. - Do condemned buildings and makeshift rooms go with the shortage? Relate
buildings_condemn_demolishandes_makeshift_roomstoshortage_pct_of_classrooms.
Class Shifts and Crowded Classrooms in DepEd Schools, Last Mile Schools: Classroom Need and 2026 Allocation and Classroom Allocation by LGU Income Class, 2026 answer some of these nationally; a division study can go further.
Method notes
- Unit of analysis. A row is a school in
schools, a masterlist line insbp_projectsand a city or municipality inlgu_summary; keep to one. - Clustered standard errors. Schools sit within divisions and LGUs, where allocations are decided, so cluster standard errors by division or LGU (Cameron & Miller, 2015) or fit a multilevel model.
- Missing is not zero, except in the SBP columns, where a school not in the masterlist has 0 SBP classrooms.
- Years differ: coordinates 2022, shortage and facilities 2023, enrollment and shifts SY 2024-25, allocations 2026.
- Sensitivity checks. Rerun without the
duplicate_of_linerows, thelcr_outlier_*schools,flag_classes_exceed_roomsorpsgc_lgu_conflict, and report whether the answer changes. Shortages are right-skewed, so prefer logs or count models to raw means.
How to Read DepEd Data: A Guide for Aspiring School Heads covers these habits in more detail.
How these numbers were made
Extraction and cleaning were done in Python with pandas, ftfy for the garbled text and pyreadstat for the Stata and SPSS files. Each rule writes its changes to the log as it runs, so the log and the cleaned tables come from one run.
The school-by-school unmet shortage adds, over all schools, the larger of zero and the school’s shortage minus its SBP classrooms. The classrooms beyond shortage add the larger of zero and SBP classrooms minus shortage. The lcr_outlier_* flags mark learners-per-classroom values whose modified z-score, on the log scale, exceeds 3.5 in absolute value (Iglewicz & Hoaglin, 1993).
Limits
The sources mix years, from 2022 coordinates to 2026 allocations, and the shortage is DepEd’s own 2023 estimate, which this release does not re-estimate. Allocations are plans, not buildings: PSIP III is still for bidding, and the 103 duplicate lines may be double entries. A name match can be wrong where nothing else points elsewhere; 8 links remain unsettled, and 26 schools have a municipality conflict. Missing values stay missing, except the elementary non-instructional rooms read as zero. The data are a snapshot of the workbook, and any pattern found in them is an association, not a cause.
Frequently asked questions
What is the EDCOM II classroom construction dashboard?
It is an EDCOM II Tableau workbook with two dashboards, School Level Classroom Construction and LGU Breakdown, that sets DepEd’s 2023 classroom shortage beside the School Building Program 2026 masterlist, with SY 2024-25 enrollment and shifts, 2023 facilities and 2022 school coordinates.
Did cleaning change the 165,443 classroom shortage?
No. The cleaned data reproduce the shortage of 165,443 classrooms at 25,823 schools, the 32,419 SBP classrooms and the 19.6% coverage exactly. The cleaning changed where figures are placed, such as Sulu in Region IX.
Why is the unmet shortage larger than the dashboard’s Remaining Unfunded?
The dashboard subtracts all SBP classrooms from the national shortage, giving 133,024, so a surplus at one school cancels need at another. Counted school by school, 148,276 classrooms of shortage remain, because 14,741 SBP classrooms go beyond their school’s own 2023 shortage.
Download the data and cite this post
The cleaned EDCOM II classroom data behind this series are free to download for personal study. The cleaned tables and documentation are © 2026 Mark Anthony Llego, NASH Reviewer, all rights reserved: to reuse, republish or build on them, email support@nash.com.ph for written permission first. The underlying data were published by EDCOM II and DepEd and remain subject to their terms. How the EDCOM Classroom Data Was Cleaned explains every table and cleaning rule. The files are at data.nash.com.ph: start with the README, then the school table (Parquet, or CSV), the School Building Program lines (CSV), the city and municipality table (CSV), and every table for Stata and SPSS. Every figure quoted in this series, with the data behind each chart, is in analysis_tables.zip.
Every file, with its rows, columns and checksum, is listed on the EDCOM II classroom data page. To cite the data: Llego, M. A. (2026). EDCOM II classroom construction dashboard data, cleaned, version 1.1. NASH Reviewer. https://nash.com.ph/edcom-classroom-data
To cite this post: Llego, M. A. (2026, October 28). How the EDCOM classroom data was cleaned. NASH Reviewer Blog. https://nash.com.ph/blog/edcom-classroom-data-cleaned
References
- Cameron, A. C., & Miller, D. L. (2015). A practitioner’s guide to cluster-robust inference. Journal of Human Resources, 50(2), 317–372.
- Iglewicz, B., & Hoaglin, D. C. (1993). How to detect and handle outliers. ASQC Quality Press.
- Llego, M. A. (2026). EDCOM II classroom construction dashboard data, cleaned, version 1.1 [Data set]. NASH Reviewer. https://nash.com.ph/edcom-classroom-data
- Second Congressional Commission on Education (EDCOM II). (2026). National Education Plan 2026–2035 (Year Three report).
More in this series
- How the EDCOM Classroom Data Was Cleaned
- Philippine Classroom Shortage 2023: Where the Gap Is
- DepEd School Building Program 2026 in Numbers
- Do 2026 Classrooms Go Where the Shortage Is?
- Classroom Allocation by LGU Income Class, 2026
- Class Shifts and Crowded Classrooms in DepEd Schools
- Last Mile Schools: Classroom Need and 2026 Allocation
- Regional reports: NCR, CAR, Region I, Region II, Region III, Region IV-A, MIMAROPA, Region V, Region VI, NIR, Region VII, Region VIII, Region IX, Region X, Region XI, Region XII, Caraga, BARMM
- Rankings and deep dives: Congressional districts, Top 20 cities and municipalities, Rizal, Quezon City, City of Manila, Tawi-Tawi, Cavite, Cost of a classroom
- Explainers: PSIP III, Senior high shortage, Junior high shortage, Excess classrooms, Learning Continuity Spaces, How learners reach school
- For teachers and school heads: Action research and thesis topics
- Related: How the EDCOM Dashboard Data Was Cleaned (the CRLA data), DepEd Classroom and School Building Data, SY 2023-2024, How to Read DepEd Data: A Guide for Aspiring School Heads, DepEd School Improvement Plan (SIP): Steps, AIP and SRC, PPSSH Domain 2: Managing School Operations With DepEd Data, EDCOM II Final Report: Guide for Aspiring School Heads
Analysis and charts by Mark Anthony Llego for NASH Reviewer. Data: EDCOM II classroom construction dashboard and Department of Education data. NASH Reviewer is not affiliated with EDCOM II or DepEd. Charts may be reused only with written permission from support@nash.com.ph.