DepEd’s 2023 classroom data count 16,396 public schools, 34.4% of the 47,659 in its shortage table, with more Kindergarten to Grade 10 (K-10) classrooms than they needed: 53,161 rooms in all. Most have little to spare. The median is 2.0 rooms, and 70.2% of these schools have three or fewer. These are DepEd’s own 2023 estimates, made school by school, of K-10 classrooms beyond what each school’s enrollment required, as published in the EDCOM II classroom construction dashboard. The data have no excess figure for senior high school.
Do these rooms sit where the shortage is? Mostly not. Regions I, II and VI count more excess K-10 rooms than K-10 rooms short, while in Region IV-A and NCR, the two regions with the largest shortages, the excess equals 11.7% and 7.0% of the shortage. Across cities and municipalities, places with more excess rooms tend slightly to have less shortage, not more. Even on paper, if every excess room could serve learners anywhere in its own city or municipality, the excess would match at most 23.7% of the 147,660-classroom K-10 shortage, and within the same barangay 6.9%. Distances are often short, though: half of the schools with a K-10 shortage and usable coordinates (50.5%) have a school with excess rooms within 2 km in a straight line.
None of this means the shortage can be met with rooms that already exist. A classroom cannot move to another school, and learners cannot always move: distance, grade levels, the receiving school’s capacity, safety and the cost of travel stand in the way. A room counted as extra may be in poor condition or used for something else, and enrollment has changed since 2023. The matching and distance figures in this post are upper bounds on what could in principle be shared, not a plan. The data are the cleaned school-level tables listed on the EDCOM II classroom data page, and the post is written for school heads, teachers, aspiring school heads and division planners who want to read their own school’s figure, map the schools around them, or cite these numbers in a school improvement plan, a thesis or an action research paper.
Key findings
- In 2023, 16,396 public schools (34.4% of those in DepEd’s shortage table) had more K-10 classrooms than DepEd estimated they needed, 53,161 rooms in all, equal in size to 36.0% of the 147,660-classroom K-10 shortage, although the two are never netted.
- Most of these schools have little to spare: the median is 2.0 extra rooms, 70.2% have three or fewer, and 682 have more than 10.
- Schools with excess rooms are more often rural than schools overall (81.0% against 76.7%) and less often Last Mile Schools (11.4% against 18.5%), and 1,614 of them are short of senior high rooms at the same time.
- Regions I, II and VI count more excess K-10 rooms than K-10 rooms short, while the excess equals 7.0% of the K-10 shortage in NCR, 11.7% in Region IV-A and 3.4% in BARMM.
- On paper, excess rooms in the same city or municipality could match at most 35,030 classrooms (23.7%) of the K-10 shortage, and in the same barangay 10,209 (6.9%); across places, Spearman’s rho between excess and shortage is -0.11.
- For the 22,287 schools with a K-10 shortage and usable coordinates, the nearest school with excess rooms is a median 2.0 km away in a straight line; 23.0% have one within 1 km and 88.0% within 5 km.
- 1,403 schools counted with excess K-10 rooms receive 6,931 School Building Program (SBP) 2026 classrooms; the masterlist does not say why, and such a school may still need rooms for senior high or to replace old ones.
How many schools have more classrooms than they need
DepEd computes its classroom figures school by school. Its 2023 table gives each school three numbers: a shortage for kindergarten to Grade 10, a shortage for senior high school (SHS), and an excess of K-10 rooms. Philippine Classroom Shortage 2023: Where the Gap Is explains the shortage; this post looks at the third number. No school has both a K-10 shortage and a K-10 excess. Like the shortage, the excess can be a fraction, because DepEd splits a room shared by K-10 and SHS classes between the two levels.
In 2023, 16,396 schools had a K-10 excess, 34.4% of the 47,659 schools in the table, and the excess adds up to 53,161 rooms. Side by side, that equals 36.0% of the K-10 shortage of 147,660 classrooms at 24,083 schools. The two are never netted, here or in DepEd’s figures: a room in one school cannot seat learners in another, so the comparison describes size, not how much of the shortage the excess could meet.
| Excess K-10 classrooms at the school | Schools |
|---|---|
| Up to 1 | 5,693 |
| Over 1 to 3 | 5,821 |
| Over 3 to 10 | 4,200 |
| Over 10 | 682 |
| All schools with excess | 16,396 |
Most schools with excess have little of it. The median is 2.0 rooms, and 70.2% have three or fewer; a school with one extra room in 2023 may have filled it since with a new section. At the other end, 682 schools have more than 10. The largest single figure is 89 rooms, at one school. A figure that far from the rest may reflect how the school’s rooms were recorded in 2023; the data hold DepEd’s result for each school, not the inputs behind it, so a figure like it is worth checking against the school’s own records before anyone quotes it.
Who these schools are
Schools with excess rooms are a broad mix. 72.6% are purely elementary schools, the most common kind of public school. 81.0% are rural, against 76.7% of all schools in the 2023 table, and 11.4% are Last Mile Schools, against 18.5% of all schools (Last Mile Schools: Classroom Need and 2026 Allocation describes them). At the median, a school with excess had 246 learners in SY 2024-25, close to the 258 of the median school with a K-10 shortage, so schools with excess are not simply the smallest schools. Their median is 21.9 learners per classroom, against 26.1 across the 46,888 public schools with a ratio in Class Shifts and Crowded Classrooms in DepEd Schools. That ratio divides SY 2024-25 learners by 2023 rooms.
Excess at one level does not mean enough rooms at every level. 1,614 schools counted with excess K-10 rooms are short of senior high rooms at the same time. DepEd counts the two levels separately, and the data do not say whether a spare K-10 room could serve senior high classes at those schools; the senior high school classroom shortage is covered in its own explainer.
Being counted with excess is not a mark against a school. The figure sets the rooms a school had in 2023 against what its enrollment required at that time. Enrollment moves as families move and nearby schools open or add grade levels, and a room counted as extra may be old, unsafe or used for something else.
Excess classrooms and the shortage by region
The chart sets each region’s excess K-10 rooms beside its K-10 shortage, with the regions sorted by shortage. Sulu is counted in Region IX, since its schools division moved to DepEd Region IX on 20 October 2026.
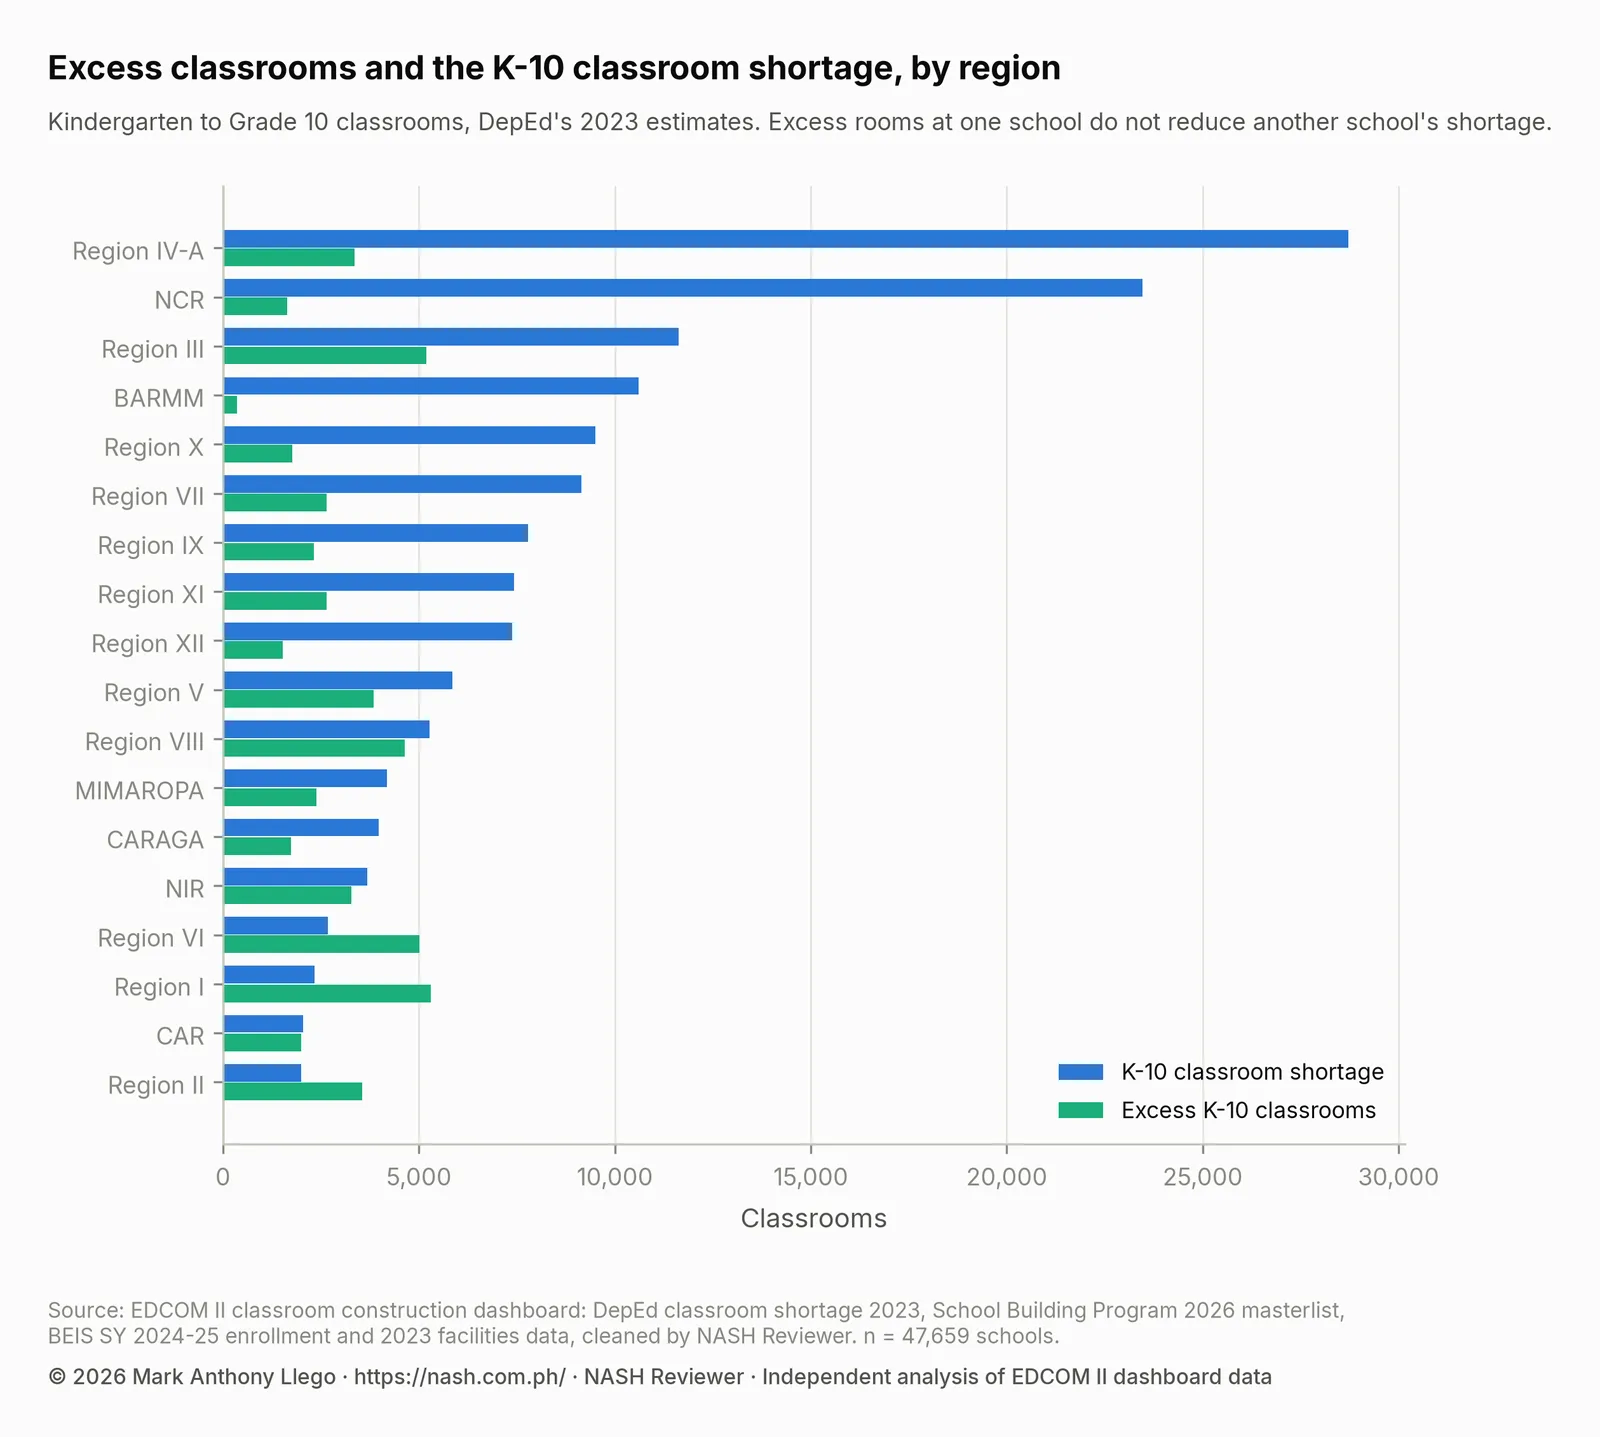
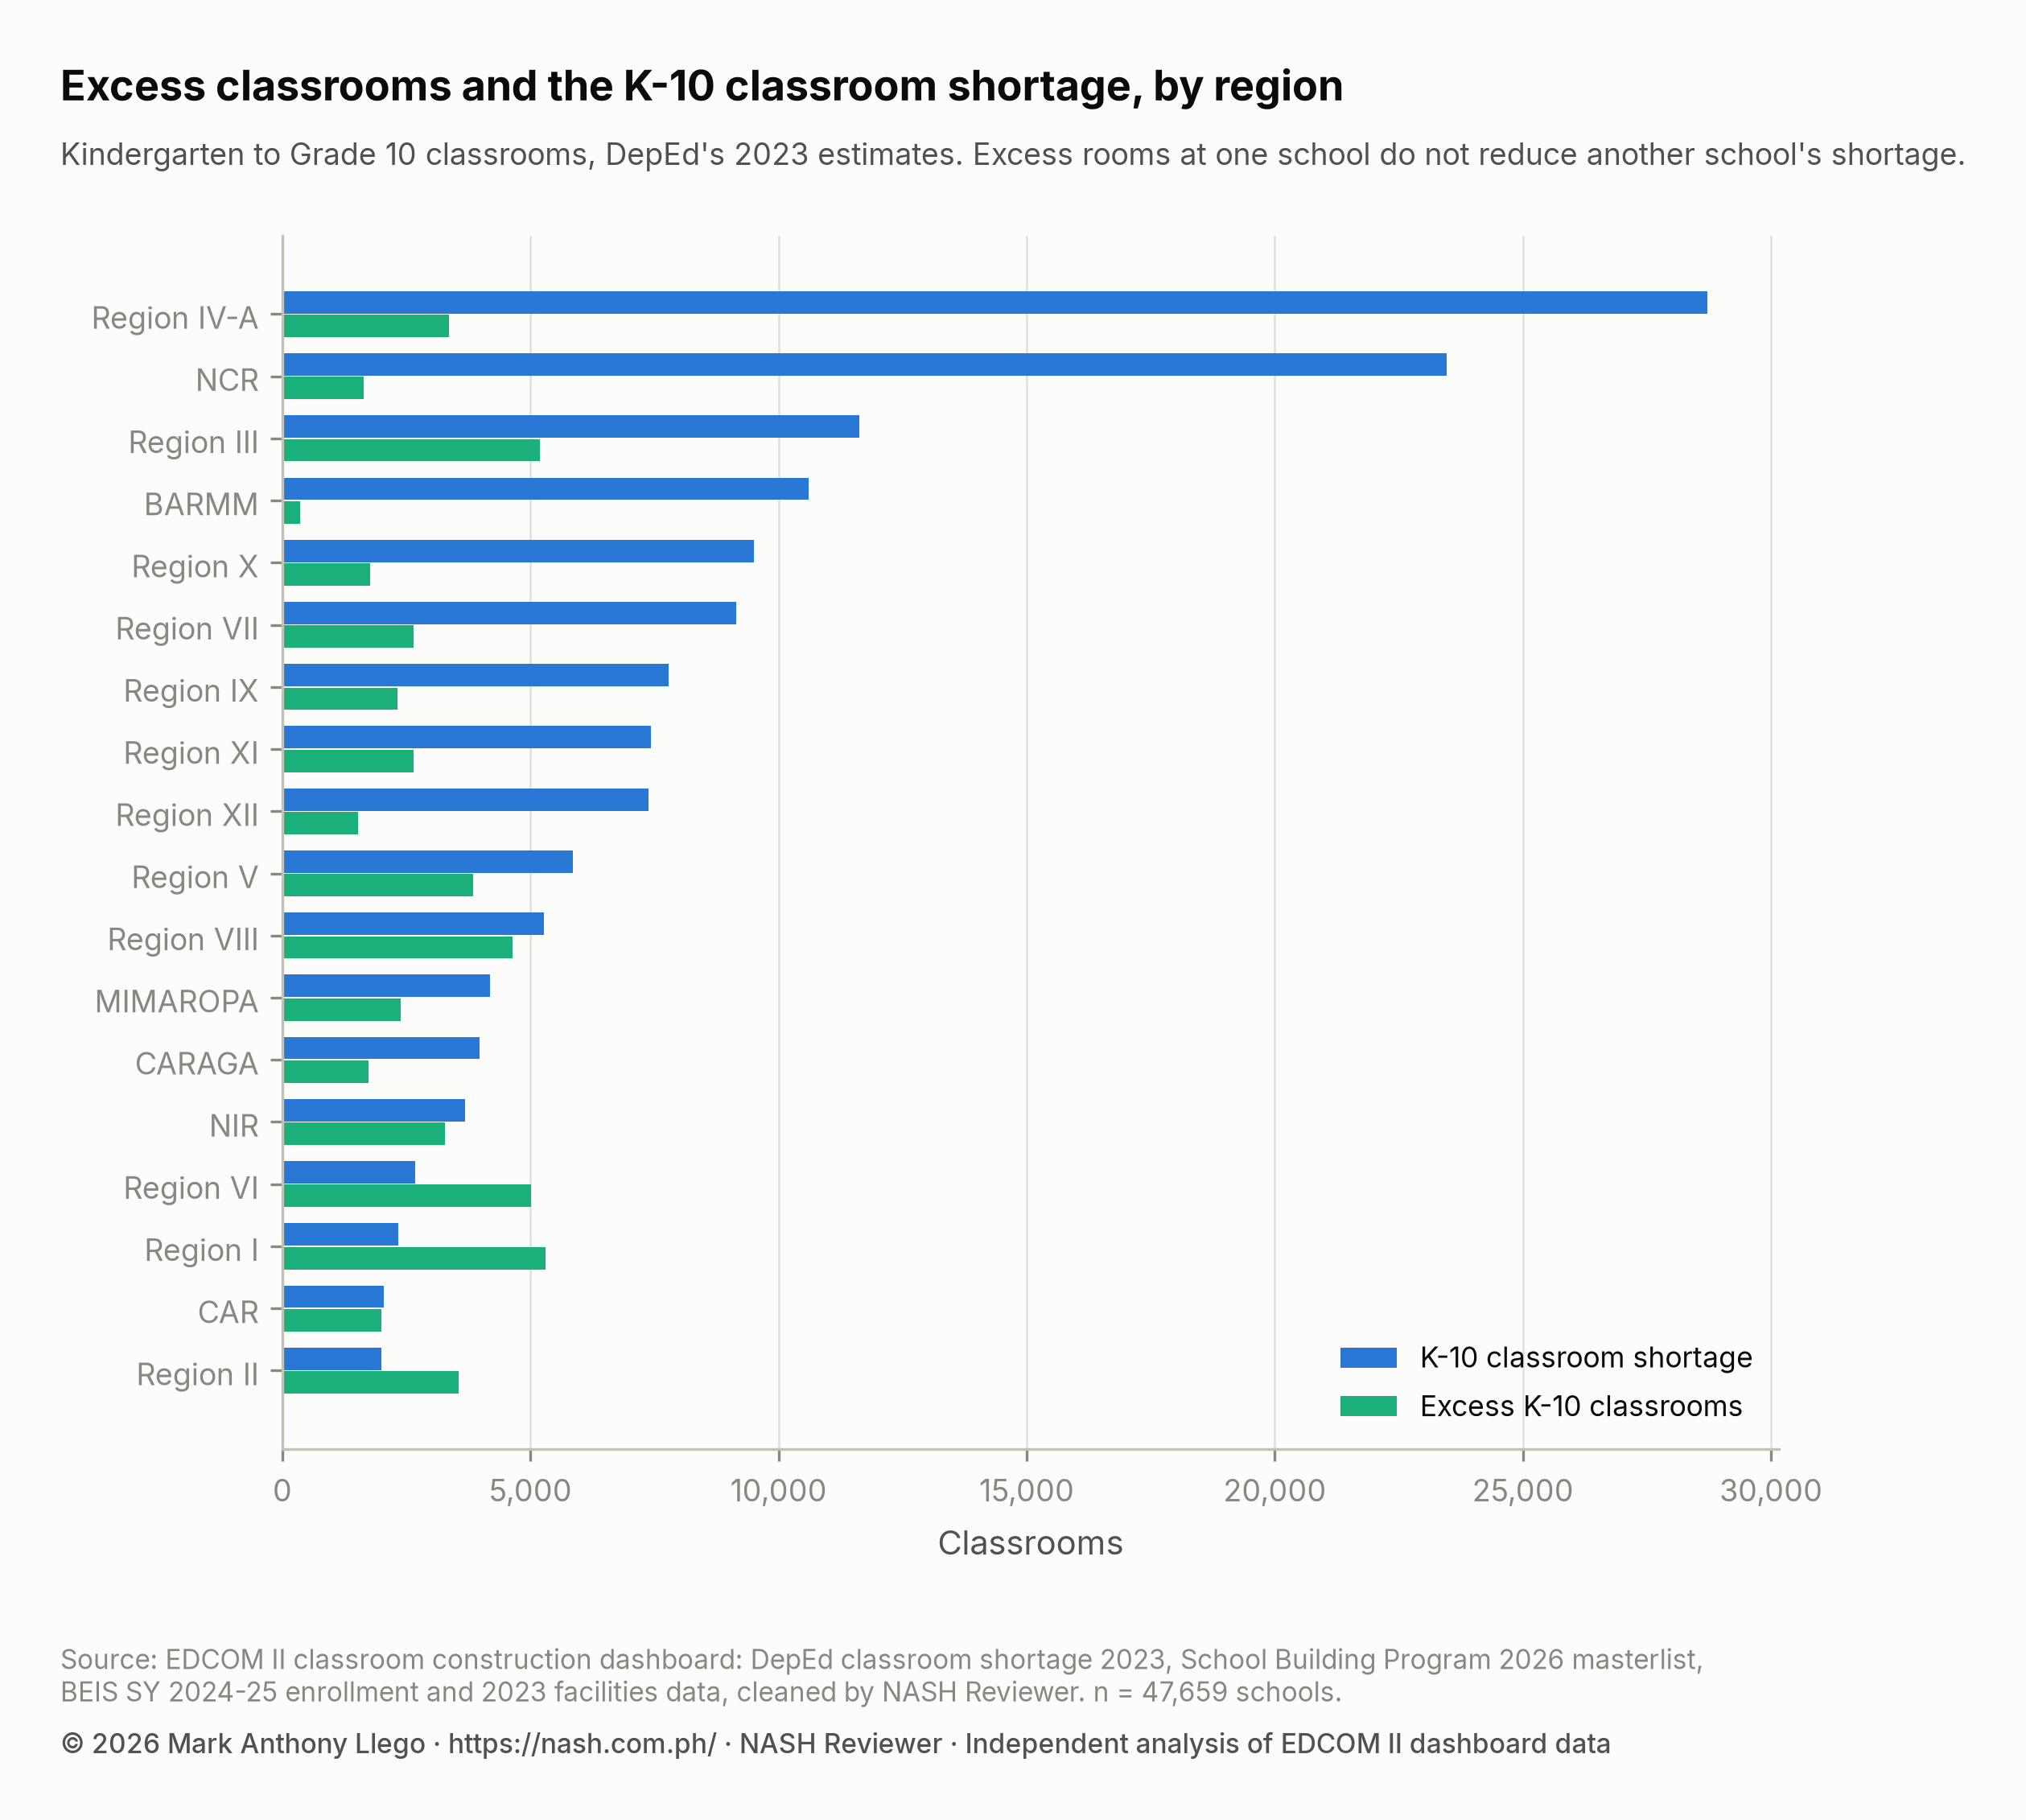
The longest blue bars and the longest green bars belong to different regions. Region IV-A and NCR have K-10 shortages of 28,723 and 23,469 classrooms but 3,359 and 1,640 excess rooms. In BARMM, the excess of 356 rooms equals 3.4% of a shortage of 10,601. At the bottom of the chart the pattern turns over: Region I counts 5,308 excess rooms against a K-10 shortage of 2,340, Region VI 5,008 against 2,672, and Region II 3,558 against 1,989. CAR is close to even, with 1,987 against 2,049.
| Region | Schools with excess classrooms | Excess K-10 classrooms | K-10 classroom shortage | Excess as a share of the shortage |
|---|---|---|---|---|
| NCR | 146 | 1,640 | 23,469 | 7.0% |
| CAR | 692 | 1,987 | 2,049 | 96.9% |
| Region I | 1,679 | 5,308 | 2,340 | 226.8% |
| Region II | 1,125 | 3,558 | 1,989 | 178.9% |
| Region III | 1,428 | 5,184 | 11,619 | 44.6% |
| Region IV-A | 960 | 3,359 | 28,723 | 11.7% |
| MIMAROPA | 812 | 2,378 | 4,189 | 56.8% |
| Region V | 1,326 | 3,839 | 5,847 | 65.7% |
| Region VI | 1,558 | 5,008 | 2,672 | 187.4% |
| NIR | 934 | 3,269 | 3,684 | 88.7% |
| Region VII | 926 | 2,643 | 9,147 | 28.9% |
| Region VIII | 1,464 | 4,639 | 5,270 | 88.0% |
| Region IX | 792 | 2,319 | 7,776 | 29.8% |
| Region X | 513 | 1,769 | 9,496 | 18.6% |
| Region XI | 753 | 2,646 | 7,429 | 35.6% |
| Region XII | 482 | 1,521 | 7,383 | 20.6% |
| CARAGA | 661 | 1,739 | 3,978 | 43.7% |
| BARMM | 145 | 356 | 10,601 | 3.4% |
The last column divides a region’s excess by its K-10 shortage. Above 100%, as in Region I (226.8%), Region VI (187.4%) and Region II (178.9%), the region counts more excess rooms than rooms short. The column compares two regional totals; it does not say how much of the shortage the excess could fill, because the excess and the shortage are at different schools, often in different towns. Region I has the most schools with excess, 1,679, and the most excess rooms, 5,308; NCR and BARMM have the fewest schools with excess, 146 and 145. The regional reports for Region I, Region II and Region VI describe their shortages in detail.
Excess and shortage in the same city, municipality or barangay
Regions are large. A closer question is whether the excess and the shortage sit in the same city or municipality, or the same barangay, where sharing rooms or moving learners would at least be thinkable.
Most places have some of each. Of the 1,642 cities and municipalities with schools in the table, 1,546 have at least one school with excess and at least one with a K-10 shortage; 27 have excess but no K-10 shortage, and 69 have a K-10 shortage but no excess, holding 6.9% of the K-10 shortage. But the amounts do not line up. In each place, the most of its shortage that its own excess could match is the smaller of the two numbers. Added up over all cities and municipalities, that comes to 35,030 classrooms, 23.7% of the K-10 shortage. Everywhere else, the shortage is larger than the excess beside it.
The barangay is a tighter test, and closer to the distances learners walk. Of the 32,676 barangays with a school in the table, 3,773 have both a school with excess and a school with a K-10 shortage. Matched barangay by barangay in the same way, the excess could cover at most 10,209 classrooms, 6.9% of the K-10 shortage.
The ten cities and municipalities where the same-place figure is largest are mostly big cities with many schools of both kinds:
| City or municipality | Excess K-10 classrooms | K-10 classroom shortage | Shortage that excess in the same place could match |
|---|---|---|---|
| Quezon City | 318 | 5,250 | 318 |
| City of Cebu | 302 | 906 | 302 |
| City of Davao | 283 | 3,598 | 283 |
| City of Manila | 256 | 2,627 | 256 |
| City of Cagayan De Oro | 242 | 767 | 242 |
| City of Bacolod | 237 | 439 | 237 |
| City of Mandaluyong | 201 | 272 | 201 |
| City of Zamboanga | 200 | 1,685 | 200 |
| City of Lipa, Batangas | 335 | 194 | 194 |
| City of Pasig | 171 | 849 | 171 |
In nine of the ten, the excess is the smaller number, so the last column equals it. Quezon City counts 318 excess K-10 rooms against a K-10 shortage of 5,250, the City of Davao 283 against 3,598 and the City of Manila 256 against 2,627 (the deep dives on Quezon City and the City of Manila read these cities school by school). The City of Lipa, Batangas, is the one place in the list where the excess, 335, is larger than the shortage, 194. In the City of Mandaluyong, 89 of the 201 excess rooms are at the one school noted above.
Is there a pattern across all places? Rank the 1,642 cities and municipalities twice, once by their excess rooms and once by their K-10 shortage, and ask whether the two rankings agree. Spearman’s rank correlation (Spearman, 1904) measures this: +1 means the rankings agree perfectly, 0 means no relation, and -1 means one ranking is the reverse of the other. Because it compares ranks, not counts, a few very large cities cannot drive it. Here it is -0.11, with a 95% interval of -0.16 to -0.06 from a bootstrap that recomputes it on 1,000 samples of places (Efron & Tibshirani, 1993). The link is weak, but it is below zero: places with more excess rooms tend slightly to have less K-10 shortage, not more.
How far is the nearest school with excess classrooms?
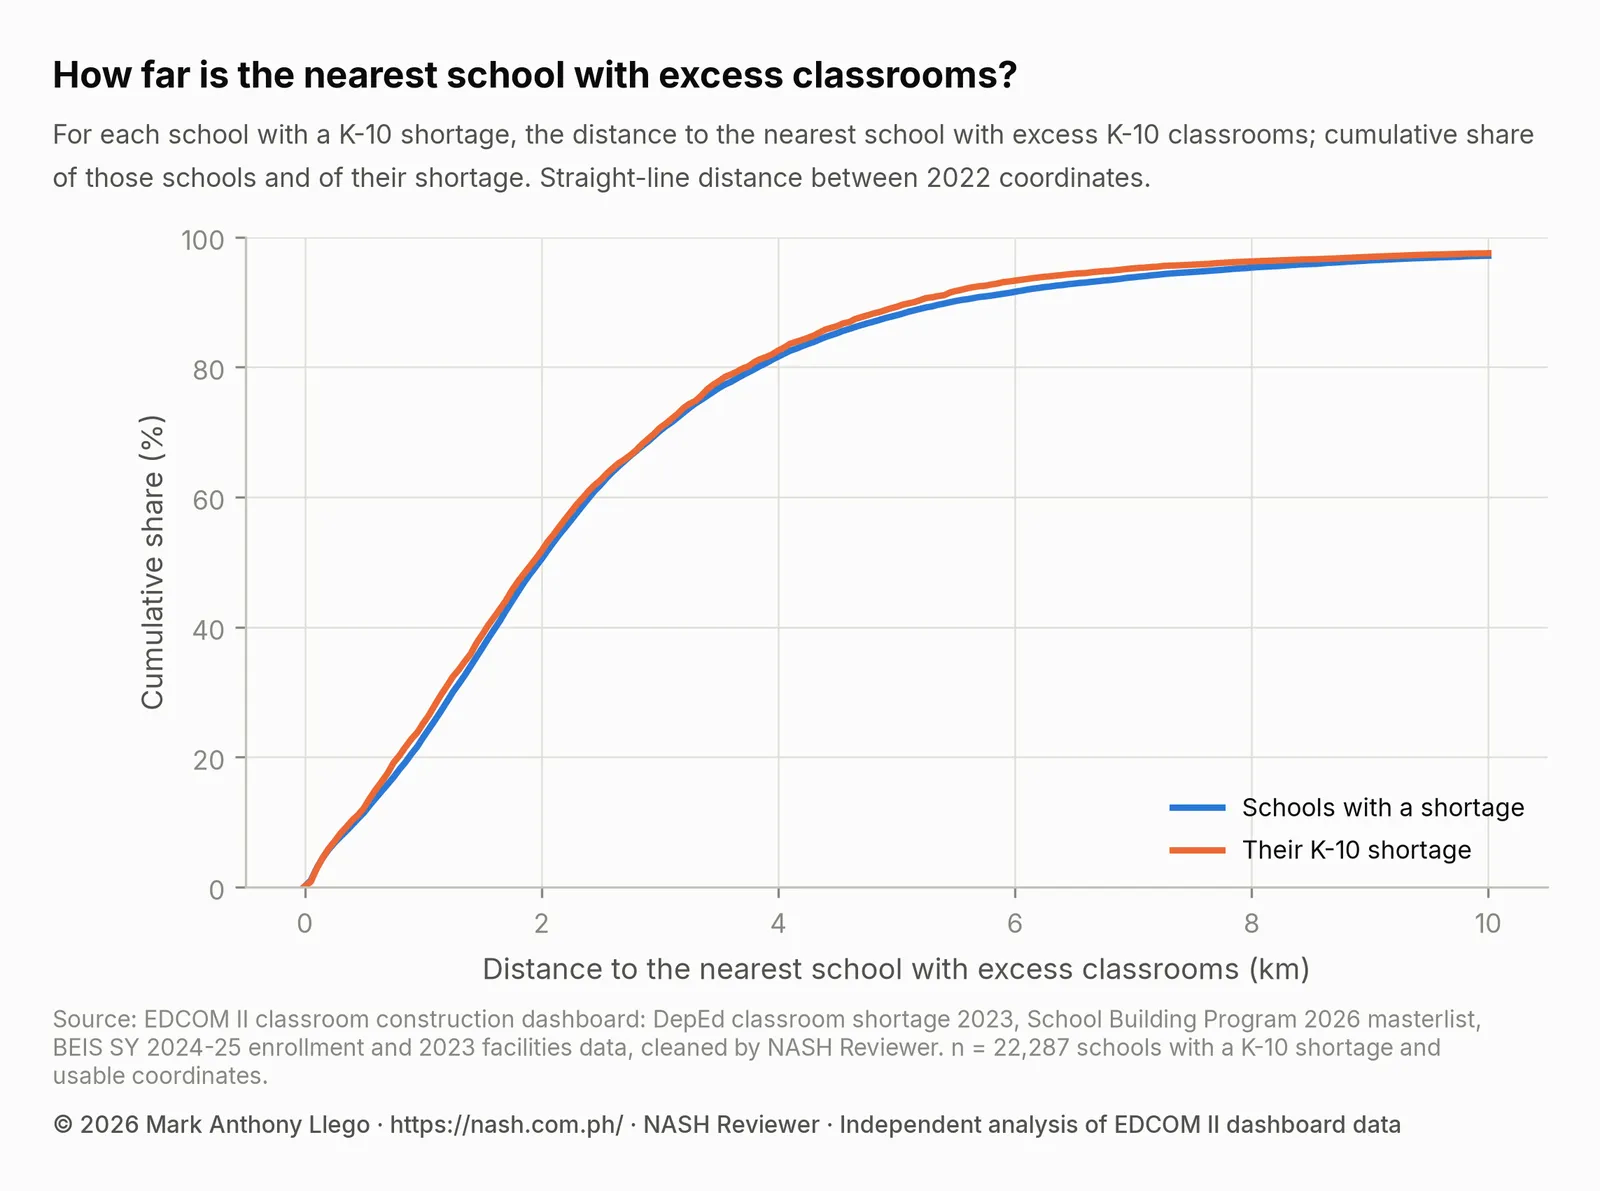
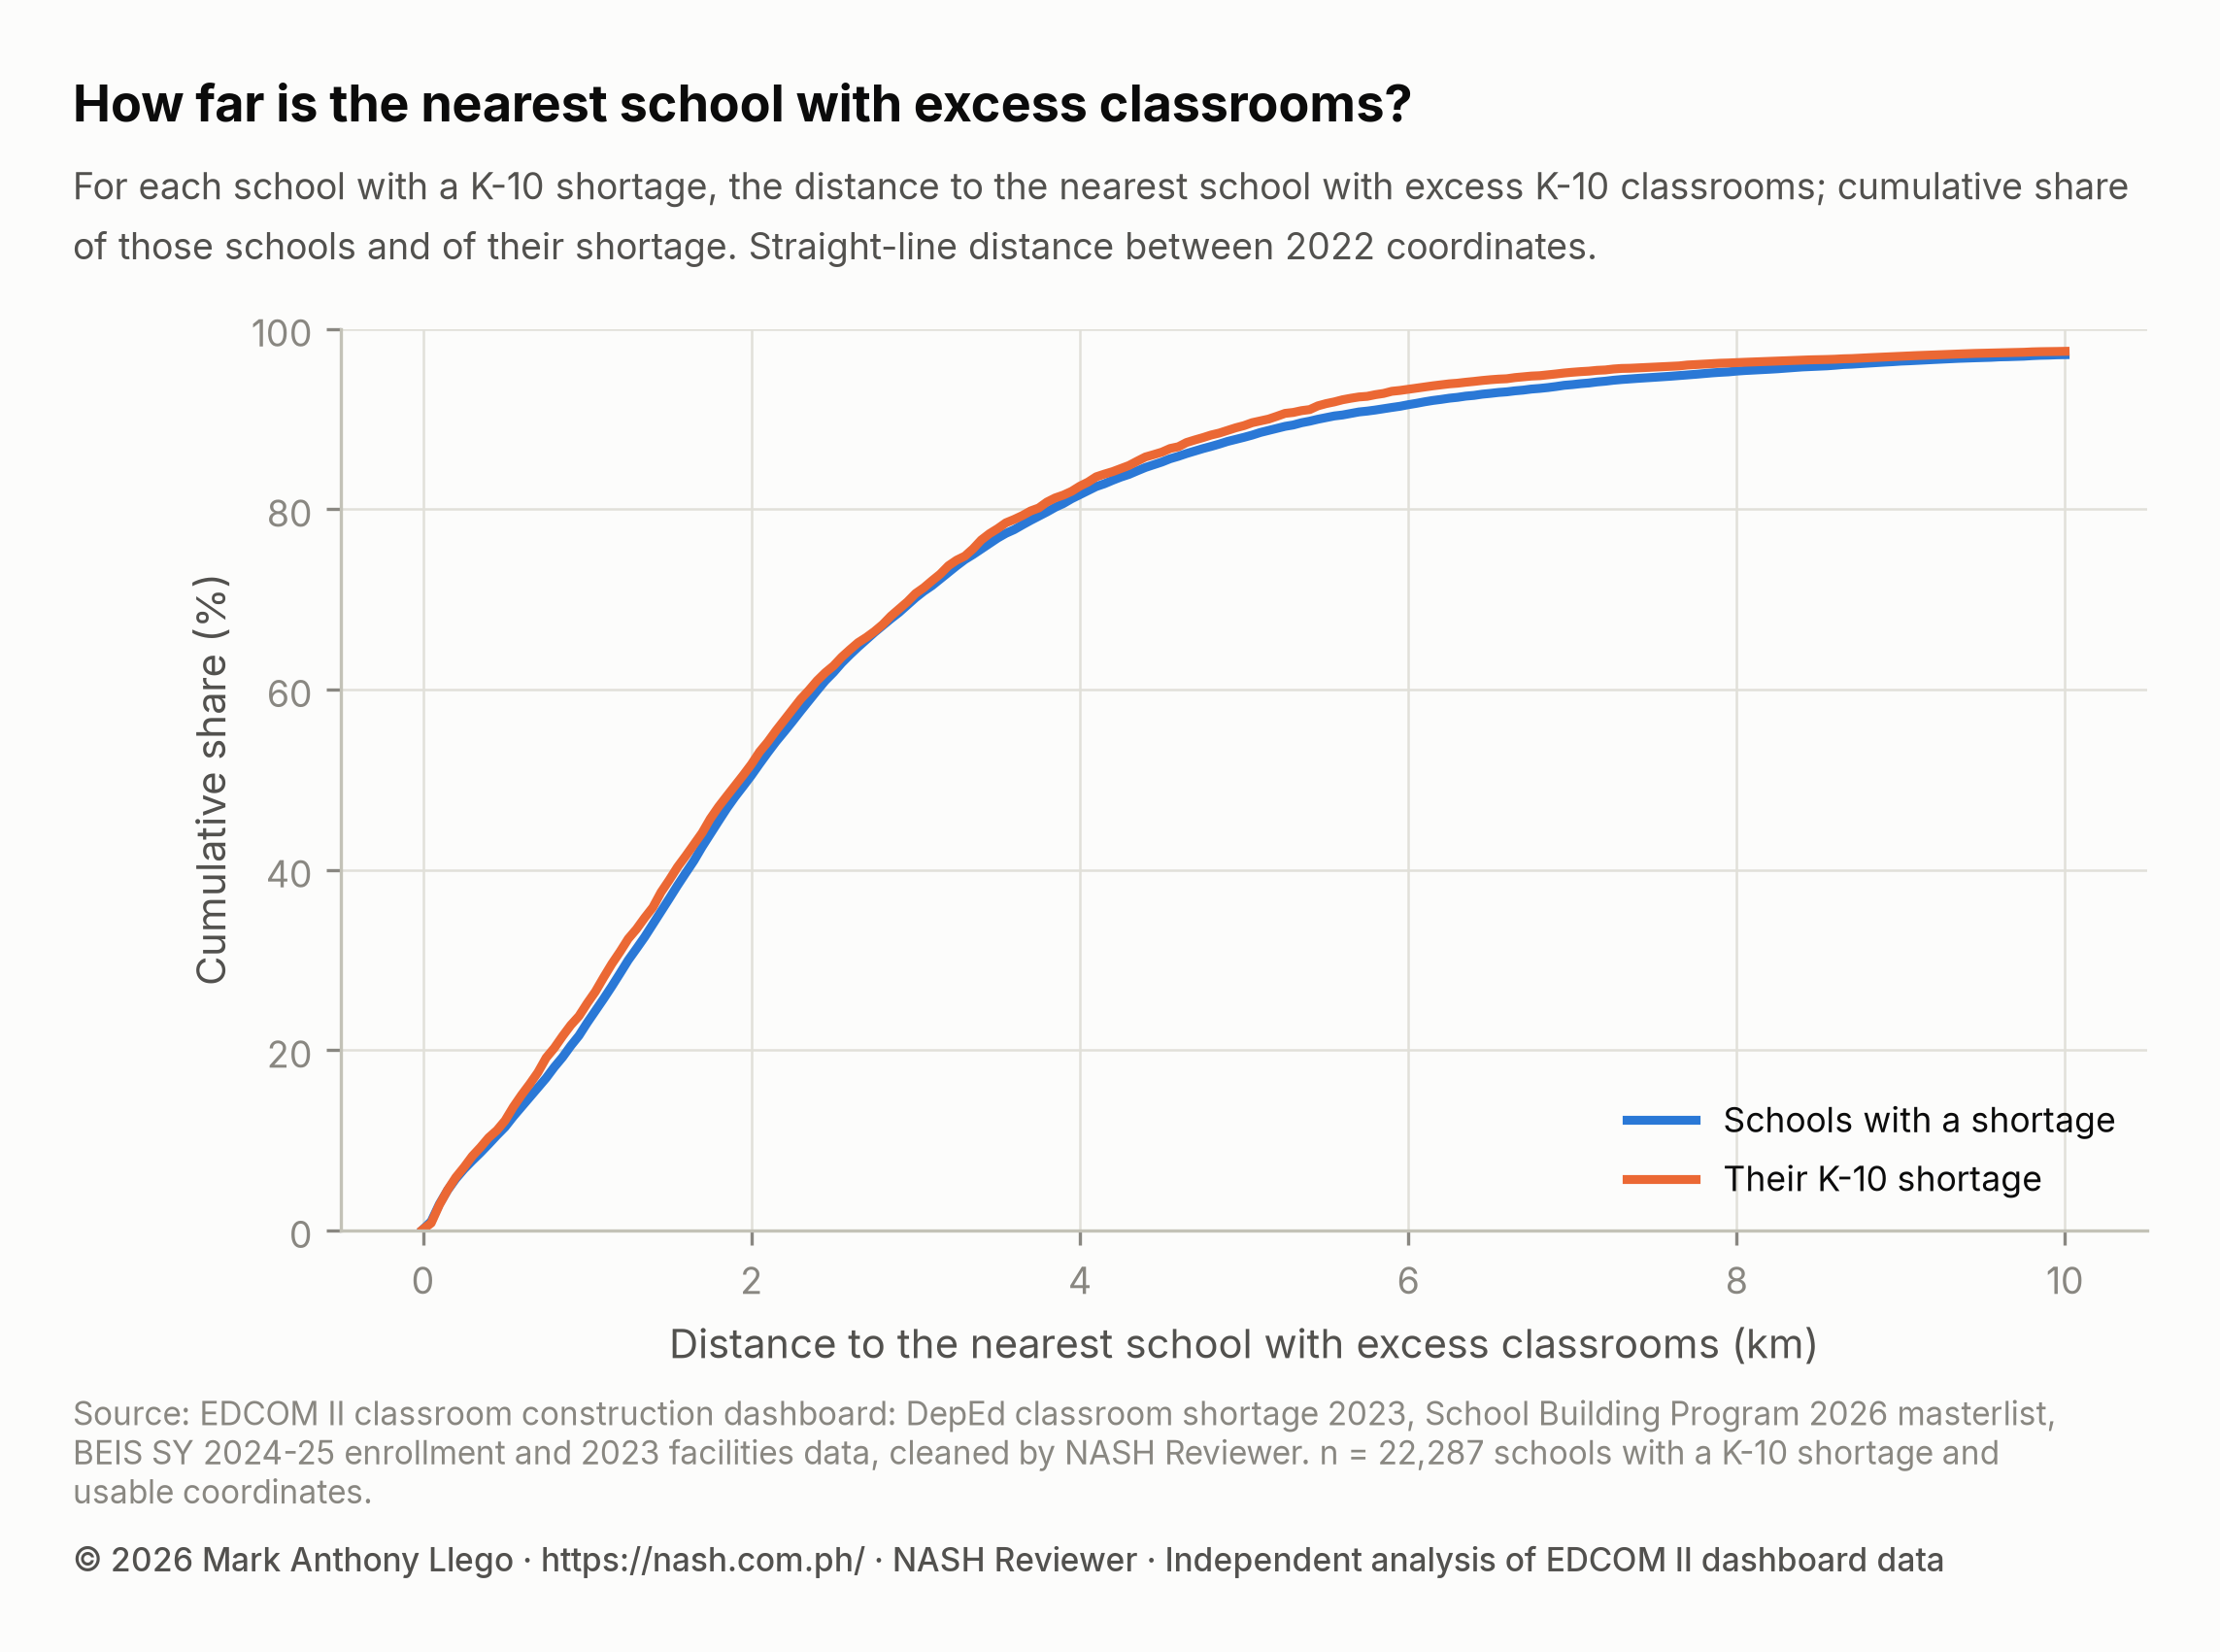
Town and barangay lines are administrative. Distance is closer to what a learner would face. For each school with a K-10 shortage, the chart measures the straight-line distance to the nearest school with excess K-10 rooms, using the schools’ 2022 coordinates. It covers the 22,287 schools with a K-10 shortage and usable coordinates, which hold 137,763 classrooms of K-10 shortage.
| Nearest school with excess K-10 classrooms | Schools with a K-10 shortage | Share of these schools | Share of their K-10 shortage |
|---|---|---|---|
| Within 1 km | 5,130 | 23.0% | 25.2% |
| Within 2 km | 11,246 | 50.5% | 51.7% |
| Within 5 km | 19,605 | 88.0% | 89.3% |
The median distance is 2.0 km: half of the schools with a K-10 shortage have a school with excess rooms within that distance. 23.0% have one within 1 km, and 88.0% within 5 km. The orange line, the shortage, sits slightly above the blue one, so schools with larger shortages tend to be a little closer to a school with excess, perhaps because large shortages are more common in towns where schools stand close together.
Read the table with care. The last column is the shortage at schools that have an excess school nearby, not the shortage that the nearby excess could absorb. The nearest school with excess may have a single extra room, or a fraction of one. It may teach different grade levels: an elementary school with an extra room cannot take Grade 9 learners. It may also be the nearest for many schools at once. A straight line crosses rivers, hills and highways that a learner cannot. Closeness is a reason to look, school by school, not a measure of what can be shared.
SBP 2026 classrooms at schools counted with excess
The SBP 2026 masterlist places 6,931 classrooms at 1,403 schools that had a K-10 excess in 2023, counting every line whatever its modality. The masterlist does not say why a school was chosen, and an allocation to a school counted with excess is not, on its own, a sign of poor targeting. Such a school may still need rooms for senior high, as 1,614 schools with excess do; it may need to replace rooms that are old, damaged or due to be condemned; or its enrollment may have grown since 2023. Do 2026 Classrooms Go Where the Shortage Is? compares the whole list with the 2023 shortage, and DepEd School Building Program 2026 in Numbers describes the list itself.
What this means for school heads
- Check your school’s figure, and what the rooms are today. In the school table,
excess_k10is the number of K-10 rooms DepEd counted beyond your school’s need in 2023; a fraction means a shared room was split. Compare it with your rooms now: their condition, what each is used for, and your enrollment since 2023. If a room counted as extra is unsafe, condemned or in daily use for something else, the figure overstates what is free. - Write the use of every room into the SIP. In your School Improvement Plan and AIP, list each room with its use and condition. Where a room is truly spare, plan its use for learning, such as a reading center, remedial and catch-up classes, a science or ICT room, or a venue for the Alternative Learning System, and use Brigada Eskwela to keep it safe and usable.
- Bring the map to the division. A division can map its schools to see which are short and which have extra rooms nearby. The distance figures show that the two are often within a few kilometers of each other; a division can check, school by school, whether grade levels, capacity and safe travel allow anything to be shared.
- Consider learner transfers only where they are feasible. A transfer to a nearby school with room can help only where that school teaches the same grade levels, has the capacity, and can be reached safely and cheaply, and where families agree. It should never cost a learner access to school.
- Keep the shortage case whole. Extra rooms at a nearby school do not reduce your school’s shortage in DepEd’s count, and they do not replace the classrooms the shortage calls for. Report your shortage and your neighbors’ excess separately when you talk with your LGU and division.
- For aspiring school heads, practice reading both figures. Explaining a school’s shortage or excess, and what lies behind it, is part of PPSSH Domain 2: Managing School Operations With DepEd Data; How to Read DepEd Data: A Guide for Aspiring School Heads covers medians, shares and rank correlations.
How these numbers were made
The data are the cleaned tables behind the EDCOM II classroom construction dashboard (Llego, 2026), described in How the EDCOM Classroom Data Was Cleaned: the 47,659 public schools in DepEd’s 2023 shortage table, with old school IDs mapped to current ones and merged schools combined, joined to SY 2024-25 enrollment, 2022 coordinates and the SBP 2026 masterlist. The analysis was done in Python with pandas, NumPy and SciPy, and the charts drawn with Matplotlib.
- Excess and shortage. A school’s excess is
excess_k10and its K-10 shortageshortage_k10, as DepEd reports them; a blank counts as zero. Both can be fractions. There is no excess column for senior high. - Schools with excess. The 16,396 schools with an excess above zero. Their bands, median, and shares that are rural, purely elementary or Last Mile Schools are computed over these schools. Their learners per classroom is the dashboard’s overall ratio, SY 2024-25 learners divided by 2023 rooms.
- Regions. DepEd regions, with Sulu in Region IX. The excess as a share of the shortage is a region’s total excess divided by its total K-10 shortage.
- Same-place matching. For each city or municipality (by its PSGC code), take the smaller of its total excess and its total K-10 shortage; add these over the 1,642 places; divide by the national K-10 shortage of 147,660. The barangay figure does the same over 32,676 barangays. The method assumes that any excess room could serve any learner in the same place, so it is an upper bound.
- Rank correlation. Spearman’s rho between each city or municipality’s total excess and total K-10 shortage, over all 1,642 places, with tied values sharing their average rank. The 95% interval is the middle 95% of 1,000 bootstrap estimates, each from a sample of places drawn with replacement.
- Distance. Schools with coordinates in the 2022 table, leaving out those flagged as lying more than 10 km from their barangay’s center. For each of the 22,287 schools with a K-10 shortage, the straight-line distance to the nearest school with excess, found with a k-d tree (SciPy’s
cKDTree) on a flat projection of latitude and longitude, which is accurate over short distances. The shares count schools, and their K-10 shortage, within 1, 2 and 5 km. - SBP 2026. The sum of
sbp_classroomsat schools with an excess, over all SBP lines and modalities.
Limits
The years differ: the excess and the shortage are from 2023, enrollment from SY 2024-25, coordinates from 2022 and allocations from 2026. Rooms built, damaged or condemned since 2023, and changes in enrollment, are not reflected. EDCOM II has warned that 51,222 classrooms are projected to be condemned by 2028 once they reach 50 years of age (EDCOM II, 2026, February 9), so some rooms counted in 2023, extra or not, will not stay in use.
The excess is DepEd’s own estimate. The data hold each school’s result, not the norms and inputs DepEd used, so this post cannot recompute or audit it, and extreme values such as 89 rooms at one school are worth checking at the source. A room counted as extra may be in poor condition or used as an office, a clinic or a library. The data have no excess figure for senior high, so a school’s spare K-10 rooms may already be serving senior high classes.
The matching figures assume rooms could serve any learner in the same place, and the distance figures use straight lines; neither accounts for grade levels, capacity, safety, travel time or cost. Many schools with a shortage may share the same nearest school with excess. Of the 24,083 schools with a K-10 shortage, the 22,287 with usable coordinates are in the distance figures; coordinates are never estimated. All results describe where rooms and needs sit on paper, not why, and not what any school or division should do with a given room.
Frequently asked questions
How many DepEd schools have more classrooms than they need?
In DepEd’s 2023 data, 16,396 public schools, 34.4% of the 47,659 in the shortage table, had more Kindergarten to Grade 10 classrooms than their enrollment required, 53,161 rooms in all. Most have little to spare: the median is 2.0 rooms, and 70.2% have three or fewer. The data have no excess figure for senior high school.
Can excess classrooms solve the classroom shortage?
No. Classrooms cannot move, and learners cannot always move to another school because of distance, grade levels, the receiving school’s capacity, safety and the cost of travel. Even on paper, if every excess room could serve any learner in its own city or municipality, the excess would match at most 23.7% of the 147,660-classroom K-10 shortage, and within the same barangay 6.9%. And the excess is often far from the largest shortages: Regions I, II and VI count more excess rooms than rooms short, while Region IV-A and NCR, with the largest shortages, have little excess.
Why would a school have more classrooms than it needs?
The data hold DepEd’s figure for each school, not the reasons behind it. In general, a school’s enrollment can fall as families move or as nearby schools open or add grade levels, while its rooms stay. A room counted as extra may also be old, unsafe or used for something else. Being counted with excess is not a fault, and the figure is from 2023, so a school’s situation may have changed.
Why do some schools with excess classrooms get new SBP 2026 classrooms?
The SBP 2026 masterlist places 6,931 classrooms at 1,403 schools counted with excess K-10 rooms in 2023, and it does not say why. Such a school may still need rooms for senior high, as 1,614 schools with excess K-10 rooms do, may need to replace old or damaged rooms, or may have more learners than in 2023.
Download the data and cite this post
The cleaned EDCOM II classroom data behind this series are free to download for personal study; to reuse them, email support@nash.com.ph for written permission first. How the EDCOM Classroom Data Was Cleaned explains every table and cleaning rule. The files are at data.nash.com.ph: start with the README, then the school table (Parquet, or CSV), the School Building Program lines (CSV), the city and municipality table (CSV), and every table for Stata and SPSS. Every figure in this post can be computed from the school table, using excess_k10, shortage_k10, shortage_shs, deped_region, psgc_municipality_code, psgc_barangay_code, latitude, longitude, coord_far_from_barangay and sbp_classrooms.
Every file, with its rows, columns and checksum, is listed on the EDCOM II classroom data page. To cite the data: Llego, M. A. (2026). EDCOM II classroom construction dashboard data, cleaned, version 1.1. NASH Reviewer. https://nash.com.ph/edcom-classroom-data
To cite this post: Llego, M. A. (2026, October 28). DepEd schools with more classrooms than they need. NASH Reviewer Blog. https://nash.com.ph/blog/schools-with-more-classrooms-than-needed
References
- Efron, B., & Tibshirani, R. J. (1993). An introduction to the bootstrap. Chapman & Hall.
- Llego, M. A. (2026). EDCOM II classroom construction dashboard data, cleaned, version 1.1 [Data set]. NASH Reviewer. https://nash.com.ph/edcom-classroom-data
- Second Congressional Commission on Education (EDCOM II). (2026, February 9). EDCOM II: 51,000 classrooms likely to be condemned by 2028 [News release]. https://edcom2.gov.ph/edcom-ii-51000-classrooms-likely-to-be-condemned-by-2028/
- Spearman, C. (1904). The proof and measurement of association between two things. American Journal of Psychology, 15(1), 72–101.
More in this series
- How the EDCOM Classroom Data Was Cleaned
- Philippine Classroom Shortage 2023: Where the Gap Is
- DepEd School Building Program 2026 in Numbers
- Do 2026 Classrooms Go Where the Shortage Is?
- Classroom Allocation by LGU Income Class, 2026
- Class Shifts and Crowded Classrooms in DepEd Schools
- Last Mile Schools: Classroom Need and 2026 Allocation
- Regional reports: NCR, CAR, Region I, Region II, Region III, Region IV-A, MIMAROPA, Region V, Region VI, NIR, Region VII, Region VIII, Region IX, Region X, Region XI, Region XII, Caraga, BARMM
- Rankings and deep dives: Congressional districts, Top 20 cities and municipalities, Rizal, Quezon City, City of Manila, Tawi-Tawi, Cavite, Cost of a classroom
- Explainers: PSIP III, Senior high shortage, Junior high shortage, Excess classrooms, Learning Continuity Spaces, How learners reach school
- For teachers and school heads: Action research and thesis topics
- Related: DepEd Classroom and School Building Data, SY 2023-2024, DepEd School Improvement Plan (SIP): Steps, AIP and SRC, How to Read DepEd Data: A Guide for Aspiring School Heads, PPSSH Domain 2: Managing School Operations With DepEd Data, National Education Plan 2026-2035: Guide for School Heads
Analysis and charts by Mark Anthony Llego for NASH Reviewer. Data: EDCOM II classroom construction dashboard and Department of Education data. NASH Reviewer is not affiliated with EDCOM II or DepEd. Charts may be reused only with written permission from support@nash.com.ph.