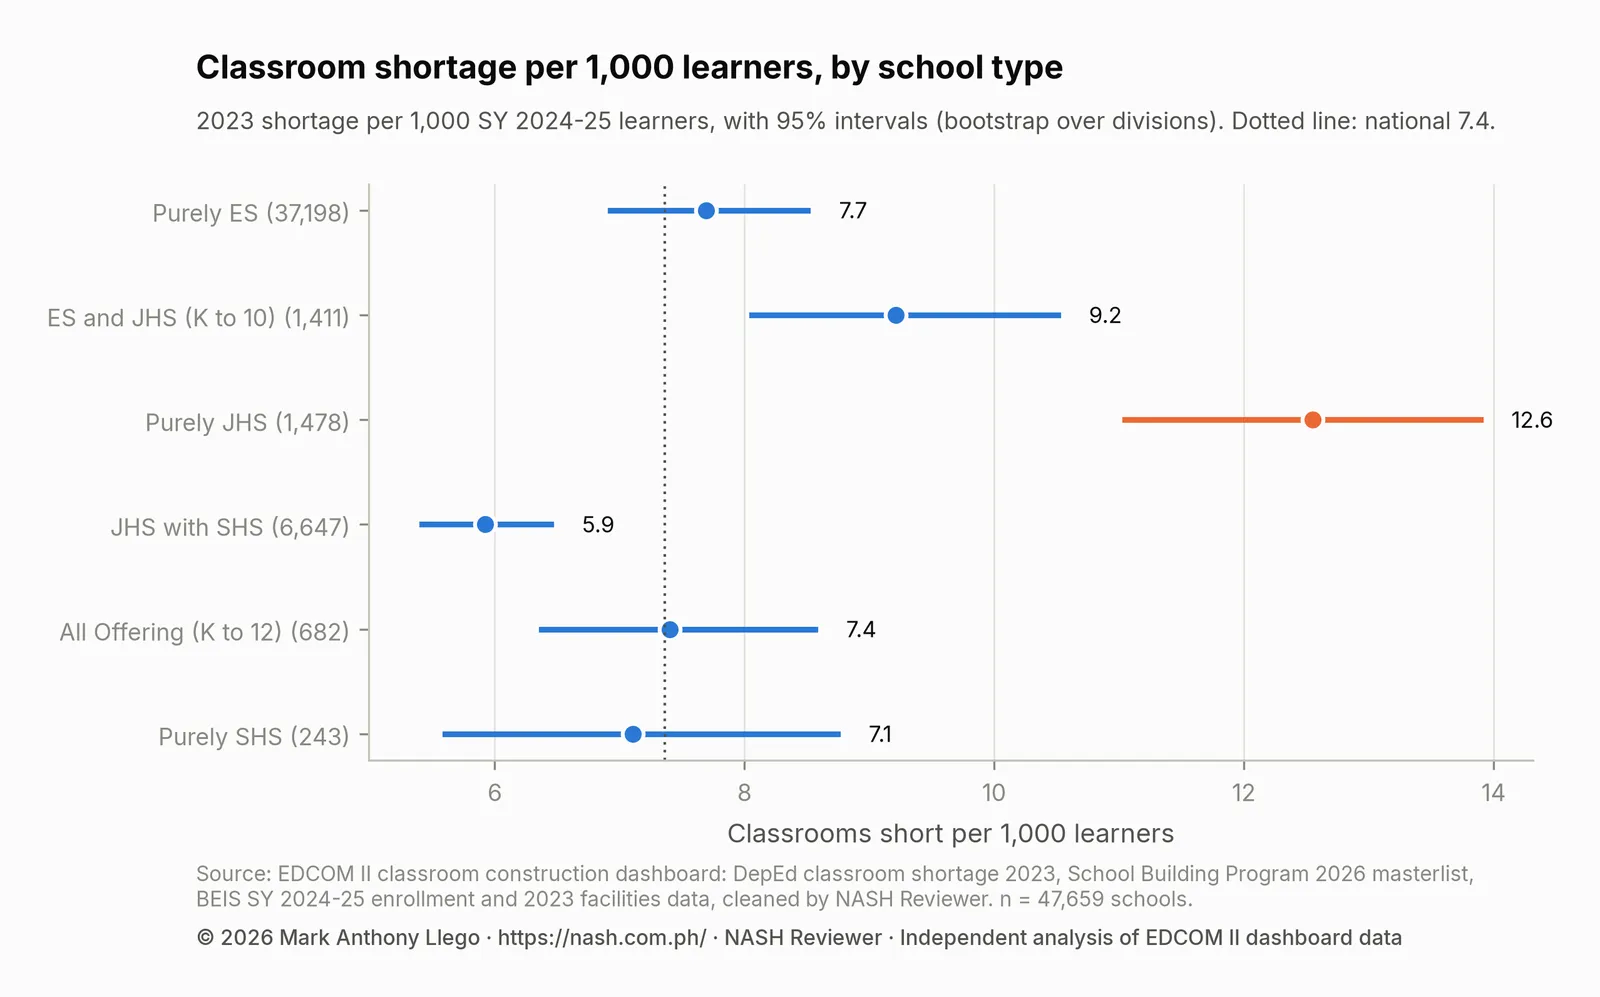
Public schools that offer only junior high school, Grades 7 to 10, have the largest classroom shortage per learner of any type of school in the Philippines. DepEd’s 2023 data put the 1,478 purely junior high (Purely JHS) schools 11,826 classrooms short: 12.6 classrooms per 1,000 learners enrolled in SY 2024-25 (95% interval 11.0 to 13.9), against 7.4 for all public schools. Schools offering Kindergarten to Grade 10 come next at 9.2, and schools offering Grades 7 to 12 are lowest at 5.9. Junior high rooms are also the most crowded of any level: the median school has 32.1 junior high learners per classroom, against 24.9 in elementary.
That rate is a measure of size: how many rooms are missing for the learners a group of schools serves. It is not the same as how often a school is short. Only 65.3% of purely JHS schools have a shortage, fewer than among the other types that offer junior high. A statistical model of the odds that a school has any shortage, with its size, its urban or rural setting and its region held equal, ranks schools offering Kindergarten to Grade 12, Kindergarten to Grade 10 and Grades 7 to 12 above purely JHS ones. Both findings are correct; they answer different questions.
The data are DepEd’s 2023 classroom shortage, as published in the EDCOM II classroom construction dashboard, joined to SY 2024-25 enrollment and class shifts and to the School Building Program (SBP) 2026 masterlist. The post is written for junior high school heads, heads of integrated schools and the teachers who plan with them, including those who will cite the figures in a school improvement plan, a thesis or action research. Every file behind it is listed on the EDCOM II classroom data page.
Key findings
- Purely JHS schools have 12.6 classrooms short per 1,000 learners (95% interval 11.0 to 13.9), the highest of the six school types and above the 7.4 for all public schools.
- The 1,478 purely JHS schools are short 11,826 classrooms in all, while purely elementary schools, at 7.7 per 1,000 learners, hold the most shortage, 98,485 classrooms.
- Only 65.3% of purely JHS schools have a shortage, against 69.2% of ES and JHS (K to 10), 68.8% of JHS with SHS and 81.7% of All Offering (K to 12) schools.
- With size, setting and region held equal, K to 12 schools have 5.15 times the odds of any shortage of a purely elementary school, ES and JHS schools 2.27, JHS with SHS schools 2.13 and purely JHS schools 1.40.
- Junior high rooms are the most crowded: a median of 32.1 junior high learners per classroom against 24.9 in elementary, and 7.2% of schools with junior high run two or more junior high shifts, against 3.0% in elementary.
- Purely JHS schools have a higher rate than purely elementary schools in both settings: 13.5 against 8.6 in urban schools and 10.1 against 6.7 in rural ones.
- All 10 purely JHS schools with the largest shortages are in NCR or Region IV-A, led by Antipolo National High School (193); three of them, and 16.6% of purely JHS schools with a shortage, have SBP 2026 classrooms.
Classroom shortage per learner by school type
DepEd labels each school by its curricular offering. A purely elementary school (Purely ES) offers Kindergarten to Grade 6; an ES and JHS (K to 10) school, Kindergarten to Grade 10; a purely junior high school (Purely JHS), Grades 7 to 10; a JHS with SHS school, Grades 7 to 12; an All Offering (K to 12) school, every grade from Kindergarten to Grade 12; and a purely senior high school (Purely SHS), Grades 11 and 12. Each type’s rate is its total 2023 shortage divided by its total SY 2024-25 enrollment, times 1,000.

| School type | Schools | Learners (SY 2024-25) | Classroom shortage (2023) | Per 1,000 learners (95% interval) | Schools with a shortage | Median learners per classroom | On two or more shifts |
|---|---|---|---|---|---|---|---|
| Purely ES | 37,198 | 12,769,868 | 98,485 | 7.7 (6.9 to 8.5) | 50.1% | 24.8 | 2.9% |
| ES and JHS (K to 10) | 1,411 | 719,265 | 6,628 | 9.2 (8.1 to 10.5) | 69.2% | 25.8 | 4.7% |
| Purely JHS | 1,478 | 940,687 | 11,826 | 12.6 (11.0 to 13.9) | 65.3% | 36.3 | 12.4% |
| JHS with SHS | 6,647 | 7,252,887 | 43,024 | 5.9 (5.4 to 6.4) | 68.8% | 31.3 | 8.9% |
| All Offering (K to 12) | 682 | 568,104 | 4,206 | 7.4 (6.4 to 8.6) | 81.7% | 27.6 | 7.2% |
| Purely SHS | 243 | 179,181 | 1,273 | 7.1 (5.6 to 8.7) | 40.7% | 24.8 | 14.4% |
Purely JHS schools have the highest rate, 12.6 classrooms short per 1,000 learners, and the most crowded rooms, a median of 36.3 learners per classroom. ES and JHS (K to 10) schools come next at 9.2. Purely elementary schools, at 7.7, are close to the national rate, but with 37,198 schools they hold the most shortage, 98,485 classrooms. JHS with SHS schools have the lowest rate, 5.9, though 68.8% of them are short, and K to 12 schools have the highest share of schools short, 81.7%. The same figures appear in Philippine Classroom Shortage 2023: Where the Gap Is, which first noted the purely JHS rate; the senior high school classroom shortage looks at the senior high level alone.
What the 95% intervals mean
The data cover every school in DepEd’s 2023 shortage table, so the intervals are not about a survey that might have drawn the wrong schools. They answer a different question: how much does each rate depend on which divisions happen to be in it?
To find out, each rate is recomputed 1,000 times. Each time, divisions are drawn at random, with replacement, as many as there are, so some divisions appear twice and others not at all. The shortage and the learners of that type’s schools in the drawn divisions are added up and divided, as for the real rate. The middle 95% of the 1,000 results is the interval. This is a bootstrap (Efron & Tibshirani, 1993), and because it draws whole divisions rather than single schools, a cluster bootstrap. Schools in a division share a division office, local growth in enrollment and often the same planners, so their shortages tend to rise and fall together; drawing single schools would treat them as independent and make the interval too narrow (Cameron & Miller, 2015). The interval need not sit evenly around the rate: when a few divisions with large shortages carry much of a type’s total, drawing them twice or not at all moves the rate more in one direction than the other.
Read the intervals side by side. The purely JHS interval, 11.0 to 13.9, lies wholly above every other type’s, so its lead holds whichever divisions are drawn. The others overlap in a chain. ES and JHS (K to 10), at 8.1 to 10.5, overlaps purely elementary (6.9 to 8.5), K to 12 (6.4 to 8.6) and purely SHS (5.6 to 8.7), so its second place is less firm. JHS with SHS, at 5.4 to 6.4, lies below purely elementary and ES and JHS schools, touches the K to 12 interval at 6.4 and overlaps purely SHS. Intervals that do not overlap mark a difference that holds; intervals that overlap a little may still differ, but these figures alone cannot show it.
Is it because junior high schools are urban?
Urban schools have higher rates in general, 8.4 classrooms short per 1,000 learners against 6.1 in rural schools nationally, and purely JHS schools are more often urban: 34.0% of them, against 20.4% of purely elementary schools. That is not the whole explanation. Among urban schools, purely JHS schools have 13.5 classrooms short per 1,000 learners against 8.6 for purely elementary schools; among rural schools, 10.1 against 6.7. Purely JHS schools have the higher rate in both settings.
Rate per learner or any shortage: two measures, two rankings
The rate and the share of schools short answer different questions. The rate asks: for all the learners in this group of schools, how many classrooms are missing? It is a total divided by a total, so a school counts in proportion to its learners and its shortage. The share asks: how many of these schools are short at all? Each school counts once, whether it lacks one room or a hundred. Antipolo National High School, short 193 classrooms for 11,435 learners, and a small school short one room each add one school to the share, but Antipolo weighs far more in the rate.
Purely JHS schools lead on the first measure, not the second. 65.3% of them are short, against 69.2% of ES and JHS schools, 68.8% of JHS with SHS schools and 81.7% of K to 12 schools. The group mixes many small schools, the median one with 229 learners, with some very large ones whose shortages are large. Region IV-A’s 279 purely JHS schools are short 5,622 classrooms and NCR’s 88 are short 2,575, together most of the 11,826.
Holding size, setting and region equal
Raw shares mix the type of school with other things that go with it: its size, its setting and its region. A logistic regression (Hosmer and colleagues, 2013) compares schools while holding these equal. Its outcome is whether a school has any 2023 shortage. Its terms are the school type, compared with purely elementary schools; SY 2024-25 enrollment, per doubling; urban location; and a separate baseline for each region (region fixed effects), so schools are compared only within their region. It covers 47,495 schools, with standard errors clustered by division, for the same reason the intervals draw whole divisions.
The results are odds ratios. The odds of an event are its chance of happening divided by its chance of not happening, and an odds ratio compares two groups’ odds: 1 means no difference, above 1 higher odds, below 1 lower. When chances are small, an odds ratio is close to a ratio of chances. Here they are not small, since half or more of the schools in most types are short, and an odds ratio is then much larger than the ratio of chances: an odds ratio of 5.15 does not mean five times as likely.
| Term | Odds ratio (95% interval) | p-value |
|---|---|---|
| ES and JHS (K to 10) (vs Purely ES) | 2.27 (1.79 to 2.88) | p < 0.001 |
| Purely JHS (vs Purely ES) | 1.40 (1.09 to 1.81) | p = 0.009 |
| JHS with SHS (vs Purely ES) | 2.13 (1.74 to 2.61) | p < 0.001 |
| All Offering (K to 12) (vs Purely ES) | 5.15 (3.89 to 6.81) | p < 0.001 |
| Purely SHS (vs Purely ES) | 0.41 (0.26 to 0.64) | p < 0.001 |
| Each doubling of enrollment | 1.04 (0.97 to 1.11) | p = 0.260 |
| Urban school | 1.75 (1.57 to 1.95) | p < 0.001 |
Compared with purely elementary schools of the same size and setting in the same region, K to 12 schools have 5.15 times the odds of any shortage (95% interval 3.89 to 6.81), ES and JHS schools 2.27 and JHS with SHS schools 2.13. Purely JHS schools have 1.40 times the odds (1.09 to 1.81): more likely to be short than similar elementary schools, but below the three integrated types and above only purely elementary and purely SHS schools (0.41). The purely JHS interval barely overlaps those of ES and JHS schools (1.79 to 2.88) and JHS with SHS schools (1.74 to 2.61), so the order among these three is less certain than the gap to K to 12 schools.
Size adds little once type, setting and region are equal: each doubling of enrollment goes with odds 1.04 times as high, and the interval, 0.97 to 1.11, includes 1. Urban schools have 1.75 times the odds of rural schools.
Both rankings are right. If the question is where learners have the fewest rooms for their numbers, purely JHS schools lead. If it is how likely a school of a given type is to be short at all, other things equal, integrated schools lead, K to 12 schools above all. These data cannot say why. One possibility, which they cannot test, is that a school combining levels needs rooms for every grade it runs, however few learners some grades have.
How crowded junior high classrooms are
The number of learners per classroom divides a level’s SY 2024-25 learners by its 2023 instructional classrooms. It is not a class size, since a room can hold two classes a day in a shifting school, and the two figures come from different years.
Across schools with junior high learners, the median school has 32.1 junior high learners per junior high classroom, against 24.9 in elementary and 30.6 in senior high. Of the schools with a junior high ratio, 23.3% have more than 45, and 1,762 schools have more than 50, the line EDCOM II uses when it counts congested schools (EDCOM II, 2026, October 20). Shifts follow the crowding: 778 schools, 7.2% of those reporting junior high, ran junior high classes in two or more shifts in SY 2024-25, against 3.0% of schools reporting elementary.
Purely JHS schools are the most crowded type, with a median of 36.3 learners per classroom, and 12.4% of them run two or more shifts, second only to purely SHS schools at 14.4%. Crowding and the shortage are two sides of the same gap: a school without enough rooms fills the rooms it has, or uses each one twice a day. Class Shifts and Crowded Classrooms in DepEd Schools explains how shifts are recorded and compares every level.
Purely junior high schools by region
| Region | Purely JHS schools | Classroom shortage (2023) | Per 1,000 learners | Schools with a shortage |
|---|---|---|---|---|
| NCR | 88 | 2,575 | 13.7 | 86.4% |
| CAR | 71 | 55 | 6.4 | 28.2% |
| Region I | 6 | 9 | 3.0 | 66.7% |
| Region II | 21 | 25 | 2.4 | 38.1% |
| Region III | 109 | 618 | 7.2 | 59.6% |
| Region IV-A | 279 | 5,622 | 14.1 | 68.5% |
| MIMAROPA | 182 | 383 | 9.6 | 54.9% |
| Region V | 42 | 162 | 12.6 | 88.1% |
| Region VI | 7 | 17 | 10.3 | 85.7% |
| NIR | 47 | 166 | 11.6 | 85.1% |
| Region VII | 72 | 380 | 15.2 | 83.3% |
| Region VIII | 102 | 236 | 6.3 | 50.0% |
| Region IX | 79 | 298 | 10.5 | 53.2% |
| Region X | 30 | 132 | 7.6 | 63.3% |
| Region XI | 96 | 413 | 20.7 | 82.3% |
| Region XII | 100 | 306 | 20.1 | 74.0% |
| CARAGA | 32 | 71 | 10.4 | 53.1% |
| BARMM | 115 | 358 | 11.5 | 66.1% |
Region IV-A has the most purely JHS schools, 279, and the largest purely JHS shortage, 5,622 classrooms, at 14.1 per 1,000 learners; NCR follows with 2,575 classrooms at 88 schools, 13.7 per 1,000. The highest rates, though, are in Region XI (20.7) and Region XII (20.1), and Region VII is next at 15.2. In NCR, Region V, Region VI, NIR, Region VII and Region XI, more than eight in ten purely JHS schools are short.
The rate is above the national 7.4 for all schools in most regions, so the purely JHS gap is not only a Metro Manila and Calabarzon story. Some regions have few such schools, six in Region I and seven in Region VI, and a rate resting on so few schools can swing with one of them. Sulu is counted in Region IX, since its schools division moved to DepEd Region IX on 20 October 2026.
The 10 purely junior high schools with the largest shortages
| School ID | School | Division | Learners (SY 2024-25) | Learners per classroom | Classroom shortage (2023) | SBP 2026 classrooms | Two or more shifts |
|---|---|---|---|---|---|---|---|
| 301418 | Antipolo National High School | Antipolo City | 11,435 | 91.5 | 193 | 8 | Yes |
| 301196 | Imus NHS | Imus City | 9,654 | 99.5 | 192 | 0 | No |
| 305337 | Justice Cecilia Muñoz Palma High School | Quezon City | 8,852 | 116.5 | 170 | 0 | Yes |
| 301222 | Trece Martires City National High School | Cavite | 10,819 | 89.4 | 163 | 100 | No |
| 305306 | Ramon Magsaysay High School | Manila | 4,798 | Not given | 142 | 0 | Yes |
| 305374 | Camarin High School | Caloocan City | 9,405 | 66.2 | 130 | 0 | No |
| 301190 | Gen. Emilio Aguinaldo NHS (Imus) | Imus City | 7,330 | 60.1 | 121 | 0 | Yes |
| 301256 | Pacita Complex NHS | San Pedro City | 3,361 | 101.8 | 107 | 0 | No |
| 301419 | Bagong Nayon II National High School | Antipolo City | 5,013 | 150.3 | 102 | 0 | Yes |
| 305382 | Kalayaan National High School | Caloocan City | 5,884 | 98.1 | 96 | 12 | No |
All ten are in NCR or Region IV-A, and all are large: from 3,361 to 11,435 learners. Antipolo National High School leads, short 193 classrooms for 11,435 learners, with Imus NHS close behind at 192. The rooms are crowded, from 60.1 learners per classroom at Gen. Emilio Aguinaldo NHS (Imus) to 150.3 at Bagong Nayon II National High School, a ratio worth checking against the school’s own room count, and five of the ten run two or more shifts. Ramon Magsaysay High School in Manila has no classroom count in the 2023 facilities data, so its ratio is not given; its record is worth confirming with the division.
Three of the ten have SBP 2026 classrooms: Trece Martires City National High School is listed for 100, on PSIP III lines, as the Cavite deep dive shows, Kalayaan National High School for 12 and Antipolo National High School for 8. The other seven, with shortages from 102 to 192 classrooms, have none. PSIP III, the third Public-Private Partnership for School Infrastructure Project, is still for bidding, with construction expected from March 2027 to July 2028; PSIP III explained describes it.
Across all purely JHS schools with a shortage, 16.6% have any SBP 2026 classroom, against 13.3% of all public schools with a shortage, as Do 2026 Classrooms Go Where the Shortage Is? reports. The reports for Region IV-A and NCR, and the deep dives on Rizal, Quezon City and the City of Manila, place these schools among their neighbors.
What this means for junior high school heads
- Check your school’s figures. In the school table below, find your school ID.
shortage_totalis your 2023 shortage,curricular_offeringyour school type,enrol_jhsandlearners_per_classroom_jhsyour SY 2024-25 junior high learners and learners per classroom,jhs_highest_shiftyour junior high shifts andsbp_classroomsyour SBP 2026 classrooms. Read them beside the rooms you have today. - Use the measure that fits the question. To show how far your learners are from enough rooms, use the shortage per 1,000 learners or the learners per classroom. To show how common the problem is among schools like yours, use the share of schools short. Say which one you use, and do not set one against the other.
- Watch the Grade 7 intake. A purely JHS school’s learners come from elementary schools nearby. Their Grade 6 enrollment is an early signal of next year’s Grade 7 classes, and a reason to plan rooms with those schools and the division.
- Write crowding and shifts into the SIP. Record learners per classroom by grade, any shifts with their hours, and rooms borrowed or makeshift, with dates, as the baseline of your school improvement plan and AIP. EDCOM II counts 68,147 classrooms needed to ease congestion in 4,492 schools with more than 50 learners per classroom (EDCOM II, 2026, October 20).
- Bring the numbers to the division and the LGU. Most of the purely JHS shortage, counted in classrooms, is in Region IV-A and NCR, but the purely JHS rate is above the national 7.4 in most regions, so a school anywhere can make its case with its own figures. If your school is on the SBP 2026 list, ask which lines are GAA-funded and which are PSIP III, since the timelines differ. Classroom Allocation by LGU Income Class, 2026 shows how allocations vary across LGUs.
- For integrated school heads. DepEd’s table gives one shortage for Kindergarten to Grade 10, so an ES and JHS school cannot read its junior high part from it. Keep your own count of rooms and learners by level.
How these numbers were made
The data are the cleaned tables behind the EDCOM II classroom construction dashboard (Llego, 2026), described in How the EDCOM Classroom Data Was Cleaned: DepEd’s 2023 classroom shortage for 47,659 public schools, joined on each school’s current ID to SY 2024-25 enrollment and class shifts, the 2023 facilities data and the SBP 2026 masterlist. The analysis was done in Python with pandas, NumPy, SciPy and statsmodels, and the chart drawn with Matplotlib; figures are rounded half up.
- School types. DepEd’s curricular offering labels (
curricular_offering); every school in the 2023 shortage table has one. - Rates per 1,000 learners. A group’s total 2023 shortage (
shortage_total) divided by its total SY 2024-25 enrollment (enrol_total), times 1,000, over schools with learners: a ratio of totals, not an average of school rates. The national rate, 7.4, uses all such schools. - 95% intervals. For each rate, 1,000 bootstrap samples that draw whole divisions with replacement; the interval is the middle 95% of the 1,000 rates (Efron & Tibshirani, 1993; Cameron & Miller, 2015).
- Crowding by level. Junior high learners per classroom (
learners_per_classroom_jhs) is SY 2024-25 junior high enrollment divided by 2023 junior high instructional classrooms; likewise for elementary and senior high. Medians, the share over 45 and the count over 50 are over schools in the SY 2024-25 enrollment table with a ratio. Shift shares are over schools with a value for the level (jhs_highest_shift,es_highest_shift), a school shifting when the value is 2 or 3. - By school type. The median learners per classroom uses the dashboard’s ratio for all levels (
learners_per_classroom_all); a school is on shifts when it runs two or more at any level (multi_shift). - Urban and rural. DepEd’s label (
urban_rural). - Logistic regression. Outcome 1 if a school’s 2023 shortage is above zero, 0 if not. Terms: the school type (compared with Purely ES), the base-2 logarithm of enrollment, an urban indicator and region fixed effects; fitted by maximum likelihood, with standard errors clustered by division. It covers the 47,495 schools with learners, an urban or rural label and a division. Each coefficient b is reported as an odds ratio, e to the power b, with its 95% interval converted the same way.
- SBP 2026. A school has SBP classrooms when the masterlist gives it at least one (
sbp_classrooms), counting GAA-funded lines, Learning Continuity Spaces and PSIP III. - Regions. DepEd regions, with Sulu in Region IX.
Limits
The years differ: the shortage and classrooms are from 2023, enrollment and shifts from SY 2024-25, and allocations from 2026. A school that added rooms after 2023 looks more crowded than it is, and the 2023 shortage of a school whose enrollment has grown does not count its new learners.
The shortage is DepEd’s own estimate. The data hold each school’s result, not the norms and inputs DepEd used, and they give one figure for Kindergarten to Grade 10, so the junior high part of an integrated school’s shortage cannot be separated. Learners per classroom is not a class size, and some schools, such as Ramon Magsaysay High School, have no classroom count.
The rate and the share measure different things, and the model ranks types by the odds of any shortage, not by its size. The model holds equal only what it includes; growth in enrollment, land, building condition and funding are not in it. Some regions have few purely JHS schools, so their rates can swing with one school. SBP 2026 classrooms are plans, not buildings, and PSIP III is still for bidding. All results are associations: they show where the shortage is, not why.
Frequently asked questions
Which type of public school has the biggest classroom shortage?
Per learner, purely junior high schools, with 12.6 classrooms short per 1,000 learners in DepEd’s 2023 data against 7.4 for all public schools. In classrooms, purely elementary schools hold the most, 98,485, because there are 37,198 of them. K to 12 schools are the most often short: 81.7% of them have a shortage.
What is a purely junior high school?
It is DepEd’s label for a school that offers only junior high school, Grades 7 to 10, with no elementary or senior high grades. There are 1,478 in DepEd’s 2023 shortage table, with 940,687 learners in SY 2024-25; the median one enrolls 229 learners.
Are purely junior high schools the most likely to have a classroom shortage?
No. 65.3% of them are short, fewer than among ES and JHS (69.2%), JHS with SHS (68.8%) and K to 12 schools (81.7%). With size, setting and region held equal, their odds of any shortage are 1.40 times those of a purely elementary school, below K to 12 (5.15), ES and JHS (2.27) and JHS with SHS schools (2.13). They lead on the size of the gap per learner, not on how often a school is short.
Do purely junior high schools get SBP 2026 classrooms?
Some do. Of purely JHS schools with a 2023 shortage, 16.6% have at least one SBP 2026 classroom, against 13.3% of all public schools with a shortage. Of the 10 with the largest shortages, three are on the list, and seven, each short more than 100 classrooms, are not.
Download the data and cite this post
The cleaned EDCOM II classroom data behind this series are free to download for personal study; to reuse them, email support@nash.com.ph for written permission first. How the EDCOM Classroom Data Was Cleaned explains every table and cleaning rule. The files are at data.nash.com.ph: start with the README, then the school table (Parquet, or CSV), the School Building Program lines (CSV), the city and municipality table (CSV), and every table for Stata and SPSS. Every figure in this post can be computed from the school table, using curricular_offering, shortage_total, enrol_total, learners_per_classroom_all, learners_per_classroom_jhs, learners_per_classroom_es, learners_per_classroom_shs, jhs_highest_shift, es_highest_shift, multi_shift, urban_rural, sbp_classrooms, division and deped_region.
Every file, with its rows, columns and checksum, is listed on the EDCOM II classroom data page. To cite the data: Llego, M. A. (2026). EDCOM II classroom construction dashboard data, cleaned, version 1.1. NASH Reviewer. https://nash.com.ph/edcom-classroom-data
To cite this post: Llego, M. A. (2026, October 28). Junior high school classroom shortage: Highest per learner. NASH Reviewer Blog. https://nash.com.ph/blog/junior-high-school-classroom-shortage
References
- Cameron, A. C., & Miller, D. L. (2015). A practitioner’s guide to cluster-robust inference. Journal of Human Resources, 50(2), 317–372.
- Efron, B., & Tibshirani, R. J. (1993). An introduction to the bootstrap. Chapman & Hall.
- Hosmer, D. W., Lemeshow, S., & Sturdivant, R. X. (2013). Applied logistic regression (3rd ed.). Wiley.
- Llego, M. A. (2026). EDCOM II classroom construction dashboard data, cleaned, version 1.1 [Data set]. NASH Reviewer. https://nash.com.ph/edcom-classroom-data
- Second Congressional Commission on Education (EDCOM II). (2026, October 20). Put classrooms where they’re needed most, EDCOM 2 tells DepEd [News release]. https://edcom2.gov.ph/put-classrooms-where-theyre-needed-most-edcom-2-tells-deped/
More in this series
- How the EDCOM Classroom Data Was Cleaned
- Philippine Classroom Shortage 2023: Where the Gap Is
- DepEd School Building Program 2026 in Numbers
- Do 2026 Classrooms Go Where the Shortage Is?
- Classroom Allocation by LGU Income Class, 2026
- Class Shifts and Crowded Classrooms in DepEd Schools
- Last Mile Schools: Classroom Need and 2026 Allocation
- Regional reports: NCR, CAR, Region I, Region II, Region III, Region IV-A, MIMAROPA, Region V, Region VI, NIR, Region VII, Region VIII, Region IX, Region X, Region XI, Region XII, Caraga, BARMM
- Rankings and deep dives: Congressional districts, Top 20 cities and municipalities, Rizal, Quezon City, City of Manila, Tawi-Tawi, Cavite, Cost of a classroom
- Explainers: PSIP III, Senior high shortage, Junior high shortage, Excess classrooms, Learning Continuity Spaces, How learners reach school
- For teachers and school heads: Action research and thesis topics
- Related: DepEd Enrollment SY 2024-2025: Smallest Kindergarten Class, DepEd School Improvement Plan (SIP): Steps, AIP and SRC, PPSSH Domain 2: Managing School Operations With DepEd Data, How to Read DepEd Data: A Guide for Aspiring School Heads, National Education Plan 2026-2035: Guide for School Heads, EDCOM II Final Report: Guide for Aspiring School Heads
Analysis and charts by Mark Anthony Llego for NASH Reviewer. Data: EDCOM II classroom construction dashboard and Department of Education data. NASH Reviewer is not affiliated with EDCOM II or DepEd. Charts may be reused only with written permission from support@nash.com.ph.