In school year (SY) 2024-25, 2,041 public schools held classes in two or more shifts at some level, 4.3% of the 47,972 schools in DepEd’s enrollment table; 30 of them ran three shifts. They enroll 4,596,527 learners, 20.4% of the total. NCR alone has 515 schools on shifts, 62.2% of its schools, and NCR, Region IV-A and Region III together hold 68.3% of all schools on shifts.
Shifts and crowded classrooms go together. The median school on shifts has 55.0 learners per instructional classroom, against 25.5 in single-session schools. Of the shift schools in DepEd’s 2023 classroom shortage data, 93.0% report a shortage, yet only 26.2% are allocated classrooms under the School Building Program (SBP) 2026, leaving 1,491 with none.
The data are the cleaned tables behind the EDCOM II classroom construction dashboard: DepEd’s SY 2024-25 enrollment and class shifts, its 2023 facilities data and classroom shortage, and the SBP 2026 masterlist. The post is for teachers, school heads and aspiring school heads who need a sourced figure for a school improvement plan, action research or a thesis. The figures show associations and plans, not causes or finished classrooms.
Key findings
- In SY 2024-25, 2,041 public schools (4.3%) held classes in two or more shifts at some level, 30 of them in three, and they enroll 4,596,527 learners (20.4% of all learners).
- By level, 1,184 elementary (3.0% of those reporting the level), 778 junior high (7.2%) and 453 senior high schools (5.7%) ran two or more shifts.
- NCR has 515 schools on shifts, 62.2% of its schools, and NCR, Region IV-A and Region III hold 68.3% of all shift schools.
- The median school has 24.9 learners per instructional classroom in elementary, 32.1 in junior high and 30.6 in senior high, and 5,177 schools exceed 50 across all levels.
- Schools on shifts have a median of 55.0 learners per classroom against 25.5 in single-session schools, a large difference (rank-biserial correlation 0.76).
- Of shift schools in DepEd’s 2023 shortage data, 93.0% report a shortage (median 20.0 classrooms), and they hold 33.7% of the shortage at the schools in both tables.
- Shift schools are 2.59 times as likely as others to receive SBP 2026 classrooms (95% interval 2.40 to 2.80), yet 1,491 receive none, with 38,384 classrooms of shortage.
How many DepEd schools hold classes in shifts
A school with too few rooms can use each room more than once a day: one set of classes in the morning, another in the afternoon, and in a triple-shift school a third. DepEd’s Basic Education Information System (BEIS) records, for each school and level, the highest number of shifts the school runs: 0 for a single session, 2 for double shifts and 3 for triple shifts. “Highest” matters: a school where only Kindergarten runs three shifts and Grades 1 and 2 run two is recorded as three for the elementary level. A shift school, in this post, records 2 or more at any level.
| Level | Schools reporting the level | Two shifts | Three shifts | Two or more shifts | Share of schools reporting | Learners at this level in these schools |
|---|---|---|---|---|---|---|
| Elementary | 39,405 | 1,162 | 22 | 1,184 | 3.0% | 2,161,128 |
| Junior high | 10,833 | 771 | 7 | 778 | 7.2% | 1,628,289 |
| Senior high | 7,910 | 452 | 1 | 453 | 5.7% | 433,564 |
Relative to their number, junior high schools shift most often. An integrated school can shift at more than one level, so the rows add up to more than 2,041. The 4,596,527 learners include everyone enrolled in a shift school, even at levels that do not shift, so they are an upper bound on the learners in shifted classes.
Three-shift entries need care. The source’s remarks column notes that three-shift schools marked “No Response” were still pending the school head’s confirmation. In all, 27 of the 30 three-shift schools carry a remark there, from “Validated” to reasons such as limited classrooms or a building under construction.
Comparing these counts with EDCOM II and the National Education Plan
EDCOM II’s news release of 20 October 2026 counts 1,889 schools on double or triple shifts and estimates that 52,871 classrooms are needed to end shifting in them, using SY 2024-2025 and SY 2023-2024 data. The National Education Plan 2026-2035, in EDCOM II’s Year Three report, sets a baseline of 1,410 elementary schools with multiple class shifts (DepEd, 2024), with a target of zero.
This post’s 2,041 counts a school that shifts at any level in SY 2024-25; its elementary count is 1,184. The figures come from different extracts, years and definitions, so they are not contradictions, and the gap between 1,410 and 1,184 cannot be read as progress. National Education Plan 2026-2035: Guide for School Heads explains the plan’s targets.
Class shifting by region: NCR, Region IV-A and Region III
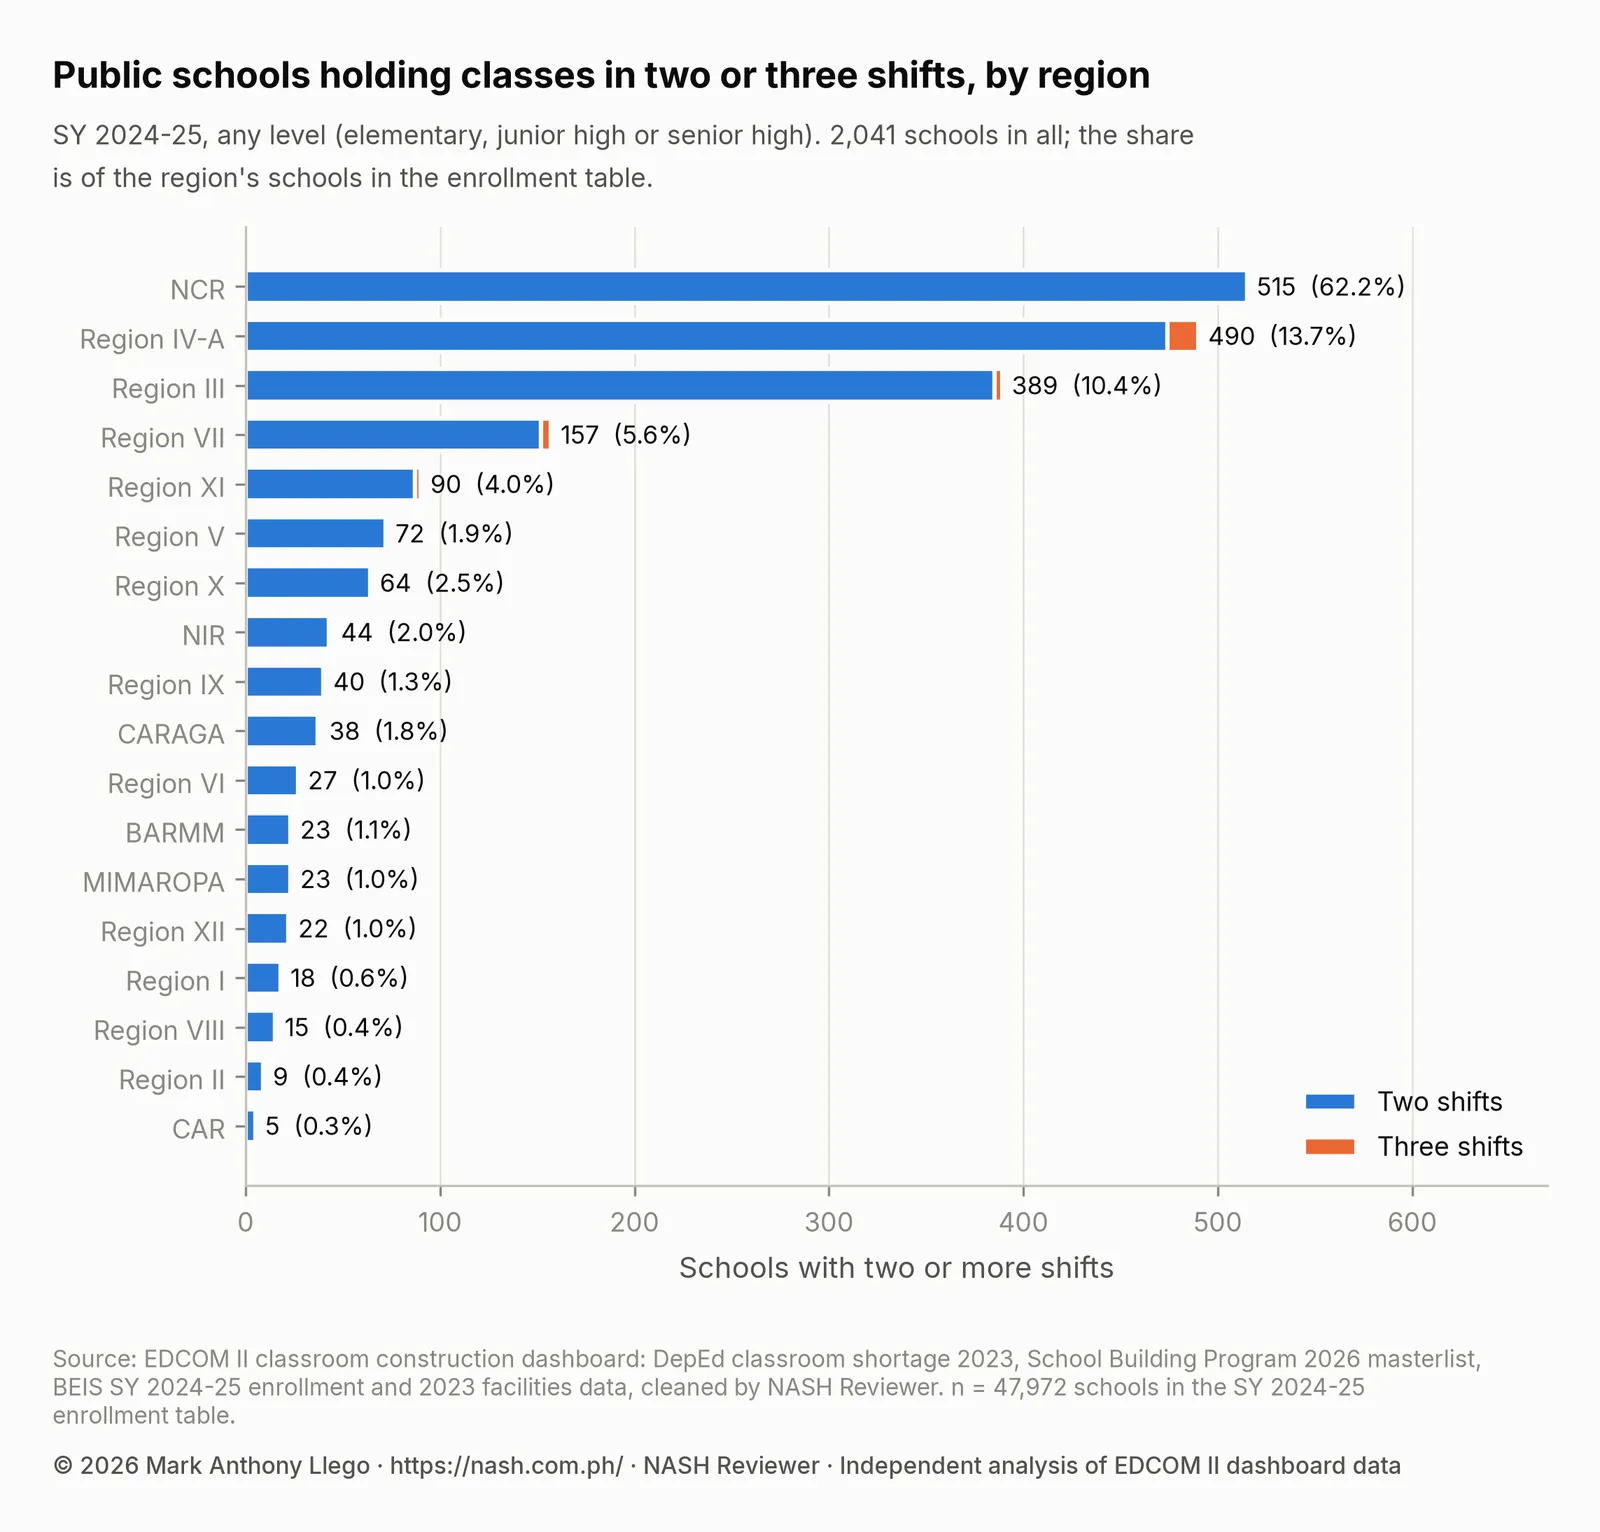
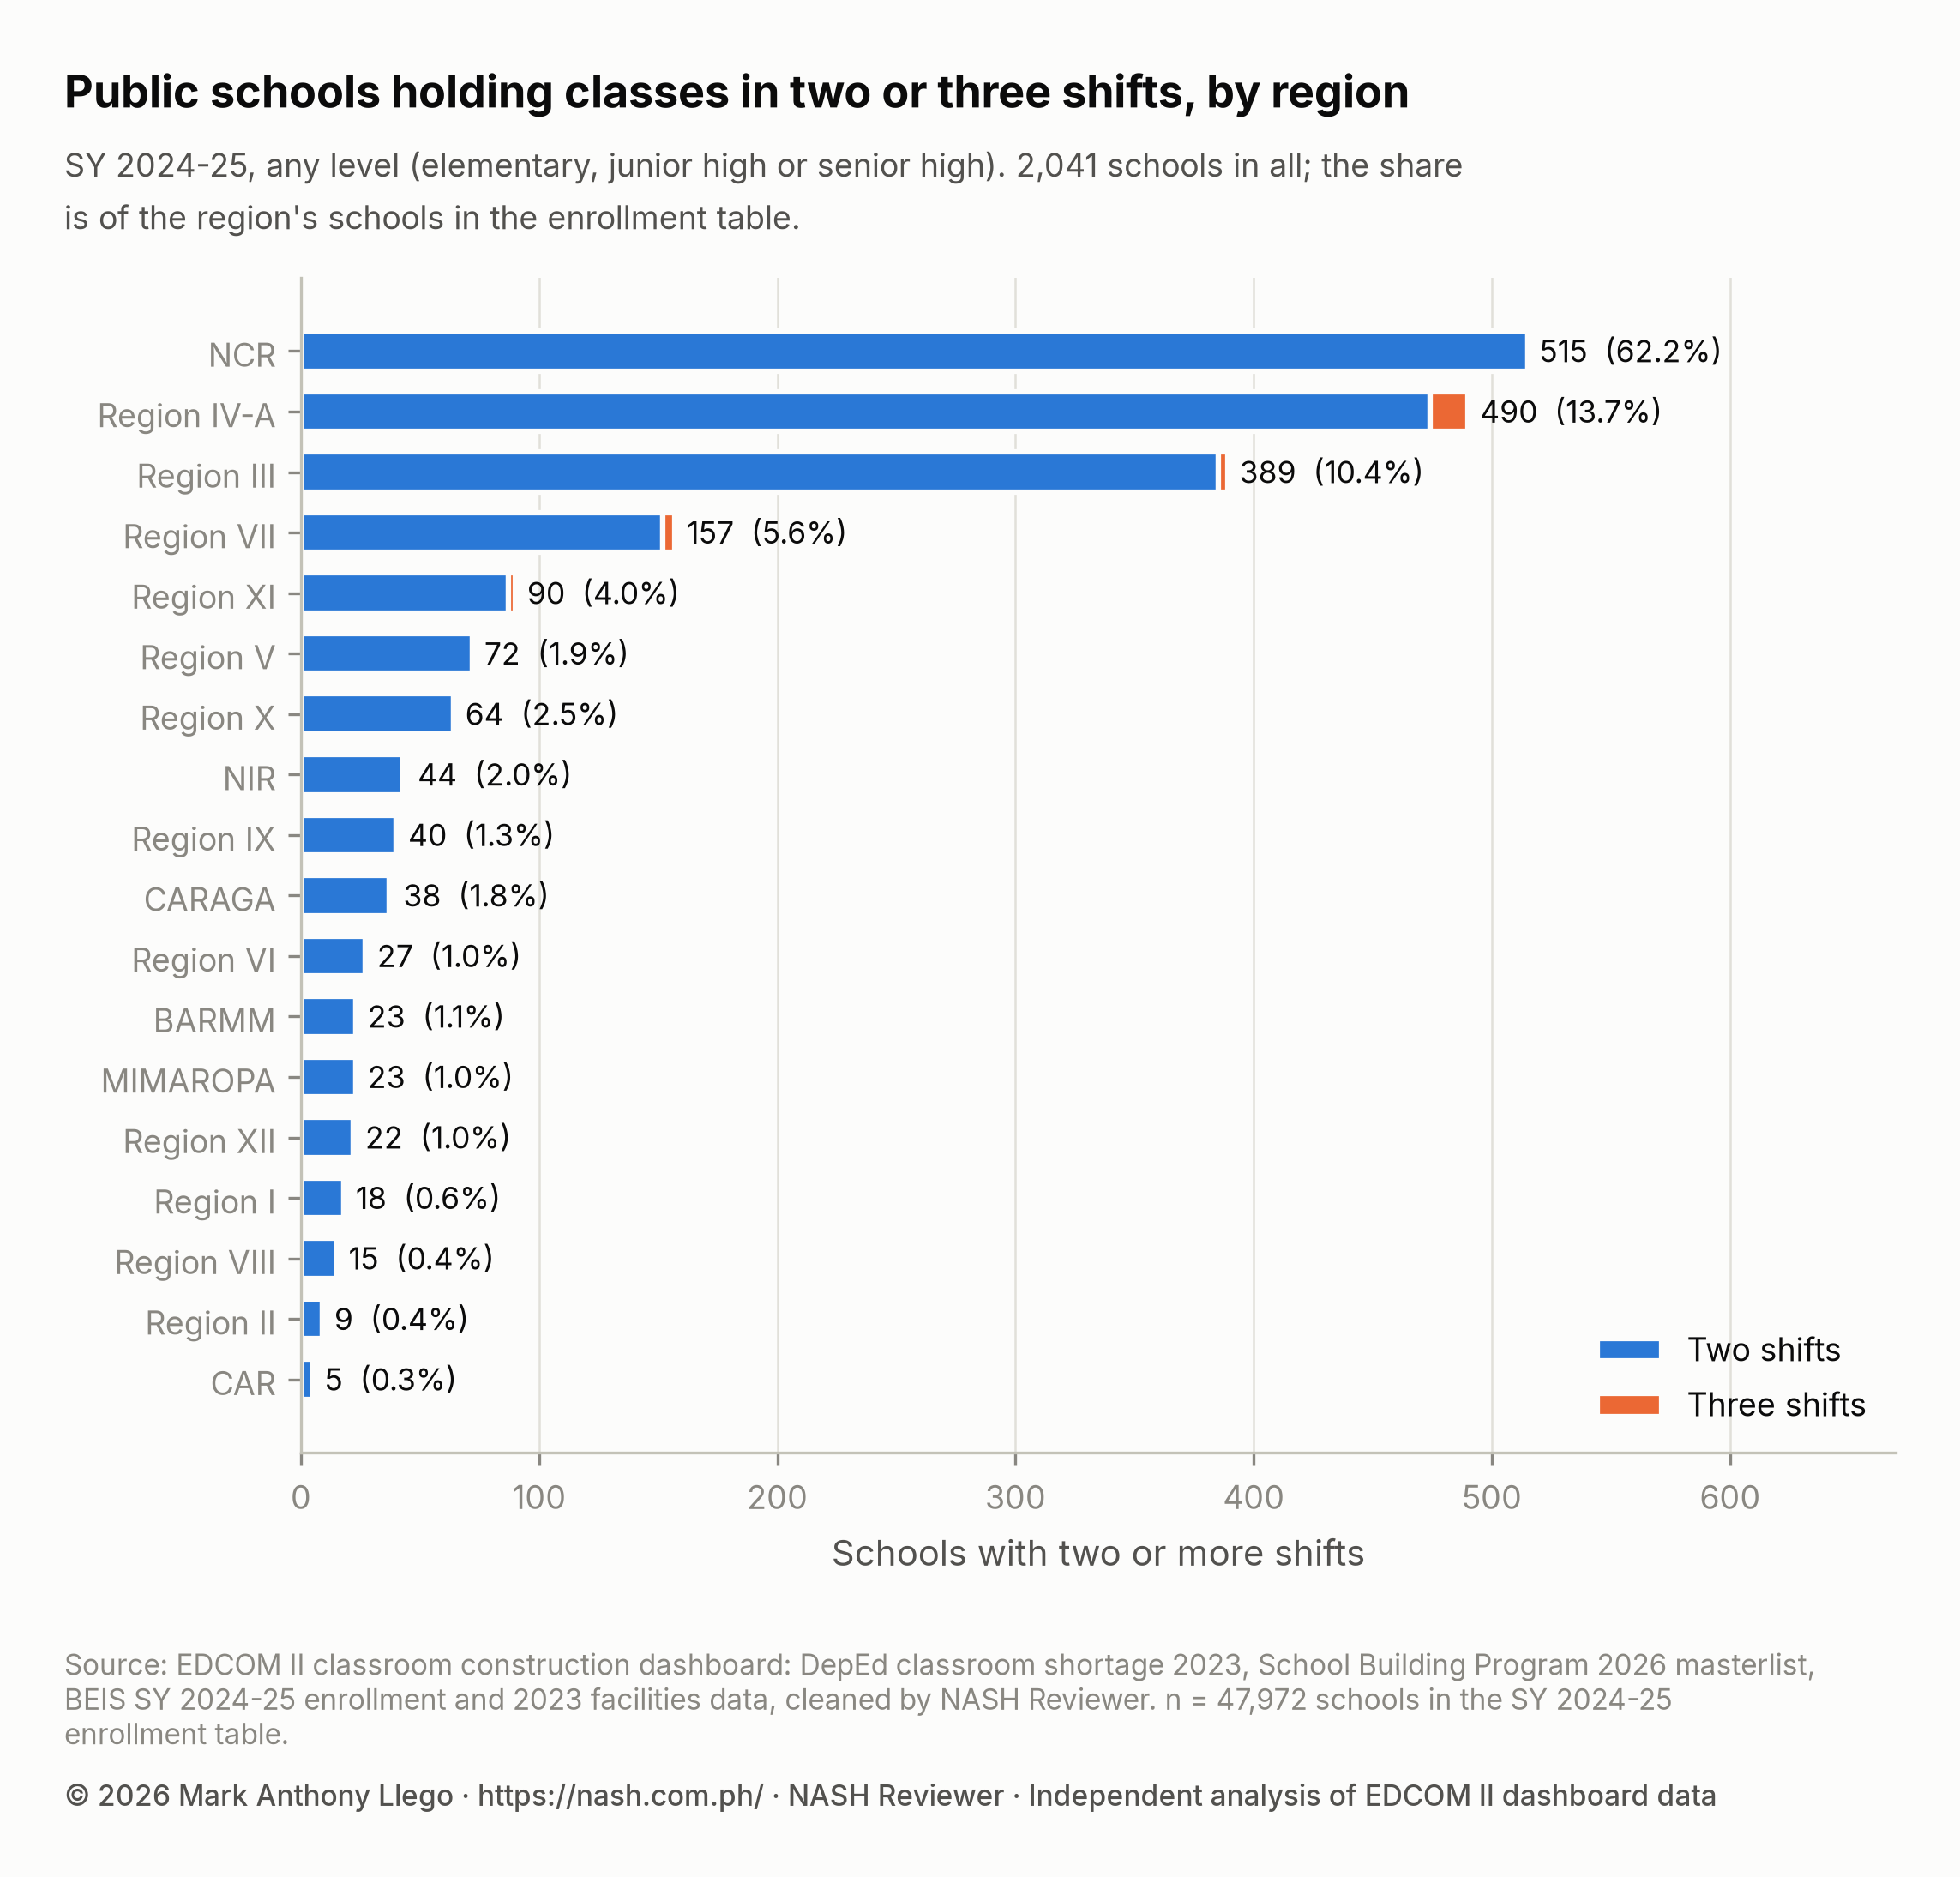
NCR has 515 schools on shifts, 62.2% of its 828 schools, all of them on double shifts. Region IV-A has 490 (13.7%) and Region III 389 (10.4%). Region VII (157) and Region XI (90) follow; in every other region, 2.5% of schools or fewer run shifts, down to 5 schools in CAR. Region IV-A also has 16 of the 30 triple-shift schools.
Counts and shares tell different stories: Region V’s 72 shift schools are only 1.9% of its 3,874 schools. Sulu is counted in Region IX, since its schools division moved from BARMM to DepEd Region IX on 20 October 2026; the source data predate the move.
| Region | Schools | Two shifts | Three shifts | Schools with two or more shifts | Share of the region’s schools |
|---|---|---|---|---|---|
| NCR | 828 | 515 | 0 | 515 | 62.2% |
| Region IV-A | 3,575 | 474 | 16 | 490 | 13.7% |
| Region III | 3,743 | 385 | 4 | 389 | 10.4% |
| Region VII | 2,828 | 152 | 5 | 157 | 5.6% |
| Region XI | 2,227 | 87 | 3 | 90 | 4.0% |
| Region V | 3,874 | 72 | 0 | 72 | 1.9% |
| Region X | 2,536 | 64 | 0 | 64 | 2.5% |
| NIR | 2,242 | 43 | 1 | 44 | 2.0% |
| Region IX | 3,010 | 40 | 0 | 40 | 1.3% |
| CARAGA | 2,104 | 37 | 1 | 38 | 1.8% |
| Region VI | 2,836 | 27 | 0 | 27 | 1.0% |
| MIMAROPA | 2,393 | 23 | 0 | 23 | 1.0% |
| BARMM | 2,169 | 23 | 0 | 23 | 1.1% |
| Region XII | 2,164 | 22 | 0 | 22 | 1.0% |
| Region I | 2,865 | 18 | 0 | 18 | 0.6% |
| Region VIII | 4,191 | 15 | 0 | 15 | 0.4% |
| Region II | 2,544 | 9 | 0 | 9 | 0.4% |
| CAR | 1,843 | 5 | 0 | 5 | 0.3% |
Philippine Classroom Shortage 2023: Where the Gap Is maps the shortage by region, and Last Mile Schools: Classroom Need and 2026 Allocation shows that the small, remote schools it covers rarely hold shifts.
Learners per classroom by level
Large classes are the other sign of too few rooms. Crowding here is learners per instructional classroom: a school’s SY 2024-25 enrollment at a level divided by its 2023 instructional classrooms for that level. A library or a faculty room does not count.
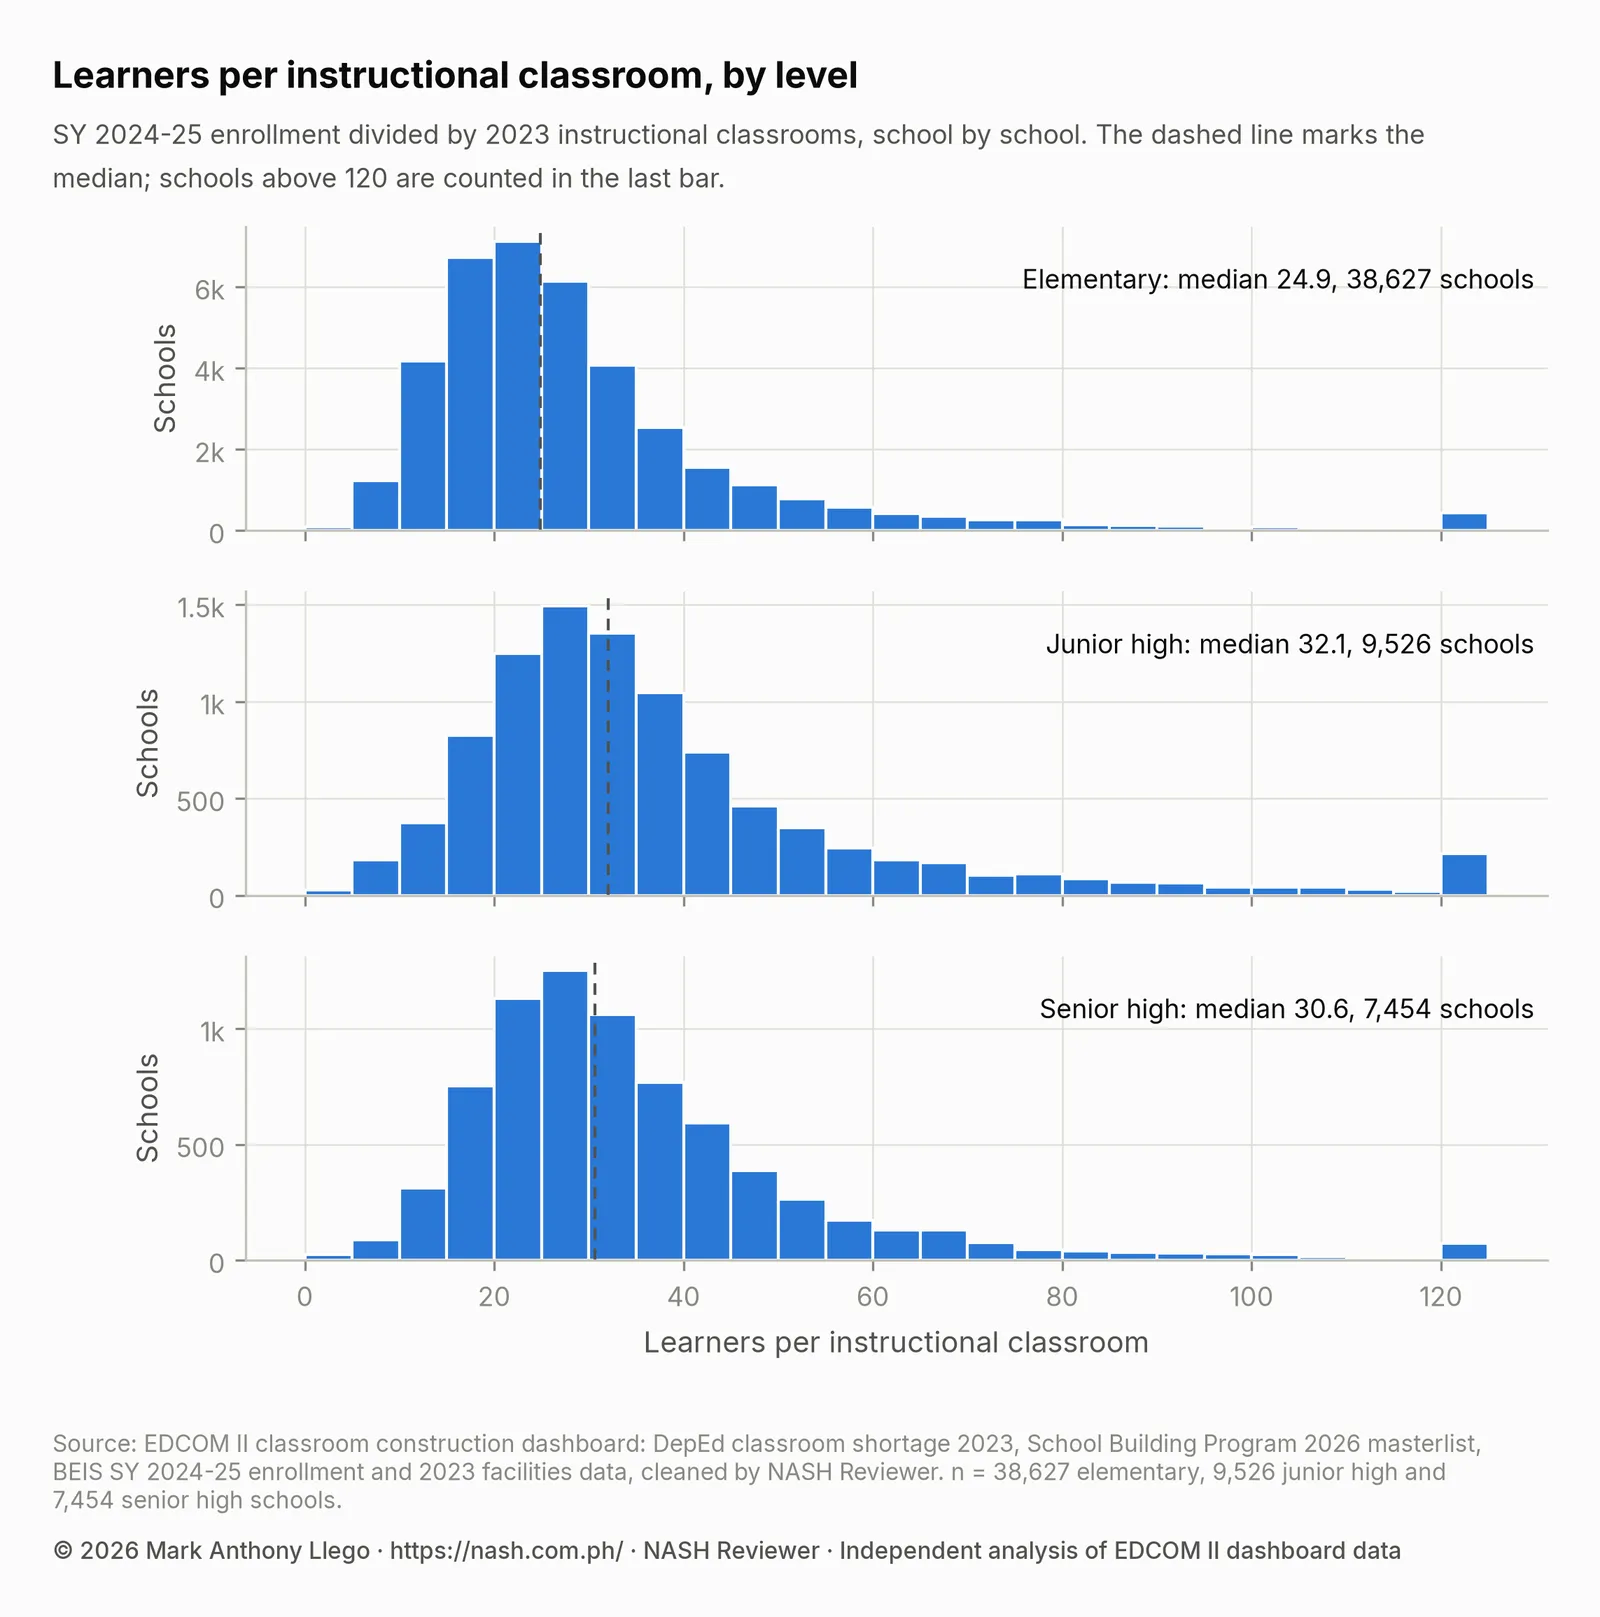
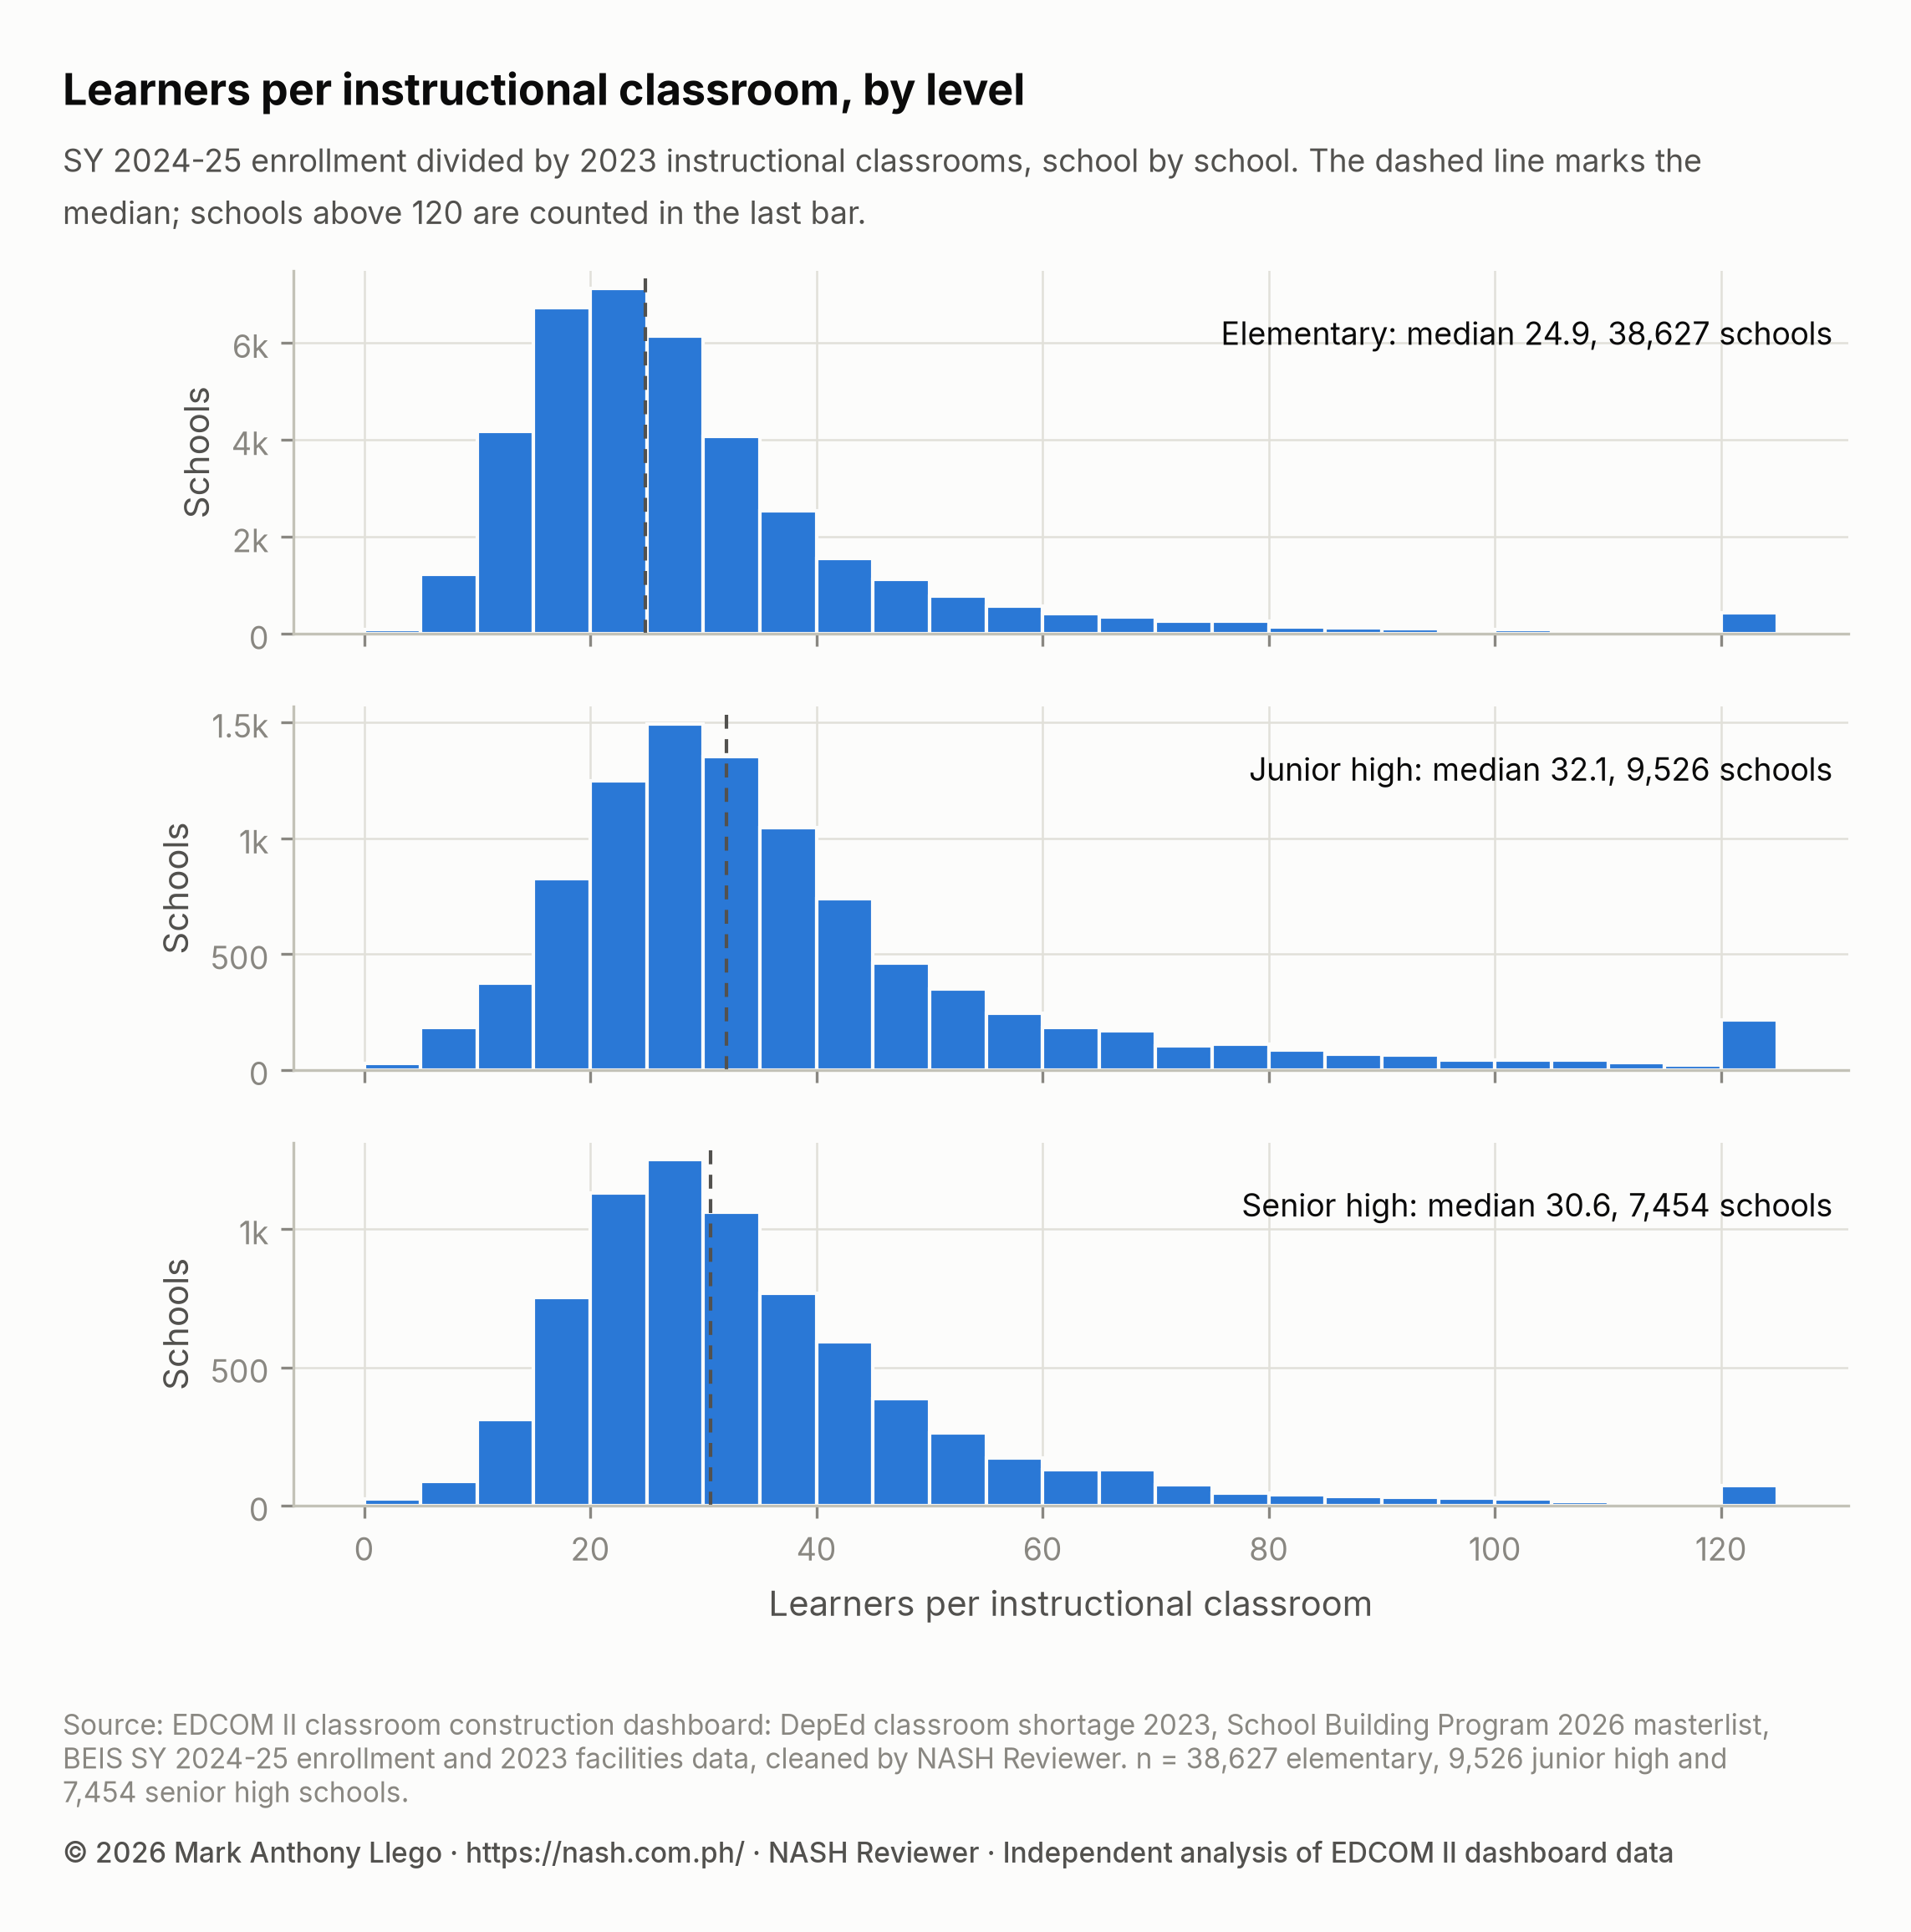
The median elementary school has 24.9 learners per classroom, with the middle half of schools between 18.0 and 34.0. Junior high is more crowded, at a median of 32.1 (middle half 23.9 to 43.7), and senior high sits between, at 30.6 (23.0 to 41.3). The tails are long: a tenth of junior high schools have more than 66.5 learners per classroom.
More than 45 learners per classroom is common in high schools: 23.3% of junior high and 19.4% of senior high schools are above it, against 12.7% of elementary schools. Across all levels, the median school has 26.1 learners per classroom, and 14.3% of schools are above 45. DepEd Classroom and School Building Data, SY 2023-2024 gives DepEd’s own ratio from an earlier file.
Schools above 50 learners per classroom
Across all levels, 5,177 schools have more than 50 learners per classroom. They enroll 5,824,827 learners, 26.2% of the learners counted in the ratio. To bring each down to 50, divide its learners by 50, round up to a whole classroom, and subtract the classrooms it has. Summed over the 5,177 schools, that gives 36,387 classrooms. It is a floor, not a target: 50 is the line EDCOM II uses for congestion, not a comfortable class size.
EDCOM II’s 20 October 2026 release estimates that 68,147 additional classrooms are needed to address congestion in 4,492 schools with more than 50 learners per classroom (SY 2024-2025 and SY 2023-2024 data), without giving its formula. Different room years, school lists and perhaps target ratios mean neither estimate corrects the other.
Ratios that are data errors
The highest ratio is 1,470.0 learners per classroom, which no room holds; it most likely reflects an incomplete room count or a school that grew or merged after 2023. The cleaned data flag such cases with a modified z-score (Iglewicz & Hoaglin, 1993): how far a school’s ratio sits from the median, in units of the typical distance from the median. It is computed on logarithms, so three times the median and a third of it count as equally far. Scores beyond 3.5 either way are flagged: 454 elementary, 172 junior high and 78 senior high ratios. Flagged schools are kept, since medians resist a few extreme values.
Schools with shifts are the most crowded
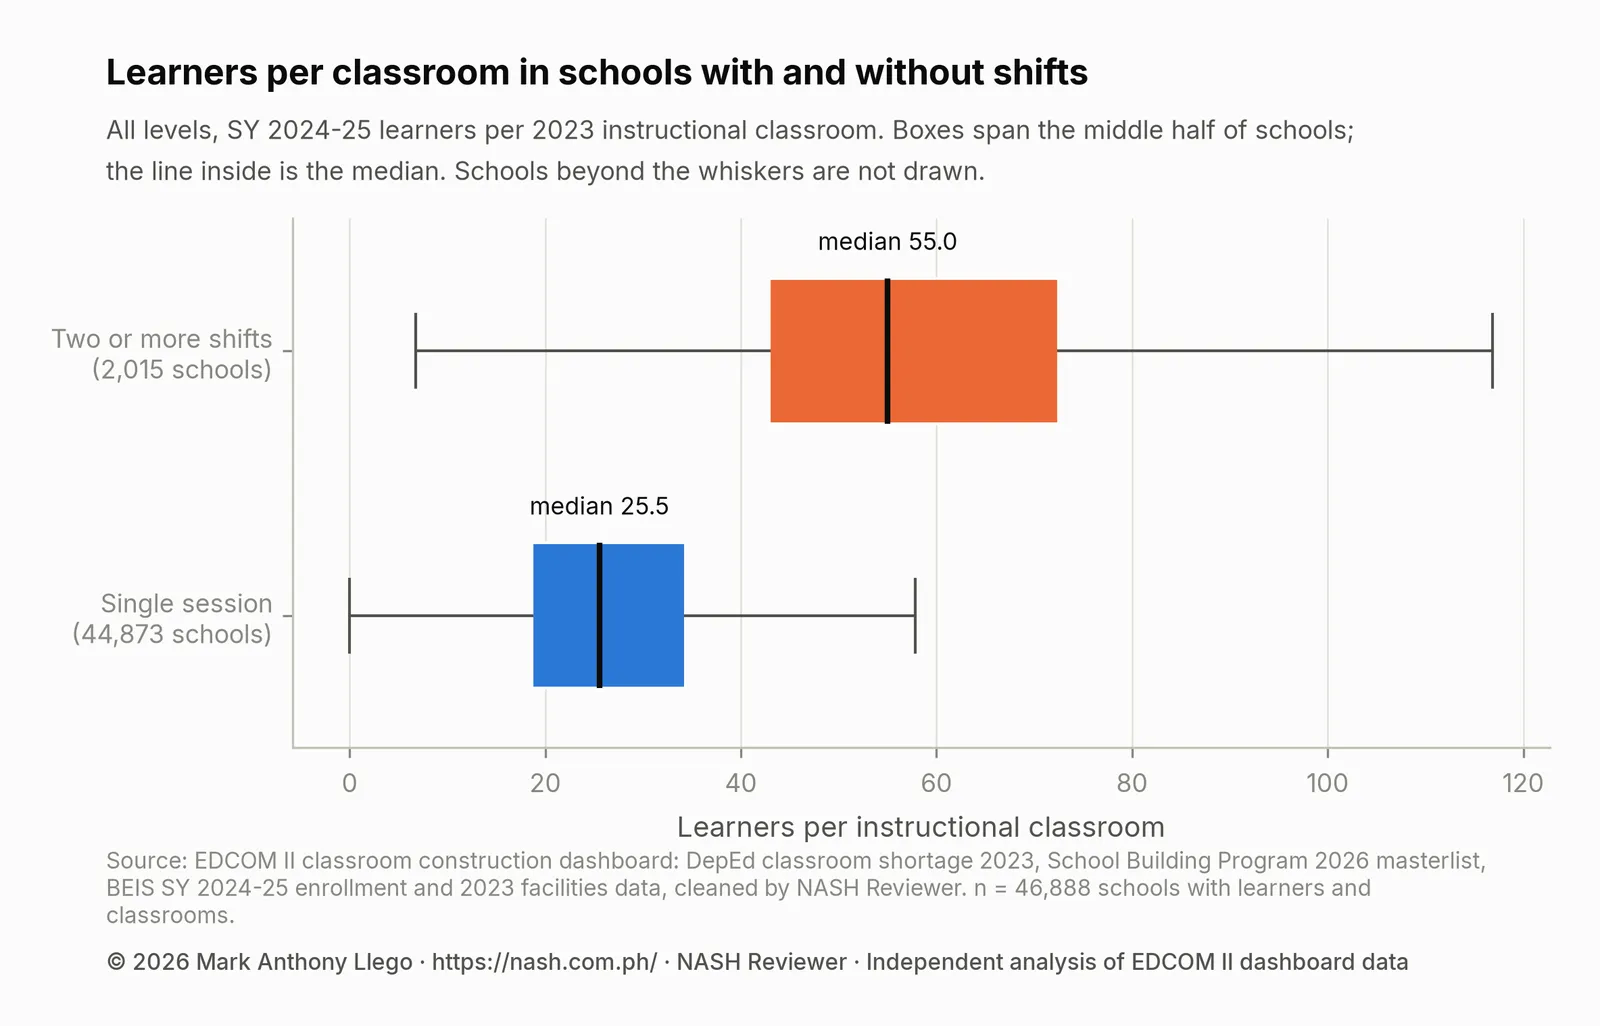
The median school on shifts has 55.0 learners per instructional classroom; the median single-session school has 25.5. The boxes do not overlap: a shift school at the lower edge of its box is still more crowded than a single-session school at the upper edge of its own. The ratio measures pressure on rooms, not class size: on two shifts, each room serves two sets of classes, so a ratio of 55.0 can mean classes of about half that size.
Is the gap more than chance? The Mann-Whitney U test (Mann & Whitney, 1947) ranks all 46,888 schools from least to most crowded, without assuming a bell curve, and asks whether shift schools rank higher than chance would place them. They do (p < 0.001). With this many schools, the size of the difference matters more. The rank-biserial correlation (Kerby, 2014) pairs every shift school with every single-session school and subtracts the share of pairs in which the shift school is less crowded from the share in which it is more crowded. It runs from −1 to 1, with 0 meaning no difference; here it is 0.76, a large effect by common conventions (Tomczak & Tomczak, 2014).
The comparison is unadjusted. The median shift school enrolls 1,746 learners, against 215 for other schools, and these data cannot say whether size, shifts or crowding drives the others.
Shift schools in the 2023 shortage and the 2026 School Building Program
DepEd’s 2023 classroom shortage, as published in the EDCOM II classroom construction dashboard, tells the same story. The table compares the shift schools and other schools found in both the enrollment table and the shortage data.
| Measure | Schools with two or more shifts | Other schools |
|---|---|---|
| Schools compared | 2,021 | 45,503 |
| Median enrollment, SY 2024-25 | 1,746 | 215 |
| Report a classroom shortage, 2023 | 93.0% | 52.5% |
| Median shortage of schools with one (classrooms) | 20.0 | 2.8 |
| Total shortage, 2023 (classrooms) | 55,596 | 109,499 |
| Receive any SBP 2026 classrooms | 26.2% | 10.1% |
| SBP 2026 classrooms | 9,433 | 22,448 |
| SBP classrooms as a share of the shortage | 17.0% | 20.5% |
Only 142 shift schools report no shortage. Shift schools hold 55,596 classrooms of shortage, 33.7% of the shortage at the schools compared, though they are fewer than one in twenty of those schools. That total is close to EDCOM II’s 52,871 classrooms to end shifting in 1,889 schools, but the two are computed differently.
Who gets SBP 2026 classrooms
Divide the share of shift schools that receive any SBP classroom (26.2%) by the share of other schools that do (10.1%), and the result is a risk ratio of 2.59: shift schools are more than two and a half times as likely to be on the list. Its 95% confidence interval, computed on the log scale (Katz et al., 1978), runs from 2.40 to 2.80. On paper, the program leans toward shift schools.
Yet most shift schools get nothing. In all, 1,491 receive no SBP classroom, and they carry 38,384 classrooms of the 2023 shortage. The 9,433 SBP classrooms that go to shift schools cover 17.0% of their shortage, against 20.5% for other schools. Part of the allocation is also far from built: the SBP includes PSIP III, the third Public-Private Partnership for School Infrastructure Project, still for bidding, with construction expected from March 2027 to July 2028. DepEd School Building Program 2026 in Numbers describes the program, and Do 2026 Classrooms Go Where the Shortage Is? tests the allocation against need.
Crowding and the shortage do not always agree
Across 46,740 schools, the Spearman rank correlation (Spearman, 1904) between learners per classroom and the 2023 shortage per 100 learners is 0.40 (95% interval 0.36 to 0.44). It compares ranks rather than values, so a few extreme schools cannot dominate it; 0.40 means the two rankings agree moderately, far from perfectly.
Of the schools above 50 learners per classroom, 396 (7.7%) report no shortage in 2023. Different years, DepEd’s shortage formula (which the dashboard data do not document) and errors in either source may each play a part. Because the SBP is planned against the shortage, such schools are worth raising with the division.
What this means for school heads
- Report shifts exactly in BEIS. If any grade runs two or three shifts, record it, and confirm three-shift entries when the division asks. Unreported shifts drop out of the counts behind national targets.
- Put your crowding figures in the SIP and the AIP. Divide your enrollment at each level by that level’s instructional classrooms and count the classrooms needed to reach 50 learners per room or fewer. Add what the national data cannot show: which grades shift, the hours of each shift and the size of each room. The situational analysis of a DepEd School Improvement Plan (SIP) needs these figures, and the Annual Implementation Plan (AIP) can track them; PPSSH Domain 2: Managing School Operations With DepEd Data shows how to use them.
- Protect learning time under shifts. Shifts can shorten class periods and push classes into early morning or late afternoon. The data do not record hours, so keep your own record, and schedule reading and remediation so shifted classes do not lose them first.
- Plan for safety at changeovers. Crowded gates at changeover, and learners traveling early or after dark, call for lighting, covered waiting areas, traffic aides and staggered dismissal; Brigada Eskwela, the barangay and the LGU can help.
- Check your school in the data. Find your school ID in the school table linked below and compare its shift status, learners per classroom, 2023 shortage and SBP 2026 allocation. If a crowded school shows no shortage, raise it with the division planning office; if a shift school has no SBP classroom, take its figures to the local school board. How to Read DepEd Data: A Guide for Aspiring School Heads helps.
- Read allocations as plans, not rooms. A PSIP III line still for bidding is a planned classroom; keep the crowding figures in your plan until rooms are handed over.
How these numbers were made
Data. The schools table of the cleaned EDCOM II classroom data, version 1 (Llego, 2026), joins the BEIS enrollment and class shifts for SY 2024-25 (47,972 schools, 22,543,711 learners), the 2023 facilities data and shortage, and the SBP 2026 masterlist on each school’s current ID.
Shift schools. The highest number of shifts for each level (es_highest_shift, jhs_highest_shift, shs_highest_shift) is 0, 2 or 3; a shift school (multi_shift) records 2 or more at any level. Level shares are over schools with a value at that level; the regional table counts each school once.
Learners per instructional classroom. By level, SY 2024-25 enrollment divided by the level’s 2023 instructional classrooms, for schools with at least one. For all levels, the dashboard’s overall ratio (learners_per_classroom_all): learners of the levels that have classrooms divided by all instructional classrooms. Classrooms to reach 50: for each school above 50, its learners divided by 50, rounded up, minus its classrooms, summed.
Outlier flags. The logarithm of each ratio minus the median logarithm, divided by the median absolute deviation and scaled to match an ordinary z-score; flagged above 3.5 in absolute value (Iglewicz & Hoaglin, 1993).
Comparisons. A two-sided Mann-Whitney U test on the overall ratio of 2,015 shift and 44,873 single-session schools; the rank-biserial correlation is twice U divided by the product of the group sizes, minus one (Kerby, 2014). Shortage and allocation use the 2,021 shift and 45,503 other schools in both the enrollment and shortage data. A school receives SBP classrooms when the masterlist gives it at least one, counting lines funded under the 2026 General Appropriations Act, Learning Continuity Spaces and PSIP III. The risk ratio has a Katz log interval (Katz et al., 1978). The Spearman interval is the percentile interval of 500 bootstrap samples that draw whole divisions with replacement (Efron & Tibshirani, 1993; Cameron & Miller, 2015).
Software and checks. Python with pandas, NumPy and SciPy; charts in matplotlib. The cleaned data reproduce the dashboard’s totals exactly (165,442.67 classrooms of shortage, 32,419 SBP classrooms). Every number here comes from the analysis output in the download below.
Limits
The years differ. Learners are from SY 2024-25, classrooms and the shortage from 2023, allocations from 2026; a school that added rooms after 2023 looks more crowded than it is.
The shift data are coarse. They give the highest number of shifts per level, not which grades shift, how many learners attend a shift or how many hours each shift gets. Some three-shift entries were still pending confirmation.
Ratios are not class sizes. The ratio ignores room size and condition. Schools without a usable room count are left out (the overall ratio covers 46,888 of the 47,972 schools), and some ratios are errors.
The shortage is DepEd’s own 2023 estimate, and the dashboard data do not include its formula.
Allocations are plans. PSIP III is still for bidding, and 103 PSIP III lines that exactly repeat an earlier line, with 1,554 classrooms, are kept as the dashboard keeps them.
Association, not causation. Shift schools are much larger than others and concentrated in a few regions; the comparisons do not adjust for size or location.
Frequently asked questions
How many DepEd schools have double or triple shifts?
In SY 2024-25, 2,041 public schools ran two or more shifts at some level, 4.3% of the 47,972 schools in DepEd’s enrollment table: 2,011 on double shifts and 30 on triple shifts. EDCOM II’s 20 October 2026 news release counts 1,889; the definitions and dates differ.
Which region has the most schools with class shifts?
NCR, with 515 schools on shifts, or 62.2% of its schools. Region IV-A has 490 (13.7%) and Region III 389 (10.4%); together the three hold 68.3% of all schools on shifts.
How many learners are there per classroom in DepEd schools?
Dividing SY 2024-25 enrollment by 2023 instructional classrooms, the median school has 24.9 learners per classroom in elementary, 32.1 in junior high and 30.6 in senior high. Across all levels, 5,177 schools have more than 50, and schools on shifts have a median of 55.0.
Do schools with class shifts get new classrooms in 2026?
Some do. Under the School Building Program 2026, 26.2% of shift schools are allocated at least one classroom, against 10.1% of other schools. But 1,491 shift schools receive none, with a combined 2023 shortage of 38,384 classrooms, and allocations are plans, not finished rooms.
Download the data and cite this post
The cleaned EDCOM II classroom data behind this series are free to download for personal study; to reuse them, email support@nash.com.ph for written permission first. How the EDCOM Classroom Data Was Cleaned explains every table and cleaning rule. The files are at data.nash.com.ph: start with the README, then the school table (Parquet, or CSV), the School Building Program lines (CSV), the city and municipality table (CSV), and every table for Stata and SPSS. Every figure quoted in this series, with the data behind each chart, is in analysis_tables.zip.
Every file, with its rows, columns and checksum, is listed on the EDCOM II classroom data page. To cite the data: Llego, M. A. (2026). EDCOM II classroom construction dashboard data, cleaned, version 1.1. NASH Reviewer. https://nash.com.ph/edcom-classroom-data
To cite this post: Llego, M. A. (2026, October 28). Class shifts and crowded classrooms in DepEd schools. NASH Reviewer Blog. https://nash.com.ph/blog/class-shifting-crowded-classrooms
References
Cameron, A. C., & Miller, D. L. (2015). A practitioner’s guide to cluster-robust inference. Journal of Human Resources, 50(2), 317–372.
Efron, B., & Tibshirani, R. J. (1993). An introduction to the bootstrap. Chapman & Hall.
Iglewicz, B., & Hoaglin, D. C. (1993). How to detect and handle outliers. ASQC Quality Press.
Katz, D., Baptista, J., Azen, S. P., & Pike, M. C. (1978). Obtaining confidence intervals for the risk ratio in cohort studies. Biometrics, 34(3), 469–474.
Kerby, D. S. (2014). The simple difference formula: An approach to teaching nonparametric correlation. Comprehensive Psychology, 3.
Llego, M. A. (2026). EDCOM II classroom construction dashboard data, cleaned, version 1.1 [Data set]. NASH Reviewer. https://nash.com.ph/edcom-classroom-data
Mann, H. B., & Whitney, D. R. (1947). On a test of whether one of two random variables is stochastically larger than the other. Annals of Mathematical Statistics, 18(1), 50–60.
Second Congressional Commission on Education (EDCOM II). (2026, October 20). Put classrooms where they’re needed most, EDCOM 2 tells DepEd [News release]. https://edcom2.gov.ph/put-classrooms-where-theyre-needed-most-edcom-2-tells-deped/
Second Congressional Commission on Education (EDCOM II). (2026). National Education Plan 2026–2035 (Year Three report).
Spearman, C. (1904). The proof and measurement of association between two things. American Journal of Psychology, 15(1), 72–101.
Tomczak, M., & Tomczak, E. (2014). The need to report effect size estimates revisited. Trends in Sport Sciences, 21(1), 19–25.
More in this series
- How the EDCOM Classroom Data Was Cleaned
- Philippine Classroom Shortage 2023: Where the Gap Is
- DepEd School Building Program 2026 in Numbers
- Do 2026 Classrooms Go Where the Shortage Is?
- Classroom Allocation by LGU Income Class, 2026
- Class Shifts and Crowded Classrooms in DepEd Schools
- Last Mile Schools: Classroom Need and 2026 Allocation
- Regional reports: NCR, CAR, Region I, Region II, Region III, Region IV-A, MIMAROPA, Region V, Region VI, NIR, Region VII, Region VIII, Region IX, Region X, Region XI, Region XII, Caraga, BARMM
- Rankings and deep dives: Congressional districts, Top 20 cities and municipalities, Rizal, Quezon City, City of Manila, Tawi-Tawi, Cavite, Cost of a classroom
- Explainers: PSIP III, Senior high shortage, Junior high shortage, Excess classrooms, Learning Continuity Spaces, How learners reach school
- For teachers and school heads: Action research and thesis topics
- Related: DepEd Classroom and School Building Data, SY 2023-2024, DepEd Enrollment SY 2024-2025: Smallest Kindergarten Class, EDCOM II Final Report: Guide for Aspiring School Heads, National Education Plan 2026-2035: Guide for School Heads, DepEd School Improvement Plan (SIP): Steps, AIP and SRC, PPSSH Domain 2: Managing School Operations With DepEd Data, How to Read DepEd Data: A Guide for Aspiring School Heads
Analysis and charts by Mark Anthony Llego for NASH Reviewer. Data: EDCOM II classroom construction dashboard and Department of Education data. NASH Reviewer is not affiliated with EDCOM II or DepEd. Charts may be reused only with written permission from support@nash.com.ph.