Partly. The classrooms planned under the School Building Program (SBP) 2026 lean toward schools with larger shortages, but loosely. School by school, 53.0% of the 32,419 SBP classrooms fall within the receiving school’s own 2023 shortage, 22.5% go beyond it, 23.0% go to schools that reported no shortage and 1.6% go to schools not in the shortage table. Only 13.3% of the 25,823 schools with a shortage receive any SBP classroom, and those schools hold 21.6% of the shortage. Measured with a concentration index, the classrooms are about 54.0% as concentrated among high-shortage schools as the shortage itself.
The data are DepEd’s 2023 classroom shortage, as published in the EDCOM II classroom construction dashboard, and the SBP 2026 masterlist from the same dashboard, cleaned as described in How the EDCOM Classroom Data Was Cleaned.
The post is written for school heads, aspiring school heads and teachers, including those who will cite it in a school improvement plan, a thesis or an action research paper. Read every figure as a 2026 plan set against a 2023 count: need can change, and allocations may weigh things these data do not hold.
Key findings
- School by school, 53.0% of the 32,419 SBP 2026 classrooms fall within the receiving school’s 2023 shortage, 22.5% go beyond it, 23.0% go to schools that reported no shortage and 1.6% to schools not in the shortage table.
- Only 13.3% of the 25,823 schools with a 2023 shortage receive any SBP classroom, and those schools hold 21.6% of the shortage.
- The school-by-school unmet shortage is 148,276 classrooms, more than the dashboard’s “Remaining Unfunded” figure of 133,024, which lets one school’s surplus offset another’s need.
- With schools ranked by shortage, the concentration index of SBP classrooms is 0.43 (95% interval 0.36 to 0.49), against 0.80 for the shortage itself: about 54.0% as concentrated as the need.
- The share of schools with any SBP classroom rises from 7.8% of schools with no shortage to 29.2% of schools short by more than 20 classrooms, so even among those schools most receive none.
- PSIP III lines follow the shortage most closely (concentration index 0.61) and DepEd’s own lines least (0.09).
- Of the 332 cities and municipalities with the largest shortages, 147 (44.3%) are among the 332 top recipients, close to EDCOM II’s 45.2%; 273 receive no SBP classroom despite 13,613 classrooms of shortage.
Where the 32,419 classrooms land, school by school
The SBP 2026 masterlist names 32,419 classrooms at 5,231 schools: 16,114 funded under the General Appropriations Act (GAA) 2026, and 16,305 under PSIP III, the third Public-Private Partnership for School Infrastructure Project, still for bidding, with construction expected from March 2027 to July 2028 (DepEd School Building Program 2026 in Numbers has the details). Set against each receiving school’s own 2023 shortage, the classrooms fall into four parts.
| Where the SBP 2026 classrooms land | Classrooms | Share |
|---|---|---|
| Within the receiving school’s 2023 shortage | 17,166 | 53.0% |
| Beyond the receiving school’s shortage | 7,284 | 22.5% |
| At schools with no 2023 shortage | 7,457 | 23.0% |
| At schools not in the 2023 shortage table | 512 | 1.6% |
| All SBP 2026 classrooms | 32,419 |
Of the 5,224 schools with at least one classroom counted (seven more on the masterlist have only lines with no classroom count), 3,430 had a 2023 shortage, 1,708 had none and 86 are not in the shortage table; 1,417 of the 3,430 receive more classrooms than their shortage. The 3,430 are 13.3% of the 25,823 schools with a shortage, and they hold 21.6% of the 165,443-classroom shortage.
The split also explains two measures of what remains. The dashboard’s “Remaining Unfunded” figure, 133,024, subtracts all SBP classrooms from the shortage, letting classrooms beyond one school’s need offset another school’s shortage and counting PSIP III classrooms still for bidding as allocated. Counted school by school, the unmet shortage is 148,276. The difference, 15,253, is the 14,741 classrooms beyond a school’s shortage or at schools with none, plus the 512 at schools not in the table (both totals are rounded to whole classrooms, so subtracting them gives one less). Likewise, classrooms within each school’s own shortage cover 10.4% of the 2023 shortage, against the dashboard’s coverage of 19.6%.
Concentration curve and index of the 2026 classrooms
Line up the 47,659 schools in the 2023 shortage table from the largest shortage to none, and follow two running totals: the share of the shortage counted so far and the share of SBP classrooms.
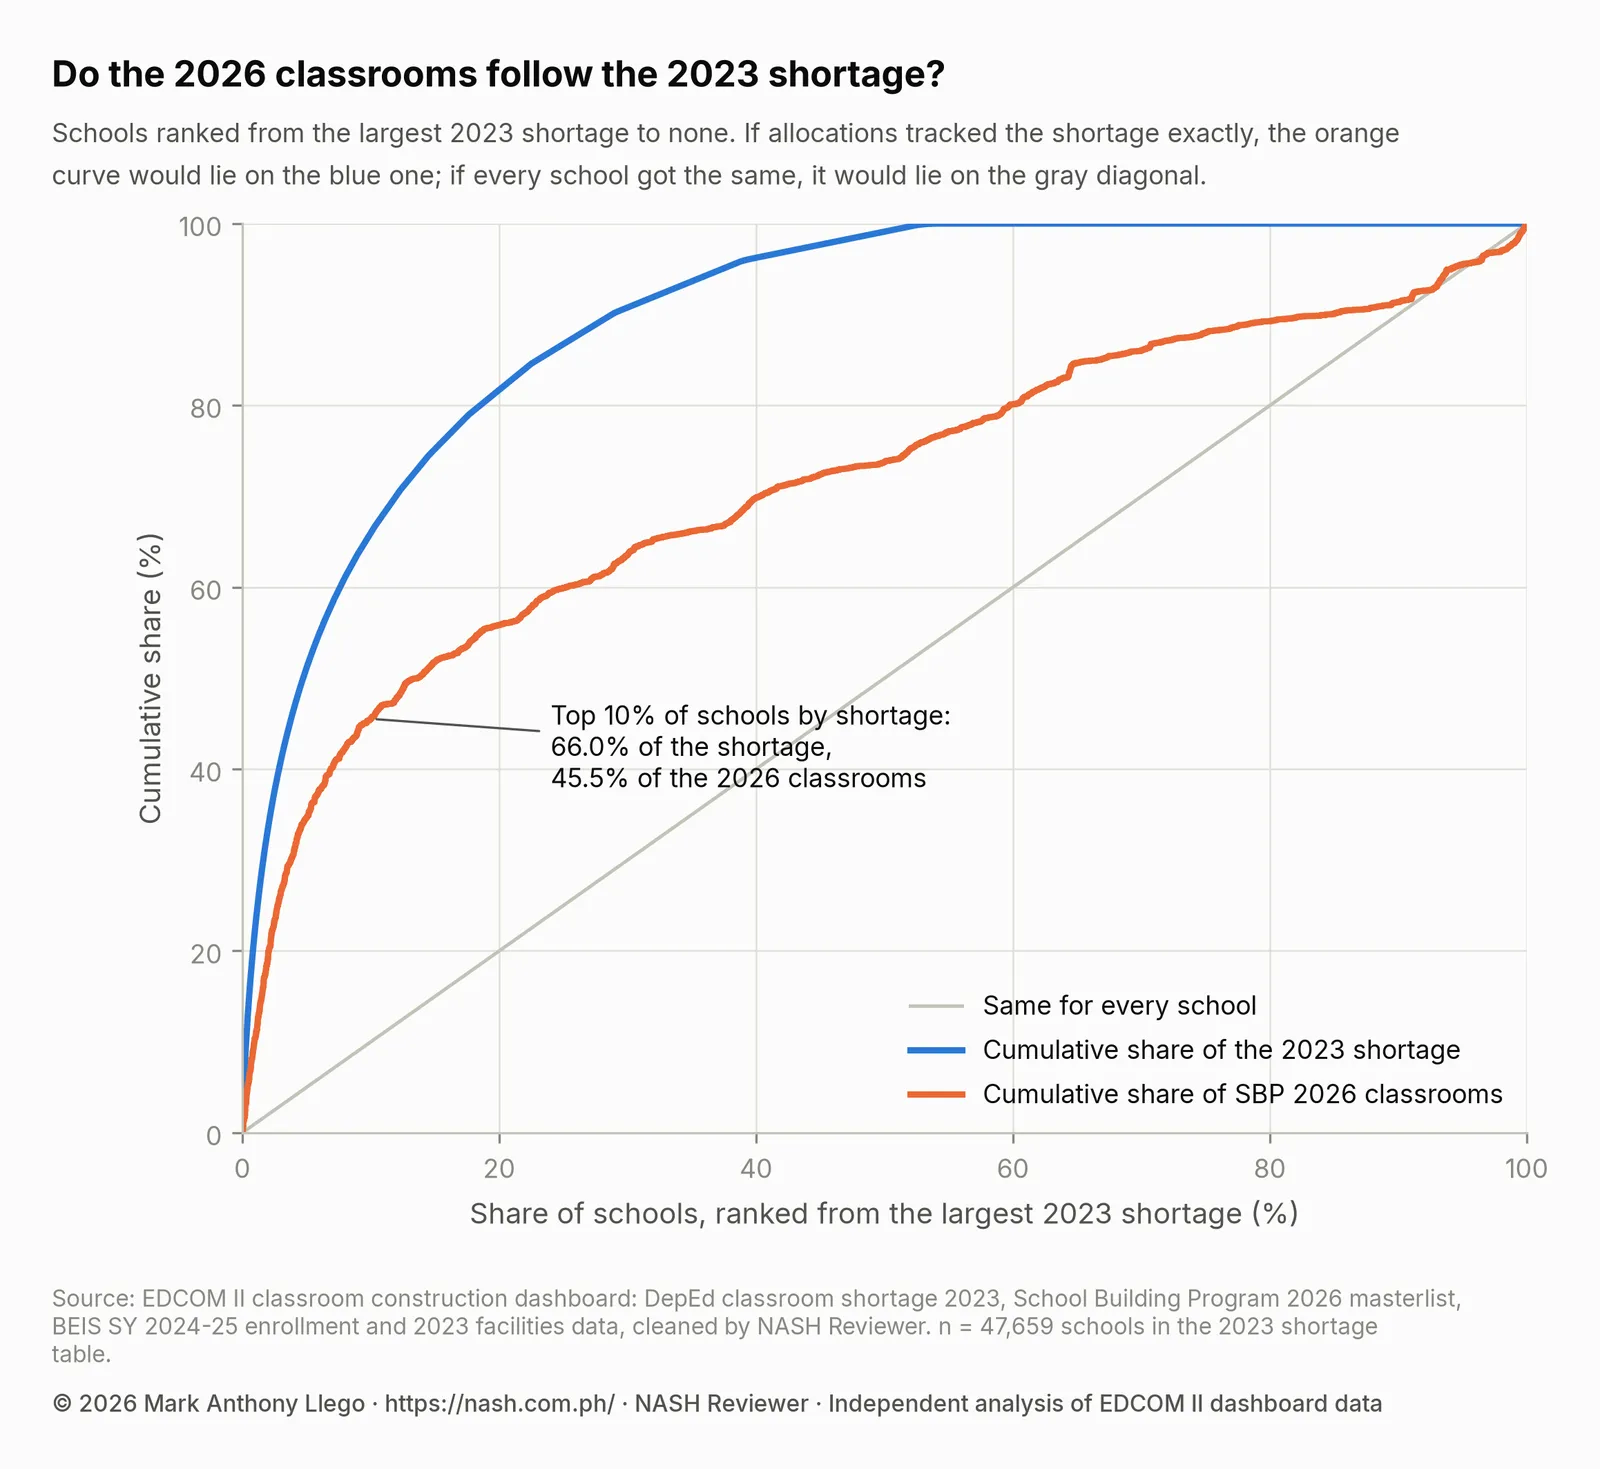
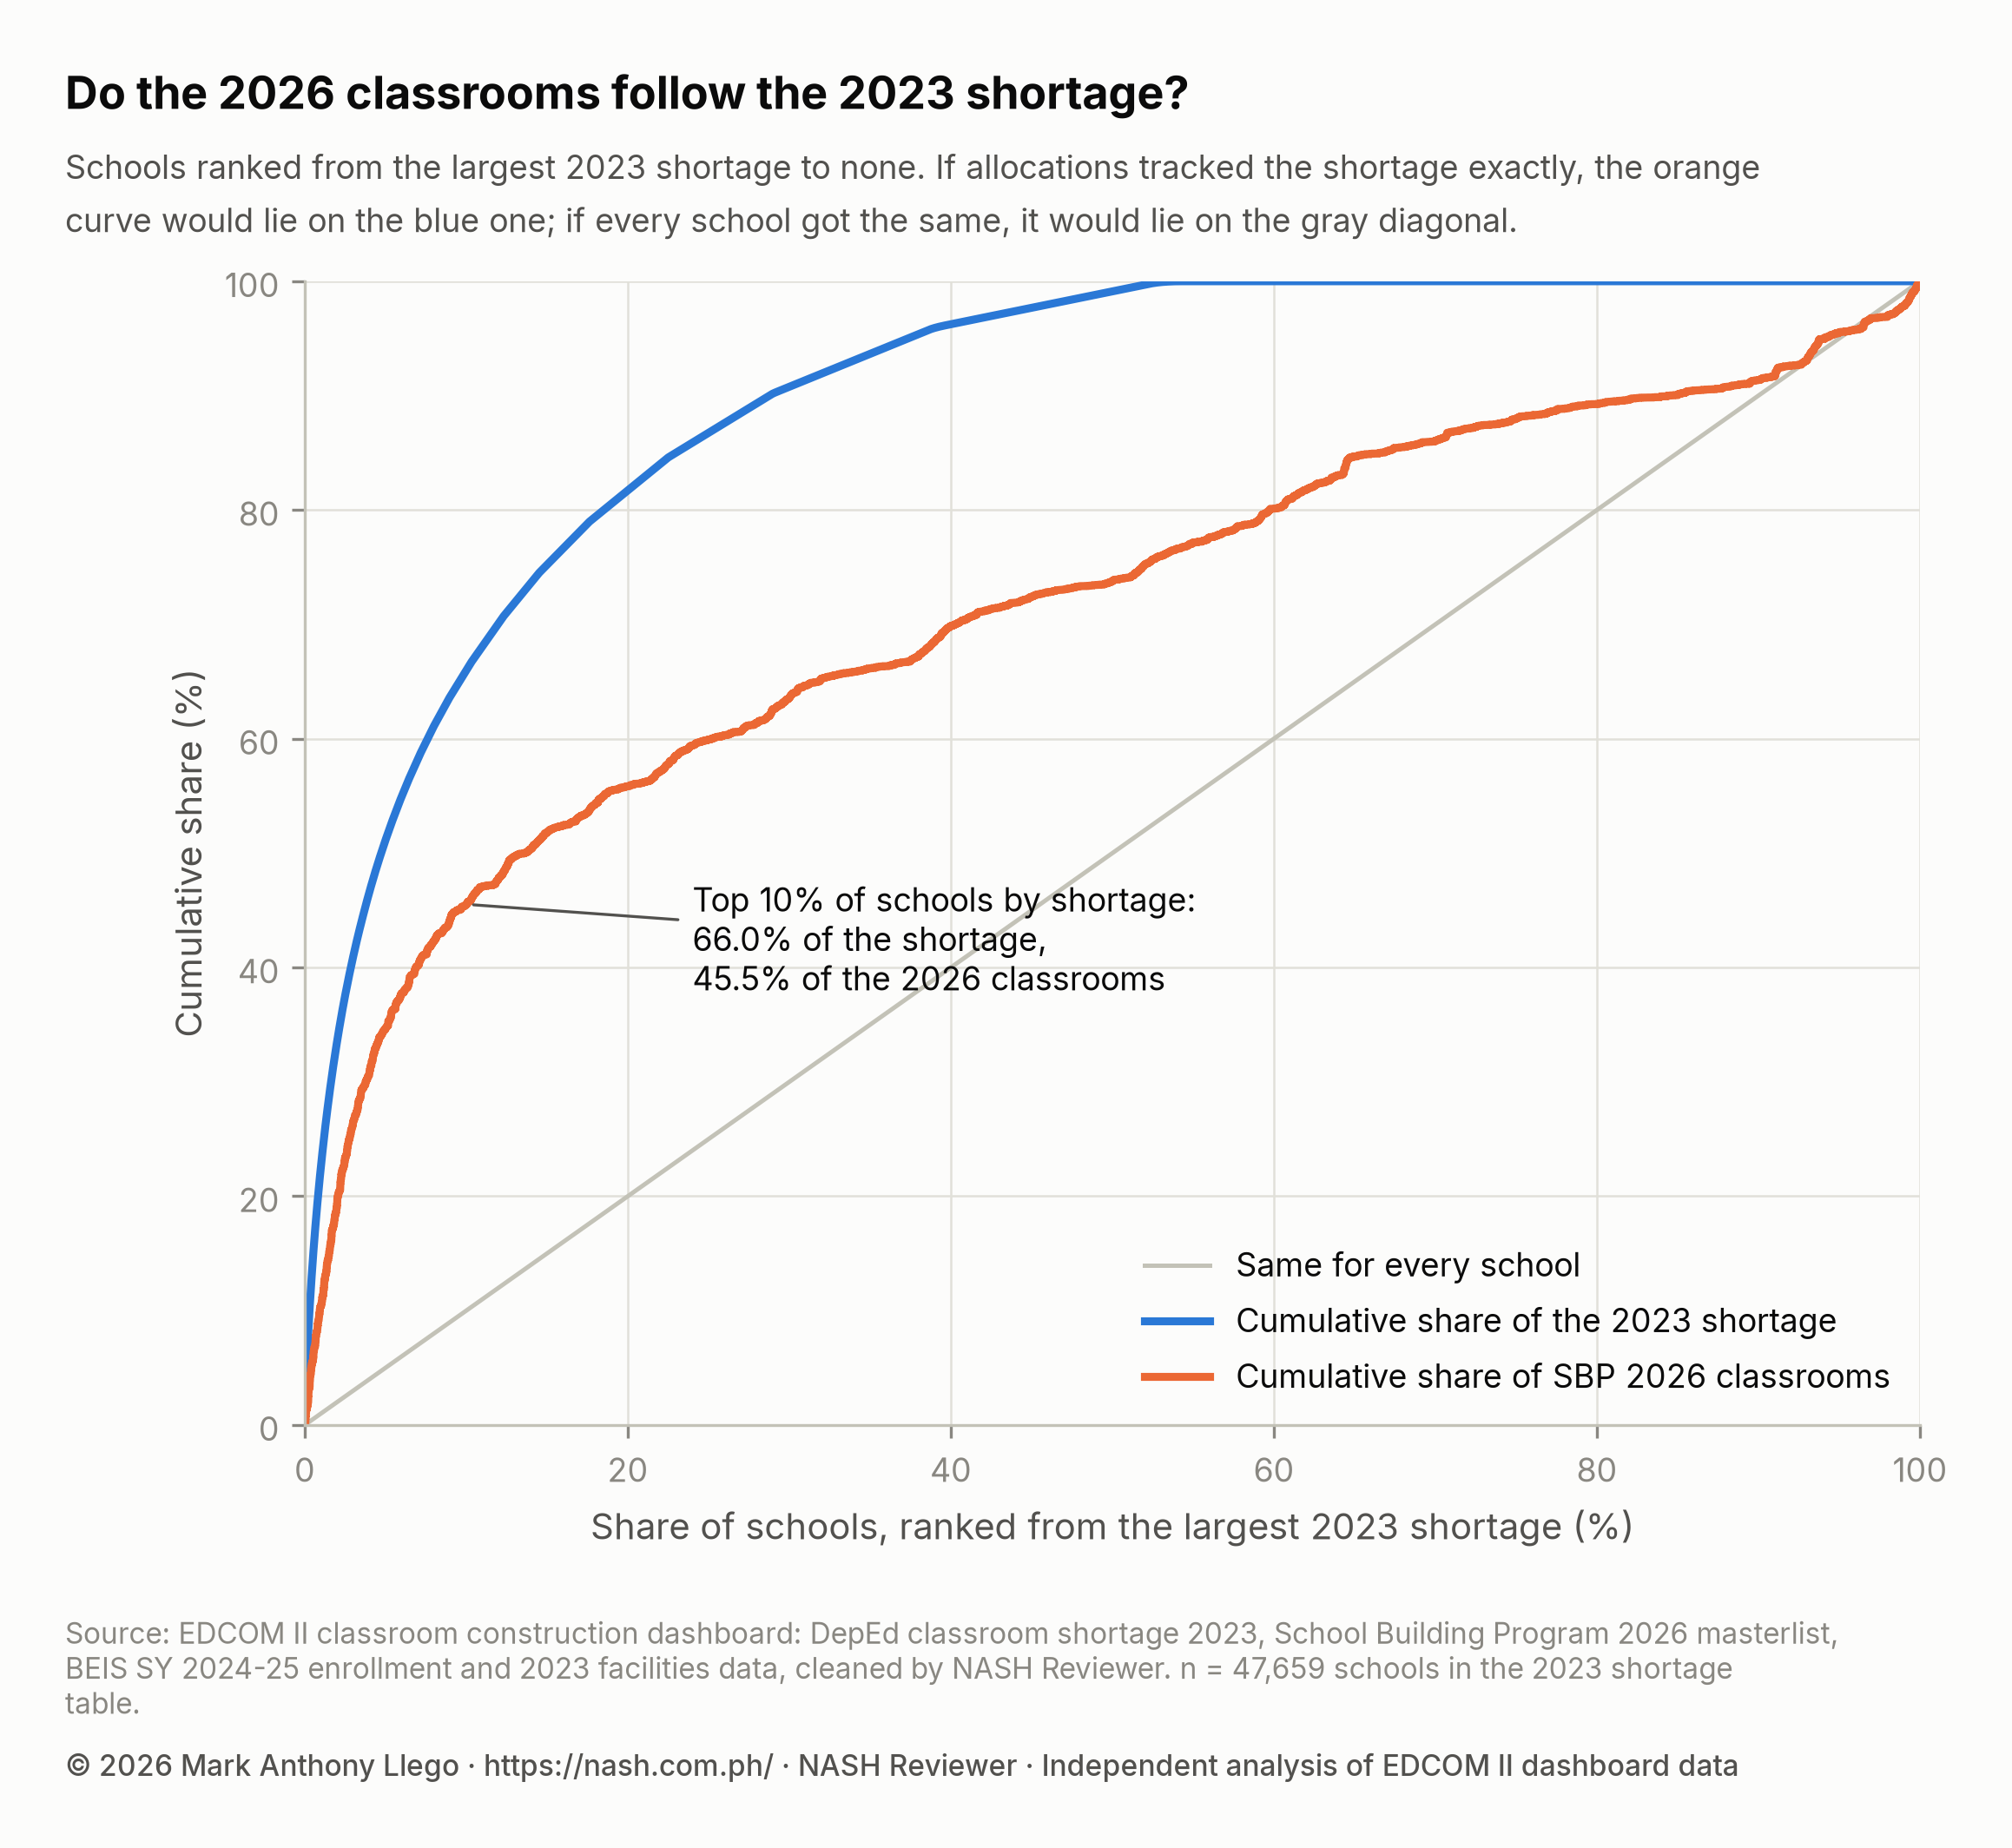
The blue curve, the shortage, rises steeply: the top 10% of schools hold 66.0% of it. The orange curve, the SBP classrooms at these schools, would lie on the blue one if allocations followed the shortage exactly, and on the gray diagonal if every school received the same. It lies between: the same top 10% of schools receive 45.5% of the classrooms, and schools with any shortage 76.6%. The rest go to schools with none, so the orange curve keeps climbing after the blue one levels off.
These are concentration curves; the shortage ranked by itself is also a Lorenz curve (Lorenz, 1905). The concentration index, developed by Wagstaff and colleagues (1991) to study inequality in health, is twice the area between such a curve and the diagonal. Zero means classrooms are spread with no regard to shortage; positive values mean they favor schools with larger shortages. Kakwani and colleagues (1997) gave the formula used here, set out in the method section, and showed how to estimate its uncertainty.
For the shortage itself, the index is 0.80, which is the shortage’s Gini coefficient (Gini, 1912) reported in Philippine Classroom Shortage 2023: Where the Gap Is. Classrooms shared in exact proportion to each school’s shortage would also score 0.80. The SBP classrooms score 0.43 (95% interval 0.36 to 0.49): clearly above zero, so allocations do favor schools with larger shortages, but only 54.0% of the shortage’s own index.
The interval comes from a cluster bootstrap: the index is recomputed on 500 samples drawn with replacement from the data (Efron & Tibshirani, 1993), each made of whole divisions rather than single schools. Schools in a division share a division office and local conditions, and their allocations are likely planned together, so they are not independent; drawing single schools would make the interval too narrow (Cameron & Miller, 2015). Since the data cover nearly every public school, read the interval as how firmly the result holds across divisions, not as ordinary sampling error.
Which schools receive classrooms, by size of shortage
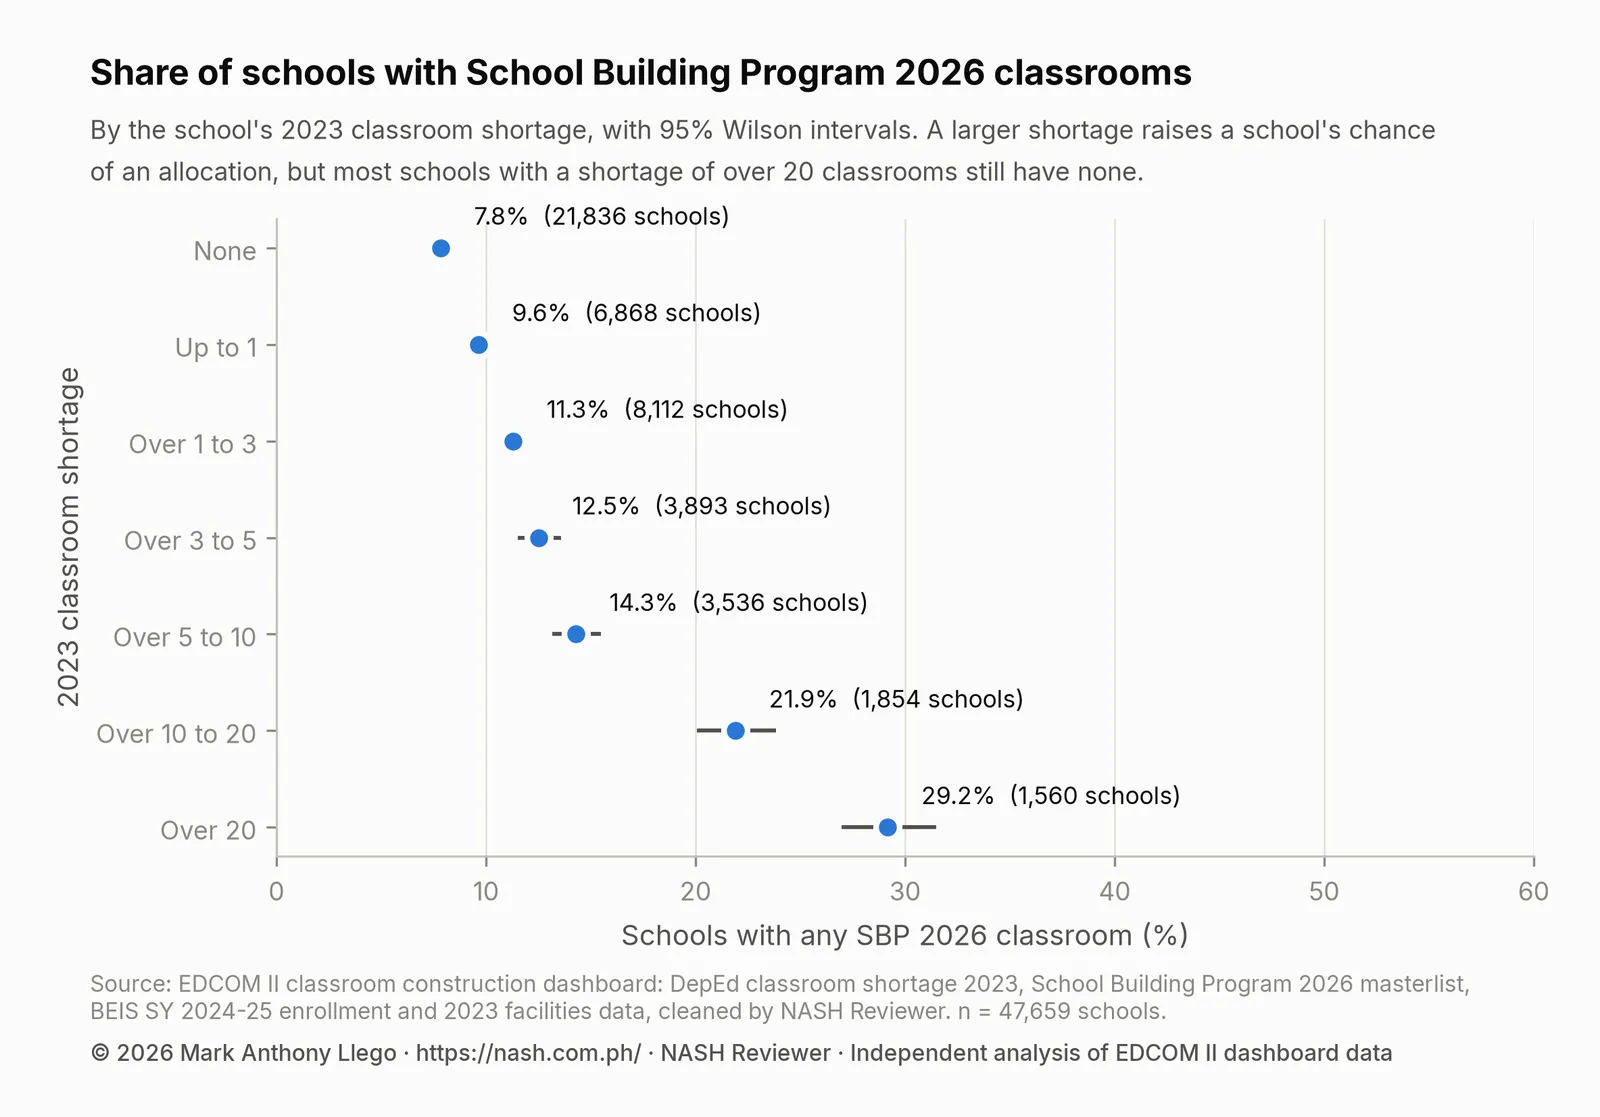
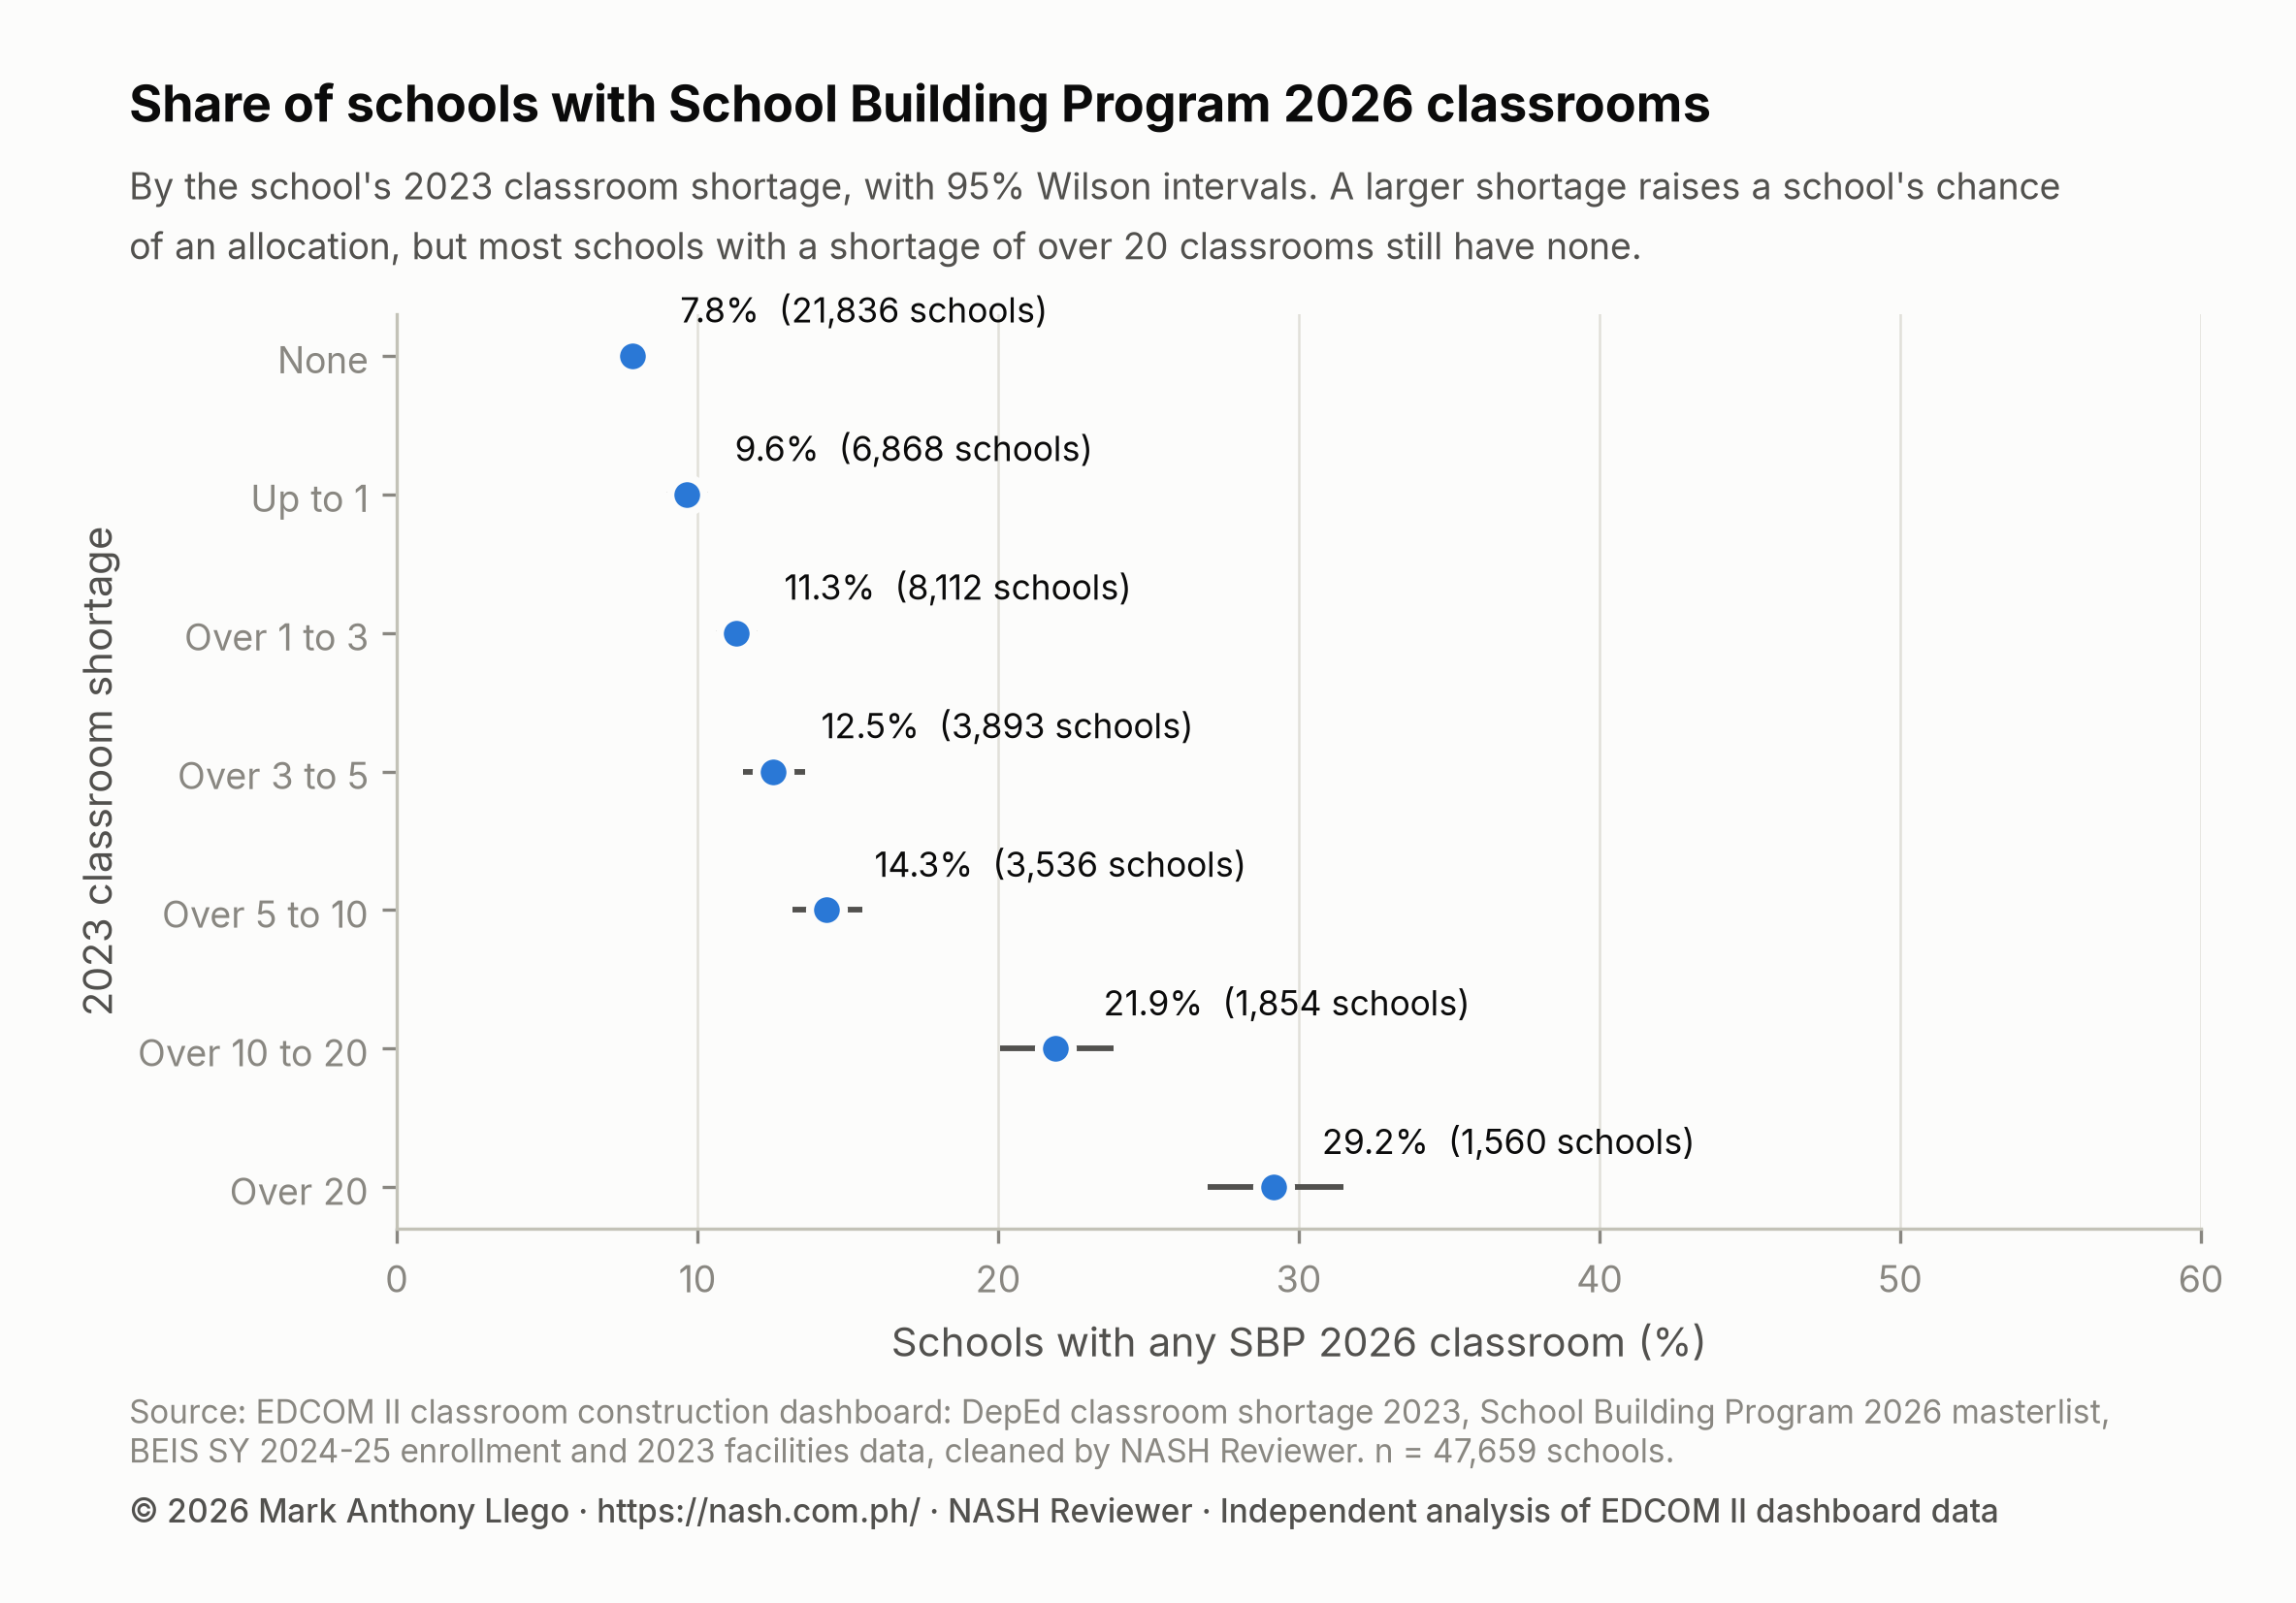
The share of schools with any SBP classroom rises in every band, from 7.8% of schools with no shortage to 21.9% of those short by over 10 to 20 classrooms and 29.2% of those short by more than 20. Even in that top band, fewer than a third receive any: 455 of 1,560 schools. The intervals are Wilson score intervals (Wilson, 1927), which stay accurate for small shares and small groups.
| 2023 classroom shortage | Schools | Schools with SBP 2026 classrooms | Share (95% interval) | SBP classrooms |
|---|---|---|---|---|
| None | 21,836 | 1,708 | 7.8% (7.5% to 8.2%) | 7,457 |
| Up to 1 | 6,868 | 662 | 9.6% (9.0% to 10.4%) | 2,235 |
| Over 1 to 3 | 8,112 | 915 | 11.3% (10.6% to 12.0%) | 3,681 |
| Over 3 to 5 | 3,893 | 487 | 12.5% (11.5% to 13.6%) | 2,205 |
| Over 5 to 10 | 3,536 | 505 | 14.3% (13.2% to 15.5%) | 3,339 |
| Over 10 to 20 | 1,854 | 406 | 21.9% (20.1% to 23.8%) | 4,183 |
| Over 20 | 1,560 | 455 | 29.2% (27.0% to 31.5%) | 8,807 |
Raw shares mix the shortage with things that go with it: larger schools tend to have larger shortages, and regions differ. A logistic regression (Hosmer and colleagues, 2013) holds these equal. Its outcome is whether a school has any SBP classroom; its terms are the shortage band, SY 2024-25 enrollment (per doubling), Last Mile School status, urban location, two or more class shifts in SY 2024-25, and a separate baseline for each region (region fixed effects), so schools are compared only within their region. It covers 47,495 schools in 227 divisions, with standard errors clustered by division.
The results are odds ratios. The odds of an event are its chance of happening divided by its chance of not happening, and an odds ratio compares two groups’ odds: 1 means no difference, above 1 higher odds, below 1 lower. When chances are small, an odds ratio is close to a ratio of chances; when they are larger, it overstates that ratio.
| Term | Odds ratio (95% interval) | p-value |
|---|---|---|
| Shortage up to 1 (vs none) | 1.44 (1.28 to 1.62) | p < 0.001 |
| Shortage over 1 to 3 (vs none) | 1.78 (1.56 to 2.03) | p < 0.001 |
| Shortage over 3 to 5 (vs none) | 2.06 (1.71 to 2.48) | p < 0.001 |
| Shortage over 5 to 10 (vs none) | 2.21 (1.82 to 2.68) | p < 0.001 |
| Shortage over 10 to 20 (vs none) | 2.86 (2.38 to 3.44) | p < 0.001 |
| Shortage over 20 (vs none) | 2.87 (2.24 to 3.68) | p < 0.001 |
| Learners (per doubling of enrollment) | 1.27 (1.22 to 1.32) | p < 0.001 |
| Last Mile School | 1.24 (1.04 to 1.47) | p = 0.016 |
| Urban school | 0.87 (0.77 to 0.98) | p = 0.024 |
| Runs two or more shifts | 1.20 (1.01 to 1.43) | p = 0.038 |
Compared with similar schools in the same region that reported no shortage, schools short by up to 1 classroom have 1.44 times the odds of an allocation, rising to 2.86 for schools short by over 10 to 20. The odds then level off: schools short by more than 20 have an odds ratio of 2.87. Part of the raw gap between those two bands goes with the other terms, such as size; each doubling of enrollment multiplies the odds by 1.27. Last Mile Schools (1.24) and schools running two or more shifts (1.20) have somewhat higher odds, and urban schools (0.87) somewhat lower, with intervals that come close to 1. The shortage matters in relative terms; in absolute terms, most schools with a shortage still receive nothing.
Classroom allocation by modality: DPWH, LGU, DepEd and PSIP III
The classrooms come through four groups of implementers: the Department of Public Works and Highways (DPWH, 6,142 classrooms); provinces, cities and municipalities (LGU, 8,665); DepEd’s own Learning Continuity Space and Last Mile School lines (DepEd, 1,307); and PSIP III (16,305). Where a school’s allocation exceeds its shortage, the excess is shared among its lines in proportion to their classrooms.
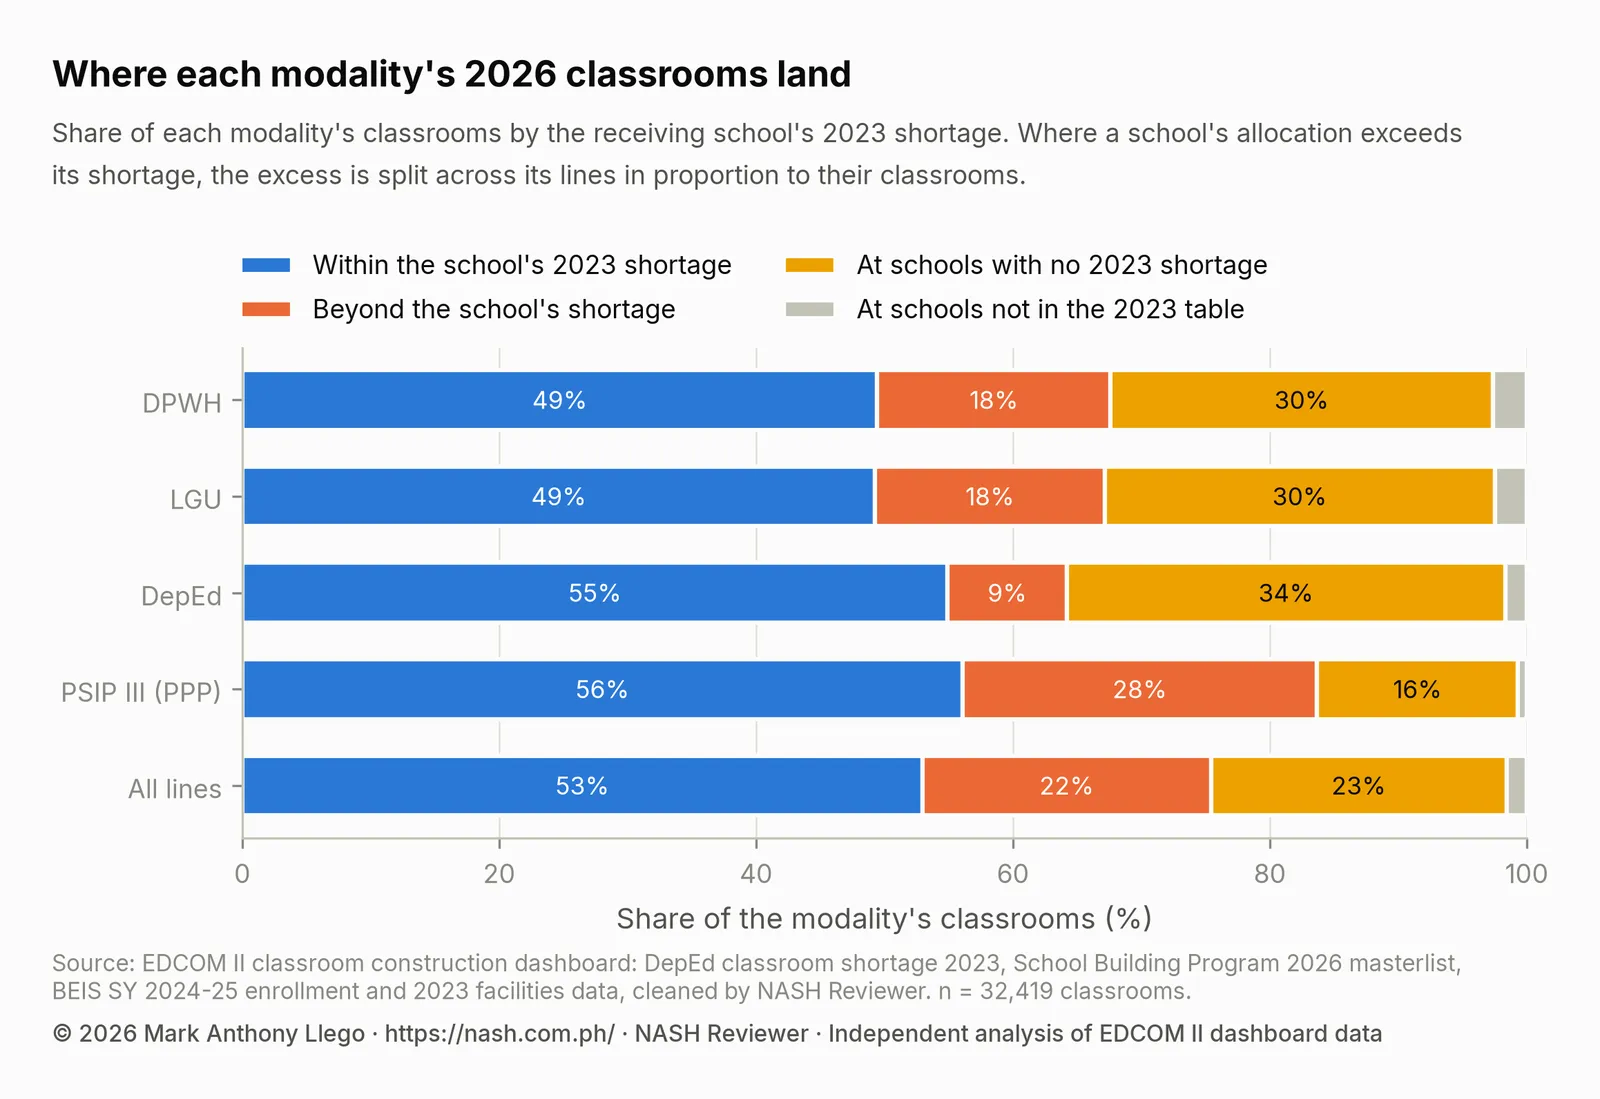
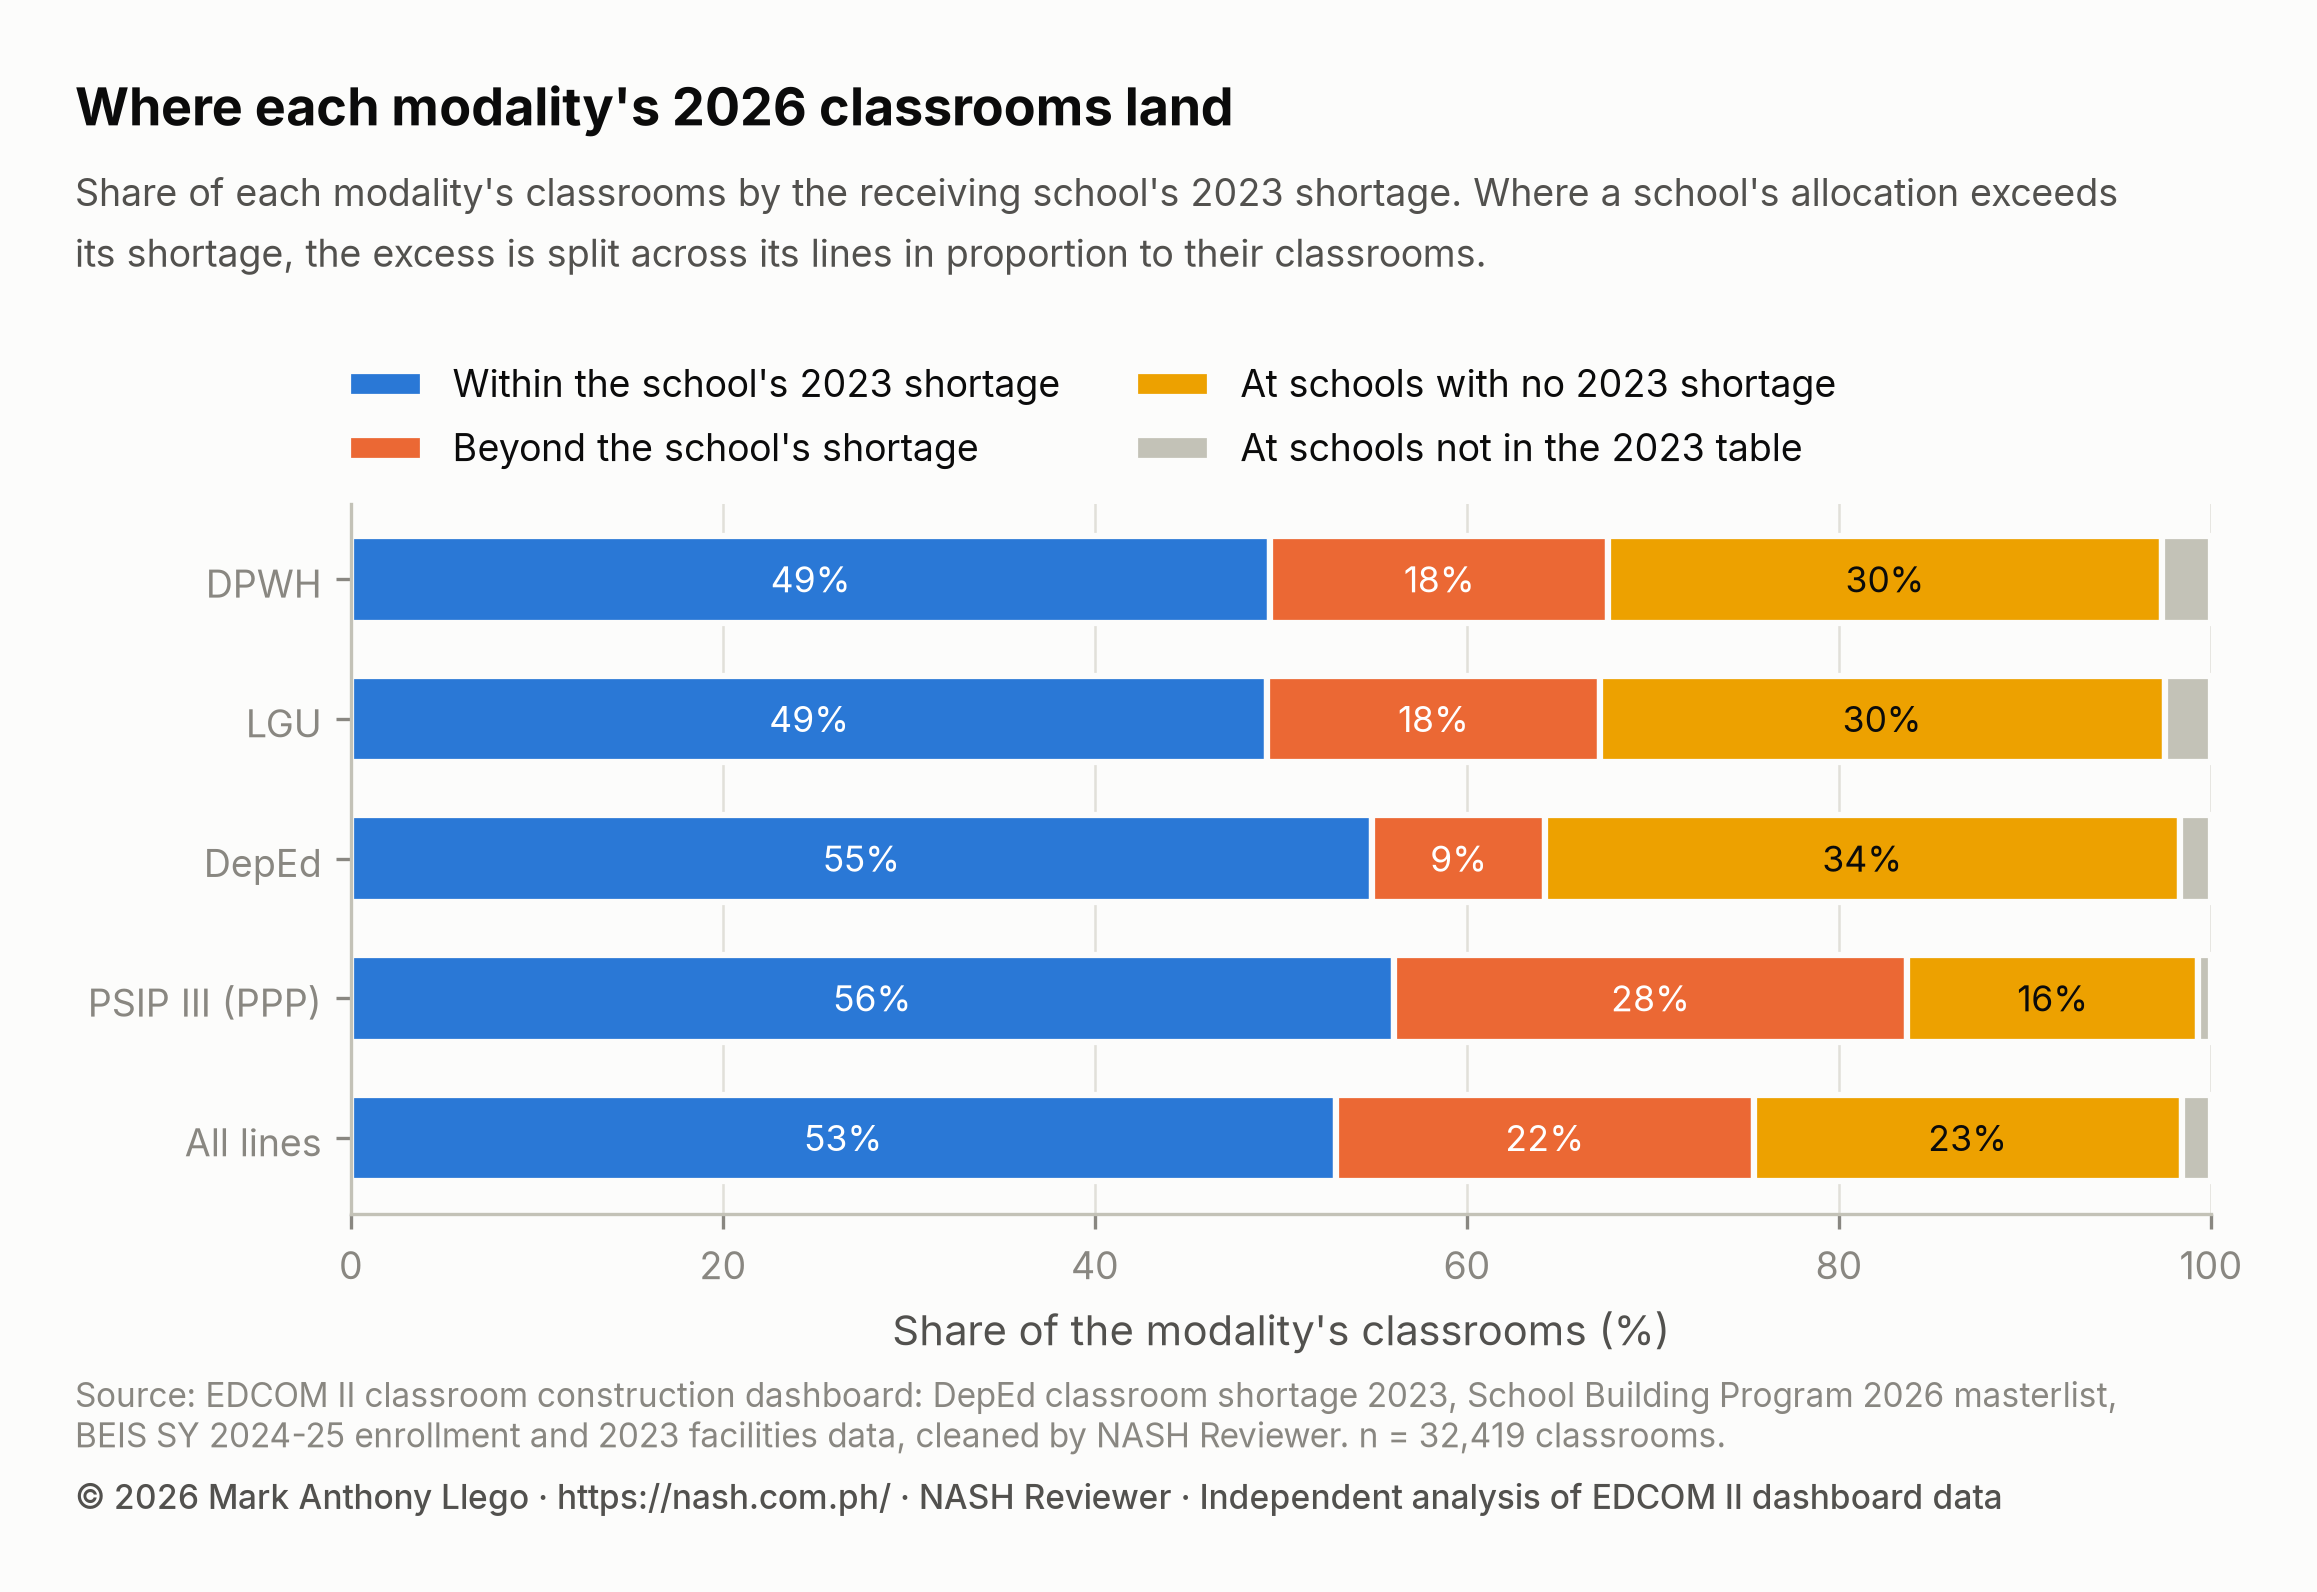
About half of each group’s classrooms fall within the receiving school’s shortage, from 49.3% for LGU lines to 56.1% for PSIP III. The groups differ in where the rest go. PSIP III places 15.7% of its classrooms at schools with no 2023 shortage but 27.6% beyond the receiving school’s shortage; DepEd places 34.1% at schools with no shortage and 9.3% beyond. The table’s last column counts only classrooms at schools in the shortage table, so it differs slightly from the chart.
| Modality group | Classrooms at schools in the shortage table | Concentration index (95% interval) | Share at schools with no 2023 shortage |
|---|---|---|---|
| DPWH | 5,979 | 0.27 (0.18 to 0.35) | 30.6% |
| LGU | 8,449 | 0.26 (0.20 to 0.33) | 31.2% |
| DepEd | 1,285 | 0.09 (0.03 to 0.14) | 34.7% |
| PSIP III (PPP) | 16,194 | 0.61 (0.53 to 0.67) | 15.8% |
PSIP III follows the shortage most closely, at 0.61 (0.53 to 0.67), the only group above the 0.43 for all lines. Its lines are large, a median of 10.0 classrooms against 4.0 for DPWH lines, so they reach schools with large shortages but also build past the 2023 count more often. DPWH (0.27) and LGU (0.26) lines are less concentrated.
DepEd’s lines score lowest, 0.09 (0.03 to 0.14), which may be expected. They are 805 classrooms in Learning Continuity Spaces, prefabricated rooms that, as the name says, aim to keep classes going, for example where rooms are damaged or unsafe; and 502 in Last Mile School buildings, for schools in geographically isolated, disadvantaged and conflict-affected areas and hardship posts (EDCOM II, 2026). Remoteness and safety are not what the 2023 shortage counts. These data cannot show whether that explains the pattern, but a low index here is not, on its own, evidence of poor targeting. Last Mile Schools: Classroom Need and 2026 Allocation looks at these schools in detail.
Cities and municipalities: repeating EDCOM II’s comparison
EDCOM II’s 20 October 2026 news release compared DepEd’s School Building Plan 2026, as of 20 August 2026, with DepEd StratMa Classroom Backlog 2023. It found that only 45.2% of the 332 LGUs with the largest estimated shortages were also among the top recipients of planned allocations (EDCOM II, 2026, October 20). On the cleaned data for 1,642 cities and municipalities, 147 of the 332 with the largest 2023 shortages (44.3%) are among the 332 with the most SBP classrooms. The small gap may come from the masterlist version, from how schools are placed in towns, or from ties at the cutoff.
The release’s three Cavite examples match exactly: Maragondon receives 272 classrooms against a shortage of 64, Tanza 448 against 869 and Naic 356 against 631. The masterlist cannot show its finding that seven of the ten municipalities with the highest FY 2026 funds received more classrooms than their shortage, because PSIP III lines carry no budget yet. Among the ten municipalities with the largest allocated budgets here, 5 received more than their shortage; among the ten cities and municipalities with the most classrooms, 1 did.
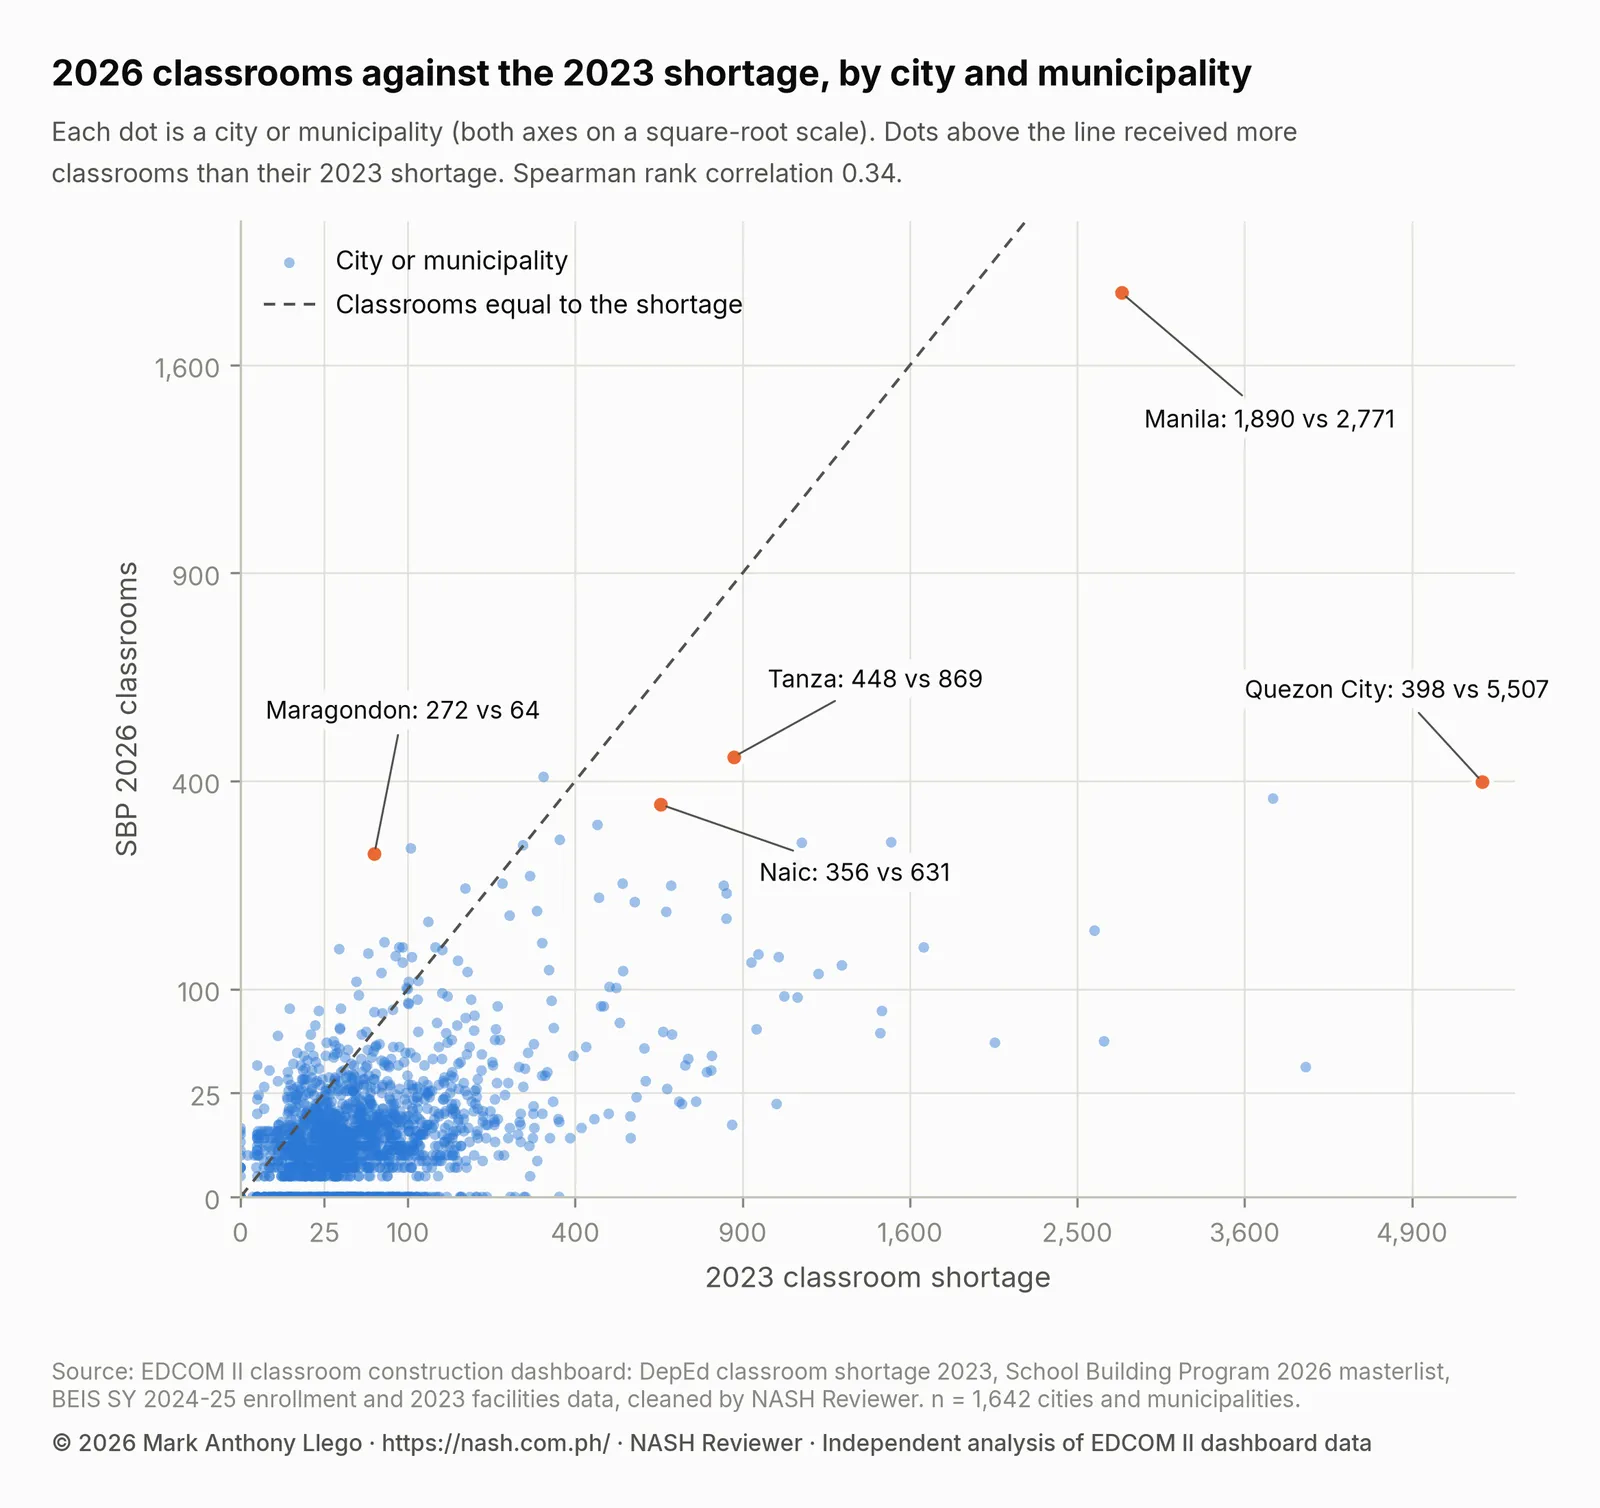
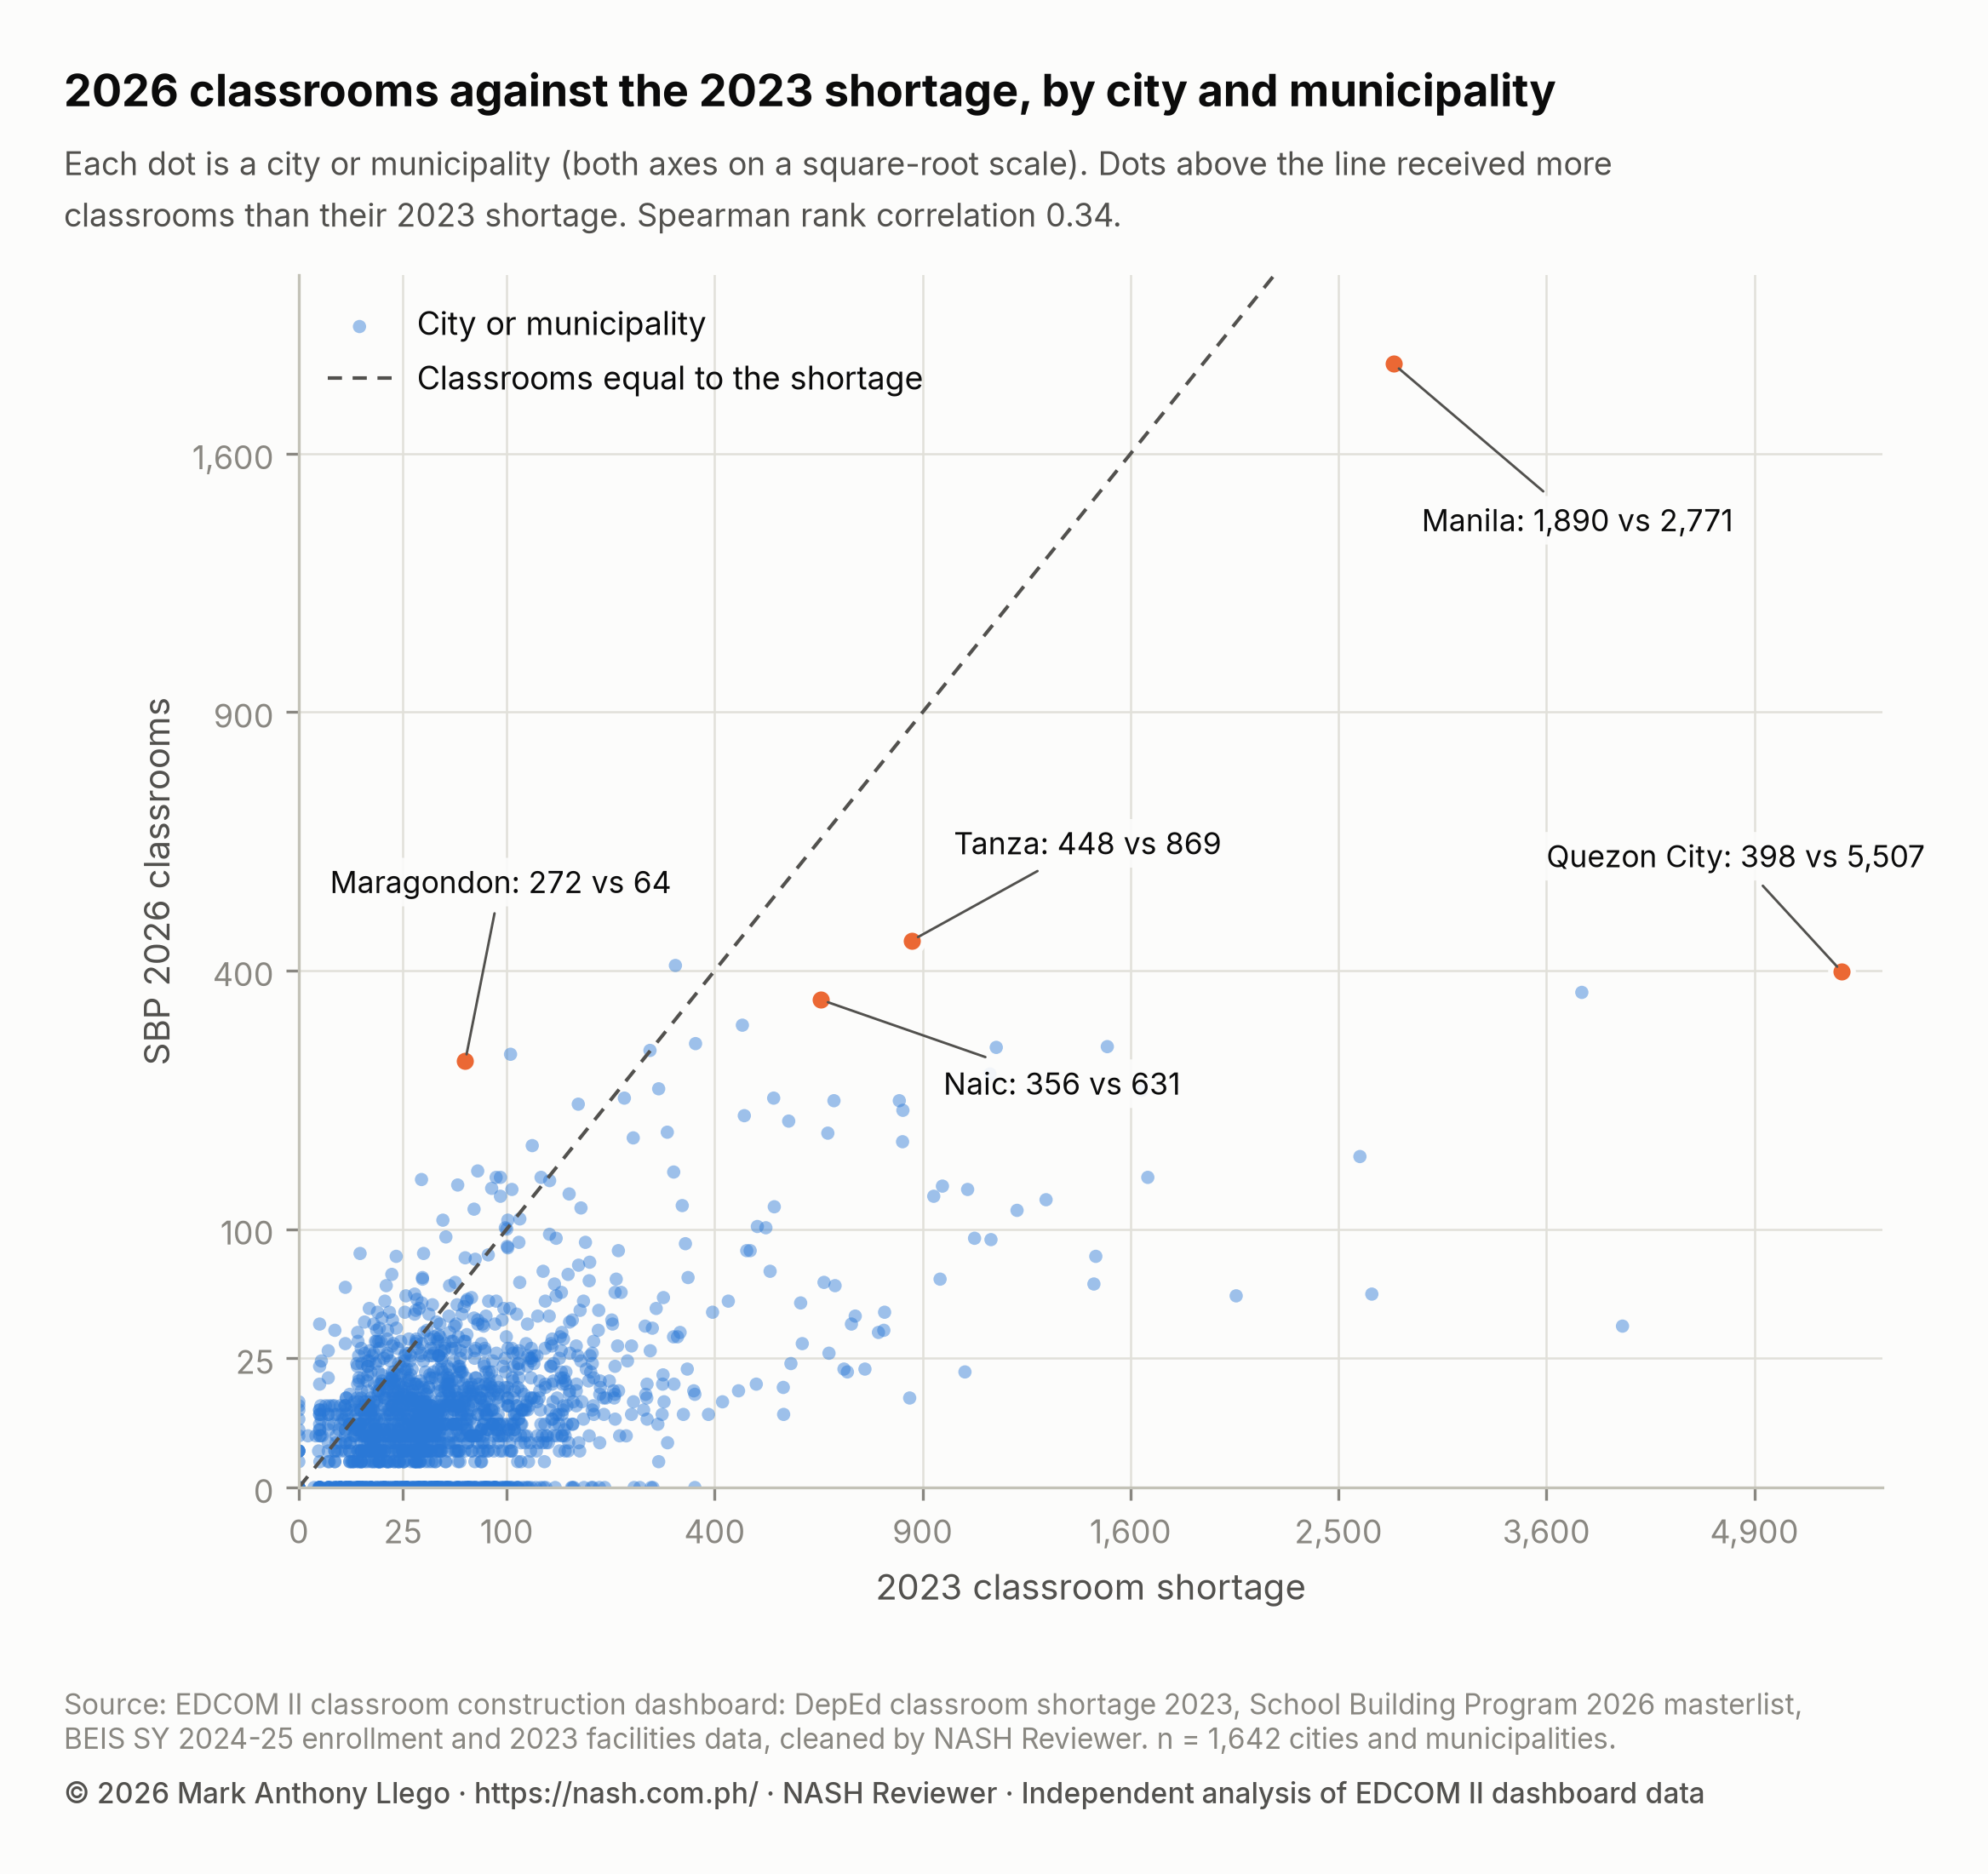
Most cities and municipalities receive no more than their shortage; 183 lie above the dashed line, with 3,101 classrooms beyond their shortage in total. The Spearman rank correlation (Spearman, 1904), which compares ranks rather than counts, is 0.34 (95% interval 0.29 to 0.38): a positive but modest link. Quezon City, with the largest shortage of any city or municipality, receives 398 classrooms against 5,507.
| City or municipality | Province | SBP 2026 classrooms | 2023 classroom shortage | Coverage |
|---|---|---|---|---|
| City of Manila | City of Manila | 1,890 | 2,771 | 68.2% |
| Tanza | Cavite | 448 | 869 | 51.6% |
| Gen. Mariano Alvarez | Cavite | 408 | 328 | 124.4% |
| Quezon City | Quezon City | 398 | 5,507 | 7.2% |
| City of Caloocan | City of Caloocan | 367 | 3,807 | 9.6% |
| City of Trece Martires | Cavite | 362 | 622 | 58.2% |
| Naic | Cavite | 356 | 631 | 56.4% |
| Silang | Cavite | 320 | 455 | 70.3% |
| City of San Pablo | Laguna | 295 | 364 | 81.0% |
| City of San Jose Del Monte | Bulacan | 291 | 1,512 | 19.2% |
At the other end, 273 cities and municipalities receive no SBP classroom, though they hold 13,613 classrooms of shortage. Of these, four of the five with the largest shortages are in BARMM. (Sulu is counted in Region IX, since its schools division moved to DepEd Region IX on 20 October 2026.)
| City or municipality | Province | Region | 2023 classroom shortage | Schools |
|---|---|---|---|---|
| Datu Odin Sinsuat | Maguindanao del Norte | BARMM | 363 | 49 |
| South Upi | Maguindanao del Sur | BARMM | 290 | 43 |
| Panglima Sugala | Tawi-Tawi | BARMM | 287 | 34 |
| City of Makati | City of Makati | NCR | 269 | 24 |
| Upi | Maguindanao del Norte | BARMM | 260 | 43 |
SBP classrooms equal 1.8% of BARMM’s shortage, the lowest coverage of any region. The Bangsamoro Organic Law (RA 11054), Article VI, Section 13, says national programs and projects such as the School Building Program “shall continue to be funded by the National Government”, yet EDCOM II has reported that some national programs pulled back from BARMM after the law because of unclear interpretation (EDCOM II, 2025, November 13). These data cannot say why a given town received nothing; a city such as Makati may build classrooms with its own funds, which the masterlist would not show. Classroom Allocation by LGU Income Class, 2026 asks whether poorer municipalities receive less.
What this means for school heads
- Check your school and LGU. In the school table below, find your school ID:
sbp_classroomsgives your SBP classrooms,shortage_totalyour 2023 shortage, andshortage_unmetandsbp_beyond_shortagethe school-by-school gap. The SBP lines file shows each line’s implementer, and the city and municipality table your LGU’s totals. How to Read DepEd Data: A Guide for Aspiring School Heads explains how to read such tables. - Document need beyond the 2023 count. EDCOM II also counts 68,147 classrooms needed to ease congestion in 4,492 schools with more than 50 learners per classroom, 52,871 to end double and triple shifting in 1,889 schools and 6,808 for 2,677 schools relying on makeshift classrooms. Record enrollment, shifts, makeshift rooms and condemned rooms, with dates and photos, in your School Improvement Plan and AIP; Class Shifts and Crowded Classrooms in DepEd Schools shows how shifting is measured.
- Keep your records current. Missing or outdated room, building-condition or enrollment records can hide a school’s need. Use Brigada Eskwela inspections to confirm the condition of each room.
- Bring the numbers to your division and LGU. LGU-implemented lines carry 8,665 SBP classrooms. Show your division and local school board your shortage, allocation and unmet gap beside your LGU’s totals.
- Plan extra rooms openly. If your school received more than its 2023 shortage, write in the SIP what each new room replaces or relieves: a makeshift room, a second shift or a condemned building.
- Follow EDCOM II’s planned public classroom tracker. Once available, it may help schools follow a line from plan to award to construction.
How these numbers were made
The data are the cleaned EDCOM II dashboard tables: 48,131 public schools, 5,652 SBP 2026 masterlist lines and 1,642 cities and municipalities. They reproduce the dashboard’s totals exactly, and every source is joined on the school’s current ID. The analysis was done in Python with pandas, statsmodels and SciPy.
- School-by-school split. At each school in the shortage table, classrooms within the shortage are the smaller of its SBP classrooms and its shortage; classrooms beyond it are SBP classrooms minus the shortage, where positive. Classrooms at schools with no shortage or not in the table are counted separately, and the four parts must add up to 32,419. The unmet shortage is the shortage minus the classrooms within it, summed over schools.
- Logistic regression. Outcome 1 if a school has any SBP classroom, 0 if not; terms as above, with enrollment as a base-2 logarithm; fitted by maximum likelihood with division-clustered standard errors. Schools with no enrollment or no urban or rural code are left out.
- Concentration index. Schools are ranked from the smallest shortage to the largest; tied schools, such as the 21,836 with none, share their average rank, scaled to a fractional rank between 0 and 1. The index is twice the covariance between a school’s SBP classrooms and its fractional rank, divided by the mean SBP classrooms per school, over 47,659 schools. Its interval is the middle 95% of 500 cluster-bootstrap estimates. Each modality’s index uses only its own classrooms.
- Cities and municipalities. The Spearman interval comes from 1,000 bootstrap samples of cities and municipalities. Budgets leave out PSIP III lines, which have none yet.
- Sensitivity. The masterlist holds 103 PSIP III lines that exactly copy an earlier line, carrying 1,554 classrooms; with no project ID, a second identical building cannot be told from a double entry, so they are kept. Dropping them changes little: 16,483 of the remaining 30,865 classrooms (53.4%) fall within the receiving school’s shortage, against 53.0%, and the index is 0.41, against 0.43.
Limits
The years differ: shortage and facilities from 2023, enrollment and shifts from SY 2024-25, allocations from 2026, with PSIP III construction expected from March 2027 to July 2028. Allocations are plans, not buildings. At EDCOM II’s 16 October 2026 hearing, of the PHP 21.45 billion for 6,000 DPWH-led classrooms, only PHP 1.87 billion, covering 533 classrooms, had reached the award or near-award stage (EDCOM II, 2026, October 20).
The shortage is DepEd’s own estimate and not the whole need. The National Education Plan 2026-2035 puts the classrooms needed from current and projected deficits at 219,000 by 2028 (EDCOM II, 2026), and EDCOM II has warned that 51,000 classrooms are likely to be condemned by 2028 (EDCOM II, 2026, February 9). Allocations may also weigh buildable land, site readiness, other funding and earlier projects, none of which are in these data.
The 86 schools with SBP classrooms but no shortage record are left out of the index and the model. Town-level results depend on how schools are placed in cities and municipalities, which may differ from EDCOM II’s matching. All results are associations: they show how allocations line up with the 2023 shortage on paper, not why a school or town received what it did.
Frequently asked questions
Do DepEd’s 2026 classrooms go to the schools with the biggest shortages?
Partly. Schools with larger 2023 shortages are more likely to receive SBP 2026 classrooms, but only 13.3% of the 25,823 schools with a shortage receive any. School by school, 53.0% of the 32,419 classrooms fall within the receiving school’s own shortage.
Why is the unmet classroom shortage 148,276 and not 133,024?
The dashboard’s “Remaining Unfunded” figure, 133,024, subtracts all SBP classrooms from the total shortage, so classrooms beyond one school’s need offset another school’s shortage. Counted school by school, the unmet shortage is 148,276.
What is a concentration index?
It measures how far something goes to those with the most need: twice the area between the curve of cumulative classrooms, with schools ranked by shortage, and the diagonal. Zero means no regard to shortage; 0.80, the shortage’s own index, is what allocation in proportion to need would give. SBP 2026 classrooms score 0.43.
Is a school that got classrooms without a 2023 shortage a mistake?
Not necessarily. A school may since have lost rooms to calamity or condemnation, gained learners, or need rooms for remoteness or safety, which the 2023 count does not measure. These data cannot say which of the 23.0% of classrooms at such schools were justified.
Download the data and cite this post
The cleaned EDCOM II classroom data behind this series are free to download for personal study; to reuse them, email support@nash.com.ph for written permission first. How the EDCOM Classroom Data Was Cleaned explains every table and cleaning rule. The files are at data.nash.com.ph: start with the README, then the school table (Parquet, or CSV), the School Building Program lines (CSV), the city and municipality table (CSV), and every table for Stata and SPSS. Every figure quoted in this series, with the data behind each chart, is in analysis_tables.zip.
Every file, with its rows, columns and checksum, is listed on the EDCOM II classroom data page. To cite the data: Llego, M. A. (2026). EDCOM II classroom construction dashboard data, cleaned, version 1.1. NASH Reviewer. https://nash.com.ph/edcom-classroom-data
To cite this post: Llego, M. A. (2026, October 28). Do 2026 classrooms go where the shortage is? NASH Reviewer Blog. https://nash.com.ph/blog/classroom-allocation-vs-shortage-2026
References
- Cameron, A. C., & Miller, D. L. (2015). A practitioner’s guide to cluster-robust inference. Journal of Human Resources, 50(2), 317–372.
- Efron, B., & Tibshirani, R. J. (1993). An introduction to the bootstrap. Chapman & Hall.
- Gini, C. (1912). Variabilità e mutabilità. Tipografia di Paolo Cuppini.
- Hosmer, D. W., Lemeshow, S., & Sturdivant, R. X. (2013). Applied logistic regression (3rd ed.). Wiley.
- Kakwani, N., Wagstaff, A., & van Doorslaer, E. (1997). Socioeconomic inequalities in health: Measurement, computation, and statistical inference. Journal of Econometrics, 77(1), 87–103.
- Llego, M. A. (2026). EDCOM II classroom construction dashboard data, cleaned, version 1.1 [Data set]. NASH Reviewer. https://nash.com.ph/edcom-classroom-data
- Lorenz, M. O. (1905). Methods of measuring the concentration of wealth. Publications of the American Statistical Association, 9(70), 209–219.
- Second Congressional Commission on Education (EDCOM II). (2025, November 13). Clarity needed on the implementation of 23 national education laws in BARMM [News release].
- Second Congressional Commission on Education (EDCOM II). (2026). National Education Plan 2026–2035 (Year Three report).
- Second Congressional Commission on Education (EDCOM II). (2026, February 9). EDCOM II: 51,000 classrooms likely to be condemned by 2028 [News release].
- Second Congressional Commission on Education (EDCOM II). (2026, October 20). Put classrooms where they’re needed most, EDCOM 2 tells DepEd [News release]. https://edcom2.gov.ph/put-classrooms-where-theyre-needed-most-edcom-2-tells-deped/
- Spearman, C. (1904). The proof and measurement of association between two things. American Journal of Psychology, 15(1), 72–101.
- Wagstaff, A., Paci, P., & van Doorslaer, E. (1991). On the measurement of inequalities in health. Social Science & Medicine, 33(5), 545–557.
- Wilson, E. B. (1927). Probable inference, the law of succession, and statistical inference. Journal of the American Statistical Association, 22(158), 209–212.
More in this series
- How the EDCOM Classroom Data Was Cleaned
- Philippine Classroom Shortage 2023: Where the Gap Is
- DepEd School Building Program 2026 in Numbers
- Do 2026 Classrooms Go Where the Shortage Is?
- Classroom Allocation by LGU Income Class, 2026
- Class Shifts and Crowded Classrooms in DepEd Schools
- Last Mile Schools: Classroom Need and 2026 Allocation
- Regional reports: NCR, CAR, Region I, Region II, Region III, Region IV-A, MIMAROPA, Region V, Region VI, NIR, Region VII, Region VIII, Region IX, Region X, Region XI, Region XII, Caraga, BARMM
- Rankings and deep dives: Congressional districts, Top 20 cities and municipalities, Rizal, Quezon City, City of Manila, Tawi-Tawi, Cavite, Cost of a classroom
- Explainers: PSIP III, Senior high shortage, Junior high shortage, Excess classrooms, Learning Continuity Spaces, How learners reach school
- For teachers and school heads: Action research and thesis topics
- Related: DepEd Classroom and School Building Data, SY 2023-2024, EDCOM II Final Report: Guide for Aspiring School Heads, National Education Plan 2026-2035: Guide for School Heads, DepEd School Improvement Plan (SIP): Steps, AIP and SRC, How to Read DepEd Data: A Guide for Aspiring School Heads, PPSSH Domain 2: Managing School Operations With DepEd Data
Analysis and charts by Mark Anthony Llego for NASH Reviewer. Data: EDCOM II classroom construction dashboard and Department of Education data. NASH Reviewer is not affiliated with EDCOM II or DepEd. Charts may be reused only with written permission from support@nash.com.ph.