Region IX (Zamboanga Peninsula, often searched as Region 9) lacked 8,826 classrooms in 2023, according to DepEd’s classroom shortage data as published in the EDCOM II classroom construction dashboard. That is 5.3% of the country’s shortage of 165,443 classrooms, the seventh largest of the 18 regions. Measured against learners, the region is short 8.2 classrooms for every 1,000 learners enrolled in SY 2024-25, above the national rate of 7.4 and the fifth highest among the regions, and 60.2% of its public schools have a shortage, against 54.2% nationally.
Two places carry much of that shortage. The first is Sulu, which these data count in Region IX: its schools division formally moved from the Ministry of Basic, Higher and Technical Education of BARMM (MBHTE-BARMM) to DepEd Region IX on 20 October 2026, implementing Executive Order No. 91, s. 2025, as DepEd announced and the Daily Tribune reported. Sulu is short 2,173 classrooms, 24.6% of the region’s shortage, at 15.2 per 1,000 learners, one of the 10 highest division rates in the country. The second is Zamboanga City, short 2,032 classrooms and home to nine of the region’s 10 schools with the largest shortages. The School Building Program (SBP) 2026 covers little of either: 4.8% of Sulu’s shortage, 2.7% of Zamboanga City’s, and 7.2% of the region’s, against 19.6% nationally.
The figures below cover Region IX’s nine schools divisions across Zamboanga del Norte, Zamboanga del Sur, Zamboanga Sibugay, Sulu and the cities of Zamboanga and Isabela, from the cleaned school-level data behind the dashboard. Every file is listed on the EDCOM II classroom data page.
Key findings
- Region IX lacked 8,826 classrooms in 2023, 8.2 per 1,000 learners against 7.4 nationally, and 1,798 of its 2,985 public schools (60.2%) had a shortage.
- Sulu has both the highest rate of the region’s nine divisions, 15.2 classrooms per 1,000 learners, and the largest count, 2,173; 88.6% of its schools have a shortage.
- Zamboanga City is short 2,032 classrooms, and nine of the region’s 10 schools with the largest shortages are in the city; only one of the 10 is on the SBP 2026 list, with one classroom.
- The SBP 2026 list holds 634 classrooms for Region IX, 2.0% of the national list against the region’s 5.3% of the shortage, and only 9.7% of its schools with a shortage get any.
- The classrooms that do come are well aimed: 67.5% fall within the receiving school’s own shortage, against 53.0% nationally.
- 13 cities and municipalities with a shortage, 893 classrooms between them, get no SBP 2026 classroom; the largest is Siasi, Sulu, short 216.
- 367 schools have more than 50 learners per classroom, with 24.0% of the region’s learners counted; senior high classrooms hold 33.6 learners at the median, against 30.6 nationally.
Region IX against the country
The table puts Region IX beside the country, using the same definitions in each column.
| Indicator | Region IX | Philippines |
|---|---|---|
| Schools in the 2023 shortage data | 2,985 | 47,659 |
| Schools with a classroom shortage | 60.2% | 54.2% |
| Classroom shortage (2023) | 8,826 | 165,443 |
| Shortage per 1,000 learners | 8.2 | 7.4 |
| SBP 2026 classrooms | 634 | 32,419 |
| SBP 2026 classrooms as a share of the shortage | 7.2% | 19.6% |
| Schools with a shortage that get any SBP 2026 classroom | 9.7% | 13.3% |
| Schools with two or more shifts (SY 2024-25) | 1.3% | 4.3% |
| Median learners per classroom, elementary | 24.7 | 24.9 |
| Last Mile Schools | 21.1% | 18.5% |
| Schools using makeshift rooms (2023) | 36.6% | 29.0% |
| Schools with a building for condemnation or demolition | 22.9% | 28.9% |
A larger share of Region IX’s schools have a shortage than the country’s, 60.2% against 54.2%, and the region gets much less of the 2026 list. Its SBP classrooms equal 7.2% of its shortage, among the four lowest of the 18 regions and well under half the national 19.6%, and fewer of its schools with a shortage receive any, 9.7% against 13.3%. Makeshift rooms are more common than nationally, 36.6% against 29.0%. On shifts and elementary crowding it is close to or below the country.
Kindergarten to Grade 10 account for 7,776 classrooms of the shortage and senior high school for 1,050, 11.9%. Urban and rural schools are short at almost the same rate, 8.3 and 8.2 per 1,000 learners, where nationally urban schools run well ahead, 8.4 against 6.1. The 2,565 rural schools hold 58.7% of the shortage and the 414 urban schools 41.1%. Some schools have rooms to spare: 792 report 2,319 more Kindergarten to Grade 10 classrooms than they need, but a spare room in one school does not reduce another school’s shortage.
Classroom shortage by division in Region IX
Region IX has nine schools divisions: four provincial divisions (Zamboanga del Norte, Zamboanga del Sur, Zamboanga Sibugay and Sulu) and five city divisions (Zamboanga City, Pagadian City, Dapitan City, Dipolog City and Isabela City). The chart ranks them by the shortage per 1,000 learners.
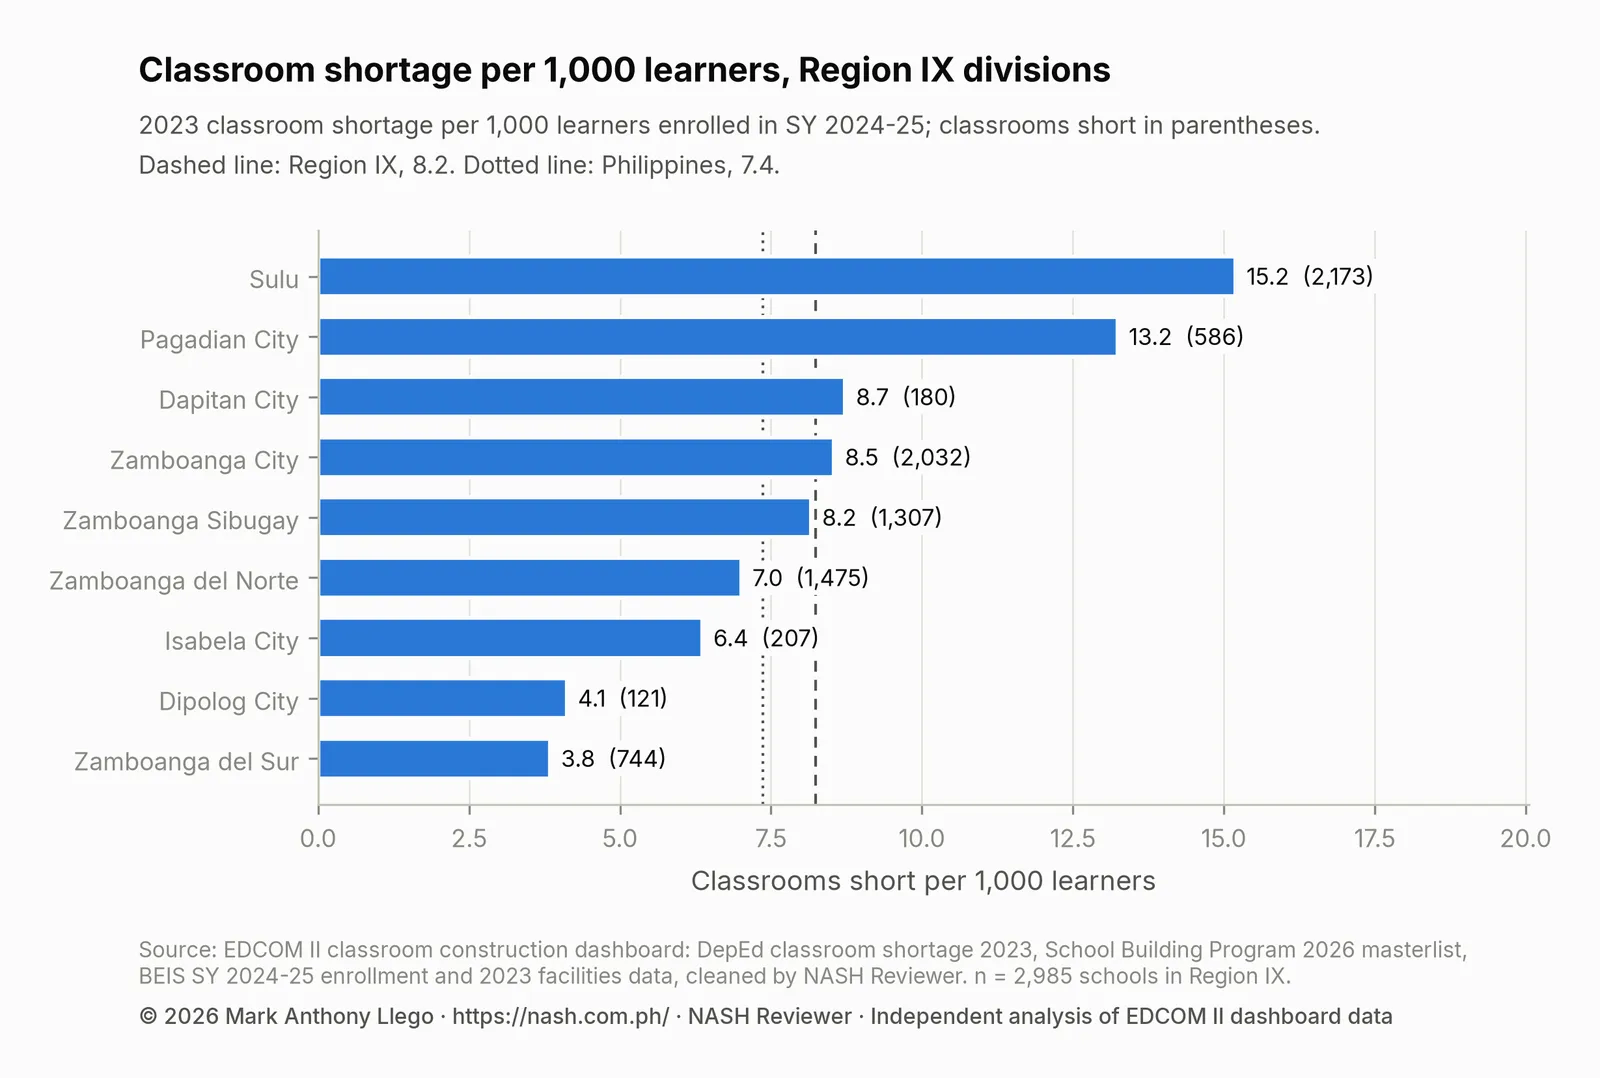
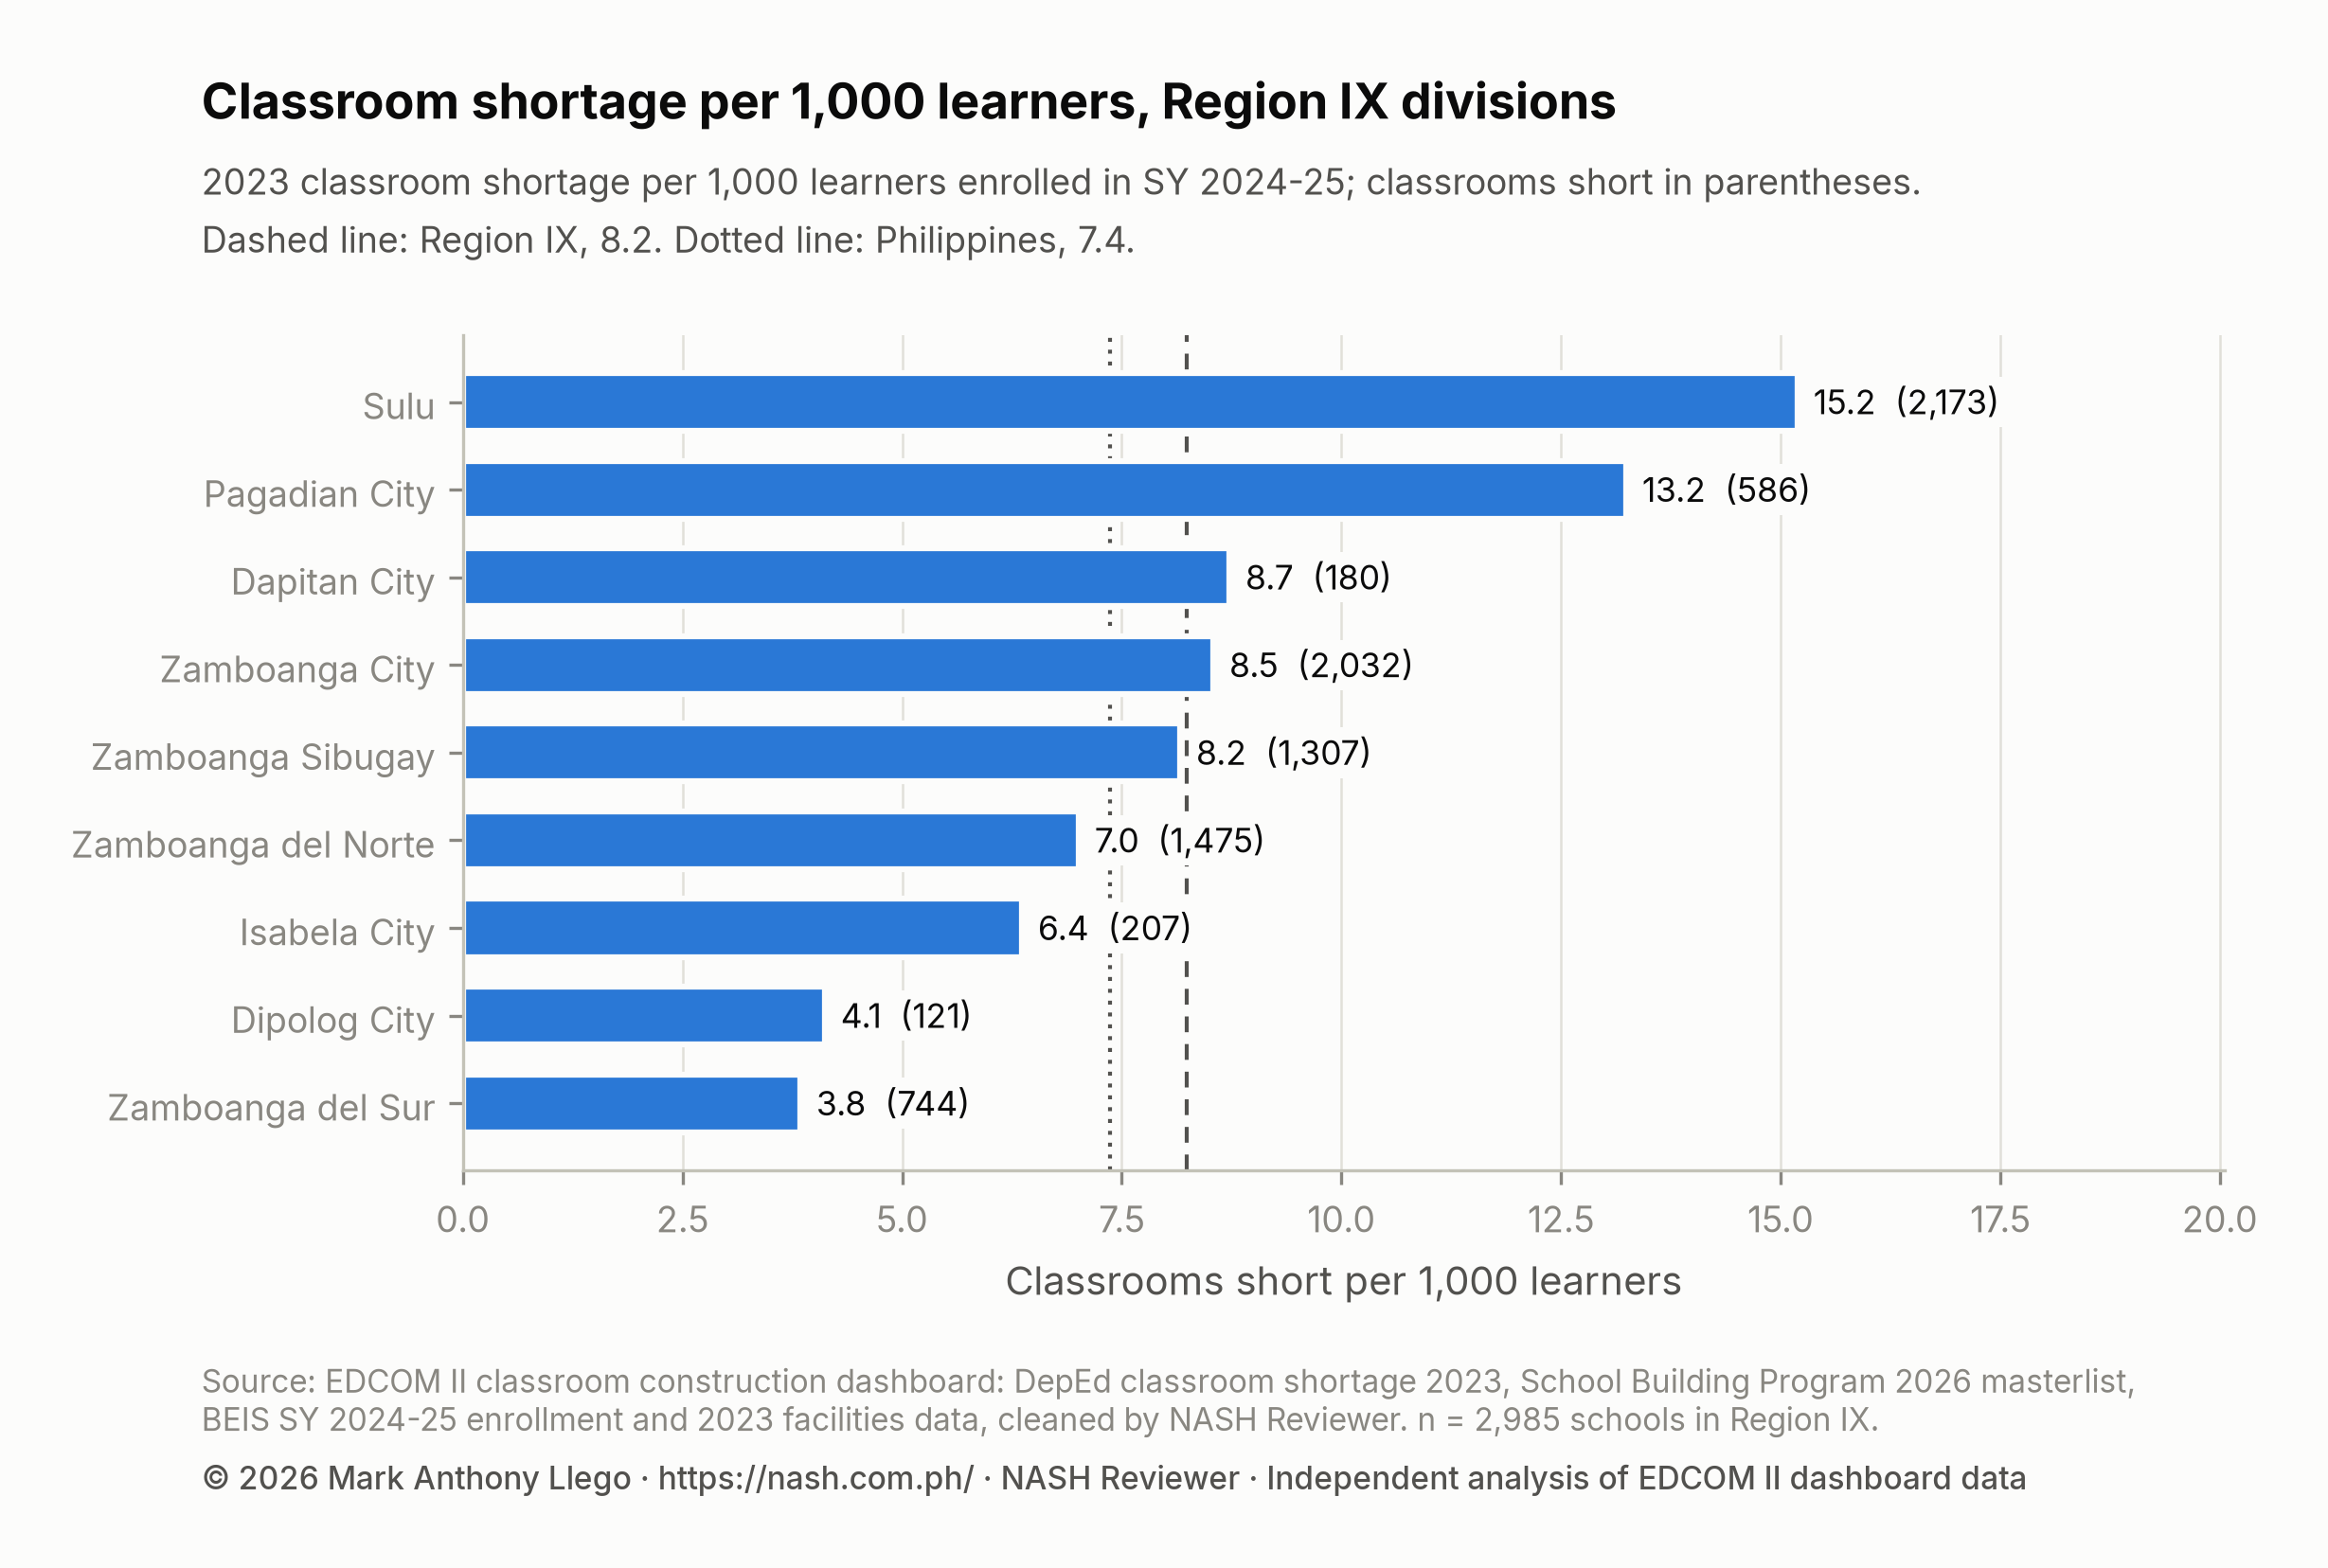
Five of the nine divisions are above the national rate, and two are far above it. Sulu, at 15.2, is short about twice as many classrooms per learner as the country, and Pagadian City, the regional center, follows at 13.2. Neighbors differ sharply: Pagadian City sits inside Zamboanga del Sur, whose provincial division has the region’s lowest rate, 3.8, and in Zamboanga del Norte, Dapitan City (8.7) runs at about twice the rate of Dipolog City (4.1).
By count, Sulu and Zamboanga City hold nearly half of the region’s shortage between them. Zamboanga City’s rate, 8.5, is close to the region’s, but it enrolls 237,875 learners, the most of any division in Region IX, so its 2,032 classrooms of shortage are almost as many as Sulu’s 2,173.
| Division | Schools | Learners (SY 2024-25) | Classroom shortage (2023) | Shortage per 1,000 learners | Schools with a shortage | SBP 2026 classrooms | Coverage |
|---|---|---|---|---|---|---|---|
| Sulu | 448 | 142,541 | 2,173 | 15.2 | 88.6% | 104 | 4.8% |
| Pagadian City | 82 | 44,268 | 586 | 13.2 | 78.0% | 31 | 5.3% |
| Dapitan City | 59 | 20,619 | 180 | 8.7 | 62.7% | 26 | 14.5% |
| Zamboanga City | 216 | 237,875 | 2,032 | 8.5 | 73.1% | 55 | 2.7% |
| Zamboanga Sibugay | 506 | 160,131 | 1,307 | 8.2 | 66.0% | 107 | 8.2% |
| Zamboanga del Norte | 757 | 210,486 | 1,475 | 7.0 | 56.5% | 138 | 9.4% |
| Isabela City | 64 | 32,596 | 207 | 6.4 | 68.8% | 37 | 17.8% |
| Dipolog City | 47 | 29,345 | 121 | 4.1 | 38.3% | 40 | 33.1% |
| Zamboanga del Sur | 806 | 191,526 | 744 | 3.8 | 39.5% | 96 | 12.9% |
Nearly nine in 10 Sulu schools have a shortage (88.6%), against 38.3% in Dipolog City. Coverage is lowest exactly where the shortage is heaviest: Zamboanga City at 2.7%, Sulu at 4.8% and Pagadian City at 5.3%. The highest is Dipolog City’s 33.1%, and no division’s list reaches half of its shortage. No SBP classroom in Region IX sits at a school without a division, so the division column sums to the regional 634.
Provinces and cities: Sulu, Zamboanga del Norte, Zamboanga del Sur, Zamboanga Sibugay, Zamboanga City and Isabela
The Philippine Standard Geographic Code (PSGC) places Region IX’s schools in four provinces and two cities that stand apart from them: the City of Zamboanga, a highly urbanized city, and the City of Isabela, on Basilan island, which stays in Region IX while the rest of Basilan is in BARMM. Sulu appears here as a province of Region IX. Component cities are counted inside their provinces: Dipolog and Dapitan in Zamboanga del Norte, Pagadian in Zamboanga del Sur.
| Province or city | Cities and municipalities | Schools | Classroom shortage (2023) | Shortage per 1,000 learners | SBP 2026 classrooms | Coverage |
|---|---|---|---|---|---|---|
| Sulu | 19 | 448 | 2,173 | 15.2 | 104 | 4.8% |
| City of Zamboanga | 1 | 216 | 2,032 | 8.5 | 55 | 2.7% |
| Zamboanga del Norte | 27 | 863 | 1,776 | 6.8 | 204 | 11.5% |
| Zamboanga del Sur | 27 | 888 | 1,330 | 5.6 | 127 | 9.6% |
| Zamboanga Sibugay | 16 | 506 | 1,307 | 8.2 | 107 | 8.2% |
| City of Isabela | 1 | 64 | 207 | 6.4 | 37 | 17.8% |
Sulu leads on count, rate and share of schools short, with 104 classrooms on the 2026 list for 2,173 short. Zamboanga del Norte, with Dipolog and Dapitan, has the most 2026 classrooms of any province or city, 204, for a shortage of 1,776. Zamboanga del Sur, with Pagadian, is short 1,330, and Pagadian City accounts for 586 of them. The City of Isabela has the highest coverage, 17.8%.
Among the region’s 91 cities and municipalities, the City of Zamboanga has by far the largest shortage, 2,032 classrooms, more than three times the next, the City of Pagadian. Five of the 10 largest are municipalities of Sulu: Jolo, Siasi, Talipao, Patikul and Indanan.
| City or municipality | Province or city | Income class | Schools | Classroom shortage (2023) | SBP 2026 classrooms | Coverage |
|---|---|---|---|---|---|---|
| City of Zamboanga | City of Zamboanga | 1st | 218 | 2,032 | 55 | 2.7% |
| City of Pagadian | Zamboanga del Sur | 1st | 82 | 586 | 31 | 5.3% |
| Jolo | Sulu | 1st | 33 | 336 | 36 | 10.7% |
| Siasi | Sulu | 1st | 54 | 216 | 0 | 0.0% |
| City of Isabela | City of Isabela | 3rd | 64 | 207 | 37 | 17.8% |
| Talipao | Sulu | 1st | 45 | 181 | 3 | 1.7% |
| City of Dapitan | Zamboanga del Norte | 2nd | 61 | 180 | 26 | 14.5% |
| Patikul | Sulu | 1st | 35 | 178 | 14 | 7.9% |
| Ipil | Zamboanga Sibugay | 1st | 35 | 174 | 6 | 3.5% |
| Indanan | Sulu | 1st | 34 | 168 | 3 | 1.8% |
Siasi, an island municipality of Sulu short 216 classrooms, has none on the 2026 list, and Talipao and Indanan, short 181 and 168, have three each. Across the region, 13 cities and municipalities with a shortage, 893 classrooms between them, have no SBP 2026 classroom; Siasi is the largest. Only one receives more classrooms than its shortage, by one classroom. Nationally, EDCOM II found that only 45.2% of the 332 LGUs with the largest estimated classroom shortages were also among the top recipients of planned classroom allocations (EDCOM II, 2026). The city figures follow the PSGC and the SBP masterlist’s own municipality, so they can differ slightly from the division of the same name; the City of Zamboanga counts 218 schools against the division’s 216, though its shortage and SBP figures are the same.
Schools with the largest classroom shortages in Region IX
Nine of the 10 schools with the largest shortages are in Zamboanga City, most of them national high schools; the other is Balangasan Central Elementary School in Pagadian City. Together they are short 659 classrooms, 7.5% of the region’s shortage. No Sulu school is among them: Sulu’s shortage is spread across many schools rather than piled into a few.
| School ID | School | Division | City or municipality | Learners (SY 2024-25) | Learners per classroom | Classroom shortage (2023) | SBP 2026 classrooms | Two or more shifts |
|---|---|---|---|---|---|---|---|---|
| 314801 | Talon-Talon NHS | Zamboanga City | City of Zamboanga | 6,746 | 86.5 | 96 | 0 | No |
| 303915 | Ayala NHS | Zamboanga City | City of Zamboanga | 6,919 | 70.6 | 77 | 0 | Yes |
| 303922 | Maria Clara L. Lobregat NHS | Zamboanga City | City of Zamboanga | 6,281 | 72.2 | 76 | 0 | Yes |
| 126082 | Balangasan Central Elementary School | Pagadian City | City of Pagadian | 2,377 | 82.0 | 65 | 0 | Yes |
| 126228 | Talon-Talon ES | Zamboanga City | City of Zamboanga | 6,712 | 51.6 | 61 | 0 | No |
| 126207 | Don Gregorio Evangelista MS | Zamboanga City | City of Zamboanga | 4,321 | 55.4 | 61 | 0 | No |
| 345869 | Baliwasan SHS - Stand Alone | Zamboanga City | City of Zamboanga | 3,072 | 66.8 | 61 | 0 | No |
| 303942 | Zamboanga NHS West | Zamboanga City | City of Zamboanga | 5,934 | 51.6 | 55 | 0 | No |
| 303933 | Southcom NHS | Zamboanga City | City of Zamboanga | 3,360 | 96.0 | 54 | 0 | Yes |
| 303930 | Sangali NHS | Zamboanga City | City of Zamboanga | 2,645 | 101.7 | 53 | 1 | Yes |
Talon-Talon NHS has the largest shortage in the region, 96 classrooms, for 6,746 learners, and Talon-Talon ES, which shares its name, is short 61. Every school in the table has more than 50 learners per classroom, and five of the 10 hold classes in shifts. Only Sangali NHS, with 101.7 learners per classroom, is on the SBP 2026 list, with one classroom. Three schools share fifth place at 61 classrooms, Talon-Talon ES, Don Gregorio Evangelista MS and Baliwasan SHS - Stand Alone; ties are broken by enrollment.
Taken over all 2,985 schools, the shortage is a little less concentrated than nationally. The 298 schools with the largest shortages, the top 10% of the region’s schools, hold 54.7% of it, against 66.0% nationally, and 197 schools short by 10 or more hold 45.4%. Half of the shortage sits in 244 schools, 8.2% of the total, and among schools with a shortage the median is 3.0 classrooms. Philippine Classroom Shortage 2023: Where the Gap Is explains these measures.
SBP 2026 classrooms in Region IX
The SBP 2026 list has 213 lines for Region IX, 634 classrooms at 209 schools, all funded under the General Appropriations Act (GAA) 2026 with PHP 2.07 billion. That is 2.0% of the national list, against the region’s 5.3% of the shortage. Figure 2 compares the two by division.
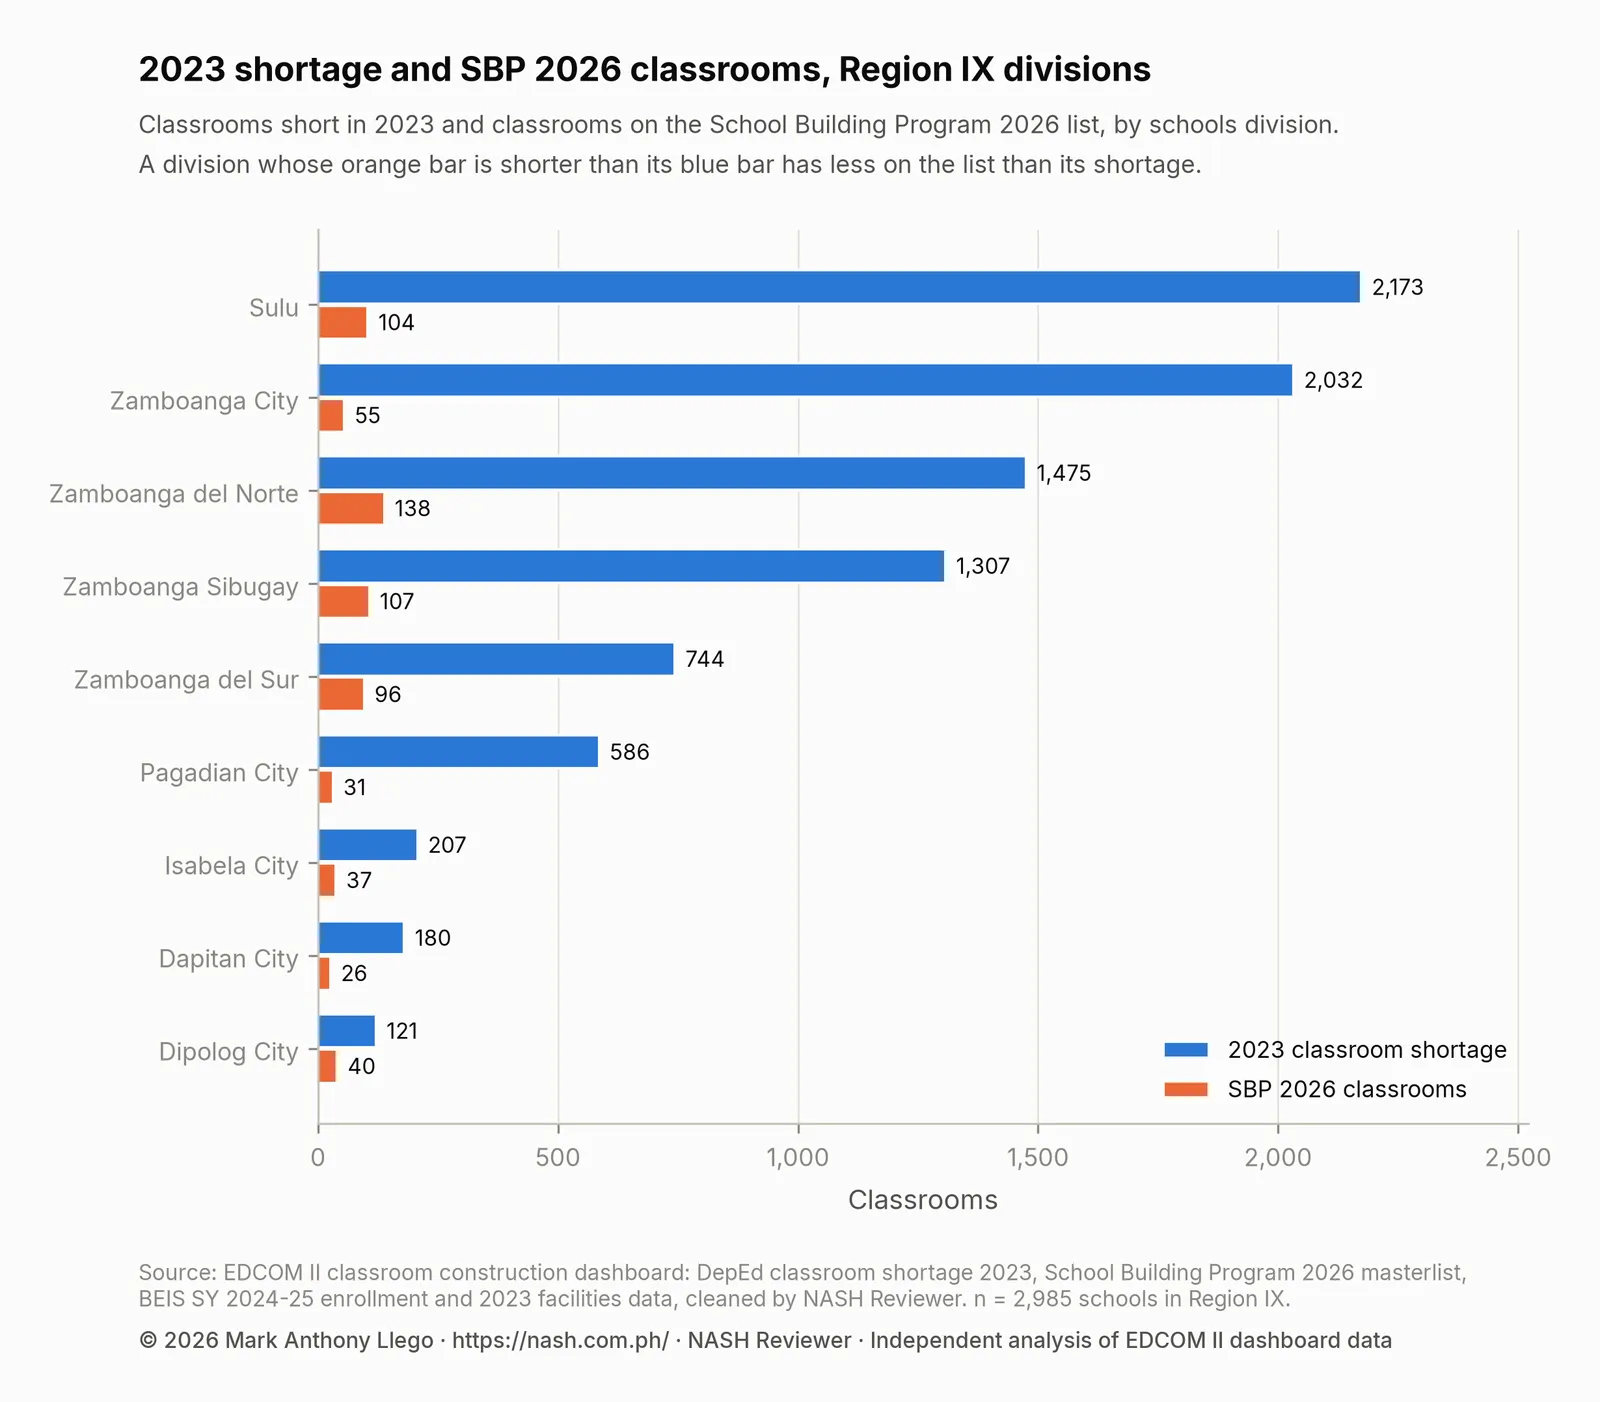
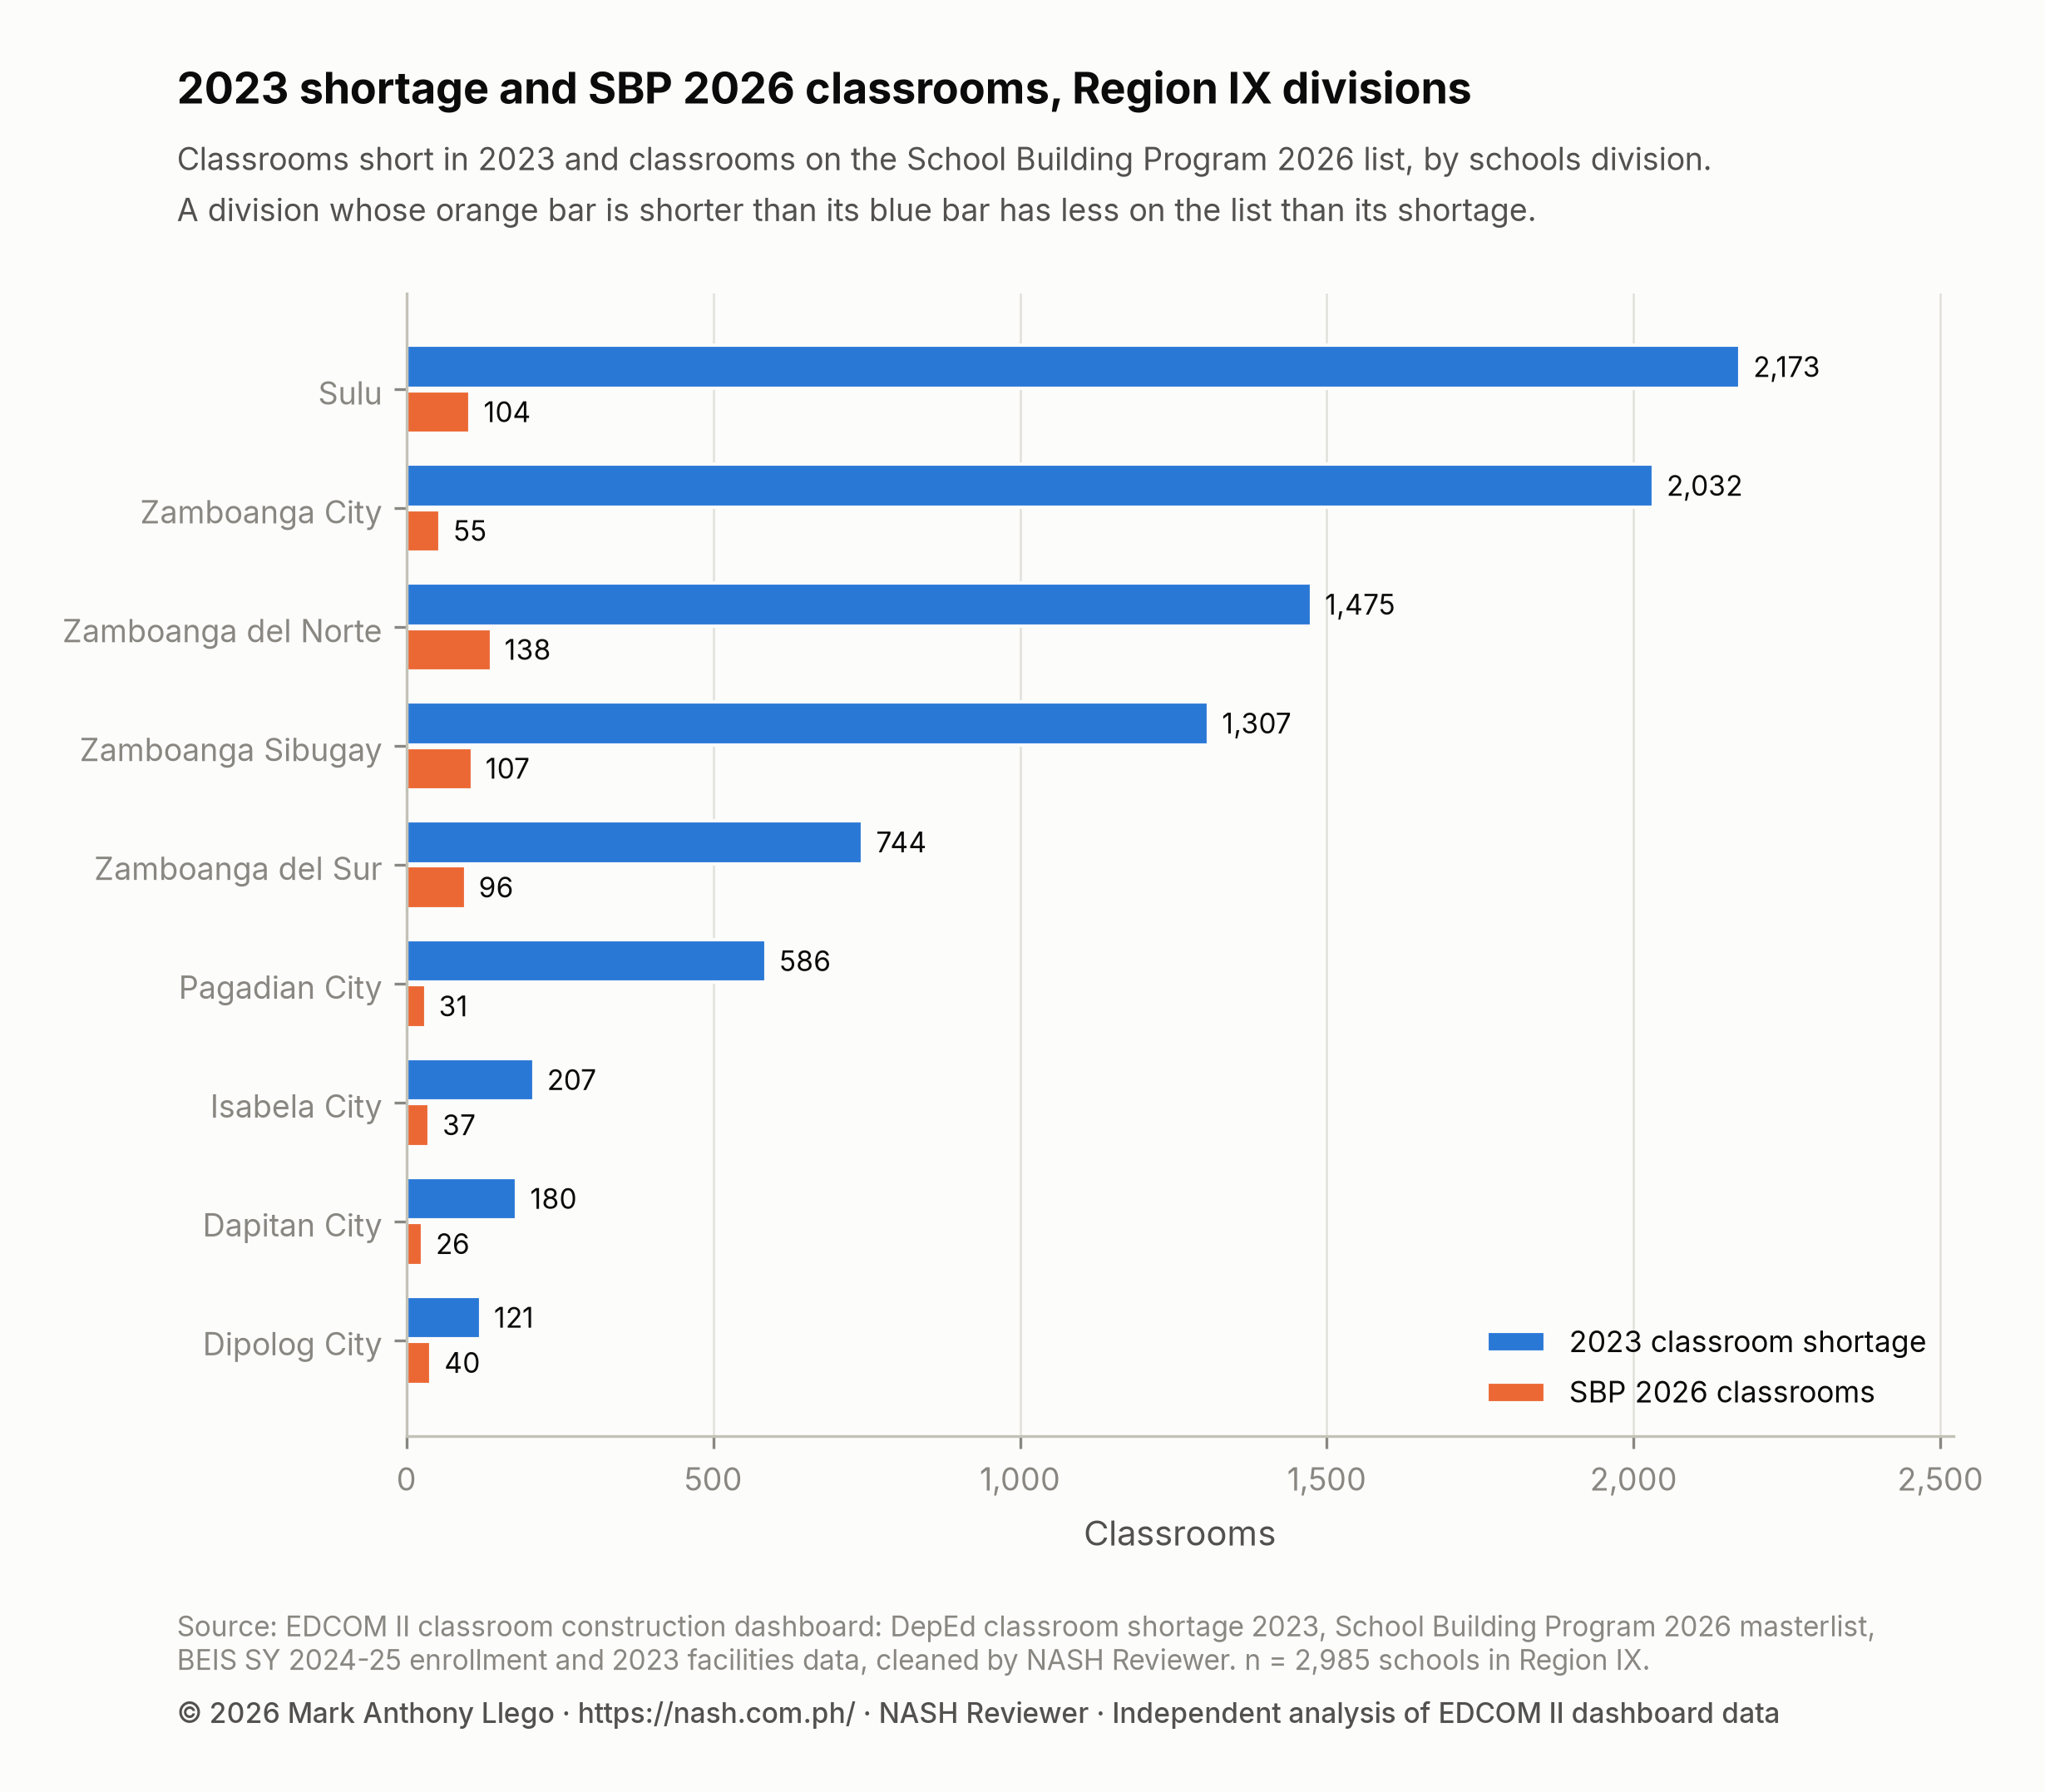
The two longest blue bars, Sulu and Zamboanga City, are matched by orange bars of 104 and 55 classrooms, 4.8% and 2.7% of their shortage. Zamboanga del Norte, the provincial division, has the most classrooms on the list, 138, for a shortage of 1,475.
| Modality group | Lines | Schools | Classrooms | Share of the region’s SBP classrooms |
|---|---|---|---|---|
| DPWH | 71 | 71 | 212 | 33.4% |
| LGU | 92 | 92 | 360 | 56.8% |
| DepEd | 50 | 50 | 62 | 9.8% |
| PSIP III (PPP) | 0 | 0 | 0 | 0.0% |
Local governments implement 360 of the region’s classrooms (56.8%), the Department of Public Works and Highways (DPWH) 212 (33.4%) and DepEd 62 (9.8%). The region has no PSIP III public-private partnership line, the modality that makes up half of the national list, 16,305 classrooms. DepEd School Building Program 2026 in Numbers explains the modalities and their budgets.
School by school, Region IX’s list is better aimed than the country’s but far too small. 428 of its 634 classrooms (67.5%) fall within the receiving school’s own 2023 shortage, against 53.0% nationally, and only 95 (15.0%) go to 33 schools with no 2023 shortage, against 23.0% nationally. But only 174 of the 1,798 schools with a shortage (9.7%) receive any classroom, and 25 of the 172 schools short by more than 10 (14.5%). Counted this way, the list meets 4.9% of the region’s shortage, against 10.4% nationally, and leaves 8,398 classrooms unmet. Do 2026 Classrooms Go Where the Shortage Is? explains the method.
Class shifts and crowded classrooms in Region IX
Shifts are not the region’s main pressure. In SY 2024-25, 40 of the region’s 3,010 schools in the enrollment data (1.3%) held classes in two shifts, none in three, with 61,927 learners, 5.7% of the region’s total. Of the 38 shifting schools in the shortage data, 81.6% had a shortage, and three (7.9%) receive SBP 2026 classrooms.
Crowding is the larger story, above all in the upper grades. The median school has 24.7 learners per classroom in elementary, 32.9 in junior high and 33.6 in senior high, against 24.9, 32.1 and 30.6 nationally; senior high is where Region IX is most crowded. 367 schools have more than 50 learners per classroom, with 24.0% of the learners counted, and bringing each down to 50 would take at least 1,608 classrooms. Class Shifts and Crowded Classrooms in DepEd Schools explains the measure.
The 2023 facilities data add 1,092 schools (36.6%) using makeshift rooms, against 29.0% nationally, and 682 schools (22.9%) with a building for condemnation or demolition, 1,403 buildings in all.
Last Mile Schools in Region IX
629 of the region’s schools (21.1%) are flagged as Last Mile Schools, schools in geographically isolated, disadvantaged and conflict-affected areas and hardship posts, a little above the national 18.5%. They hold 1,429 classrooms of shortage, 16.2% of the region’s, and more of them have a shortage than other schools, 66.6% against 58.5%.
Region IX’s Last Mile Schools are more than twice as likely as its other schools to be on the 2026 list, 11.9% against 5.6%, with 168 classrooms between them; nationally they are slightly less likely, 9.9% against 11.0%. Even so, 349 Last Mile Schools with a shortage, 1,163 classrooms in all, receive none. DepEd’s own Last Mile School modality has five lines with 17 classrooms in the region. Last Mile Schools: Classroom Need and 2026 Allocation compares them nationally.
What this means for school heads in Region IX
The region’s average mixes Sulu’s and Zamboanga City’s heavy shortages with lighter ones in Zamboanga del Sur and Dipolog. Read your own division and school first.
- Check your school’s record. Look your school up by ID in the school table, compare its 2023 shortage, learners per classroom and SBP 2026 lines with the division’s, and raise any error, a wrong ID, a missing annex, an old enrollment figure, with the division; the EDCOM II classroom data page links every file.
- In Sulu, use the division’s own figures. A Sulu school sits in a division short 15.2 classrooms per 1,000 learners, where 88.6% of schools have a shortage and the 2026 list covers 4.8% of it; those are the numbers to put in a request.
- In Zamboanga City, document crowding and shifts. The nine city schools in the region’s top 10 run from 51.6 to 101.7 learners per classroom, four of them in shifts, and the division’s list covers 2.7% of its shortage.
- Use rates where the count looks modest. Pagadian City is short 586 classrooms, fewer than the provincial divisions, but at 13.2 per 1,000 learners its rate is second only to Sulu’s.
- Bring in the LGU. Local governments implement 56.8% of the region’s 2026 classrooms, and 13 cities and municipalities with a shortage have none; a request to the division can go with one to the municipality.
- Put it in the plan. Cite the shortage, enrollment and crowding with their years in the school improvement plan, and track any SBP lines in the annual implementation plan.
How these numbers were made
The data are the cleaned tables behind the EDCOM II classroom construction dashboard: DepEd’s 2023 classroom shortage by school, the SBP 2026 masterlist, SY 2024-25 enrollment and class shifts from the Basic Education Information System (BEIS), 2023 school facilities, and school coordinates from the National School Building Inventory (NSBI) for SY 2022-23. How the EDCOM Classroom Data Was Cleaned documents every table and cleaning rule.
A school’s shortage is DepEd’s 2023 figure for Kindergarten to Grade 10 plus senior high school, counted only where the school lacks classrooms. The shortage per 1,000 learners divides the shortage of schools with SY 2024-25 learners by those learners and multiplies by 1,000. Learners per classroom divide SY 2024-25 learners by 2023 instructional classrooms. A division’s coverage is its SBP 2026 classrooms divided by its 2023 shortage. Classrooms within a school’s shortage are counted up to the size of that shortage, and any beyond it are counted as beyond. Regions follow the PSGC, with Sulu and the City of Isabela in Region IX and NIR separate from Regions VI and VII; divisions are DepEd’s schools divisions.
The analysis was done in Python with pandas, and the charts drawn with Matplotlib.
Limits
The sources span several years: the shortage and facilities are from 2023, enrollment and shifts from SY 2024-25, and the allocations from 2026, so a school’s figures may have changed since. Reports that still count Sulu under BARMM will show different totals for both regions. The SBP list shows planned classrooms, not finished ones. The shortage is DepEd’s own estimate, and new, merged or renumbered schools may be missing or counted under a new ID. These are descriptive figures: they show where the shortage and the 2026 classrooms are, not why.
Frequently asked questions
How big is the classroom shortage in Region IX?
DepEd’s 2023 data put the classroom shortage in Region IX (Zamboanga Peninsula) at 8,826 classrooms, 5.3% of the national shortage of 165,443. That is 8.2 classrooms per 1,000 learners, against 7.4 nationally, and 60.2% of the region’s public schools have a shortage.
Which division in Region IX has the biggest classroom shortage?
Sulu, by both measures: 2,173 classrooms, 24.6% of the region’s shortage, at 15.2 per 1,000 learners. Zamboanga City is close behind by count, 2,032, and Pagadian City is second by rate, 13.2.
How many classrooms will Region IX get under the SBP 2026?
The SBP 2026 masterlist has 634 classrooms for Region IX on 213 lines at 209 schools, funded under the GAA 2026 with PHP 2.07 billion. They equal 7.2% of the region’s 2023 shortage, against 19.6% nationally. The list records plans; a classroom on it is not yet a classroom built.
Which schools in Zamboanga City have the largest classroom shortages?
Talon-Talon NHS, short 96 classrooms, Ayala NHS (77) and Maria Clara L. Lobregat NHS (76) lead the city and the region, followed by Talon-Talon ES, Don Gregorio Evangelista MS and Baliwasan SHS - Stand Alone at 61 each. Of the nine Zamboanga City schools among the region’s 10 largest shortages, only Sangali NHS is on the SBP 2026 list, with one classroom.
Download the data and cite this post
The cleaned EDCOM II classroom data behind this series are free to download for personal study; to reuse them, email support@nash.com.ph for written permission first. How the EDCOM Classroom Data Was Cleaned explains every table and cleaning rule. The files are at data.nash.com.ph: start with the README, then the school table (Parquet, or CSV), the School Building Program lines (CSV), the city and municipality table (CSV), and every table for Stata and SPSS. Every regional figure in this report can be computed from the school table, filtered to Region IX by deped_region.
Every file, with its rows, columns and checksum, is listed on the EDCOM II classroom data page. To cite the data: Llego, M. A. (2026). EDCOM II classroom construction dashboard data, cleaned, version 1.1. NASH Reviewer. https://nash.com.ph/edcom-classroom-data
To cite this post: Llego, M. A. (2026, October 28). Classroom shortage in Region IX, 2023–2026: Sulu at the top. NASH Reviewer Blog. https://nash.com.ph/blog/classroom-shortage-region-9-zamboanga-peninsula
References
- Llego, M. A. (2026). EDCOM II classroom construction dashboard data, cleaned, version 1.1 [Data set]. NASH Reviewer. https://nash.com.ph/edcom-classroom-data
- Second Congressional Commission on Education (EDCOM II). (2026, October 20). Put classrooms where they’re needed most, EDCOM 2 tells DepEd [News release]. https://edcom2.gov.ph/put-classrooms-where-theyre-needed-most-edcom-2-tells-deped/
More in this series
- How the EDCOM Classroom Data Was Cleaned
- Philippine Classroom Shortage 2023: Where the Gap Is
- DepEd School Building Program 2026 in Numbers
- Do 2026 Classrooms Go Where the Shortage Is?
- Classroom Allocation by LGU Income Class, 2026
- Class Shifts and Crowded Classrooms in DepEd Schools
- Last Mile Schools: Classroom Need and 2026 Allocation
- Regional reports: NCR, CAR, Region I, Region II, Region III, Region IV-A, MIMAROPA, Region V, Region VI, NIR, Region VII, Region VIII, Region IX, Region X, Region XI, Region XII, Caraga, BARMM
- Rankings and deep dives: Congressional districts, Top 20 cities and municipalities, Rizal, Quezon City, City of Manila, Tawi-Tawi, Cavite, Cost of a classroom
- Explainers: PSIP III, Senior high shortage, Junior high shortage, Excess classrooms, Learning Continuity Spaces, How learners reach school
- For teachers and school heads: Action research and thesis topics
- Related: CRLA Results SY 2025-26 in Region IX: Sulu and Its Hotspots, How to Read DepEd Data: A Guide for Aspiring School Heads, DepEd School Improvement Plan (SIP): Steps, AIP and SRC, DepEd Classroom and School Building Data, SY 2023-2024
Analysis and charts by Mark Anthony Llego for NASH Reviewer. Data: EDCOM II classroom construction dashboard and Department of Education data. NASH Reviewer is not affiliated with EDCOM II or DepEd. Charts may be reused only with written permission from support@nash.com.ph.