Poorer municipalities were less likely to receive classrooms under DepEd’s School Building Program (SBP) 2026. Of the 65 fifth-class municipalities, the lowest income class, 37 (56.9%) have at least one classroom in the SBP masterlist, against 633 of 694 first-class municipalities (91.2%). The Second Congressional Commission on Education (EDCOM II) reported 55% against 91%.
The gap follows size more than income. Fifth-class municipalities have a median of 1,979 learners and 10 public schools, against 12,624 learners and 32 schools in first class. When municipalities of the same size, shortage rate and region are compared, the data show no clear difference by income class, while each doubling of enrollment multiplies the odds of receiving any classroom by 2.87.
The data are the cleaned tables behind the EDCOM II classroom construction dashboard (DepEd’s 2023 classroom shortage, the SBP 2026 masterlist and SY 2024-25 enrollment) for 1,642 cities and municipalities. The post is written for teachers and school heads, especially in small municipalities, who want to know how 2026 classrooms were spread and what to bring to their LGU and division.
Key findings
- Of the 65 fifth-class municipalities, 37 (56.9%) have at least one SBP 2026 classroom, against 633 of 694 first-class ones (91.2%), close to EDCOM II’s 55% and 91%.
- The share falls across the five classes (91.2%, 79.7%, 75.5%, 72.4%, 56.9%), a clear downward trend (Cochran-Armitage z = -9.25, p < 0.001).
- The 28 fifth-class municipalities with none share a 2023 shortage of 356 classrooms, the same figure EDCOM II reports; none of the eight Special Geographic Area municipalities (shortage 502) received any.
- With size, shortage rate and region held equal, no income class differs clearly from first class, while each doubling of enrollment multiplies the odds of an allocation by 2.87 (95% interval 2.05 to 4.02).
- Only 21 of 97 BARMM municipalities (21.6%) received any, but without BARMM the gap remains: 93.0% of first-class against 60.7% of fifth-class municipalities.
- SBP classrooms cover a similar share of the 2023 shortage in every class (17.8% to 21.3%; 18.5% in fifth class).
- Local governments implement 63.7% of fifth-class SBP classrooms; the third Public-Private Partnership for School Infrastructure Project (PSIP III) accounts for 54.5% in first-class LGUs and 2.5% in fifth-class ones.
Municipalities with 2026 classrooms, by LGU income class
An LGU’s income class, set by the Department of Finance, groups provinces, cities and municipalities by their average annual income: first class has the highest, fifth class the lowest. It measures the local government’s revenue, not its residents’ poverty. It also tracks size, since a municipality’s share of national taxes grows with its population and land area. Cities and municipalities are classed on separate scales, and the eight municipalities of BARMM’s Special Geographic Area (SGA) have no income class.
The comparison covers municipalities only, because nearly every city received classrooms: 99.3% of the 149 cities, against 82.2% of municipalities. A municipality counts as receiving classrooms when at least one of its public schools has a line in the SBP 2026 masterlist, whether funded or still for bidding.
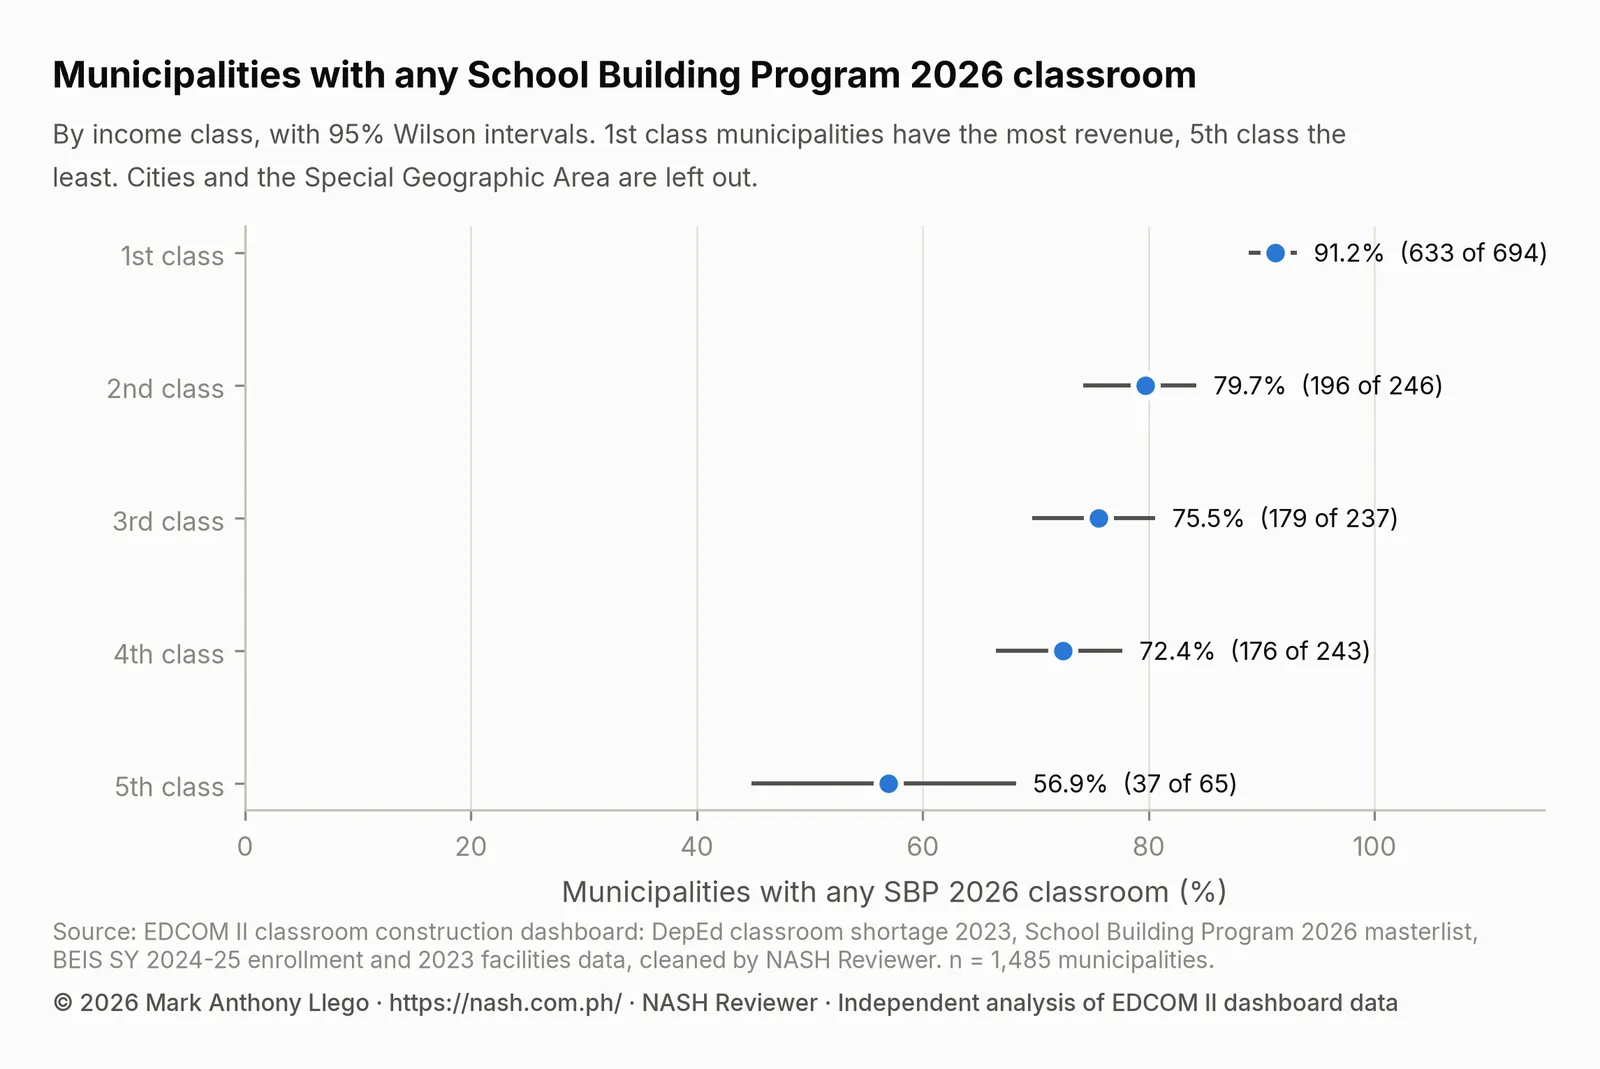
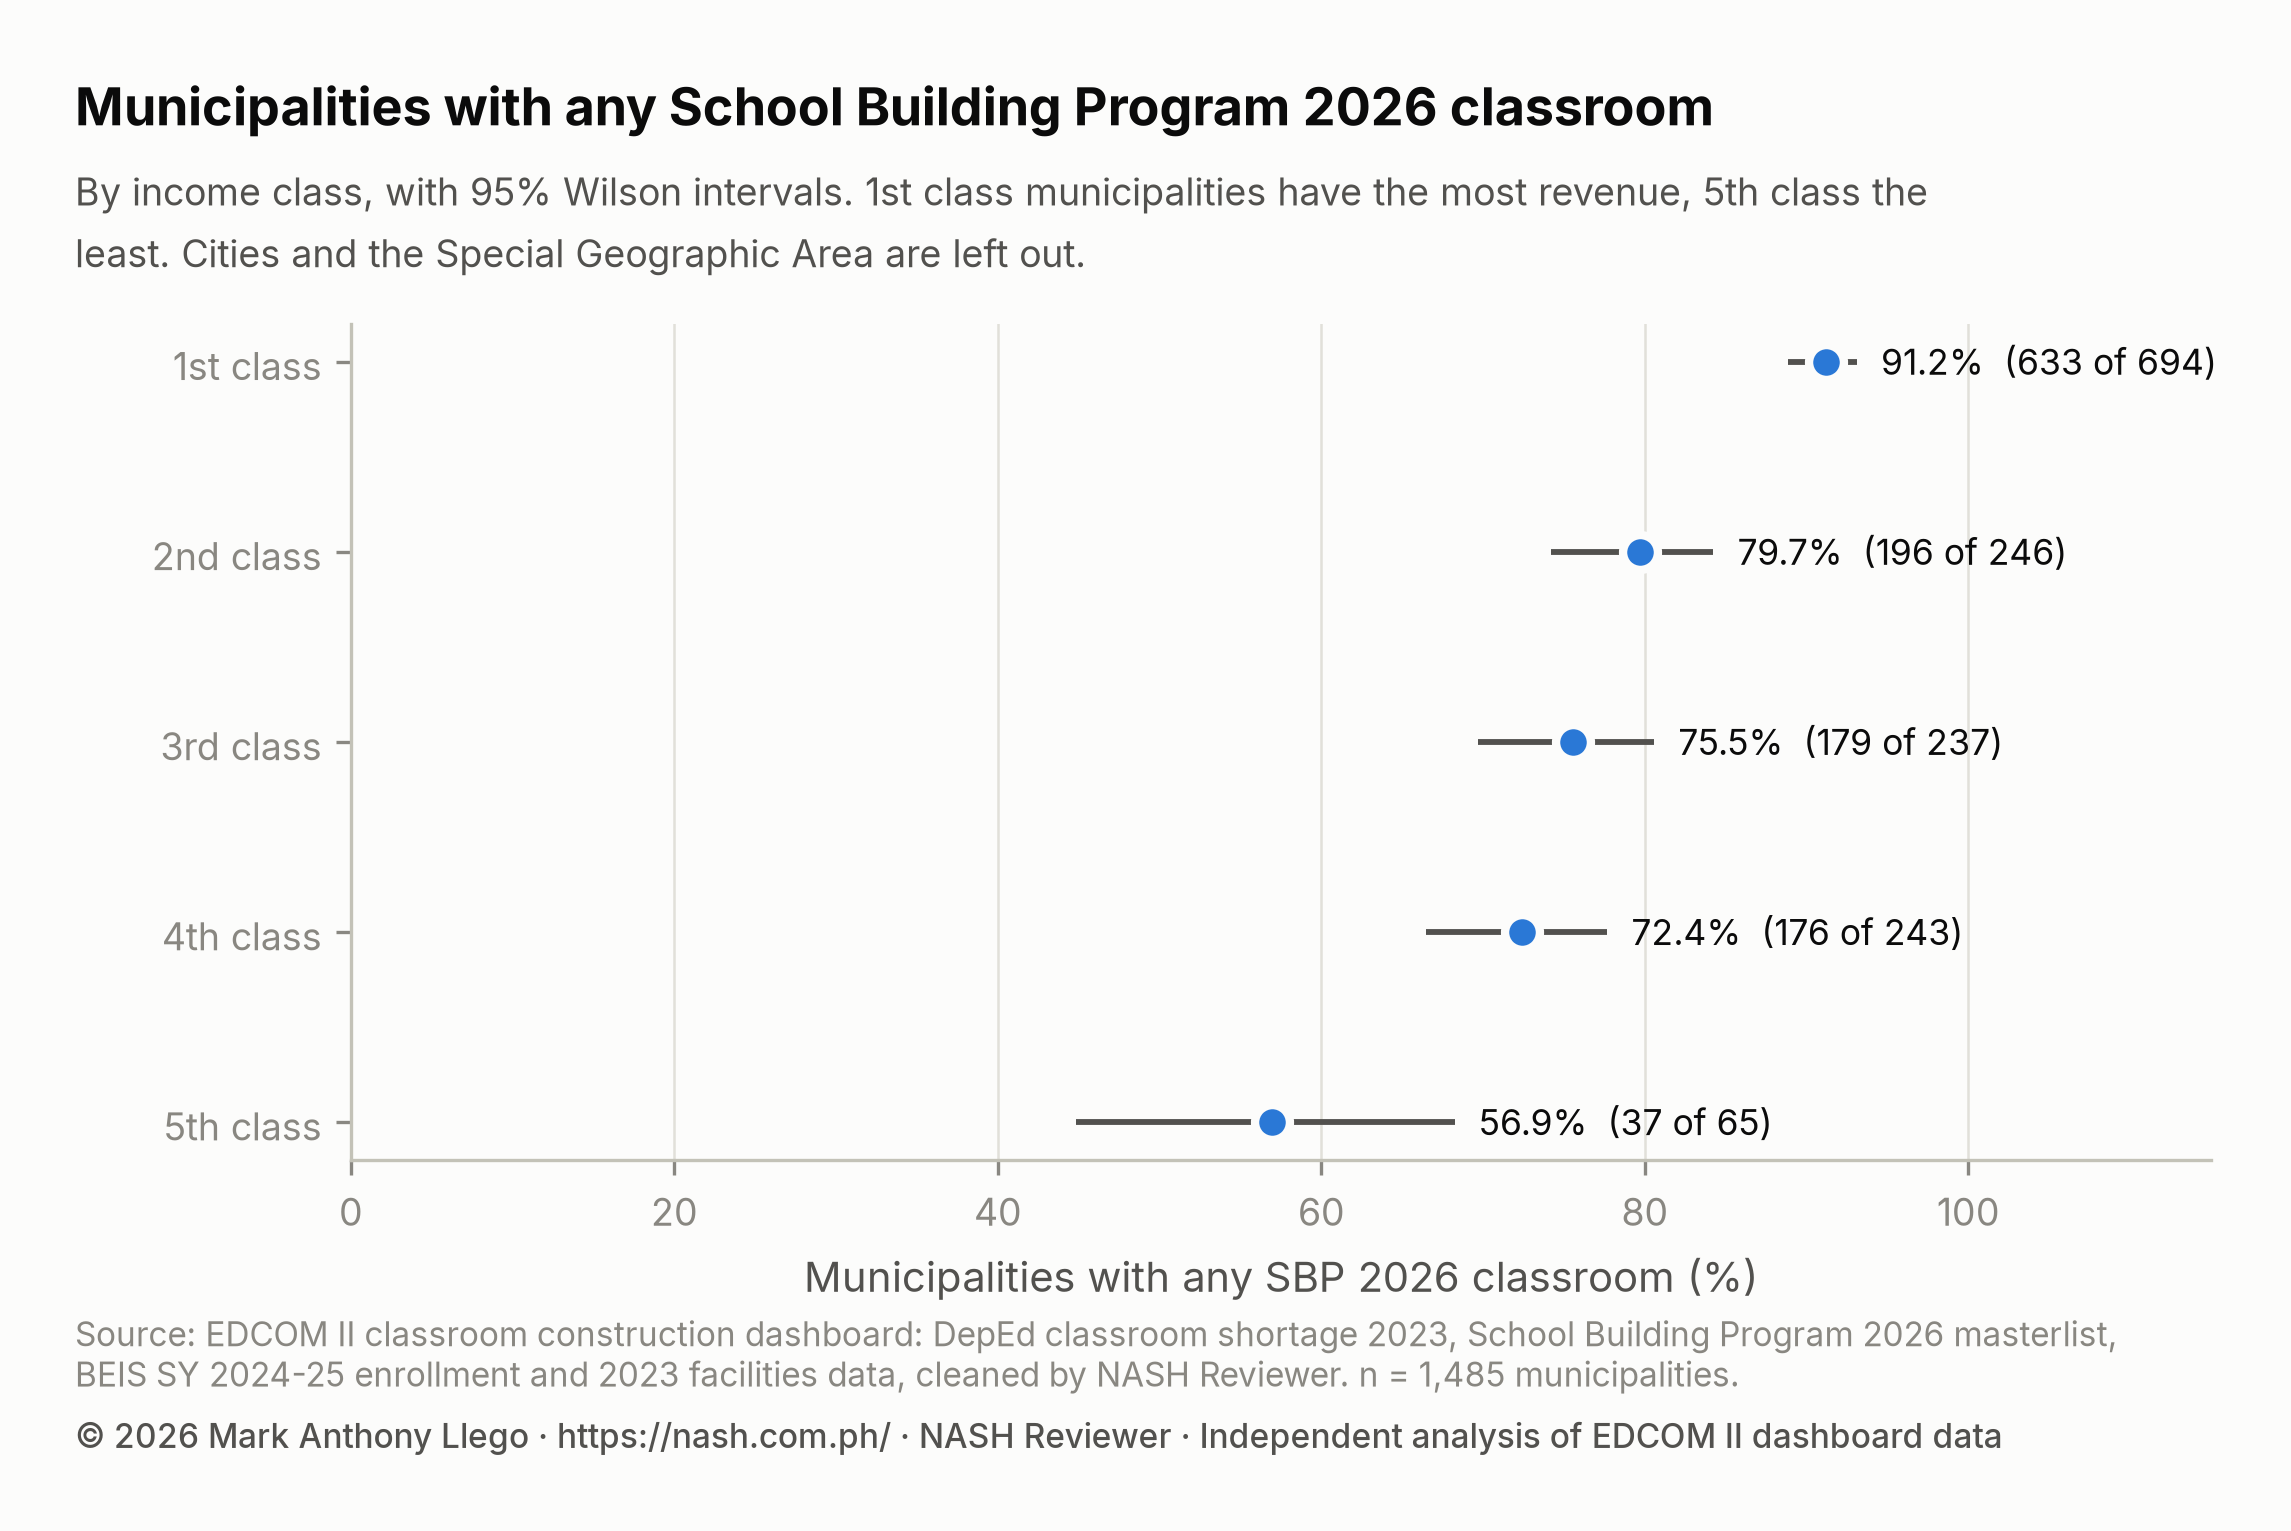
The line around each dot is a 95% Wilson interval (Wilson, 1927), the range of shares consistent with the data. The fifth-class interval, 44.8% to 68.2%, is the widest because the class has only 65 municipalities. It contains EDCOM II’s 55% and lies wholly below the intervals of the first three classes.
The Cochran-Armitage test for trend (Cochran, 1954; Armitage, 1955) checks whether the fall is steady rather than chance: it compares each class’s count of municipalities with classrooms with the count expected if all classes had the same share, weighting classes by their order. Its z statistic is -9.25 (p < 0.001); a z near zero would mean no trend, and a large negative z means a steady fall from first to fifth class.
EDCOM II’s 20 October 2026 news release, Put classrooms where they’re needed most, EDCOM 2 tells DepEd, compared DepEd’s School Building Plan 2026 as of 20 August 2026 with the 2023 classroom backlog and found that only 55% of fifth-class municipalities received allocations, against 91% of first-class ones.
Municipalities with no 2026 classrooms: fifth class, SGA and BARMM
| Income class (municipalities) | LGUs | With SBP 2026 classrooms | Share with any (95% interval) | With none | Shortage in LGUs with none | Shortage per 1,000 learners |
|---|---|---|---|---|---|---|
| 1st class | 694 | 633 | 91.2% (88.9% to 93.1%) | 61 | 4,195 | 6.5 |
| 2nd class | 246 | 196 | 79.7% (74.2% to 84.2%) | 50 | 3,061 | 6.2 |
| 3rd class | 237 | 179 | 75.5% (69.7% to 80.6%) | 58 | 2,729 | 6.4 |
| 4th class | 243 | 176 | 72.4% (66.5% to 77.7%) | 67 | 2,501 | 6.4 |
| 5th class | 65 | 37 | 56.9% (44.8% to 68.2%) | 28 | 356 | 6.6 |
Of the 65 fifth-class municipalities, 28 have no SBP 2026 classroom, with a combined 2023 shortage of 356 classrooms: the same 356 that EDCOM II reports for its 30 of 66. The counts differ slightly, likely because LGU lists or classifications differ. EDCOM II places six of its 30 in BARMM, among them the SGA municipalities of Old Kaabakan and Pahamuddin.
Municipalities with none exist in every class: 61 in first class, with a shortage of 4,195 classrooms, and 67 in fourth class, with 2,501. Relative to learners, need is about equal across classes: 6.5 classrooms short per 1,000 learners in first class, 6.6 in fifth, and 6.2 to 6.4 in between. Fifth-class towns have less shortage in total because they have fewer learners.
None of the eight SGA municipalities received a classroom: Kadayangan, Kapalawan, Ligawasan, Malidegao, Nabalawag, Old Kaabakan, Pahamuddin and Tugunan, with a combined shortage of 502 classrooms.
In BARMM, only 21 of 97 municipalities (21.6%, not counting the SGA) received any: 8 of 22 in first class, 5 of 27 in second, 7 of 22 in third, 1 of 22 in fourth and 0 of 4 in fifth. Sulu is counted in Region IX, where its schools division moved from BARMM on 20 October 2026. BARMM is not the whole story. Without it, the shares from first to fifth class are 93.0%, 87.2%, 80.0%, 79.2% and 60.7%, so the gap narrows only slightly.
EDCOM II’s 13 November 2025 news release on education laws in BARMM noted that the Bangsamoro Organic Law (RA 11054), Article VI, Section 13, says national programs and projects such as the School Building Program “shall continue to be funded by the National Government”, and that some national programs pulled back from BARMM after the law because of unclear interpretation. These data cannot show why.
Why the gap: municipality size, not income class
Median enrollment and school counts fall with income class: 12,624 learners and 32 public schools in first class, 7,583 and 24 in second, 5,661 and 20 in third, 3,680 and 15 in fourth, and 1,979 and 10 in fifth. One plain reason size could matter: a municipality counts as receiving classrooms when any of its schools is on the list, and a town with ten schools has fewer chances than one with thirty.
To separate income from size, a logistic regression (Hosmer et al., 2013) estimates how the odds of receiving any classroom (the chance of receiving divided by the chance of not) change with each factor while the others are held fixed. An odds ratio above 1 means higher odds (for an income class, than first class) and below 1 lower odds; an interval crossing 1 means the data cannot tell the direction.
The model holds equal the 2023 shortage per 1,000 learners, SY 2024-25 enrollment (per doubling) and the region. Region fixed effects compare each municipality only with others in its own region, since regions differ widely in how many municipalities received classrooms. Standard errors are clustered by province (Cameron & Miller, 2015), allowing for municipalities in the same province to be alike in unmeasured ways.
| Term | Odds ratio (95% interval) | p-value |
|---|---|---|
| 2nd class (vs 1st) | 1.01 (0.55 to 1.86) | p = 0.973 |
| 3rd class (vs 1st) | 1.08 (0.61 to 1.89) | p = 0.795 |
| 4th class (vs 1st) | 1.66 (0.74 to 3.69) | p = 0.217 |
| 5th class (vs 1st) | 2.13 (0.72 to 6.33) | p = 0.172 |
| Shortage per 1,000 learners (per classroom) | 1.03 (0.98 to 1.08) | p = 0.278 |
| Learners (per doubling of enrollment) | 2.87 (2.05 to 4.02) | p < 0.001 |
With size, shortage and region held equal, no income class differs clearly from first class: the odds ratios for second to fifth class are 1.01, 1.08, 1.66 and 2.13, and all four intervals cross 1. The fifth-class interval is wide because the class is small. Each doubling of enrollment multiplies the odds by 2.87 (2.05 to 4.02, p < 0.001). Within a region, a higher shortage per 1,000 learners does not clearly raise the odds (1.03, 0.98 to 1.08).
For a municipality of typical size and need, with 7,268 learners and a shortage of 5.0 classrooms per 1,000 learners, the predicted chance of receiving any classroom, averaged across the model’s municipalities and their regions, is 82.3% in first class, 82.4% in second, 83.1% in third, 87.1% in fourth and 89.0% in fifth: close, and within the model’s uncertainty.
NCR and Region V (108 municipalities) are left out of the model because every municipality in them received classrooms. A model that compares municipalities within a region learns nothing from a region with no differences inside it, and that region’s term would grow without limit. The model uses the other 1,377 municipalities.
Region matters too. Without the region terms, the same model gives fifth-class municipalities an odds ratio of 0.55: lower odds than first-class towns of the same size and shortage rate. That the difference fades only when towns are compared within their own regions suggests fifth-class municipalities are more often in regions where fewer municipalities received classrooms.
Classroom coverage by income class
Coverage asks how much of the shortage the classrooms meet: SBP 2026 classrooms divided by the 2023 shortage. Because some classrooms go to schools with a smaller shortage than their allocation, or none, the chart also shows the shortage met within schools, which counts no classroom beyond a school’s own shortage.
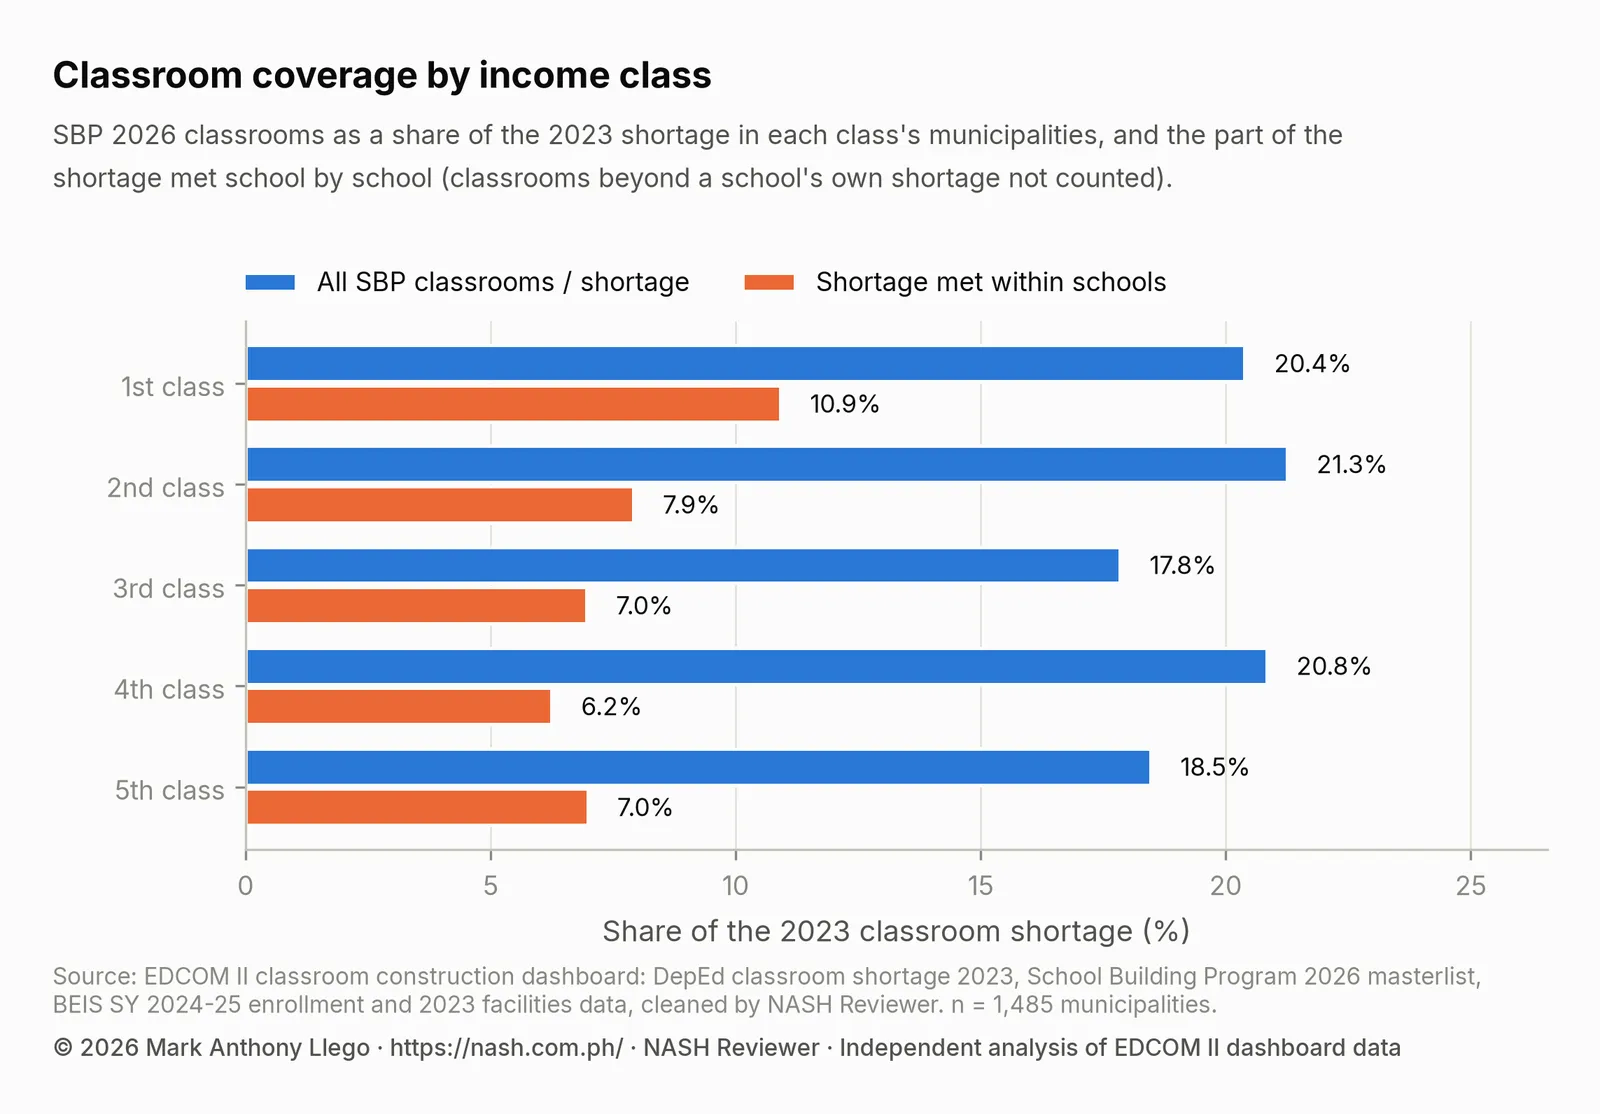
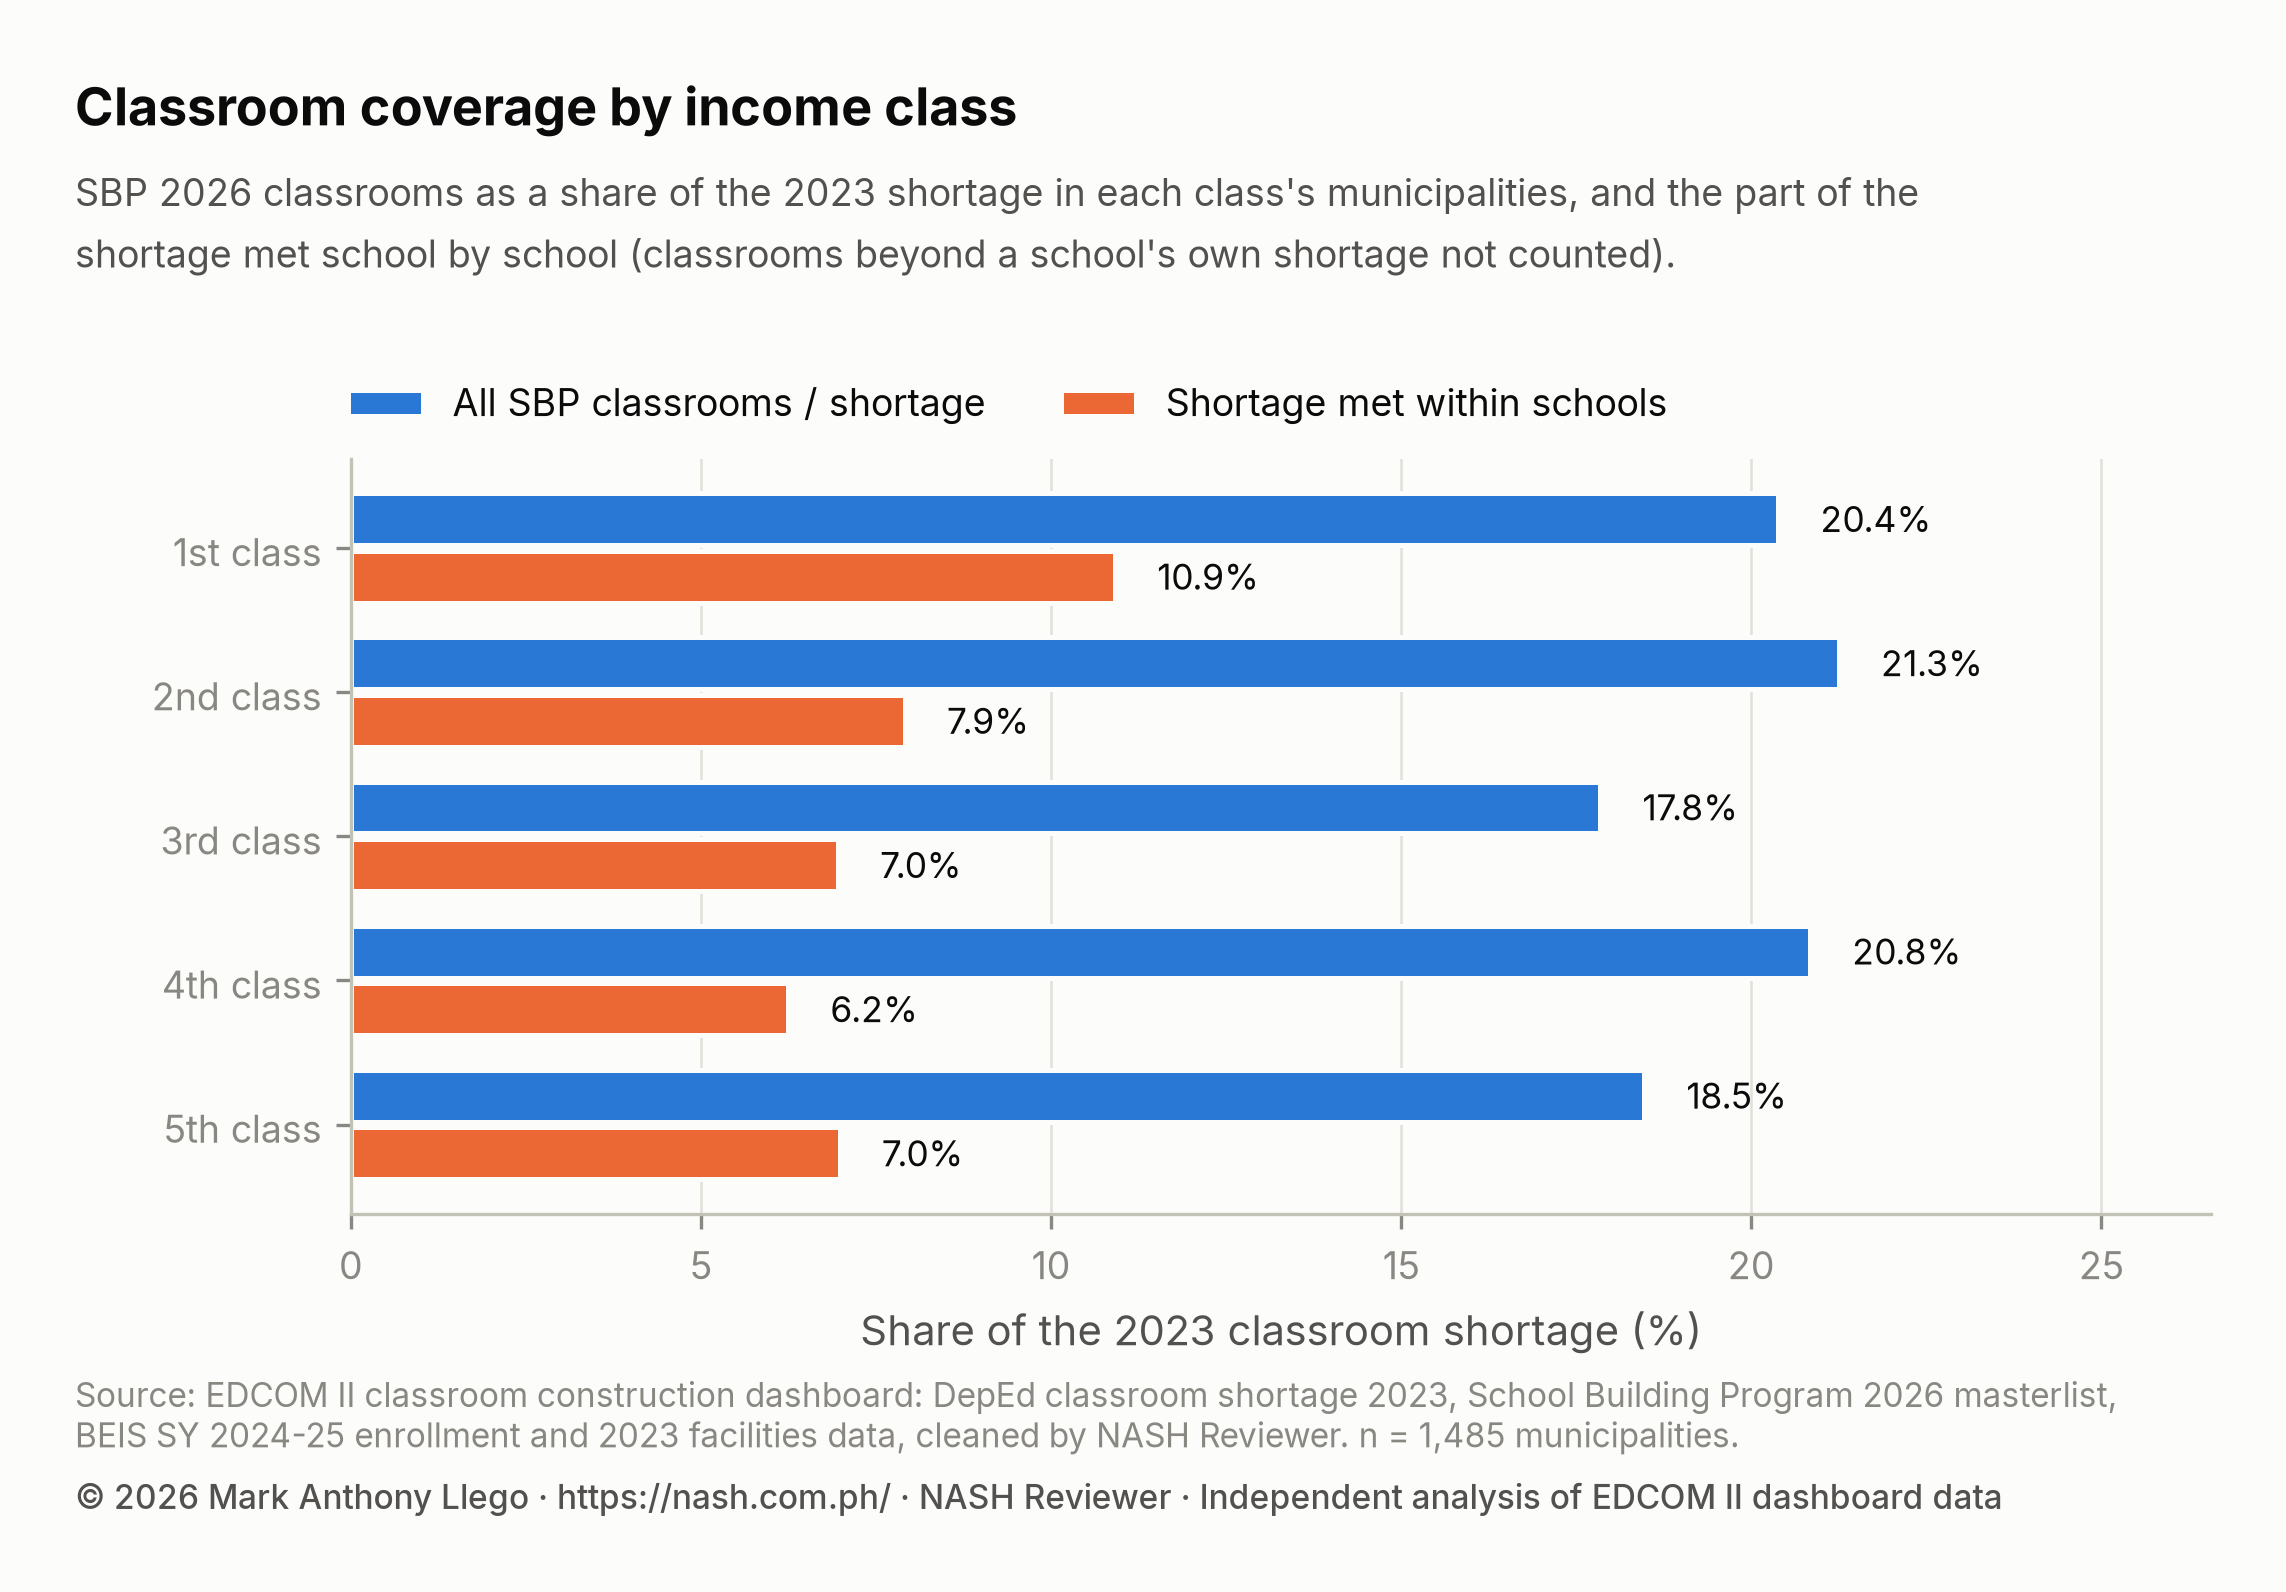
Coverage does not fall steadily with income class: 20.4% in first class, 21.3% in second, 17.8% in third, 20.8% in fourth and 18.5% in fifth, around the national 19.6%. The shortage met within schools is highest in first class, 11.8%, and between 6.2% and 7.9% in the others, against 10.4% nationally, as Do 2026 Classrooms Go Where the Shortage Is? explains. Once a class’s towns are on the list, their classrooms meet a broadly similar share of need, though most of the 2023 shortage stays unmet in every class; the clearer difference is how many towns are on the list at all.
| Income class (municipalities) | 2023 classroom shortage | SBP 2026 classrooms | Coverage (SBP / shortage) | Shortage met within schools |
|---|---|---|---|---|
| 1st class | 64,567 | 13,163 | 20.4% | 10.9% |
| 2nd class | 11,236 | 2,388 | 21.3% | 7.9% |
| 3rd class | 8,305 | 1,482 | 17.8% | 7.0% |
| 4th class | 5,791 | 1,207 | 20.8% | 6.2% |
| 5th class | 850 | 157 | 18.5% | 7.0% |
Who builds the 2026 classrooms, by income class
SBP 2026 classrooms come through four implementing modalities: the Department of Public Works and Highways (DPWH); local governments (provincial, city and municipal, grouped as LGU); DepEd’s own Last Mile School buildings and Learning Continuity Spaces; and PSIP III, still for bidding, with construction expected from March 2027 to July 2028. The DPWH, LGU and DepEd lines are funded under the 2026 General Appropriations Act (GAA).
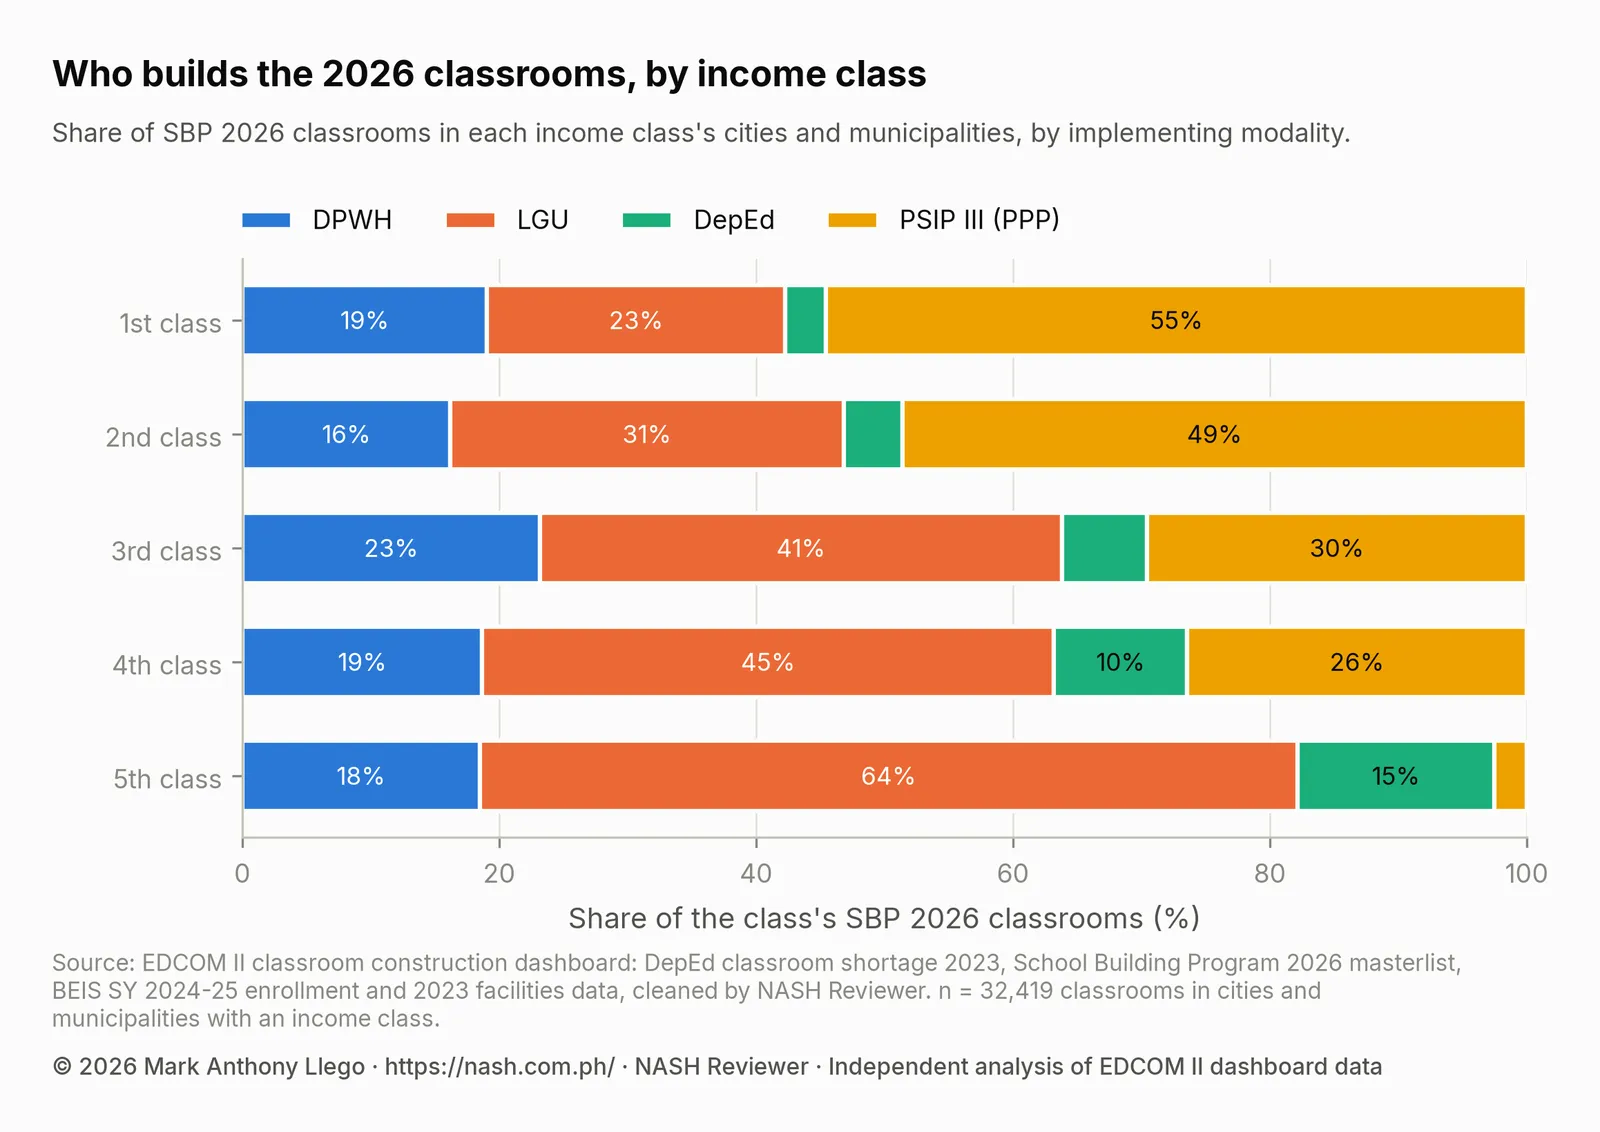
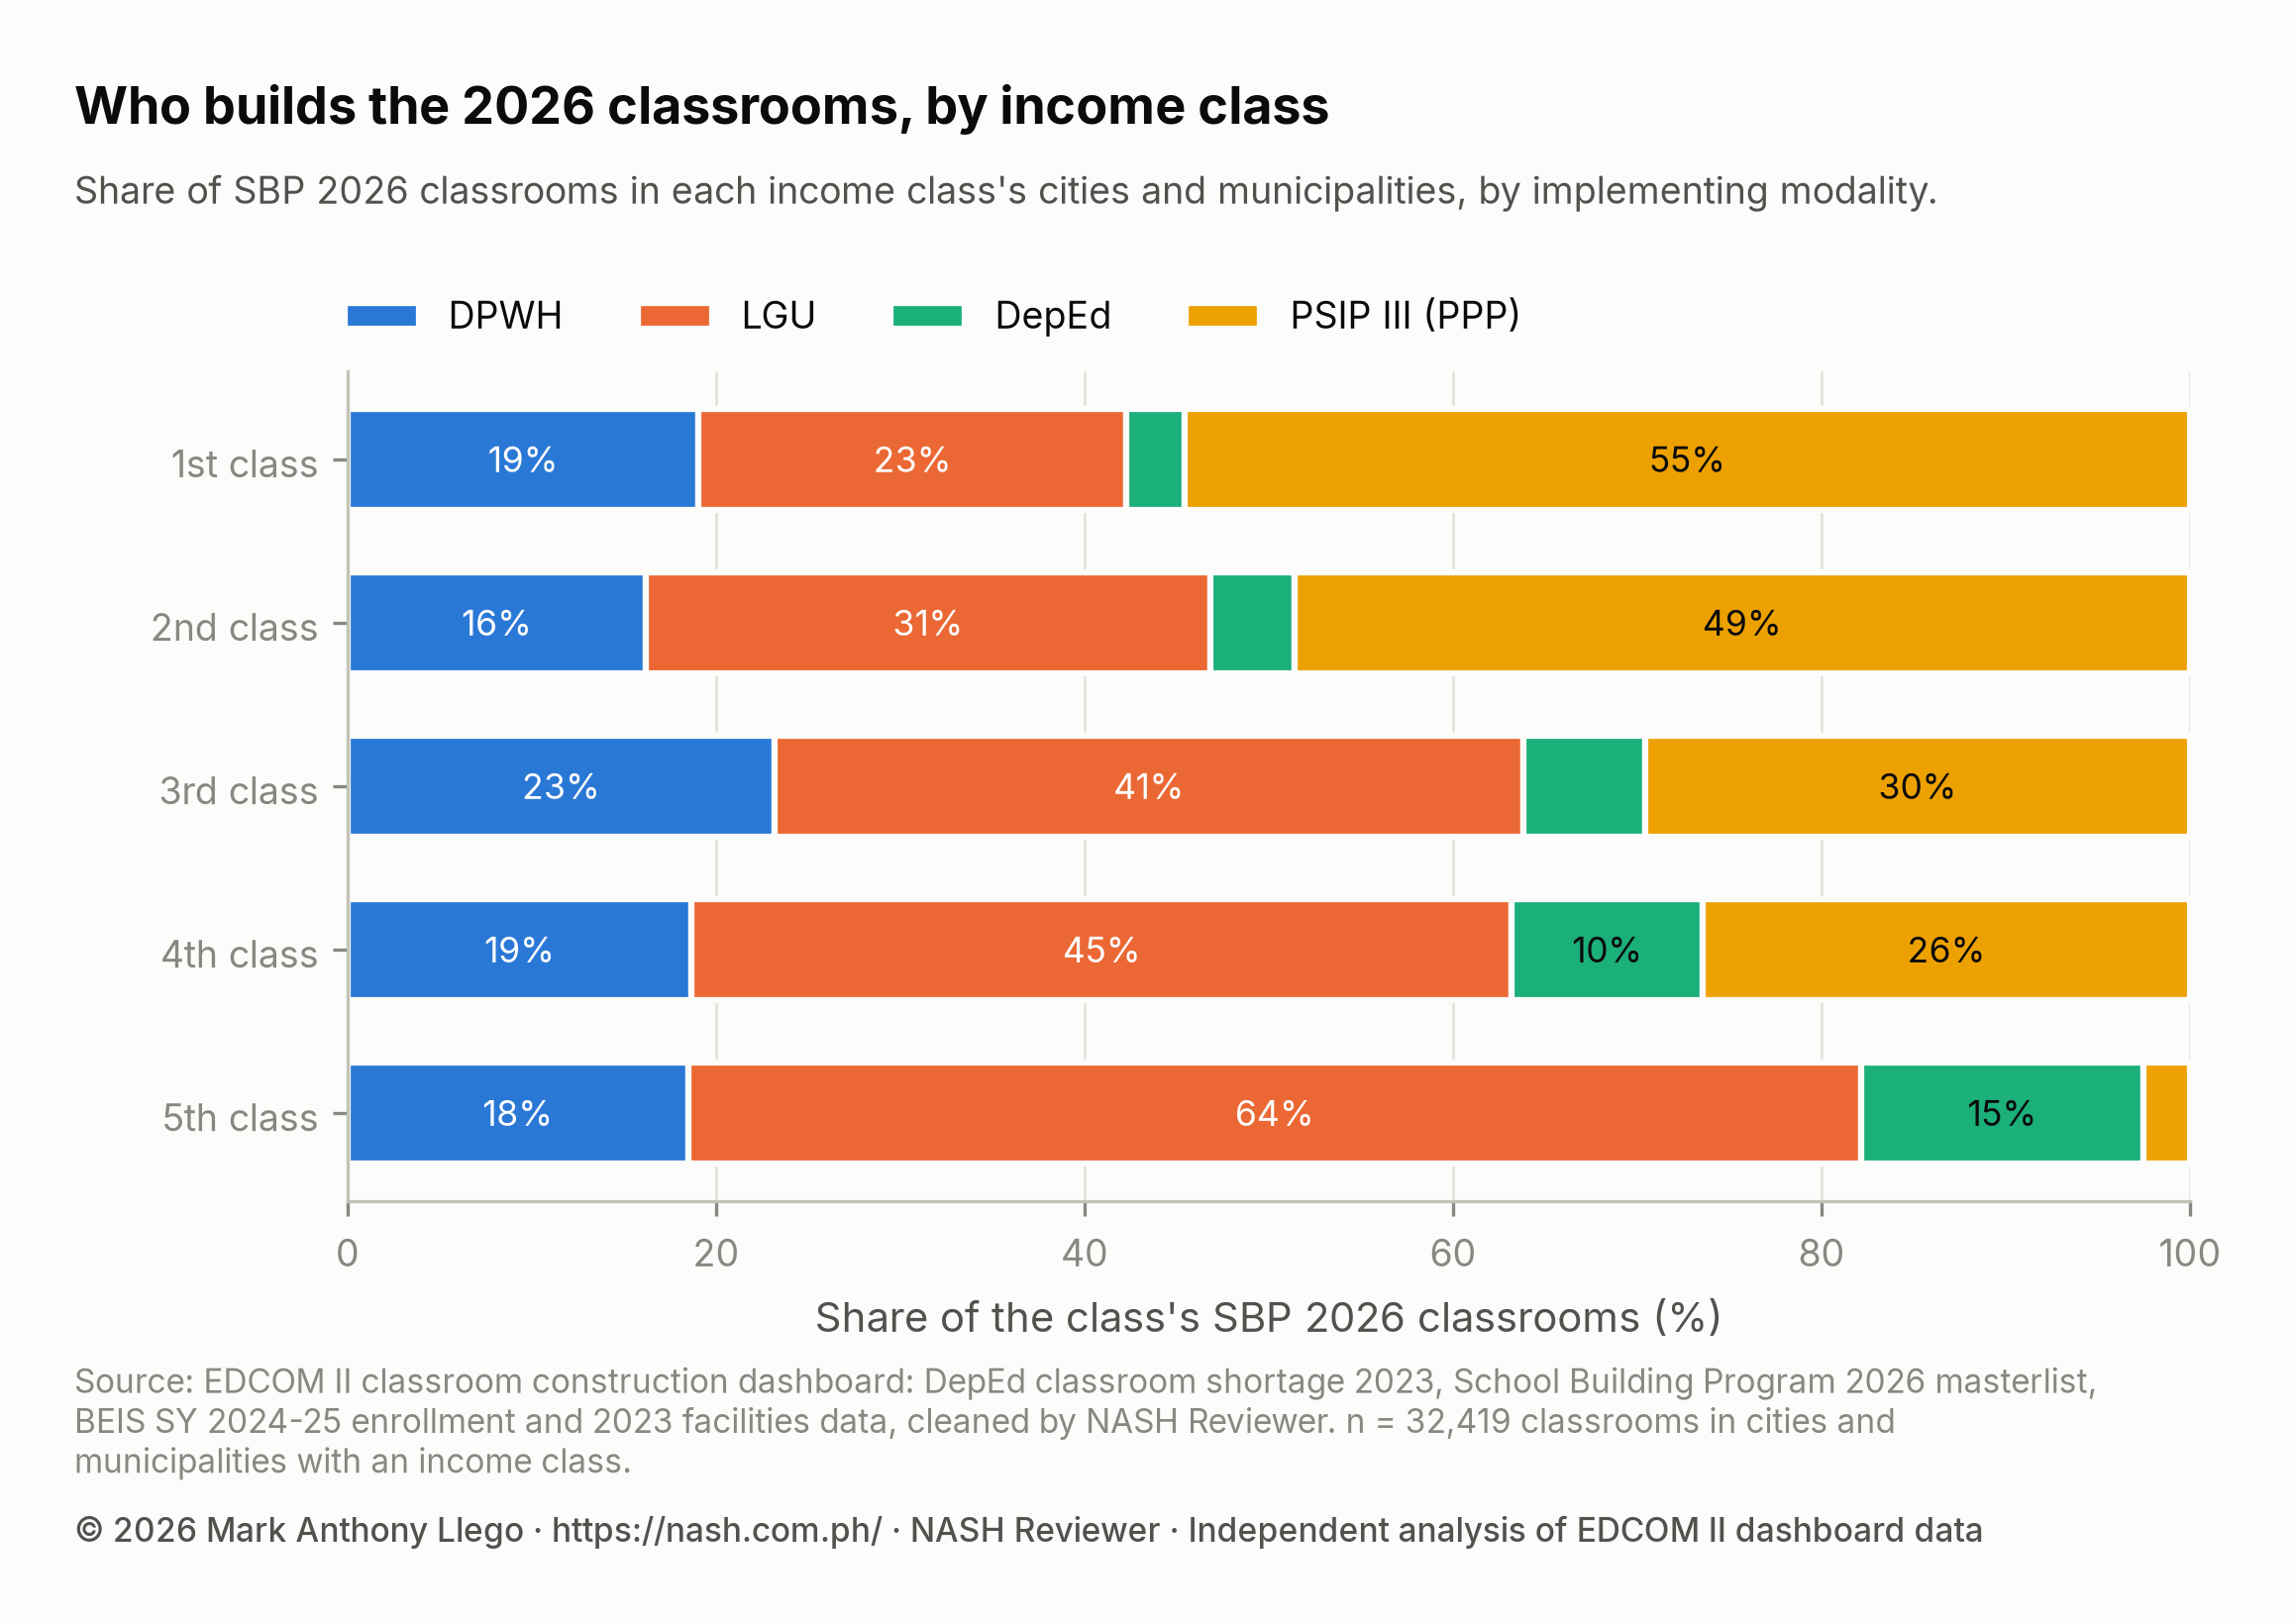
PSIP III’s share falls from 54.5% in first-class cities and municipalities to 48.6%, 29.6% and 26.4%, and to 2.5% in fifth class. LGU-implemented lines rise from 23.2% to 63.7%, and DepEd’s own lines from 3.2% to 15.3%, while DPWH stays between 16.2% and 23.2%. This table includes cities, so its first-class row counts 23,836 classrooms.
| Income class | DPWH | LGU | DepEd | PSIP III (PPP) | Classrooms |
|---|---|---|---|---|---|
| 1st class | 19.1% | 23.2% | 3.2% | 54.5% | 23,836 |
| 2nd class | 16.2% | 30.6% | 4.6% | 48.6% | 4,490 |
| 3rd class | 23.2% | 40.6% | 6.6% | 29.6% | 2,442 |
| 4th class | 18.7% | 44.5% | 10.4% | 26.4% | 1,494 |
| 5th class | 18.5% | 63.7% | 15.3% | 2.5% | 157 |
The table does not split the LGU column by level of government. Nationally, provincial governments implement 4,319 SBP classrooms, city governments 2,869 and municipal governments 1,477, as DepEd School Building Program 2026 in Numbers shows. PSIP III lines are large, with a median of 10.0 classrooms per line.
Implementing a line is not paying for it: the LGU lines are funded under the GAA. Still, income class goes with which channel reaches a town. EDCOM II’s National Education Plan 2026-2035 recommends a tiered counterparting mechanism for LGUs that considers their income classes, so that what a local government contributes would depend on its class (National Education Plan 2026-2035: Guide for School Heads). In fifth-class municipalities, where most 2026 classrooms come through LGU-implemented lines and almost none through PSIP III, such a mechanism would bear directly on them.
What this means for school heads and teachers
- Check your school and municipality in the data. In the school table (links below), read your school’s
shortage_total,sbp_classroomsandsbp_modalities, and in the city and municipality table, your LGU’slgu_income_class. How to Read DepEd Data: A Guide for Aspiring School Heads explains how to read them. - Write the need into the SIP and AIP. Record enrollment, instructional rooms, DepEd’s shortage count, class shifts, makeshift rooms and building condition, each with its source and year, as DepEd School Improvement Plan (SIP): Steps, AIP and SRC describes.
- Bring the figures to the Local School Board. The board decides how the municipality’s Special Education Fund is spent, and building and repairing classrooms are among its uses. In a low-income municipality the fund is often small, so ask early and be specific. Local School Boards and the Special Education Fund covers how SEF income differs by municipal income class and how to ask the board for support.
- Talk to the provincial government. Provincial governments implement the most LGU-built SBP classrooms nationally. Through the division, ask how schools are chosen for provincially implemented lines.
- Work with the division engineer. The engineer knows the facilities data behind the shortage estimate and what a building project requires, such as a documented school site. Ask what your school should have ready.
- Keep expectations honest. These data show that small towns appear on the list less often, not how schools are chosen, and no step above guarantees an allocation. Brigada Eskwela keeps existing rooms usable but cannot replace a missing classroom.
How these numbers were made
The data are the cleaned tables behind the EDCOM II classroom construction dashboard (How the EDCOM Classroom Data Was Cleaned): 1,642 LGUs, of which 1,485 are municipalities, 149 cities and 8 SGA municipalities. DepEd’s source tables type the City of Manila as a municipality; it is counted as a city here. Each LGU’s figures add up its public schools’ 2023 shortage, SY 2024-25 enrollment and SBP 2026 classrooms, including Learning Continuity Spaces, which the dashboard counts as classrooms. LGU type and income class come from DepEd’s 2023 shortage table.
The Wilson interval (Wilson, 1927) stays reliable for small groups and for extreme shares. The Cochran-Armitage statistic scores the classes 0 to 4 from first to fifth, sums each score times the class’s observed minus expected count with an allocation (expected under one common share), and divides by the standard error of that sum; it is compared with the standard normal distribution, two-sided.
Coverage is SBP 2026 classrooms divided by the 2023 shortage. The shortage met within schools adds up, across the schools in the 2023 shortage table, the smaller of each school’s SBP classrooms and its shortage, and divides the sum by the total shortage. The shortage per 1,000 learners divides the shortage by SY 2024-25 enrollment.
The model is a logistic regression on 1,377 municipalities (NCR and Region V left out). The outcome is 1 for any SBP 2026 classroom and 0 otherwise; the predictors are income class (first class as reference), the shortage per 1,000 learners, the base-2 logarithm of enrollment and region indicators; standard errors are clustered by province. Predicted probabilities keep each municipality’s region, set its class to each class in turn and its shortage rate and enrollment to the medians (5.0 and 7,268), and average the predictions. Without region terms (heteroskedasticity-robust standard errors), the fifth-class odds ratio is 0.55 and the shortage-rate odds ratio 0.91.
The modality mix assigns each SBP line to its LGU’s income class; all 32,419 SBP classrooms fall in an LGU with one. The analysis was done in Python with pandas, statsmodels and SciPy.
Limits
The years differ by source: shortage 2023, enrollment SY 2024-25, allocations 2026. The income class is as recorded in 2023; a municipality reclassified since may sit in another class.
Allocations are plans, not buildings. PSIP III is still for bidding, and at EDCOM II’s 16 October 2026 hearing, only 533 of the 6,000 DPWH-led classrooms had reached the award or near-award stage.
The shortage is DepEd’s own estimate, only as good as the facilities data behind it. Of the masterlist lines, 103 (1,554 classrooms, all PSIP III) are exact copies of an earlier line at the same school and are kept. They cannot change whether a municipality has any classroom, but they raise the PSIP III counts in coverage and in the modality mix.
“Any classroom” counts one classroom the same as a hundred. With 65 fifth-class municipalities, intervals are wide, and “no clear difference” means none was detected, not that none exists. Income class and size move together, so the model separates them only in part, and all results are associations, not causes.
Frequently asked questions
Do poorer municipalities get fewer DepEd classrooms?
In raw terms, yes. Under SBP 2026, 56.9% of fifth-class municipalities have at least one classroom on the list, against 91.2% of first-class municipalities. But fifth-class municipalities are much smaller, and once size, shortage rate and region are held equal, the data show no clear difference by income class.
What is an LGU income class?
It groups provinces, cities and municipalities by average annual income, as classified by the Department of Finance: first class has the highest, fifth class the lowest. It measures the local government’s revenue, not its residents’ poverty, and it tracks size. BARMM’s Special Geographic Area municipalities have no income class.
Why did so few BARMM municipalities receive classrooms?
These data cannot say. Only 21 of 97 BARMM municipalities (21.6%) received any. EDCOM II has noted that under the Bangsamoro Organic Law, national programs such as the School Building Program shall continue to be funded by the National Government, but that some programs pulled back from BARMM over unclear interpretation. Without BARMM, the gap remains: 93.0% against 60.7%.
Download the data and cite this post
The cleaned EDCOM II classroom data behind this series are free to download for personal study; to reuse them, email support@nash.com.ph for written permission first. How the EDCOM Classroom Data Was Cleaned explains every table and cleaning rule. The files are at data.nash.com.ph: start with the README, then the school table (Parquet, or CSV), the School Building Program lines (CSV), the city and municipality table (CSV), and every table for Stata and SPSS. Every figure quoted in this series, with the data behind each chart, is in analysis_tables.zip.
Every file, with its rows, columns and checksum, is listed on the EDCOM II classroom data page. To cite the data: Llego, M. A. (2026). EDCOM II classroom construction dashboard data, cleaned, version 1.1. NASH Reviewer. https://nash.com.ph/edcom-classroom-data
To cite this post: Llego, M. A. (2026, October 28). Classroom allocation by LGU income class, 2026. NASH Reviewer Blog. https://nash.com.ph/blog/classroom-allocation-lgu-income-class
References
- Armitage, P. (1955). Tests for linear trends in proportions and frequencies. Biometrics, 11(3), 375–386.
- Cameron, A. C., & Miller, D. L. (2015). A practitioner’s guide to cluster-robust inference. Journal of Human Resources, 50(2), 317–372.
- Cochran, W. G. (1954). Some methods for strengthening the common chi-square tests. Biometrics, 10(4), 417–451.
- Hosmer, D. W., Lemeshow, S., & Sturdivant, R. X. (2013). Applied logistic regression (3rd ed.). Wiley.
- Llego, M. A. (2026). EDCOM II classroom construction dashboard data, cleaned, version 1.1 [Data set]. NASH Reviewer. https://nash.com.ph/edcom-classroom-data
- Second Congressional Commission on Education (EDCOM II). (2025, November 13). Clarity needed on the implementation of 23 national education laws in BARMM [News release].
- Second Congressional Commission on Education (EDCOM II). (2026). National Education Plan 2026–2035 (Year Three report).
- Second Congressional Commission on Education (EDCOM II). (2026, October 20). Put classrooms where they’re needed most, EDCOM 2 tells DepEd [News release]. https://edcom2.gov.ph/put-classrooms-where-theyre-needed-most-edcom-2-tells-deped/
- Wilson, E. B. (1927). Probable inference, the law of succession, and statistical inference. Journal of the American Statistical Association, 22(158), 209–212.
More in this series
- How the EDCOM Classroom Data Was Cleaned
- Philippine Classroom Shortage 2023: Where the Gap Is
- DepEd School Building Program 2026 in Numbers
- Do 2026 Classrooms Go Where the Shortage Is?
- Classroom Allocation by LGU Income Class, 2026
- Class Shifts and Crowded Classrooms in DepEd Schools
- Last Mile Schools: Classroom Need and 2026 Allocation
- Regional reports: NCR, CAR, Region I, Region II, Region III, Region IV-A, MIMAROPA, Region V, Region VI, NIR, Region VII, Region VIII, Region IX, Region X, Region XI, Region XII, Caraga, BARMM
- Rankings and deep dives: Congressional districts, Top 20 cities and municipalities, Rizal, Quezon City, City of Manila, Tawi-Tawi, Cavite, Cost of a classroom
- Explainers: PSIP III, Senior high shortage, Junior high shortage, Excess classrooms, Learning Continuity Spaces, How learners reach school
- For teachers and school heads: Action research and thesis topics
- Related: EDCOM II Final Report: Guide for Aspiring School Heads, National Education Plan 2026-2035: Guide for School Heads, DepEd Classroom and School Building Data, SY 2023-2024, DepEd School Improvement Plan (SIP): Steps, AIP and SRC, PPSSH Domain 2: Managing School Operations With DepEd Data, How to Read DepEd Data: A Guide for Aspiring School Heads
Analysis and charts by Mark Anthony Llego for NASH Reviewer. Data: EDCOM II classroom construction dashboard and Department of Education data. NASH Reviewer is not affiliated with EDCOM II or DepEd. Charts may be reused only with written permission from support@nash.com.ph.