Domain 2 of the Philippine Professional Standards for School Heads (PPSSH), Managing School Operations and Resources, has six strands. For teachers preparing for the National Assessment for School Heads (NASH, formerly the NQESH), each one at Career Stage 1 can be read with the Department of Education’s (DepEd) public school data, such as 35.1 learners per instructional room nationally and 30% of public school buildings in good condition.
The Final Report of the Second Congressional Commission on Education (EDCOM II) says this part of the job now dominates a school head’s workload. The PPSSH booklet, adopted by DepEd Order No. 024, s. 2020, says school heads in this domain “understand and implement laws, policies, guidelines, and issuances that relate to the management of human, financial, and material resources” and “establish a culture of transparency and accountability”.
EDCOM II recommends that the principal’s Office Performance Commitment and Review Form (OPCRF) be revised to prioritize “classroom observation, teacher coaching, and curriculum implementation” over “administrative and compliance tasks that currently dominate their workload”. That is not an argument that operations do not matter. It is an argument that they should be done well enough to take less time.
Below, each strand’s Career Stage 1 indicator is paired with three things: what the public data say about the school you will manage, what EDCOM II found, and how a situational NASH item might test it.
Key findings
- Your records become public data. Project BUKAS now publishes what schools enter in the Learner Information System (LIS) and the Basic Education Information System (BEIS). The audit of those files found 139 public schools reporting learners but no teachers, 316 reporting more computers than learners, and one reporting 15,699 tablets. Strand 2.1 is about keeping your school off that list.
- Maintenance and Other Operating Expenses (MOOE) are the school head’s only discretionary money, and most of that money is already committed. EDCOM II finds that 30% to 70% of school MOOE goes to utility bills and that only 5.9% of schools handle their own funds as implementing units. The Special Education Fund (SEF) per learner ranges 394-fold across local government units (LGUs).
- The buildings are the problem the data show most clearly. Thirty percent of public school buildings are in good condition. Nationally, 35.1 learners share each instructional room, and 55.1 do in NCR. Makeshift rooms are in use at 29.1% of schools. EDCOM II counts a backlog of 165,443 classrooms and 123,000 buildings past their design life.
- Staff management changed in 2024. DepEd Order No. 002, s. 2024 moved administrative tasks from teachers to school heads and support staff. The staffing standards still show gaps of 12,078 Administrative Officer II and 44,285 Project Development Officer I items.
- Disaster safety is now a constant part of planning. EDCOM II counts more than 10,700 schools affected by calamities between June and October 2025, and 7,500 classrooms damaged by the Cebu earthquake alone. The facilities file shows that 5% of public elementary schools have a flood marker and 14% have a solar panel.
The six strands of Domain 2 at Career Stage 1
| Strand | Career Stage 1 indicator |
|---|---|
| 2.1 Records management | 2.1.1 Demonstrate skills in managing school data and information using technology, including ICT. |
| 2.2 Financial management | 2.2.1 Demonstrate knowledge and understanding of policies, guidelines and issuances in managing finances such as allocation, procurement, disbursement and liquidation aligned with the school plan. |
| 2.3 School facilities and equipment | 2.3.1 Demonstrate knowledge and understanding of policies, guidelines and issuances on acquisition, recording, utilization, repair and maintenance, storage, and disposal in managing school facilities and equipment. |
| 2.4 Management of staff | 2.4.1 Demonstrate knowledge and understanding of laws, policies, guidelines and issuances on managing school staff. |
| 2.5 School safety for disaster preparedness, mitigation and resiliency | 2.5.1 Demonstrate knowledge and understanding of laws, policies, guidelines and issuances on managing school safety for disaster preparedness, mitigation and resiliency in ensuring continuous delivery of instruction. |
| 2.6 Emerging opportunities and challenges | 2.6.1 Identify emerging opportunities and challenges in addressing the needs of learners, school personnel and other stakeholders. |
Strand 2.1 is the only strand in the domain whose Career Stage 1 indicator asks for a skill rather than knowledge. Aspiring school heads are expected to be able to manage data with information and communications technology (ICT) before appointment.
2.1 Records management
This strand is about three records: the LIS, the Enhanced Basic Education Information System (EBEIS) and the National School Building Inventory (NSBI). Since September 2025, all three are public. EDCOM II credits Project BUKAS as “the first initiative in DepEd’s history to make school-level education data publicly accessible”. It quotes Secretary Angara: “Whatever we know at the Central Office and the regional offices, the public will also know.”
The DepEd open data quality audit in this series describes what those records look like from the outside. The files are sound: 17 archives, 2,216 columns, one row per school and zero duplicate school IDs. The six SY 2023-2024 files hold the identical 60,167 schools.
The errors are the kind a school head’s signature should have caught. In the files, 139 public schools report learners and no teachers, 7 report more teachers than learners, and 267 report learners but no instructional classroom. Another 316 report more academic computers than learners, 108 ICT cells exceed 1,000, and one school reports 15,699 tablets. The SY 2025-2026 enrollment file changed its label scheme and wrote blanks where earlier years wrote zeros. That is the kind of change a records manager documents.
EDCOM II recommends that DepEd “further reduce and digitize school forms”, scale up electronic forms such as eSF7, and integrate the LIS, HRIS, EBEIS and PDIS. DepEd Order No. 006, s. 2025 already cut teacher-accomplished forms from 174 to 75, five of them regular. What remains is the school head’s responsibility: the accuracy of the school’s own entries. Those entries now feed the division’s planning, the public datasets and the MOOE formula. Through the Comprehensive Rapid Literacy Assessment (CRLA) and Early Language, Literacy, and Numeracy Assessment (ELLNA) files, they also feed the National Education Plan’s targets.
2.2 Financial management
Indicator 2.2.1 names allocation, procurement, disbursement and liquidation. EDCOM II’s Priority Area 26 explains the system behind those words.
School MOOE “represents the primary source of discretionary operational funding available to school heads”. It comes from DepEd’s budget and is transferred through Schools Division Offices (SDOs). It covers utilities, minor repairs, consumables and connectivity, and “30 to 70% of schools’ MOOE is consumed by utility bills alone”.
From 2013, MOOE was allocated by the Boncodin formula, which had fixed and variable components based on enrollment, classrooms, teachers and graduates. EDCOM II finds that the formula “failed to account for current cost structures, inflation, or contextual differences” and disadvantaged small and remote schools. The Department of Budget and Management (DBM) approved a partial normative formula for FY 2025 and a full one for FY 2026. Obligation rates averaged 85.9% from 2016 to 2023.
Most schools never handle the money themselves. Only 2,661 of 45,225 public schools (5.9%) are implementing units. The rest have their MOOE processed by the SDO, “which subjects routine expenditures to additional layers of approval, procurement, and liquidation requirements”. A new school head in a non-implementing unit manages a cash advance and a liquidation, not a budget.
The SEF is the local money. EDCOM II finds that SEF per learner ranges from PHP 25,587 in Makati City to PHP 65 in Guihulngan City. That is a 394-fold difference, driven by local real property tax bases. Cities take about 64% of all SEF, and PHP 16.3 billion went unused in 2022. First-class LGUs had 68 times the SEF of sixth-class municipalities.
DepEd, the DBM, the Department of the Interior and Local Government (DILG) and the Department of Finance (DOF) signed revised SEF guidelines, Joint Circular No. 01, s. 2025, on December 3, 2025. A school head’s relationship with the Local School Board is therefore a financial-management skill, not only a community one. Local School Boards and the Special Education Fund covers what the fund may pay for, what EDCOM II found about it and how a school head can ask the board for support.
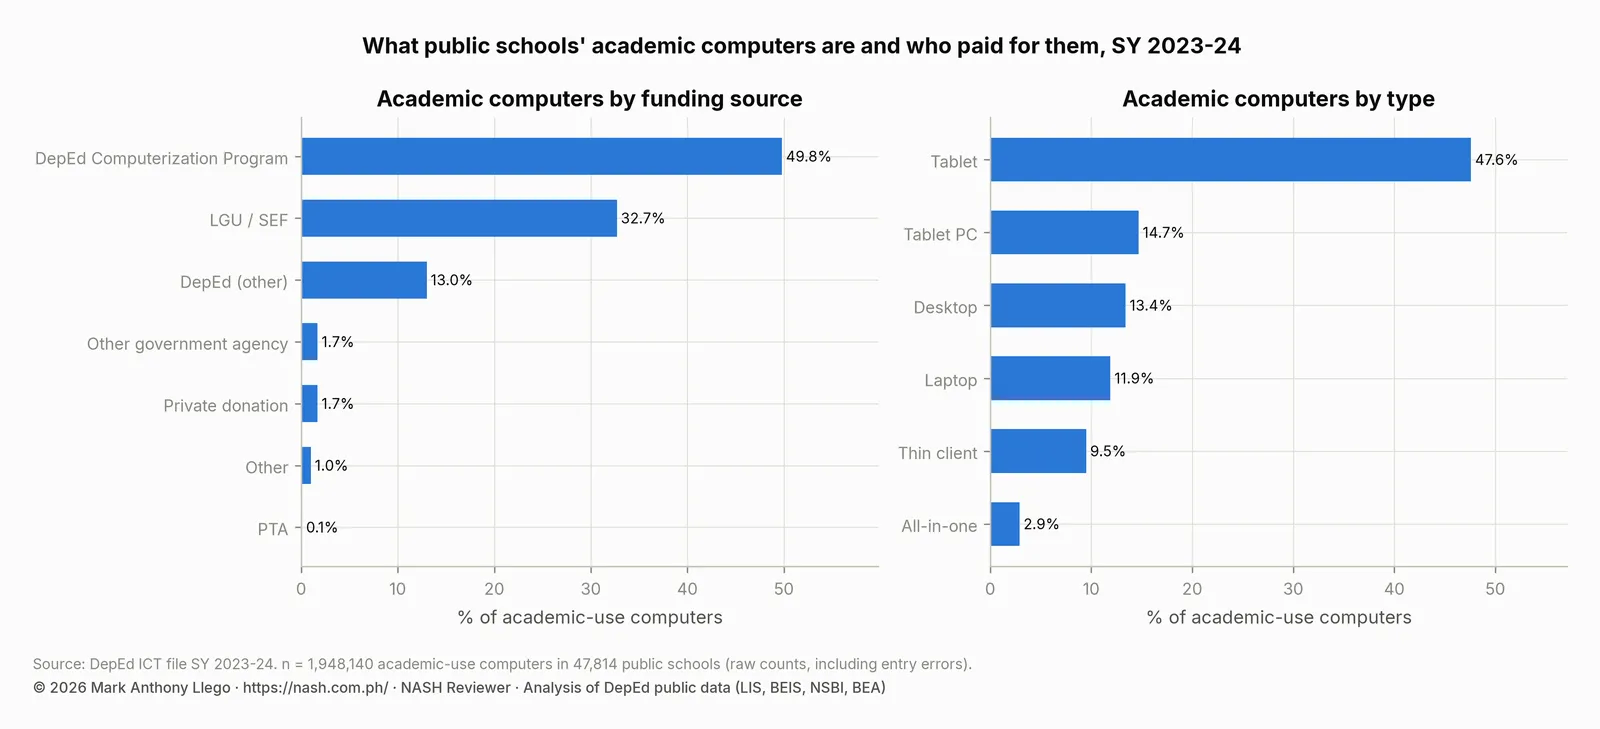
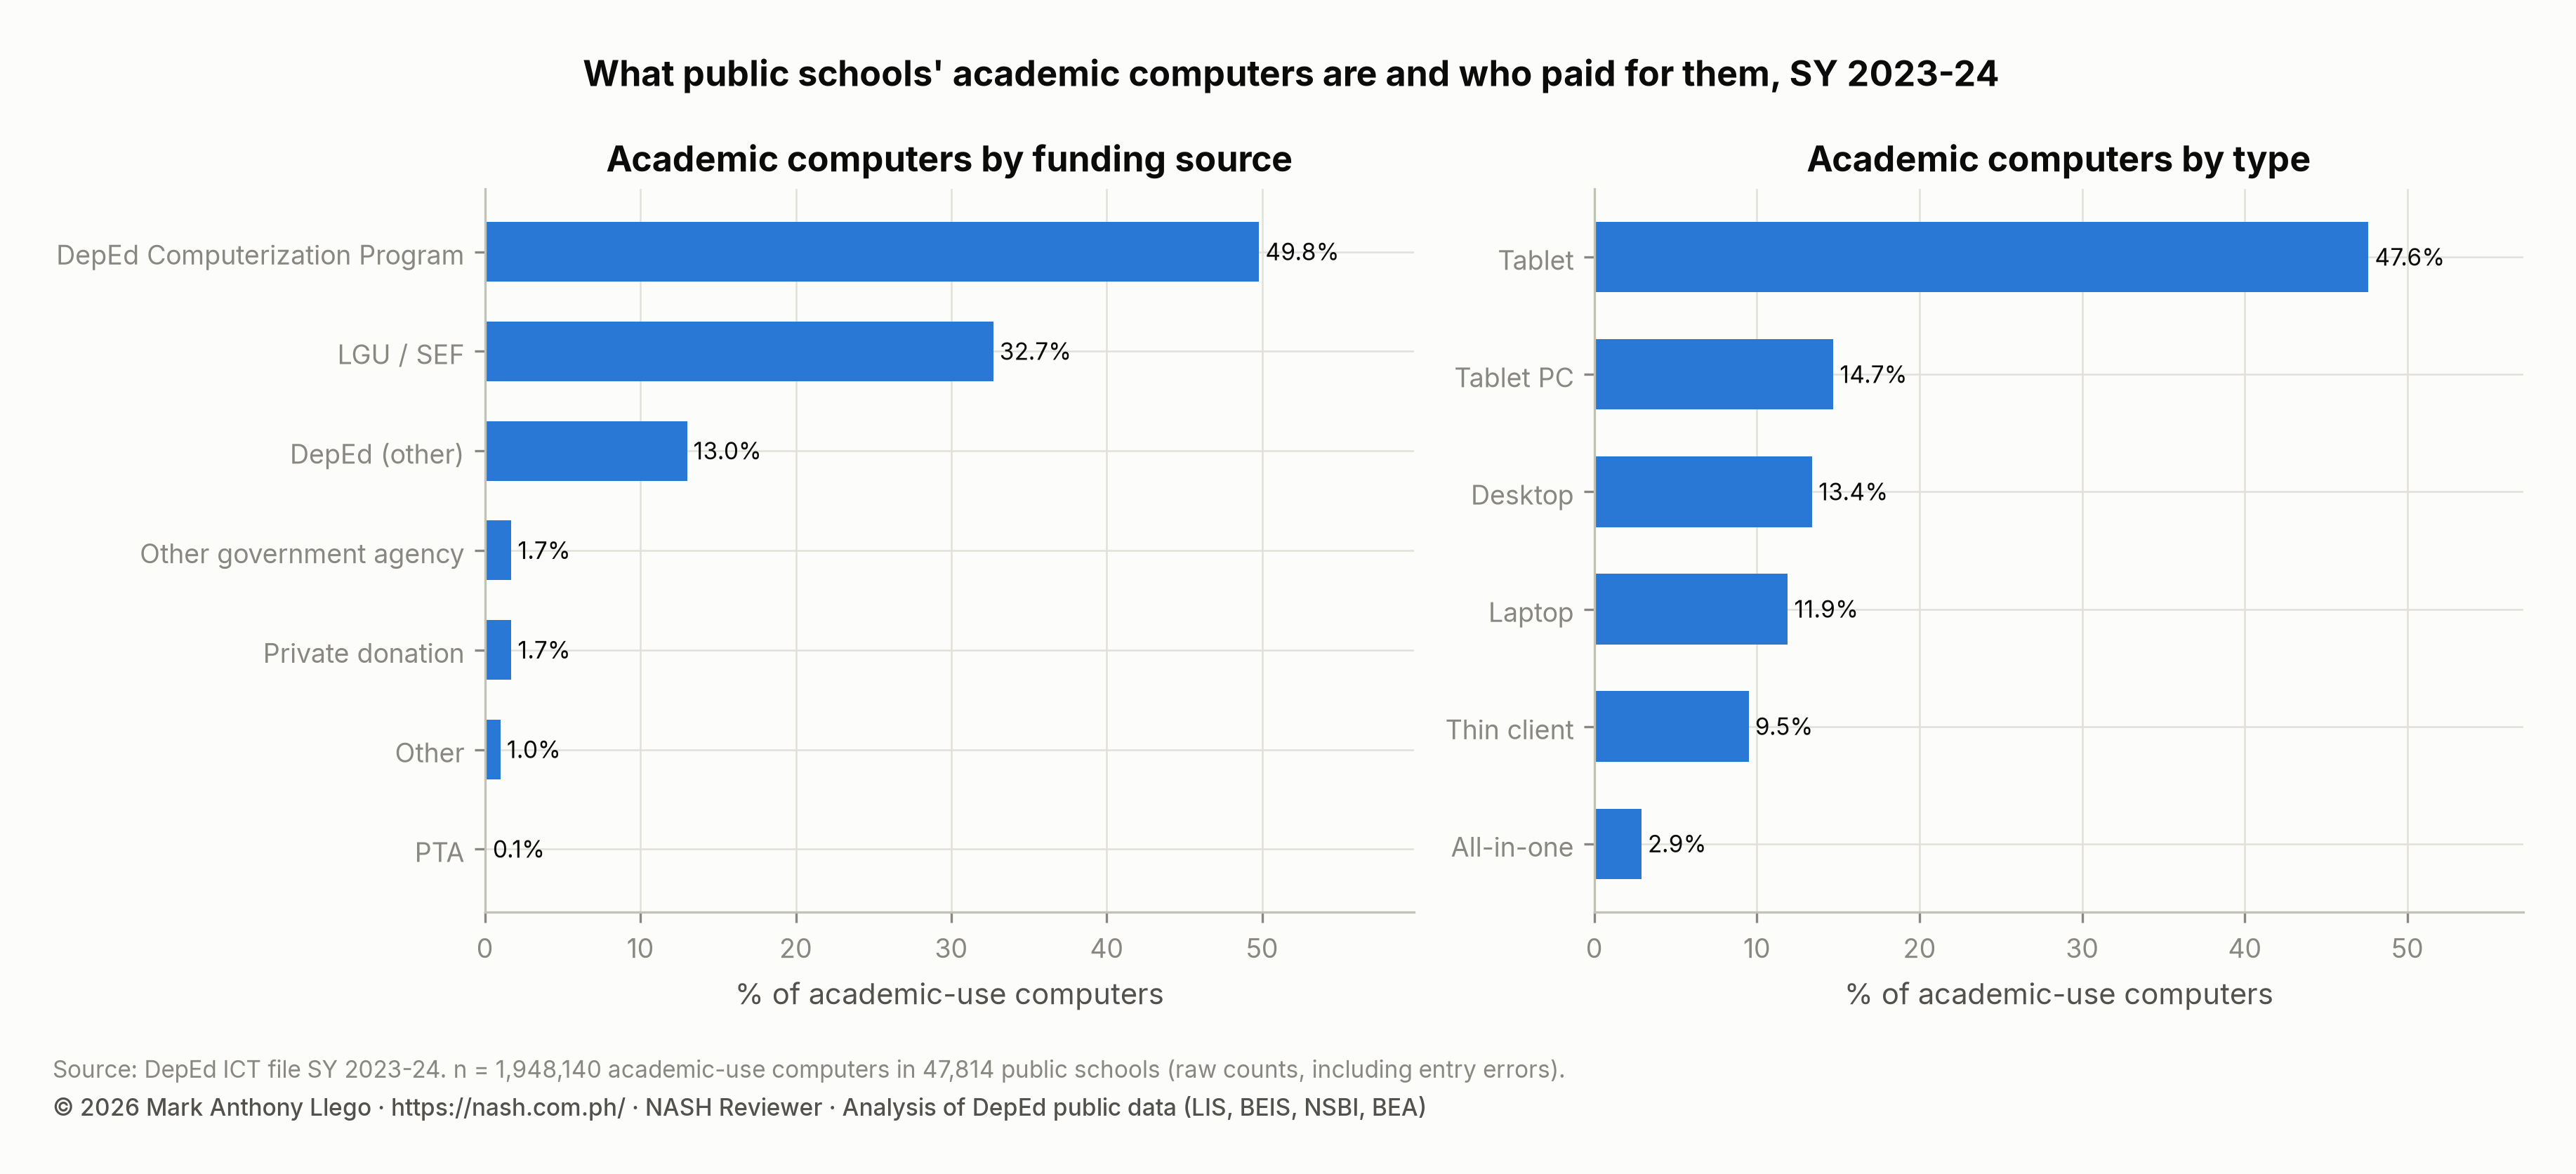
The public files show local money in two places. Locally funded teachers are 2.0% of the public teaching force nationally, but 12.6% in BARMM and 4.5% in Region II. LGUs and the SEF paid for 32.7% of public schools’ academic computers. The DepEd Computerization Program (DCP) paid for 49.8%, other DepEd funds for 13.0%, private donations for 1.7% and parent-teacher associations (PTAs) for 0.1%.
| Funding source | Academic computers | Share |
|---|---|---|
| DepEd Computerization Program | 969,301 | 49.8% |
| DepEd (other) | 252,494 | 13.0% |
| LGU / SEF | 636,869 | 32.7% |
| PTA | 2,490 | 0.1% |
| Private donation | 33,819 | 1.7% |
| Other government agency | 33,141 | 1.7% |
| Other | 20,026 | 1.0% |
Financial rules are enforced in court as well as in audits. The Supreme Court has affirmed a principal’s graft convictions over purchases made without real bidding (Oani v. People, 2005), and a COA audit was enough to sustain another principal’s dismissal for grave misconduct (Balbastro v. COA, 2008). See Can a Principal Be Jailed Over School Funds? and, on collections from learners and parents, Unauthorized School Fees: What Happens to the Principal?.
2.3 School facilities and equipment
Indicator 2.3.1 covers acquisition through disposal. The NSBI, which the facilities file reproduces, is the record of the building stock. EDCOM II’s Priority Area 8 is the account of what that stock needs.
| Region | Buildings | Good condition | Needs minor repair | Needs major repair | For condemnation | For demolition | Under construction | For completion |
|---|---|---|---|---|---|---|---|---|
| BARMM | 8,728 | 20.5% | 38.7% | 32.8% | 5.1% | 0.9% | 0.6% | 1.5% |
| CAR | 8,283 | 31.8% | 19.5% | 36.0% | 7.7% | 3.9% | 0.6% | 0.6% |
| CARAGA | 13,790 | 24.6% | 31.4% | 34.8% | 6.1% | 1.7% | 0.7% | 0.6% |
| MIMAROPA | 16,123 | 30.7% | 36.4% | 26.7% | 4.3% | 0.9% | 0.3% | 0.8% |
| NCR | 4,172 | 53.2% | 24.2% | 16.1% | 4.7% | 0.4% | 0.9% | 0.5% |
| NIR | 18,377 | 22.2% | 34.4% | 36.4% | 5.3% | 0.9% | 0.4% | 0.4% |
| Region I | 21,868 | 31.4% | 27.6% | 30.5% | 8.6% | 1.3% | 0.3% | 0.3% |
| Region II | 18,230 | 28.7% | 29.8% | 31.3% | 4.4% | 4.6% | 0.4% | 0.7% |
| Region III | 30,472 | 43.1% | 24.4% | 22.9% | 6.6% | 2.2% | 0.6% | 0.2% |
| Region IV-A | 29,330 | 31.5% | 30.0% | 26.3% | 8.5% | 2.9% | 0.5% | 0.4% |
| Region IX | 16,655 | 28.2% | 31.2% | 31.5% | 5.7% | 2.8% | 0.4% | 0.3% |
| Region V | 29,092 | 29.1% | 35.4% | 28.0% | 5.3% | 1.9% | 0.2% | 0.1% |
| Region VI | 20,787 | 26.8% | 34.7% | 32.1% | 4.6% | 1.0% | 0.3% | 0.5% |
| Region VII | 18,559 | 27.7% | 35.9% | 28.8% | 5.6% | 1.3% | 0.3% | 0.5% |
| Region VIII | 23,923 | 27.6% | 38.6% | 28.0% | 4.6% | 0.6% | 0.4% | 0.2% |
| Region X | 17,730 | 20.9% | 25.3% | 32.7% | 15.1% | 4.8% | 0.6% | 0.5% |
| Region XI | 16,316 | 29.2% | 30.2% | 27.6% | 10.0% | 1.9% | 0.4% | 0.6% |
| Region XII | 15,324 | 29.6% | 32.2% | 27.7% | 8.2% | 1.6% | 0.3% | 0.3% |
| Philippines (public) | 327,759 | 29.6% | 31.5% | 29.3% | 6.8% | 2.0% | 0.4% | 0.4% |
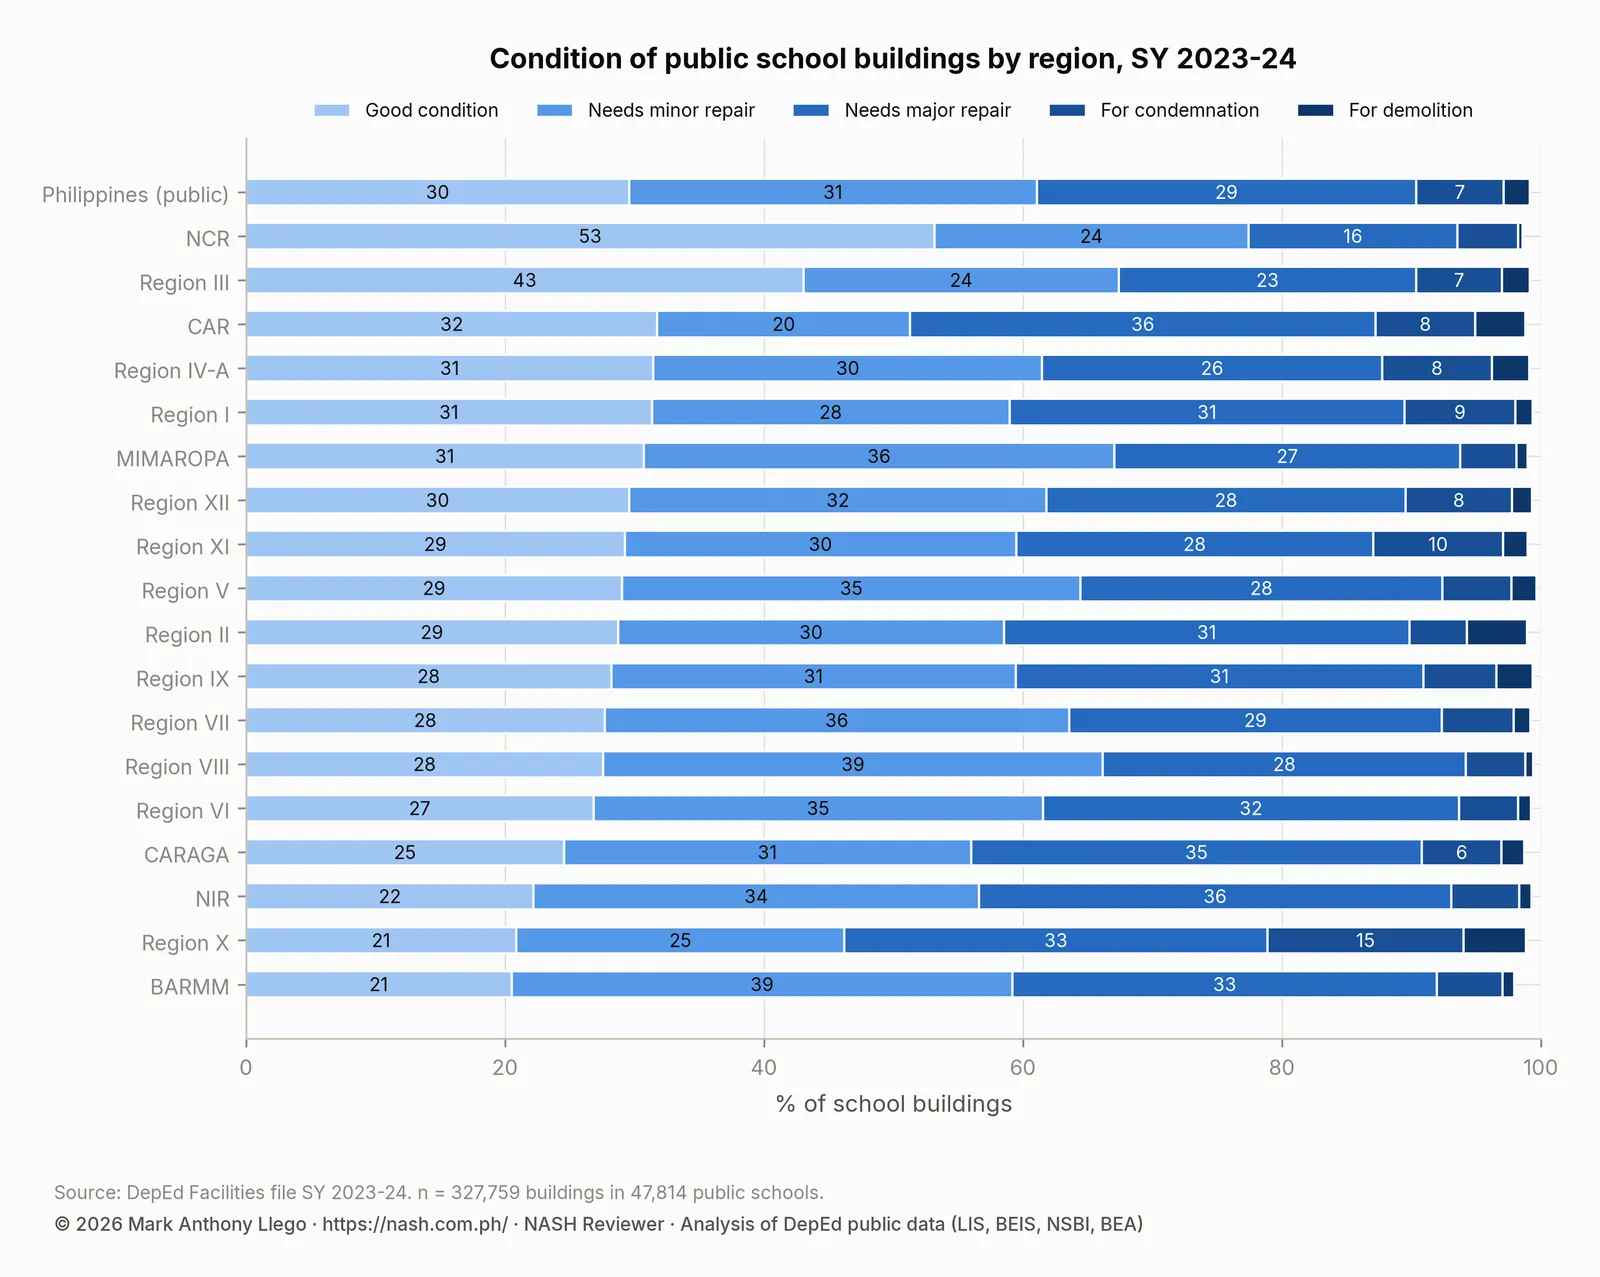
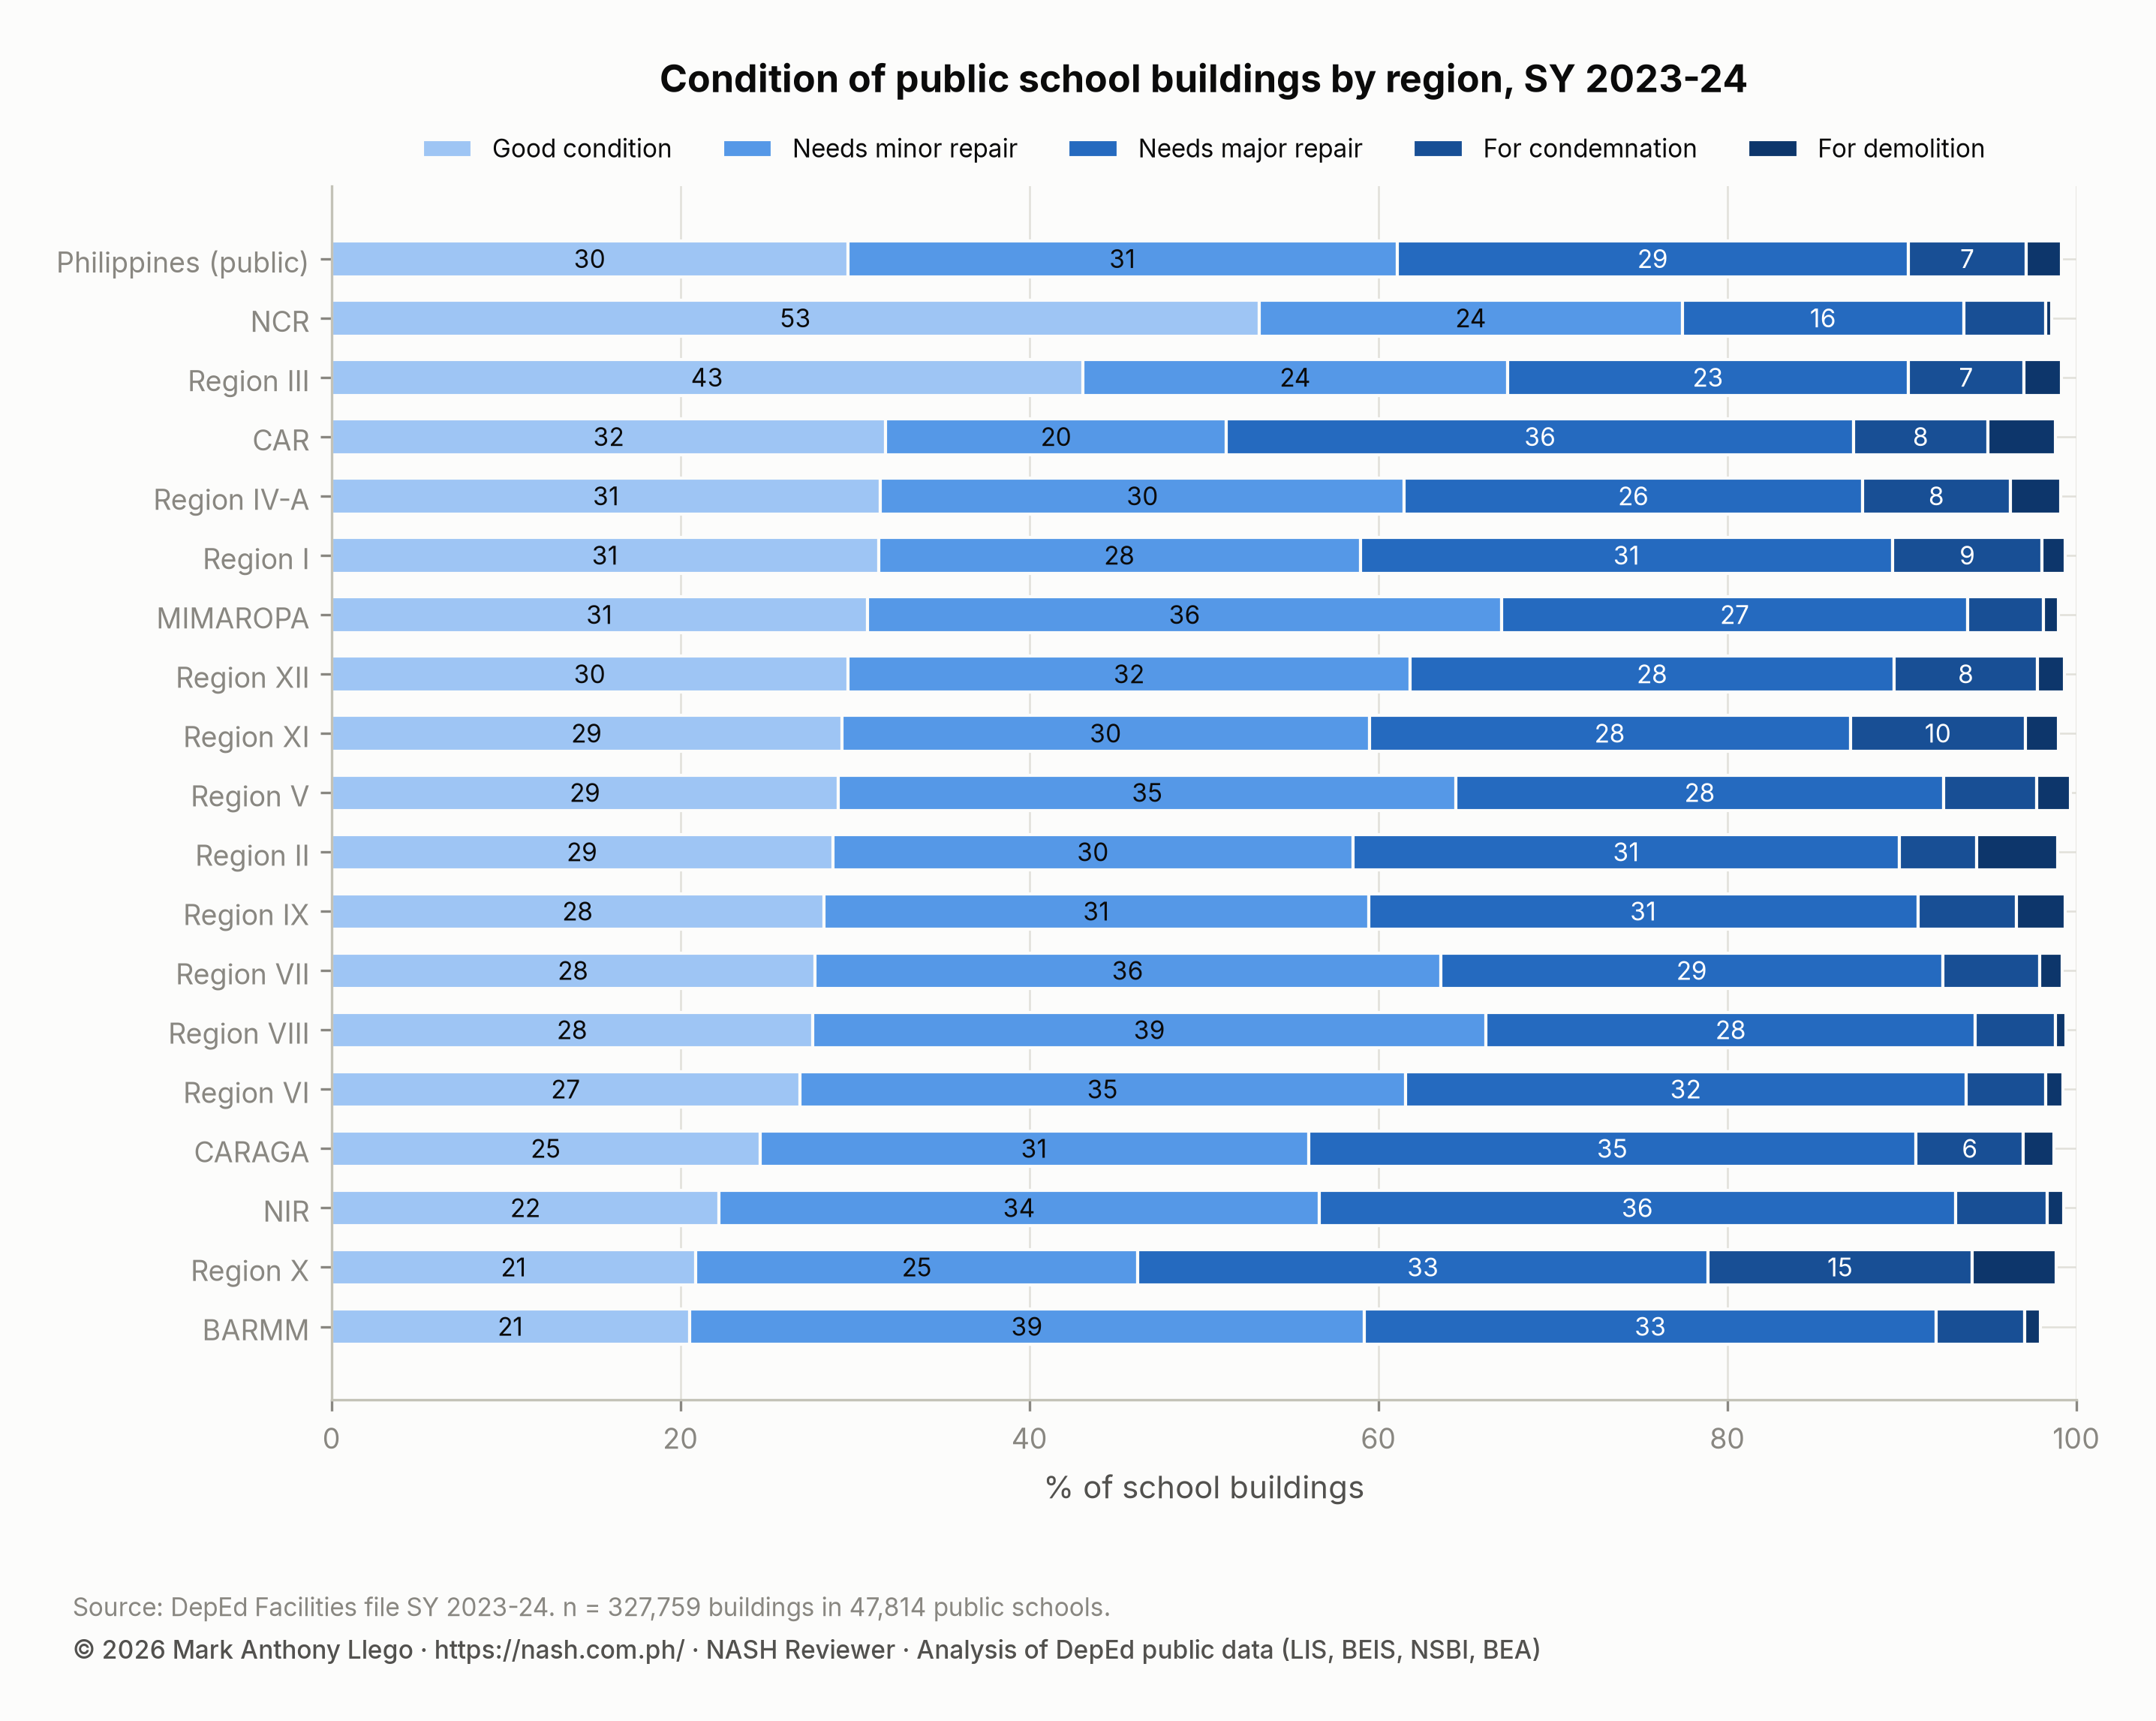
Nationally, 30% of public school buildings are in good condition, 31% need minor repair and 29% need major repair. Another 7% are for condemnation and 2% for demolition. NCR has 53% in good condition; BARMM and Region X have 21%.
EDCOM II reads the same inventory. Outside NCR, fewer than 70% of buildings are in good or minor-repair condition in almost every region. Of about 330,000 buildings, 123,000 are past the 25-year design life set by DepEd Order No. 64, s. 2017, and almost 24,000 are past 50 years. About 160,000 classrooms will need condemning between 2025 and 2075, 34,000 of them between 2026 and 2035.
On crowding, the facilities file gives 35.1 learners per instructional room nationally by DepEd’s definition. The ratio is 55.1 in NCR, 46.4 in BARMM and 45.1 in Region IV-A, and 24.1 in CAR. The median school has 27.2. Twenty-nine percent of public schools use makeshift rooms, 34,372 rooms in all, and 11,634 temporary learning spaces are in use. Another 267 schools report learners and no instructional room. EDCOM II’s figures are a national backlog of 165,443 classrooms, 2,233 schools on double or triple shifts, and rooms holding 75 to more than 250 learners in the worst divisions.
| Region | Public schools | Learners per instructional room | Schools above 45 learners per room | Schools with makeshift rooms | Makeshift rooms | Temporary learning spaces |
|---|---|---|---|---|---|---|
| NCR | 827 | 55.1 | 59.7% | 11.5% | 348 | 81 |
| BARMM | 2,155 | 46.4 | 45.8% | 42.5% | 2,355 | 733 |
| Region IV-A | 3,564 | 45.1 | 26.6% | 21.6% | 2,389 | 767 |
| Region XII | 2,155 | 36.7 | 20.7% | 40.5% | 2,474 | 1,403 |
| Region VII | 2,810 | 36.5 | 16.7% | 31.8% | 2,176 | 623 |
| Region XI | 2,218 | 36.3 | 16.9% | 36.7% | 2,635 | 1,262 |
| Region X | 2,531 | 36.2 | 20.3% | 34.8% | 2,328 | 519 |
| Region III | 3,729 | 36 | 16.3% | 11.0% | 1,043 | 409 |
| Region IX | 2,993 | 34 | 17.0% | 36.7% | 2,695 | 730 |
| NIR | 2,231 | 32.4 | 10.7% | 37.0% | 2,016 | 409 |
| Region V | 3,862 | 31.2 | 8.6% | 33.1% | 2,846 | 1,270 |
| MIMAROPA | 2,382 | 30.8 | 12.6% | 34.2% | 2,076 | 352 |
| CARAGA | 2,099 | 30.6 | 11.1% | 33.3% | 1,546 | 735 |
| Region I | 2,861 | 28 | 6.3% | 12.2% | 938 | 406 |
| Region II | 2,539 | 27.5 | 7.0% | 16.8% | 862 | 401 |
| Region VI | 2,835 | 27.3 | 4.6% | 25.5% | 1,637 | 413 |
| Region VIII | 4,179 | 26.9 | 5.4% | 34.3% | 2,594 | 705 |
| CAR | 1,844 | 24.1 | 6.2% | 33.5% | 1,414 | 416 |
A school head should understand how classrooms are delivered before requesting one. About 62% of DepEd infrastructure funds are transferred to the Department of Public Works and Highways (DPWH). Completion within the programmed year is “a small fraction of targets”, over 1,000 classrooms were reported incomplete, and some completed structures are unusable for lack of utilities or permits. DepEd Order No. 18, s. 2023 gives division engineers the role in site identification, permits and monitoring, and EDCOM II notes that 45 divisions lack them.
EDCOM II supports three alternatives. The first is LGU-led construction under a counterpart program; Senate Bill No. 1482 proposes a Classroom Building Acceleration Program. The others are public-private partnerships (PPPs) where sites are ready, and vouchers where private seats exist. Recommendation 8 asks for a “minimum service package” of classroom size and density, toilets and water, sanitation and hygiene (WASH) facilities, electricity, connectivity and accessibility.
For equipment, the ICT file is the inventory. It records 1.54 million academic computers after capping entry errors, or 6.6 per 100 learners nationally and 2.3 in the median school. Of all schools, 24.6% report none, and tablets are 47.6% of the stock. The analysis of school inputs and learning outcomes finds no association between computers per learner and any result once schools are compared within a division. It does find an association for internet access. EDCOM II’s Top 20 item 6 is connectivity, not devices.
2.4 Management of staff
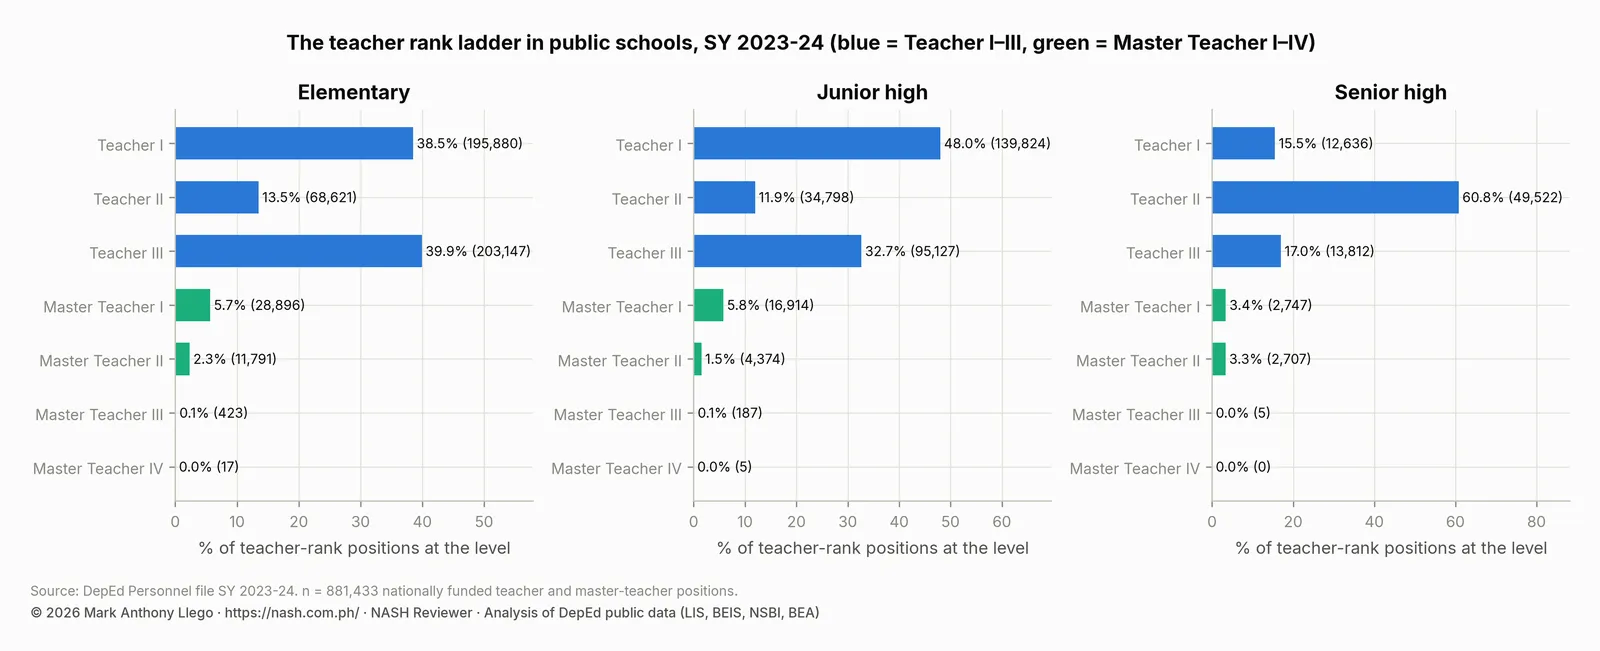
Indicator 2.4.1 asks for knowledge of the laws and issuances on managing staff. The personnel file describes the staff you will manage.
| Position | Elementary | Junior high | Senior high |
|---|---|---|---|
| Teacher I | 195,880 (38.5%) | 139,824 (48.0%) | 12,636 (15.5%) |
| Teacher II | 68,621 (13.5%) | 34,798 (11.9%) | 49,522 (60.8%) |
| Teacher III | 203,147 (39.9%) | 95,127 (32.7%) | 13,812 (17.0%) |
| Master Teacher I | 28,896 (5.7%) | 16,914 (5.8%) | 2,747 (3.4%) |
| Master Teacher II | 11,791 (2.3%) | 4,374 (1.5%) | 2,707 (3.3%) |
| Master Teacher III | 423 (0.1%) | 187 (0.1%) | 5 (0.0%) |
| Master Teacher IV | 17 (0.0%) | 5 (0.0%) | 0 (0.0%) |
Across 47,814 public schools with learners there are 909,348 teachers. That is 25.5 learners per teacher by DepEd’s definition and 22.7 in the median school. Of 881,433 nationally funded positions, 91% of elementary and 92% of junior-high positions are Teacher I to III. Master teachers are 7.6% of positions (2.6% in BARMM, 9.5% in Region VIII), and 60.8% of senior-high positions are Teacher II.
Elementary-only schools report a principal position in 39.5% of cases, head teachers only in 30.4%, and no school-leadership position in 30.1%. In a third of elementary schools, therefore, the staff is managed by a teacher-in-charge.
The policy changes EDCOM II documents all add to the school head’s work. DepEd Order No. 002, s. 2024 removed administrative tasks from teachers and “transferred these responsibilities to school heads and non-teaching personnel”. The 2025 budget funded 10,000 administrative officer and support positions, and DepEd committed to over 7,000 contract-of-service school-based support staff. DepEd’s proposed School Organizational Structure and Staffing Standards still show gaps of 12,078 Administrative Officer II and 44,285 Project Development Officer I items.
EDCOM II also reports that nearly half of teachers worked over 50 hours a week, 18 of those hours on ancillary tasks. Master teachers and department heads are routinely assigned to budgeting and project financing. Recommendation 1 would make the Bureau of Human Resource and Organizational Development (BHROD) “the central clearinghouse for all ancillary tasks, with authority to veto or redirect non-teaching duties”. Teacher Workload and Accountability covers EDCOM II’s workload findings and the support-staff gap in depth, with what has changed since 2024. For DepEd’s own rules on teaching loads, overload and designations, see How School Heads Plan Teaching Loads Under DO 5.
Career progression is the other body of law; our career progression guide explains it. Executive Order No. 174, s. 2022 created the Expanded Career Progression system with two career lines, Classroom Teaching and School Administration. DepEd Order No. 24, s. 2025 set the guidelines, and Republic Act No. 12288 of September 12, 2025 made the system law. EDCOM II asks DepEd and the Civil Service Commission (CSC) to move the master’s degree requirement from Master Teacher I to a later step, since teachers choose a line only after reaching Master Teacher I.
For what the Supreme Court has said about treating teachers fairly, about moving principals between schools, and about suspensions and appeals, see Oppression Cases: How Principals Must Treat Teachers, Can a Principal Be Reassigned to Another School? and Preventive Suspension, Appeals and Back Pay for Principals.
2.5 School safety for disaster preparedness
Indicator 2.5.1 ties safety to “continuous delivery of instruction”. The main laws are Republic Act No. 10121 on disaster risk reduction and management (DRRM) and Republic Act No. 10821 on children in emergencies. The second allows schools to serve as evacuation centers only as a last resort and for a limited period. EDCOM II also cites DepEd Orders No. 64, s. 2017 and No. 83, s. 2011 for building standards, DRRM committees and temporary learning spaces, and the 2024 Education in Emergencies directive.
EDCOM II describes what those laws face. The World Risk Index names the Philippines the most disaster-prone country for 2022 to 2025. The magnitude-6.9 Cebu earthquake of September 30, 2025 damaged over 7,500 classrooms, destroyed 1,187 and displaced more than 19,000 learners. From June to October 2025, calamities affected over 10,700 schools. Thousands of classrooms are still converted into evacuation centers, nearly half of the SY 2023-2024 cases in Region IV-A, and schools then run in temporary learning spaces “far beyond the recommended six month limit”.
The learning cost has been measured. National Achievement Test (NAT) scores are 10% to 20% of a standard deviation lower in heavily affected provinces. Each additional day of class suspension for evacuation use costs 12% to 14% of a standard deviation in Grade 4 mathematics and science.
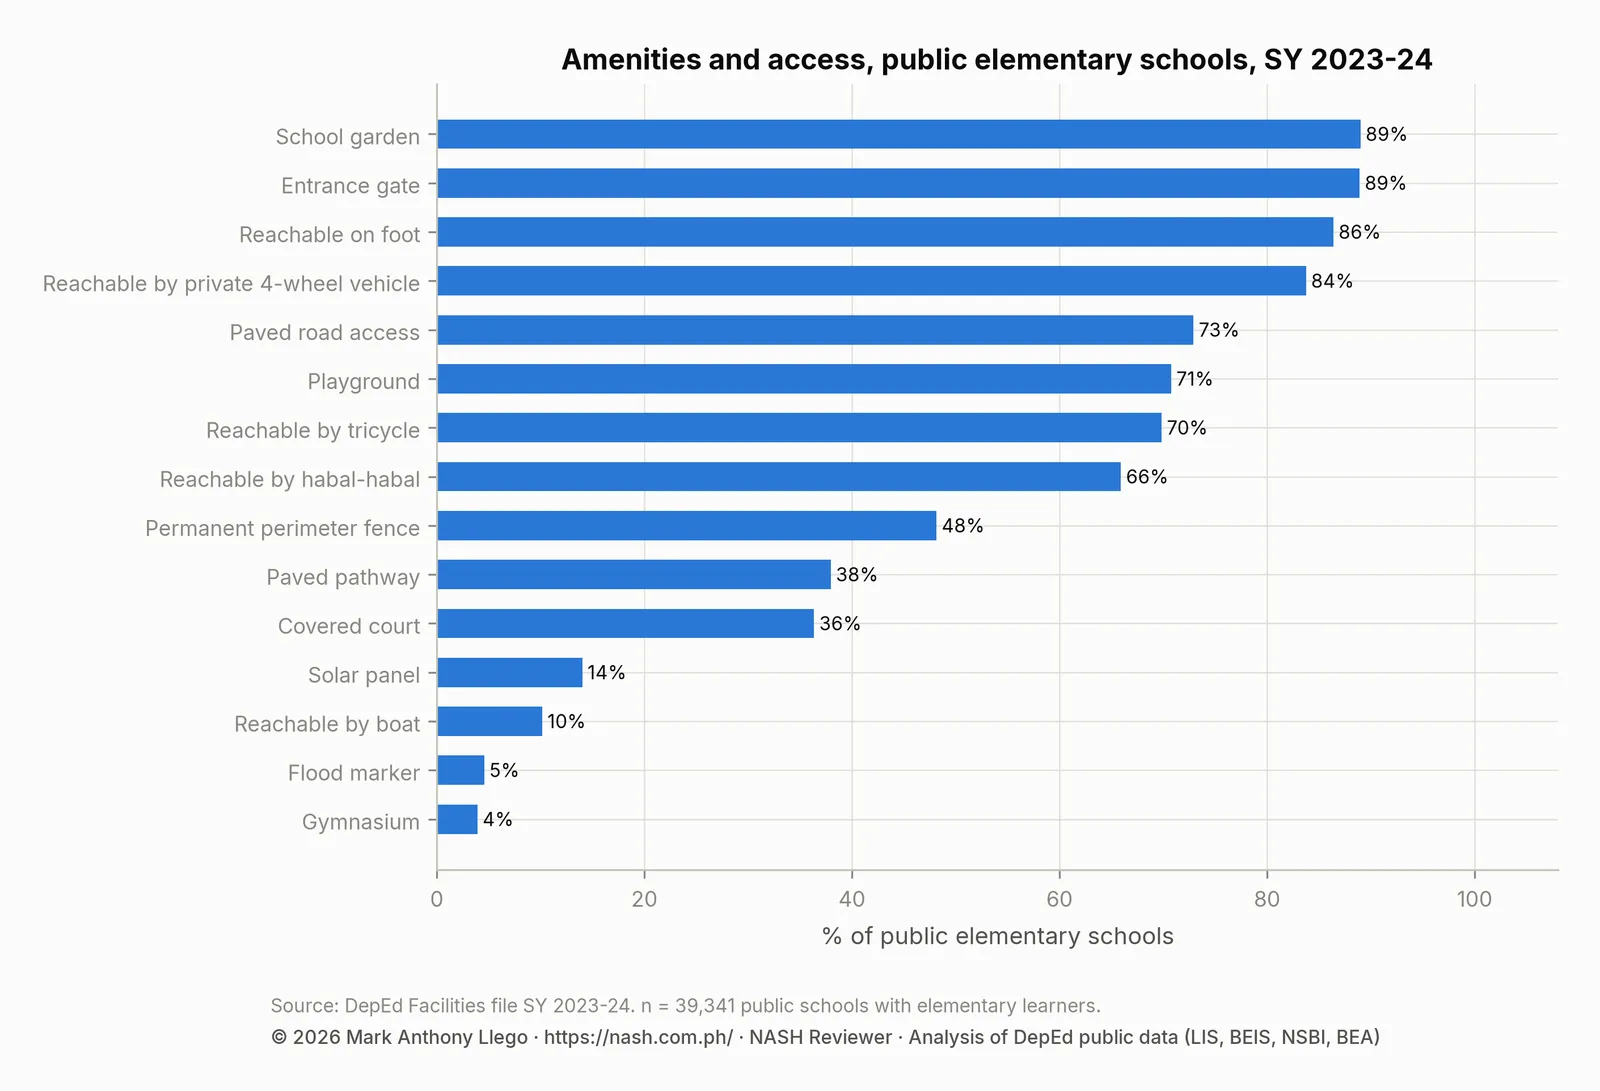
The facilities file shows how prepared the building stock is. Among public elementary schools, 5% have a flood marker, 14% have a solar panel, 48% have a permanent perimeter fence and 89% have an entrance gate. Of these schools, 10% are reachable by boat and 66% by habal-habal. A school head’s DRRM plan starts from these facts and from the building condition figures above. A building tagged for condemnation is a hazard before it is a classroom.
Safety also has a liability side. When a pupil is hurt on school grounds or in a school activity, the Supreme Court cases on whether the school and its head must pay damages are in Is a Principal Liable When a Pupil Is Injured?.
2.6 Emerging opportunities and challenges
Indicator 2.6.1 asks you to identify emerging opportunities and challenges. The data and the EDCOM II report point to six.
- Falling enrollment. National enrollment is down 1.86 million from its SY 2022-2023 peak, and every region except BARMM has lost learners since then. Smaller cohorts ease classroom and teacher ratios in the early grades, and they change the plantilla a school can justify.
- Senior high school’s strand shift. Technical-Vocational-Livelihood (TVL) peaked at 1.22 million in SY 2023-2024, Humanities and Social Sciences (HUMSS) tripled to 1.01 million, and the General Academic Strand (GAS) and Accountancy, Business and Management (ABM) are declining. The Strengthened Senior High School tracks appear in SY 2025-2026. EDCOM II’s Top 20 items 9 to 11 concern subject-specialization mismatch, the TechPro program and school-to-employment pathways.
- Housing without schools. Fifty-eight resettlement projects with 167,120 units were built without planned school sites. A memorandum of April 2025 between DepEd and the Department of Human Settlements and Urban Development (DHSUD), and a planned joint circular, would require education impact assessments.
- Private capacity and vouchers. Tens of thousands of unused private school seats are in congested barangays. Bills in both chambers of Congress would extend vouchers to kindergarten to Grade 6. A network analysis in Cavite, however, halved the estimated usable capacity from 44,436 to 22,053.
- Computer-based testing. EDCOM II recommends a gradual transition for national assessments. That requires ICT and proctoring capacity, which the 24.6% of schools with no academic computer do not have.
- New principal items. Twenty-two thousand new principal items are planned for 2026 to 2028. They are concentrated in small elementary schools that today report a head teacher or no head position at all.
How the NASH may test Domain 2
A situational item might give a school’s building condition, its classroom ratio, its MOOE and its implementing-unit status. It might then ask what the school head does about a building tagged for major repair. A relational answer separates what MOOE can fund (minor repairs, utilities, consumables) from what needs the division engineer, the Basic Education Facilities Fund, and DPWH or an LGU counterpart. It records the building correctly in the NSBI, because the inventory drives the allocation. It also moves classes out of a condemned building under the DRRM plan before the repair is scheduled. An extended abstract answer notes that in an implementing unit the same school head would procure the minor repair directly. It also notes that in a congested NCR school the better request might be a voucher slot analysis rather than a room.
Before you apply
- Pull your prospective school’s rows from the facilities, personnel, ICT and WASH files and check them against what you can see. Errors are yours once you sign the BEIS.
- Learn whether the school is an implementing unit and what its MOOE is. Between 30% and 70% of that MOOE will go to utilities.
- Read DepEd Orders No. 002, s. 2024 and No. 006, s. 2025 and list which tasks moved to the school head.
- Know the DRRM laws, the condition of every building, and the location of the nearest evacuation center that is not your classroom.
Frequently asked questions
What is PPSSH Domain 2, Managing School Operations and Resources?
PPSSH Domain 2, Managing School Operations and Resources, has six strands: records management, financial management, school facilities and equipment, management of staff, school safety for disaster preparedness, and emerging opportunities and challenges. Career Stage 1 asks aspiring school heads to know the relevant laws and to be able to manage school data with ICT.
How much of a DepEd school’s MOOE goes to utility bills?
The EDCOM II reports find that 30% to 70% of school MOOE is consumed by utility bills. Only 5.9% of public schools are implementing units that handle their funds directly. The rest go through the Schools Division Office.
What share of DepEd public school buildings are in good condition?
Thirty percent of public school buildings were in good condition in SY 2023-2024, 29% needed major repair, and 9% were tagged for condemnation or demolition. NCR has 53% in good condition; BARMM and Region X have 21%.
Download the data
The cleaned, harmonized DepEd files behind this series are free to download in CSV and Parquet, with a codebook and checksums, under the terms of use set out in the release. Download Cleaned DepEd School Data, SY 2017-18 to 2025-26 documents every file and column. The files themselves are at data.nash.com.ph, starting with the README, the SY 2023-24 school master file (CSV, 8.0 MB) and the nine-year enrollment panel (Parquet, 17.2 MB).
Guides for aspiring school heads
- DepEd Data for Aspiring School Heads: Where to Start
- NASH Practice Questions With Answers: 50 Items on the PPSSH
- How to Read DepEd Data: A Guide for Aspiring School Heads
- EDCOM II Final Report: Guide for Aspiring School Heads
- National Education Plan 2026-2035: Guide for School Heads
- NASH Study Guide: DepEd Memorandum 069, s. 2025 and PPSSH
- PPSSH Domain 1: Leading Strategically With DepEd Data
- PPSSH Domain 3: Teaching and Learning With DepEd Data
- PPSSH Domain 4: Developing Self and Others With DepEd Data
- PPSSH Domain 5: Building Connections With DepEd Data
- On the app: the NASH guide, the PPSSH guide, the principal shortage and the full data report, Philippine basic education in numbers
The data reports
- DepEd Enrollment Trends SY 2017-2018 to SY 2025-2026
- Enrollment by school year: SY 2017-18, SY 2018-19, SY 2019-20, SY 2020-21, SY 2021-22, SY 2022-23, SY 2023-24, SY 2024-25, SY 2025-26
- DepEd Learner Data SY 2023-2024: IP, ALIVE and School Size
- DepEd Teachers and School Personnel Data, SY 2023-2024
- DepEd Classroom and School Building Data, SY 2023-2024
- DepEd WASH Data SY 2023-2024: Toilets, Water, Electricity
- DepEd ICT Data SY 2023-2024: Computers and Internet
- NAT Grade 6 Results SY 2023-2024: DepEd Division Scores
- ELLNA Grade 3 Results SY 2023-2024: DepEd Division Scores
- CRLA Results SY 2025-2026: Reading Levels in Grades 1 to 3
- DepEd School Inputs vs Test Results: Multigrade and Internet
- DepEd Open Data Quality: Errors, Blanks and Coverage Limits
- Download Cleaned DepEd School Data, SY 2017-18 to 2025-26
Written by Mark Anthony Llego for NASH Reviewer. Sources: DepEd Order No. 024, s. 2020 and the PPSSH booklet; DepEd Memorandum No. 069, s. 2025; EDCOM II Final Report, January 2026; DepEd public datasets. Charts may be reused only with written permission from support@nash.com.ph.