DepEd’s SY 2018-2019 enrollment file is a school-by-school count from the Learner Information System (LIS). Enrollment rose by 706,560 learners to 27,018,509, a 2.7% increase, and every one of the 18 regions grew. No other year in the nine-year series matches that growth except the rebound after the pandemic. The kindergarten class, 2,409,782, was the largest of the nine years, and the Grade 1 class grew by more than a fifth.
Classes opened on June 4, 2018. It was the third year of senior high school and the second with both Grades 11 and 12 filled. In the same year, Filipino 15-year-olds sat the 2018 round of the Programme for International Student Assessment (PISA). Its results in December 2019 would start the national debate about a learning crisis. The enrollment file does not show any of that yet. It records a system that was still growing.
Key findings
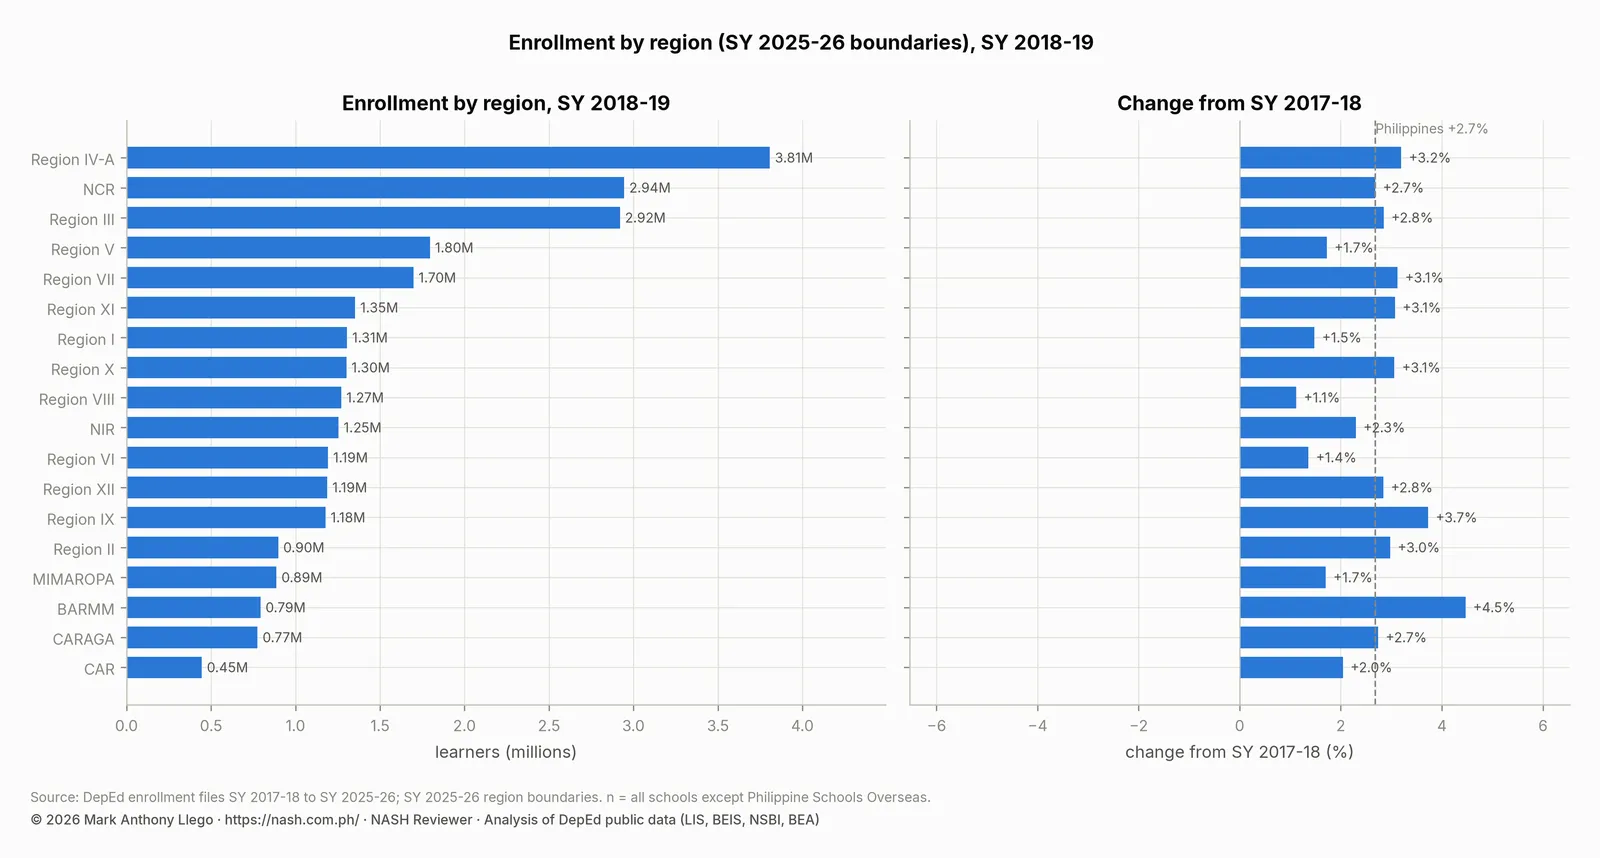
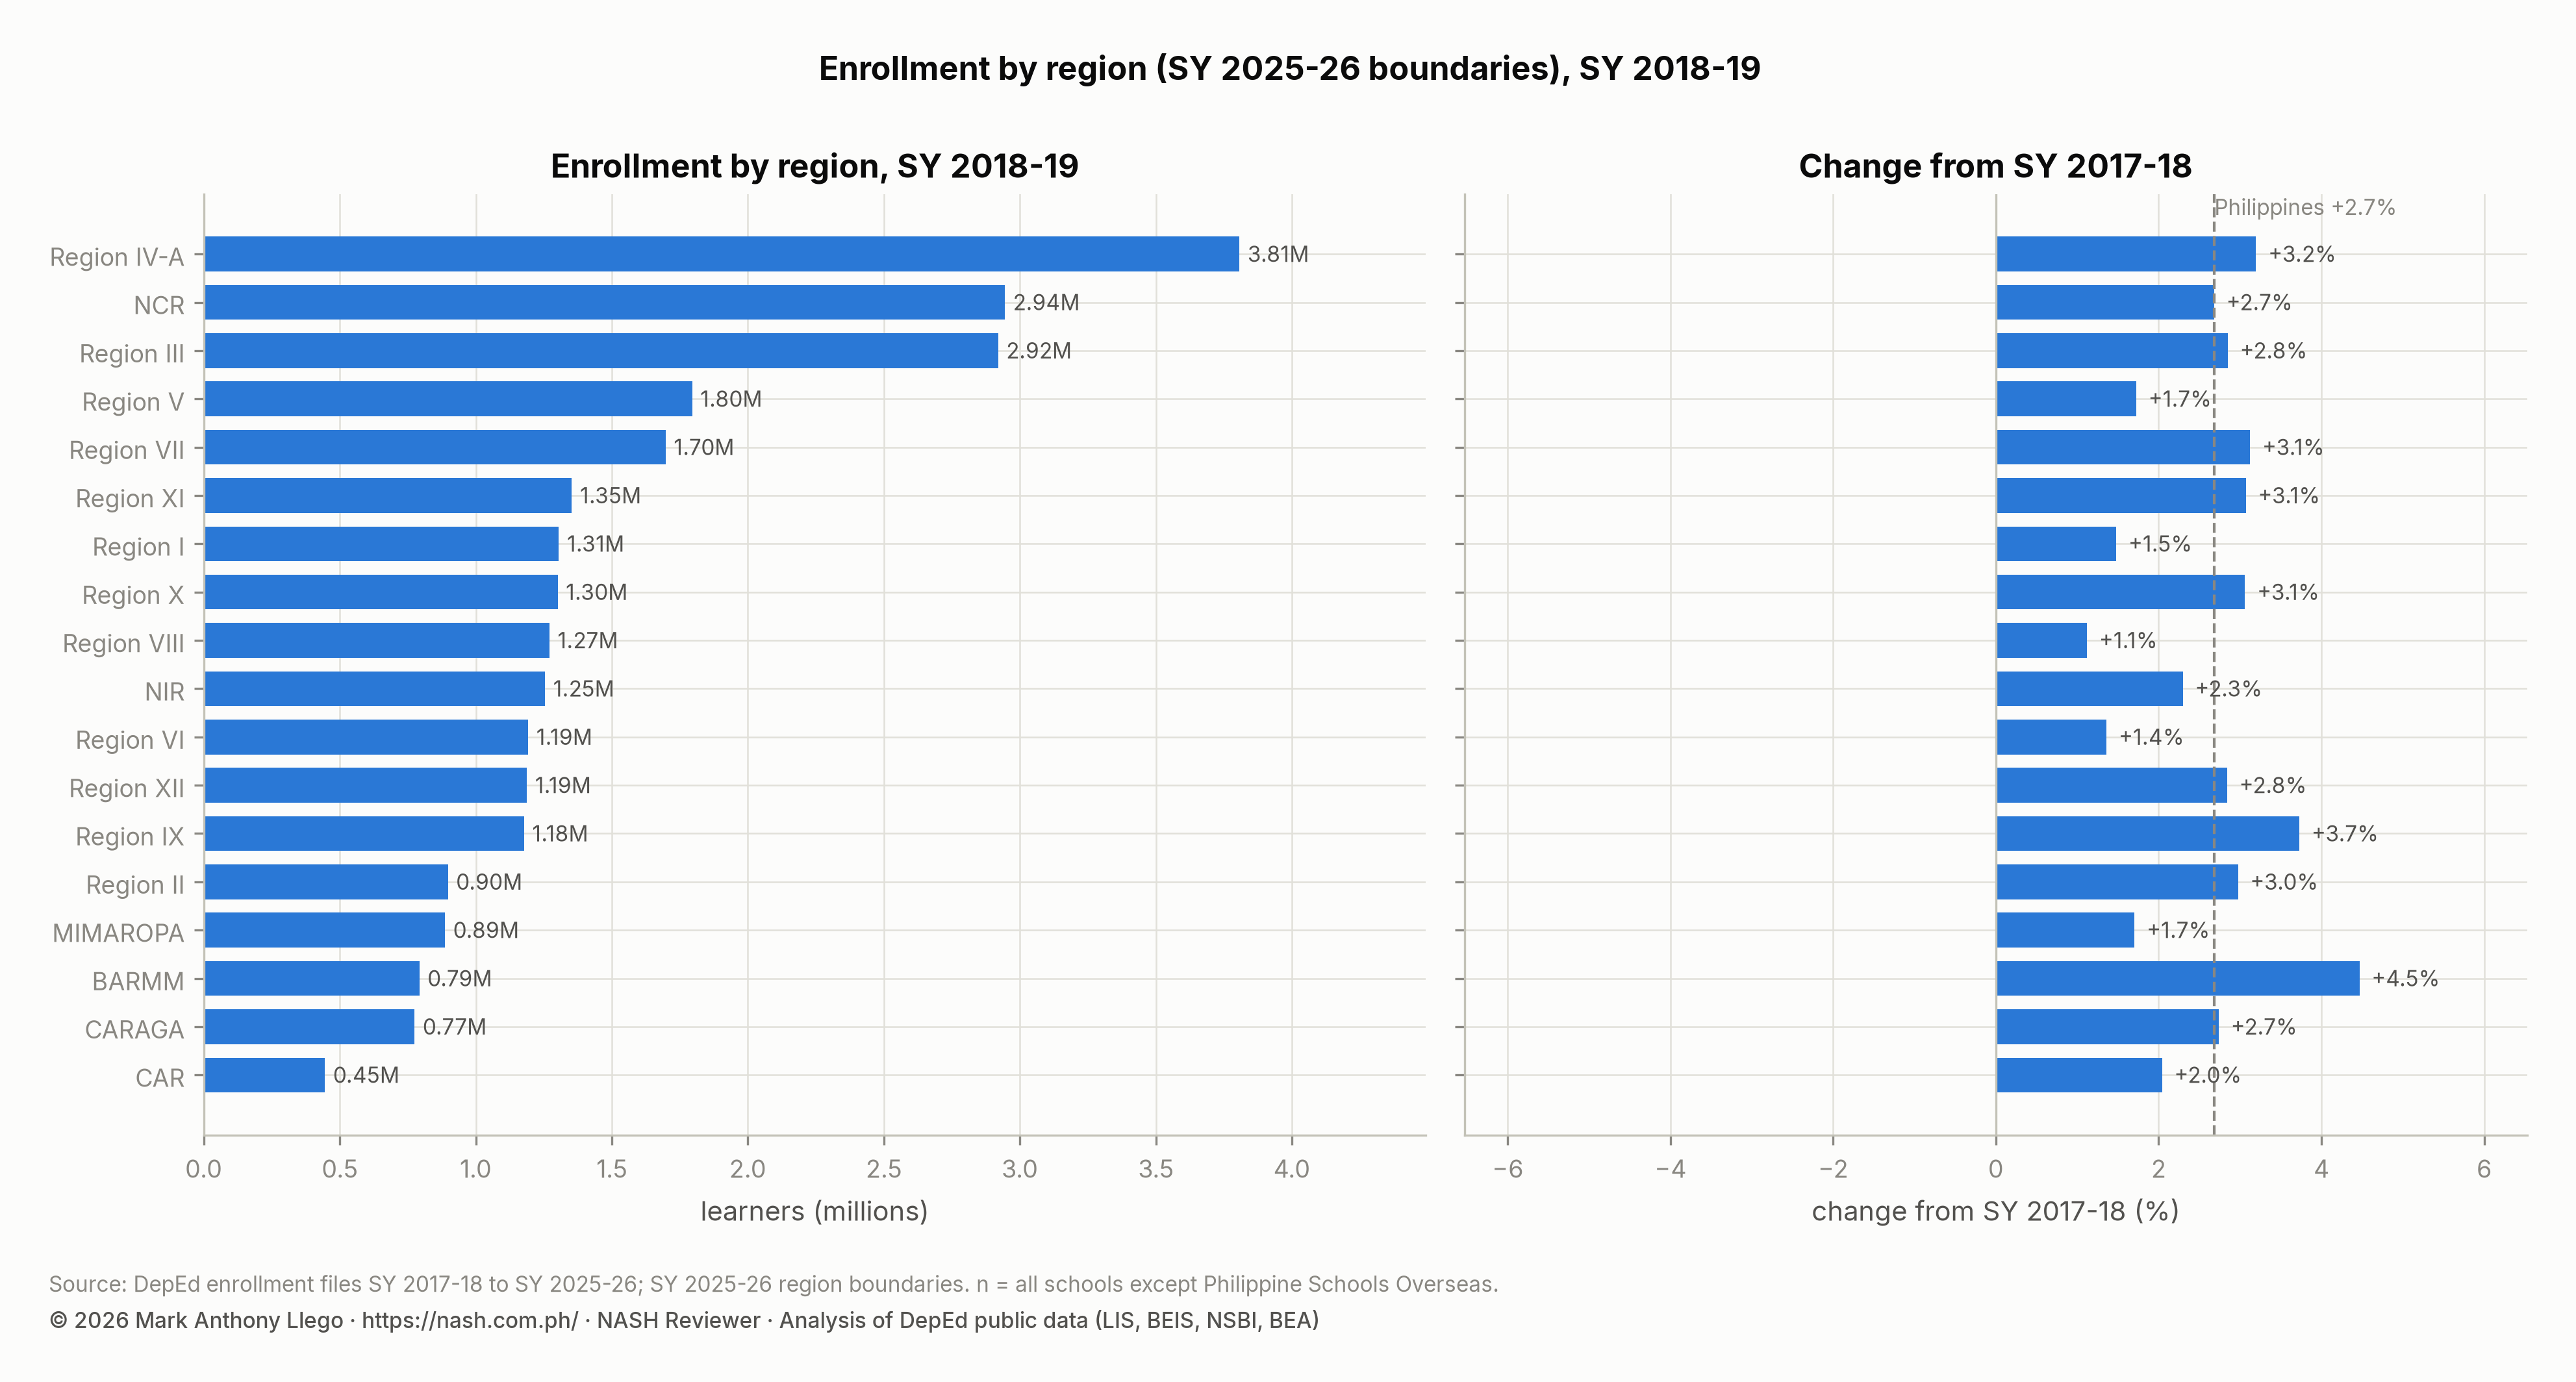
- Enrollment grew by 706,560 learners (+2.7%) to 27,018,509. All 18 regions grew, from 1.1% in Region VIII to 4.5% in BARMM.
- Kindergarten reached 2,409,782, the largest class of the nine years. Grade 1 rose by 418,439 learners, or 21.7%, the largest single-grade movement in the series.
- Senior high enrolled 3,022,841 learners. Humanities and Social Sciences (HUMSS) grew by 47.8% in one year and became the third-largest strand.
- Private enrollment reached 4,298,566, a 15.9% share, the highest in the series. Private schools held 44.3% of senior high, down from 45.7%.
- Marawi City was the fastest-growing division, up 164%. Its schools filled again after the 2017 siege, from 15,662 to 41,413 learners.
| Item | SY 2018-19 | SY 2017-18 | Change | Change (%) |
|---|---|---|---|---|
| Schools in the file | 61,916 | 61,563 | +353 | +0.6% |
| Schools reporting enrollment | 61,916 | 61,563 | +353 | +0.6% |
| Total enrollment | 27,018,509 | 26,311,949 | +706,560 | +2.7% |
| Kindergarten | 2,409,782 | 2,268,455 | +141,327 | +6.2% |
| Grades 1 to 6 | 13,201,928 | 13,418,841 | -216,913 | -1.6% |
| Elementary non-graded | 63,331 | 64,779 | -1,448 | -2.2% |
| Elementary (K to 6 and non-graded) | 15,675,041 | 15,752,075 | -77,034 | -0.5% |
| Junior high school (Grades 7 to 10 and non-graded) | 8,320,627 | 7,826,414 | +494,213 | +6.3% |
| Senior high school (Grades 11 and 12) | 3,022,841 | 2,733,460 | +289,381 | +10.6% |
| Female learners | 13,286,514 | 12,928,531 | +357,983 | +2.8% |
| Male learners | 13,731,995 | 13,383,418 | +348,577 | +2.6% |
| Female share of learners | 49.2% | 49.1% | +0.04 points |
Enrollment by grade level: large cohorts move up
The year’s growth was not spread evenly across the grades. It came from a large kindergarten intake and from the senior high grades, with junior high in between.
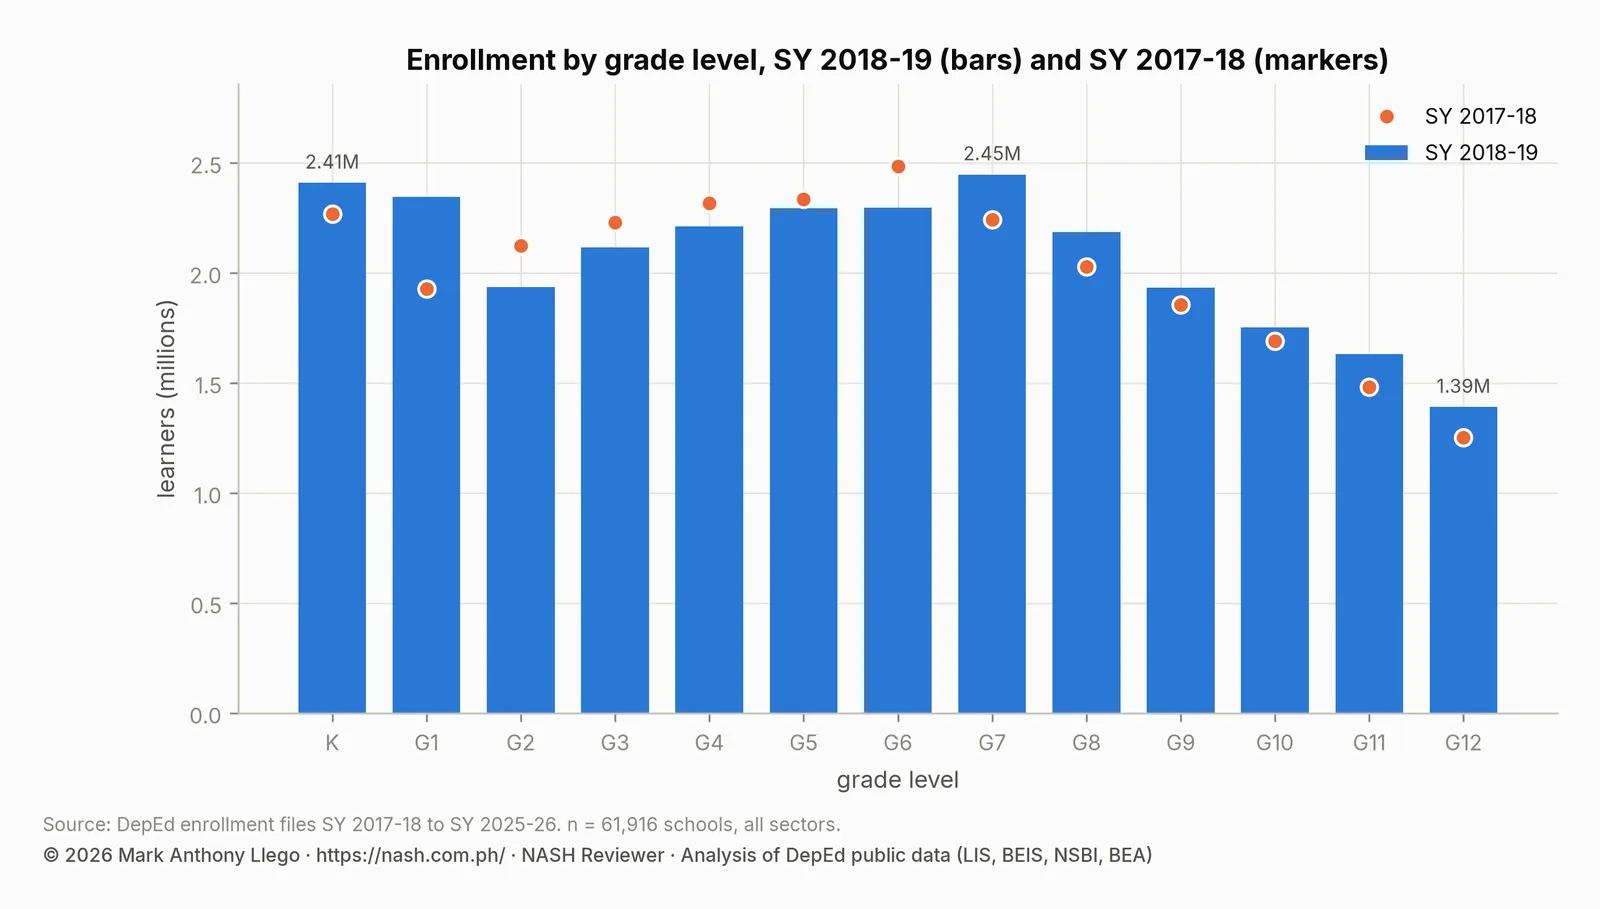
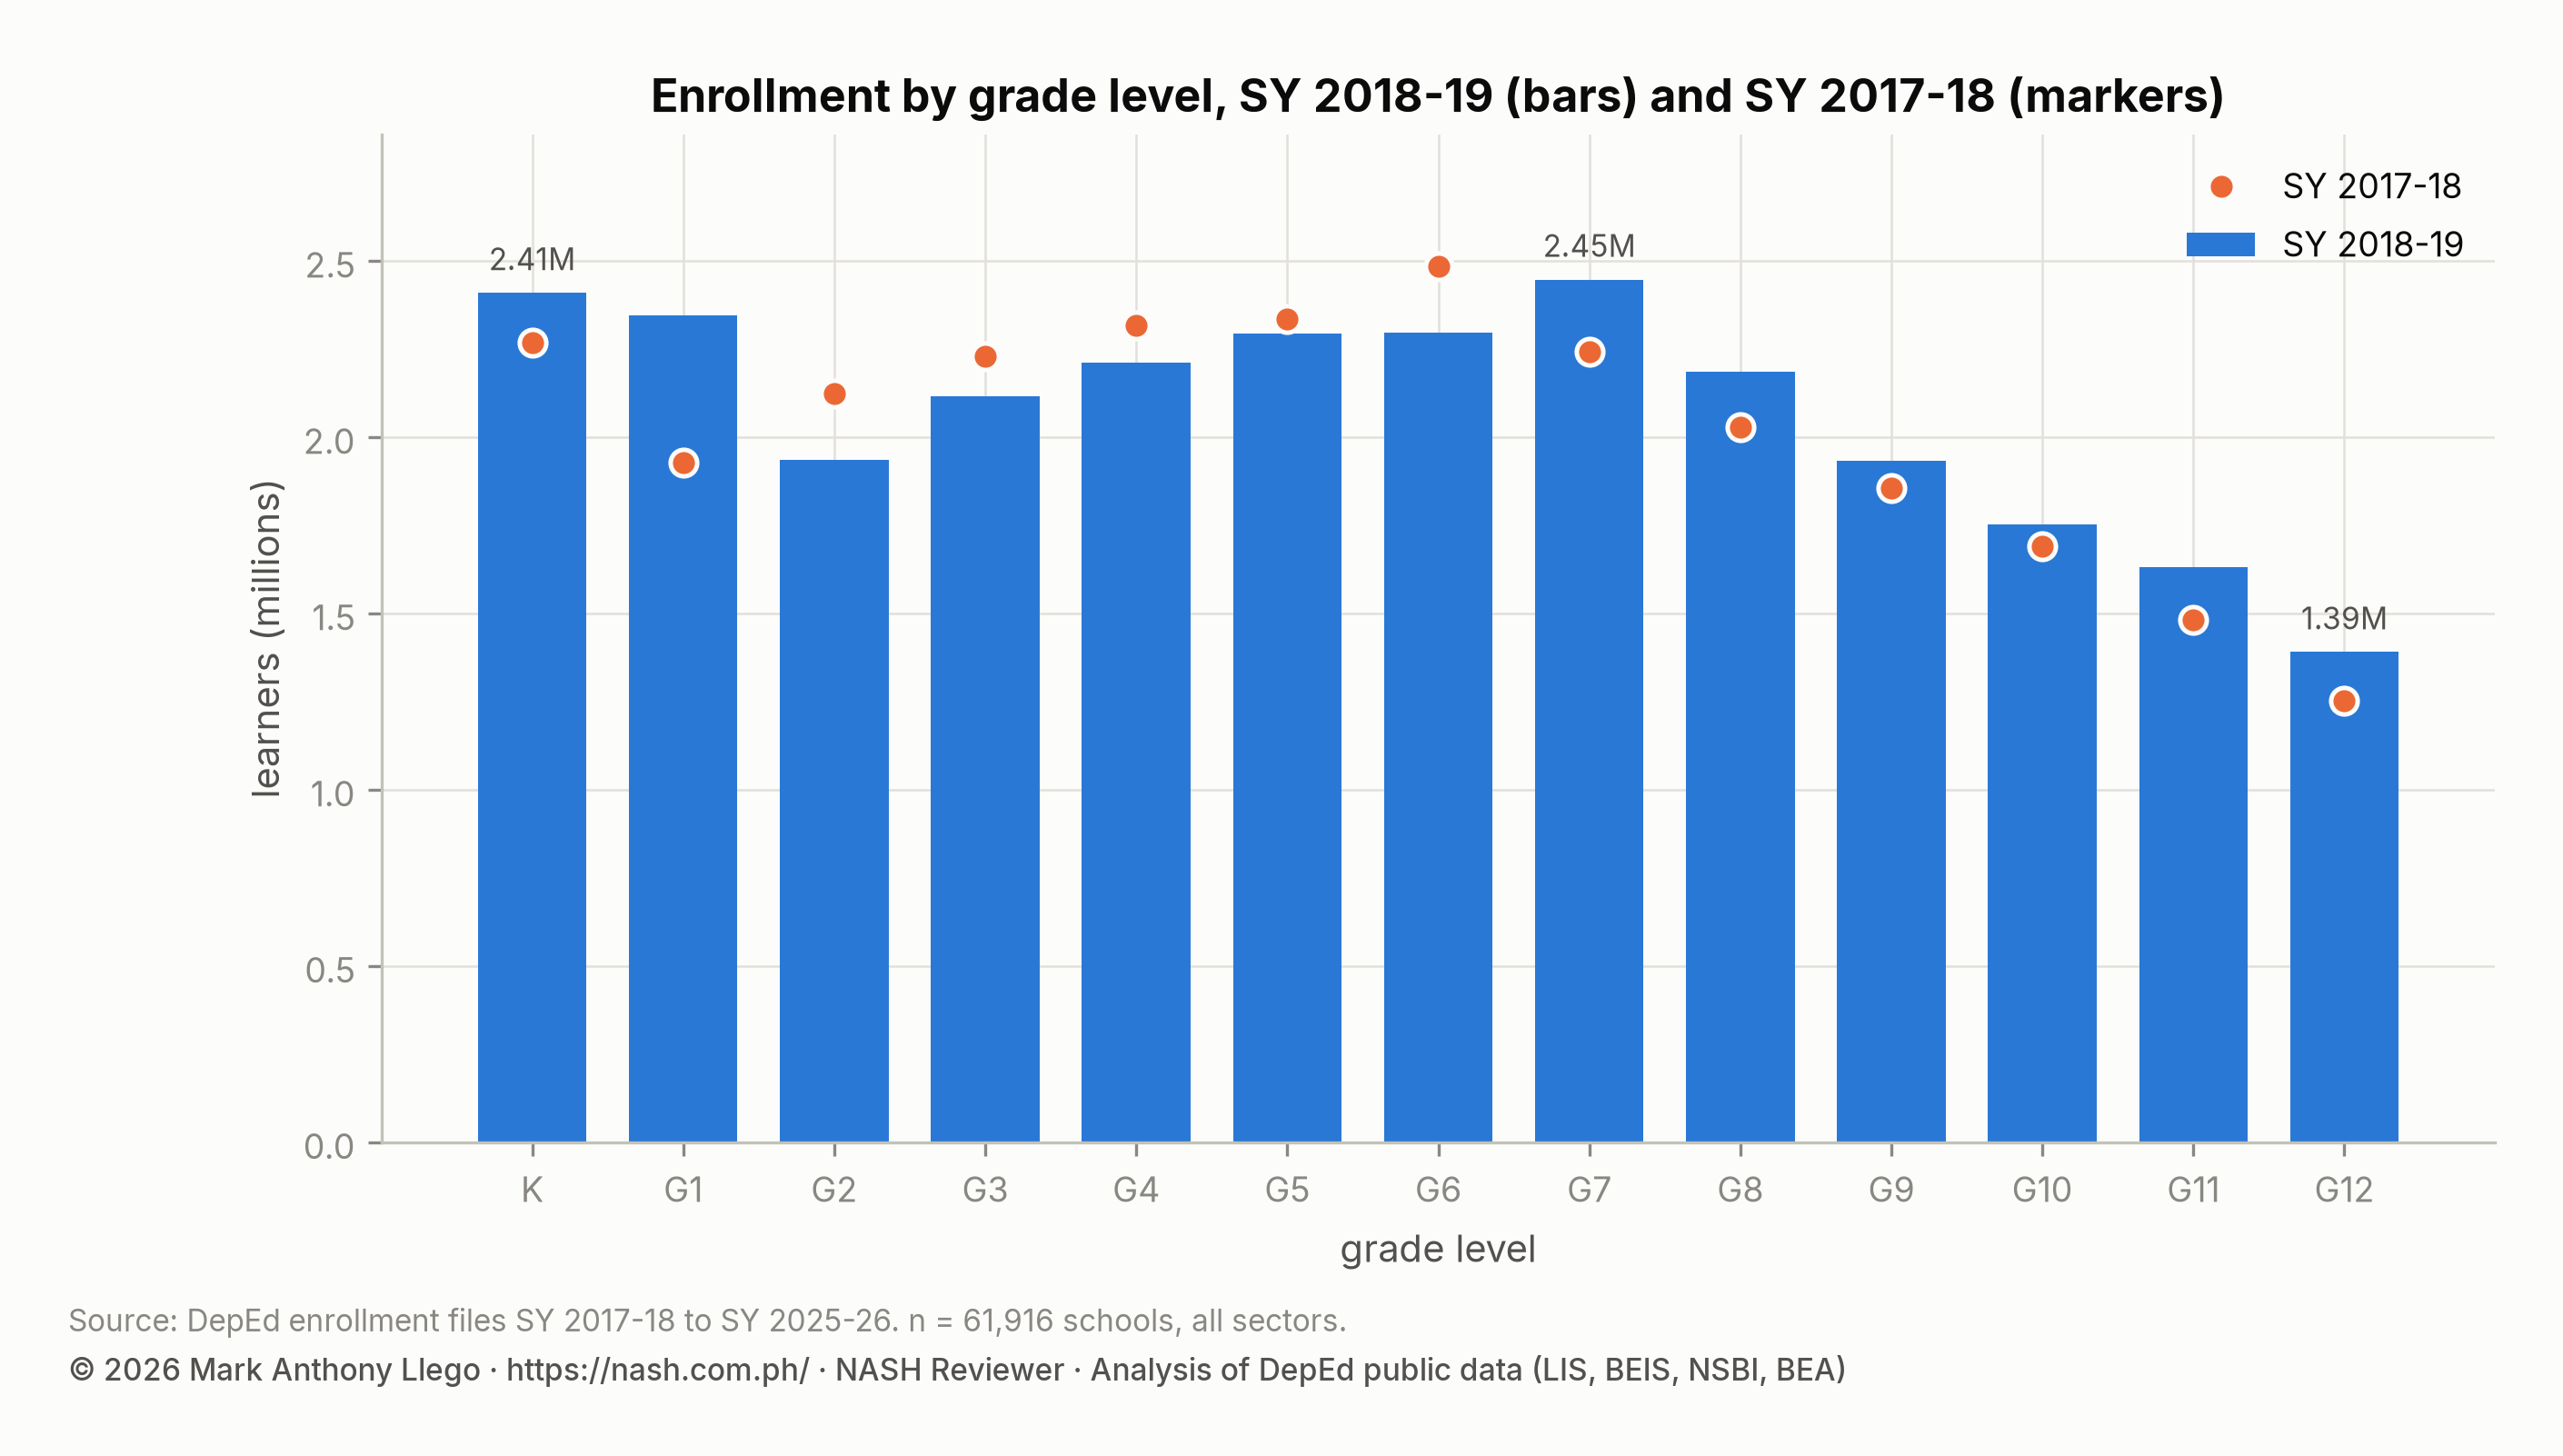
Grade 1 rose from 1,927,095 to 2,345,534, an increase of 21.7%. That increase of 418,439 learners was the largest single-grade movement in the series. It was the large SY 2017-2018 kindergarten class of 2.27 million moving up. Grade 1 took 1.034 learners for every kindergarten learner of the year before. The excess over 1 is over-age entrants and children who enter Grade 1 without a kindergarten record.
Behind it, Grade 2 fell by 189,048 (−8.9%) as the small SY 2017-2018 Grade 1 cohort moved into it. Grades 3 to 6 each lost between 1.7% and 7.6%, because the cohorts they received were smaller than the ones they released.
| Grade | Learners | Share of total | SY 2017-18 | Change | Change (%) |
|---|---|---|---|---|---|
| Kindergarten | 2,409,782 | 8.9% | 2,268,455 | +141,327 | +6.2% |
| Grade 1 | 2,345,534 | 8.7% | 1,927,095 | +418,439 | +21.7% |
| Grade 2 | 1,935,776 | 7.2% | 2,124,824 | -189,048 | -8.9% |
| Grade 3 | 2,115,523 | 7.8% | 2,229,432 | -113,909 | -5.1% |
| Grade 4 | 2,212,689 | 8.2% | 2,316,663 | -103,974 | -4.5% |
| Grade 5 | 2,294,920 | 8.5% | 2,334,987 | -40,067 | -1.7% |
| Grade 6 | 2,297,486 | 8.5% | 2,485,840 | -188,354 | -7.6% |
| Grade 7 | 2,447,556 | 9.1% | 2,243,708 | +203,848 | +9.1% |
| Grade 8 | 2,185,177 | 8.1% | 2,029,625 | +155,552 | +7.7% |
| Grade 9 | 1,933,761 | 7.2% | 1,855,356 | +78,405 | +4.2% |
| Grade 10 | 1,754,133 | 6.5% | 1,692,262 | +61,871 | +3.7% |
| Grade 11 | 1,632,005 | 6.0% | 1,481,103 | +150,902 | +10.2% |
| Grade 12 | 1,390,836 | 5.1% | 1,252,357 | +138,479 | +11.1% |
Junior high gained 494,213 learners (+6.3%). Grade 7 rose 9.1% as the SY 2017-2018 Grade 6 class, the largest grade in the system that year, moved up. Senior high gained 289,381 (+10.6%).
Flow ratios show how much of each feeder cohort continued. Grade 7 took 0.985 of the previous year’s Grade 6, Grade 11 took 0.964 of the previous Grade 10, and Grade 12 took 0.939 of the previous Grade 11. These are cross-sectional ratios, not DepEd’s transition rates, which subtract repeaters. They still show where learners left the system. The step from Grade 10 to 11 lost about one learner in 28, and the step from Grade 11 to 12 about one in 16.
Kindergarten itself grew by 141,327 (+6.2%) to its nine-year peak. No kindergarten class since has exceeded 2.2 million, and the SY 2024-2025 class was 1.83 million.
Senior high school strands in SY 2018-2019
| Track or strand | Learners | Share of senior high | SY 2017-18 | Change | Change (%) |
|---|---|---|---|---|---|
| TVL | 1,085,926 | 35.9% | 1,025,907 | +60,019 | +5.9% |
| GAS | 577,830 | 19.1% | 571,129 | +6,701 | +1.2% |
| HUMSS | 473,958 | 15.7% | 320,577 | +153,381 | +47.8% |
| STEM | 436,376 | 14.4% | 399,360 | +37,016 | +9.3% |
| ABM | 416,558 | 13.8% | 391,436 | +25,122 | +6.4% |
| Maritime | 13,818 | 0.5% | 10,090 | +3,728 | +36.9% |
| Arts and Design | 13,215 | 0.4% | 10,574 | +2,641 | +25.0% |
| Sports | 5,160 | 0.2% | 4,387 | +773 | +17.6% |
With two complete cohorts, senior high enrolled 3,022,841 learners, 11.2% of all learners. The Technical-Vocational-Livelihood (TVL) track stayed the largest, with 1,085,926 learners or 35.9% of senior high, but the mix of strands had started to change. Humanities and Social Sciences (HUMSS) grew by 153,381 learners in one year, or 47.8%. It rose from 320,577 to 473,958 and overtook Science, Technology, Engineering and Mathematics (STEM) and Accountancy, Business and Management (ABM) to become the third-largest strand. STEM grew 9.3% to 436,376.
The General Academic Strand (GAS), second largest at 577,830, grew only 1.2%. That was the first sign of the decline GAS would begin the following year. Maritime (+36.9%) and Arts and Design (+25.0%) grew fast from small bases of about 10,000 each.
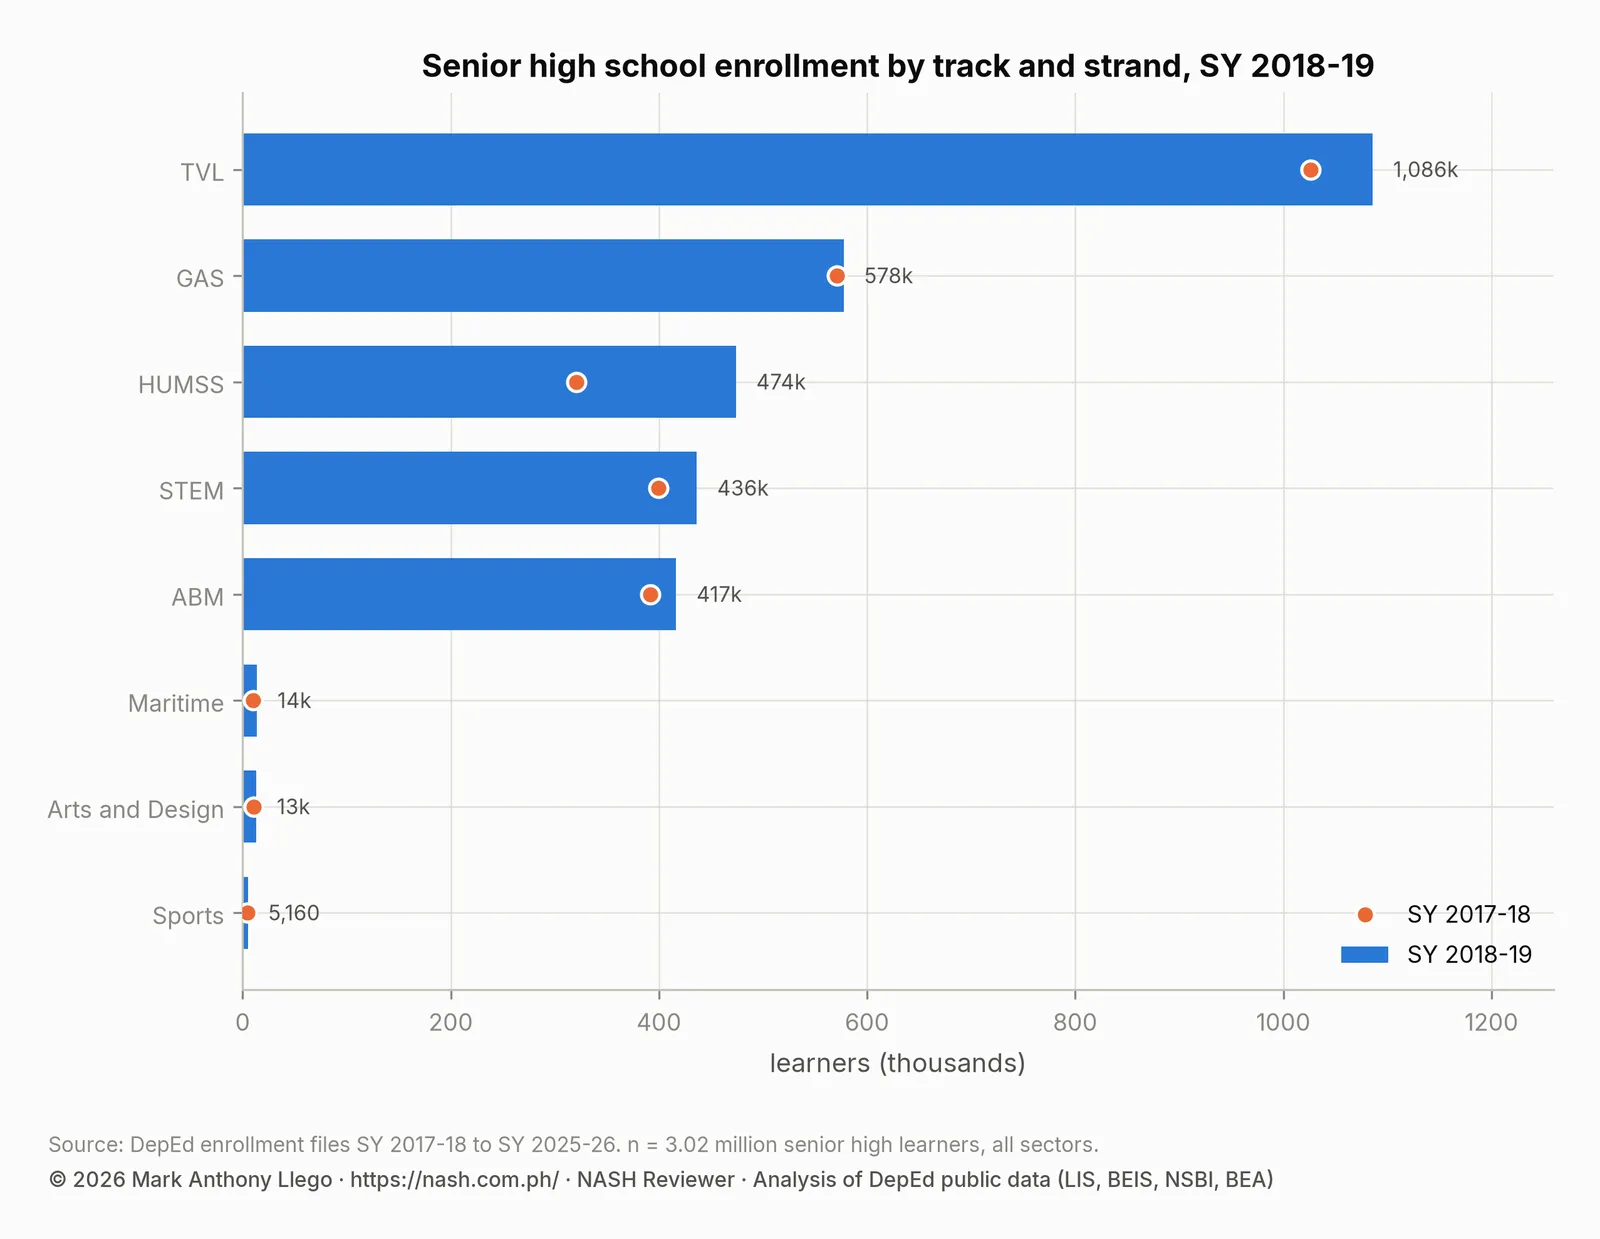
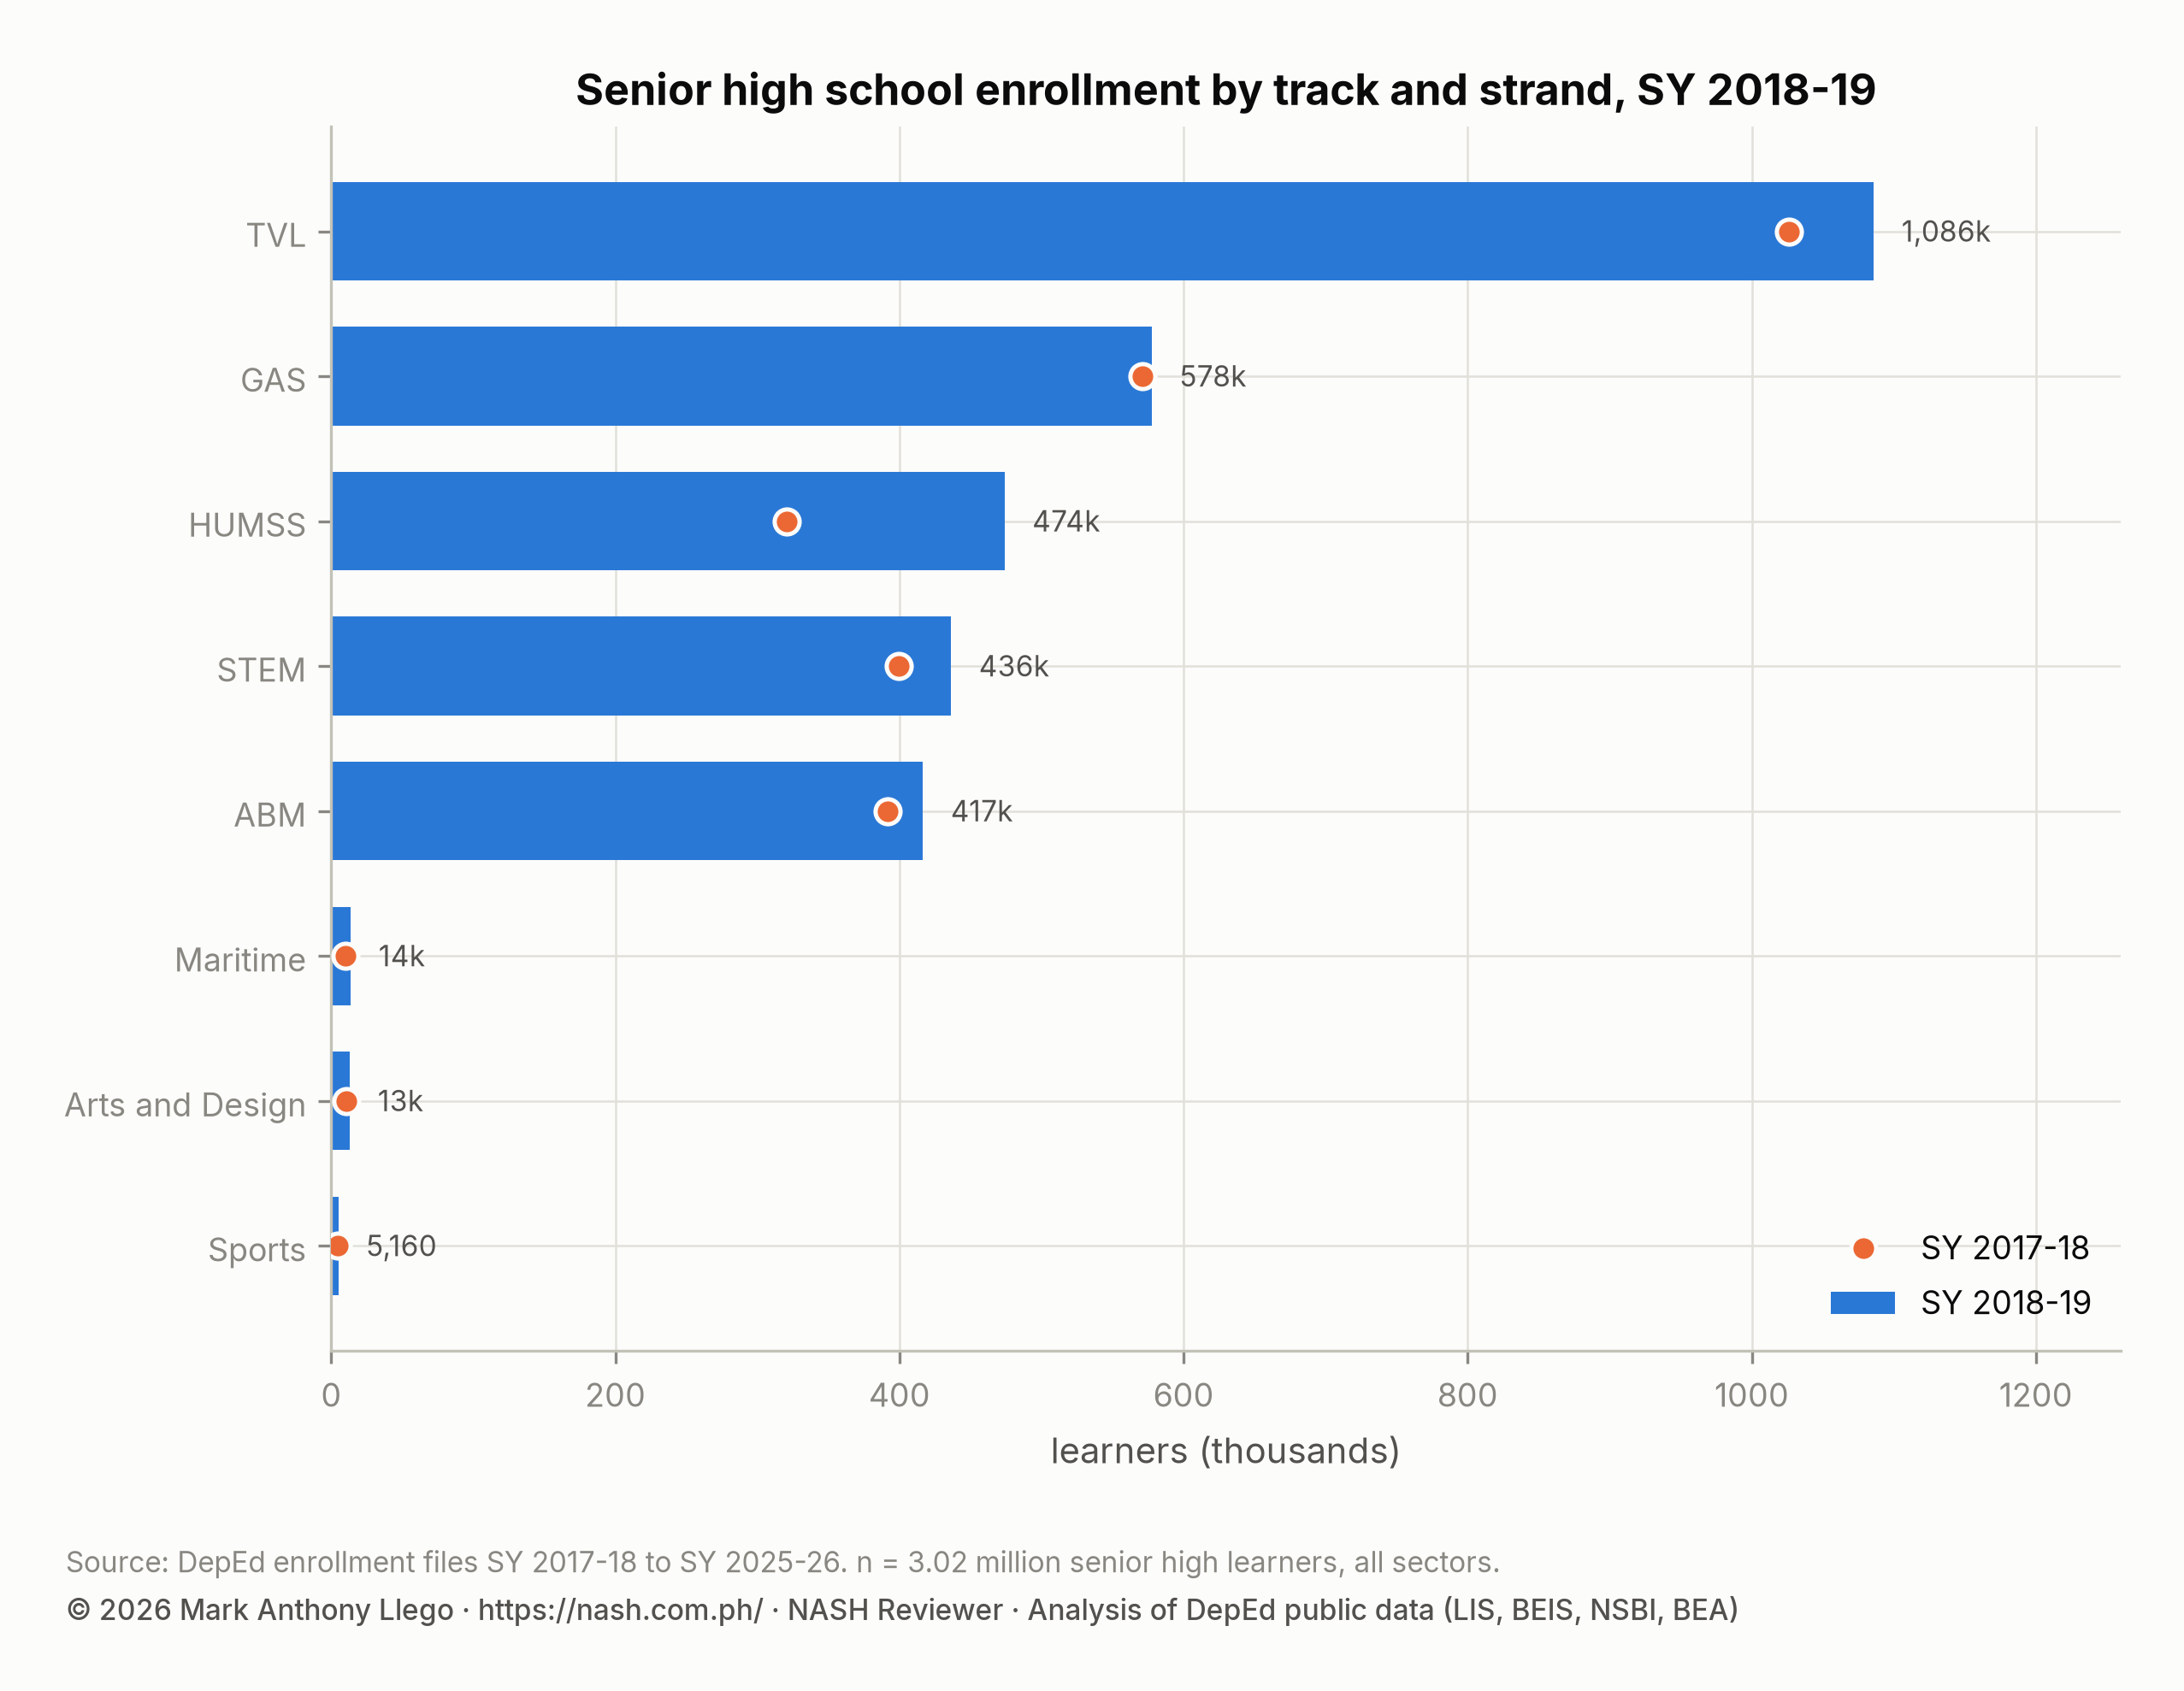
The private share of senior high fell slightly. Private schools had 44.3% of Grades 11 and 12, down from 45.7%. Public senior high enrollment grew 14.7% to 1,599,637, while private senior high grew 7.3%.
Enrollment by region and division: all 18 regions grew
| Region (SY 2025-26 boundaries) | Schools | Learners | Share of learners | SY 2017-18 | Change | Change (%) | Private share | Senior high share | Female share |
|---|---|---|---|---|---|---|---|---|---|
| Region IV-A | 6,576 | 3,807,176 | 14.1% | 3,689,236 | +117,940 | +3.2% | 22.8% | 11.4% | 49.0% |
| NCR | 3,261 | 2,944,976 | 10.9% | 2,868,073 | +76,903 | +2.7% | 29.1% | 13.8% | 49.4% |
| Region III | 5,422 | 2,920,039 | 10.8% | 2,839,168 | +80,871 | +2.8% | 19.2% | 11.8% | 49.0% |
| Region V | 4,450 | 1,795,289 | 6.6% | 1,764,865 | +30,424 | +1.7% | 9.0% | 10.8% | 48.9% |
| Region VII | 3,603 | 1,697,810 | 6.3% | 1,646,395 | +51,415 | +3.1% | 16.9% | 11.6% | 49.0% |
| Region XI | 2,738 | 1,353,174 | 5.0% | 1,312,861 | +40,313 | +3.1% | 14.4% | 10.1% | 49.4% |
| Region I | 3,468 | 1,305,362 | 4.8% | 1,286,348 | +19,014 | +1.5% | 13.2% | 12.5% | 48.6% |
| Region X | 3,178 | 1,300,956 | 4.8% | 1,262,319 | +38,637 | +3.1% | 13.4% | 9.9% | 49.3% |
| Region VIII | 4,484 | 1,270,720 | 4.7% | 1,256,668 | +14,052 | +1.1% | 6.9% | 10.9% | 49.0% |
| NIR | 2,752 | 1,254,527 | 4.6% | 1,226,368 | +28,159 | +2.3% | 11.0% | 10.7% | 49.2% |
| Region VI | 3,529 | 1,192,633 | 4.4% | 1,176,643 | +15,990 | +1.4% | 11.0% | 11.8% | 48.6% |
| Region XII | 2,673 | 1,187,895 | 4.4% | 1,155,084 | +32,811 | +2.8% | 11.3% | 9.8% | 49.4% |
| Region IX | 3,342 | 1,177,437 | 4.4% | 1,135,114 | +42,323 | +3.7% | 8.2% | 9.1% | 49.8% |
| Region II | 2,969 | 897,554 | 3.3% | 871,626 | +25,928 | +3.0% | 12.3% | 11.3% | 49.1% |
| MIMAROPA | 2,657 | 886,699 | 3.3% | 871,849 | +14,850 | +1.7% | 8.5% | 10.4% | 49.0% |
| BARMM | 2,314 | 792,399 | 2.9% | 758,518 | +33,881 | +4.5% | 11.4% | 6.2% | 51.8% |
| CARAGA | 2,360 | 774,978 | 2.9% | 754,330 | +20,648 | +2.7% | 9.2% | 10.4% | 48.9% |
| CAR | 2,120 | 445,393 | 1.6% | 436,484 | +8,909 | +2.0% | 20.1% | 12.3% | 49.2% |
Growth ran from 1.1% in Region VIII to 4.5% in BARMM. Region IX (3.7%), Region IV-A (3.2%), Region VII and Region XI (3.1%) came next. In absolute terms, Region IV-A added the most learners, 117,940, followed by Region III (80,871) and NCR (76,903). The three largest regions, Region IV-A, NCR and Region III, held 35.8% of all learners. NCR was still second to Region IV-A, but it would fall behind Region III within two years.
BARMM’s growth was concentrated in one division. The fastest-growing division in the country was Marawi City, where enrollment rose from 15,662 to 41,413, an increase of 164%. The SY 2017-2018 count was taken weeks after the siege of Marawi began in May 2017, when most of the city’s population had been displaced. The SY 2018-2019 count records the schools filling again. Tawi-Tawi (+8.0%) was third. Elsewhere, Talisay City in Cebu grew 8.5%, Balanga City 7.4% and Mandaluyong 6.7%. The steepest genuine declines were small: Lanao del Sur’s two divisions lost 2.8% and 2.3%, and Pasay City lost 1.2%.
| Division | Region | Schools | Learners, SY 2018-19 | Learners, SY 2017-18 | Change | Change (%) | |
|---|---|---|---|---|---|---|---|
| Fastest growth | Marawi City | BARMM | 96 | 41,413 | 15,662 | +25,751 | +164.4% |
| Fastest growth | Talisay City | Region VII | 79 | 65,768 | 60,599 | +5,169 | +8.5% |
| Fastest growth | Tawi-Tawi | BARMM | 304 | 85,730 | 79,403 | +6,327 | +8.0% |
| Fastest growth | Balanga City | Region III | 44 | 31,054 | 28,915 | +2,139 | +7.4% |
| Fastest growth | Mandaluyong City | NCR | 74 | 83,776 | 78,530 | +5,246 | +6.7% |
| Steepest decline | Lanao del Sur - II | BARMM | 414 | 103,157 | 106,079 | -2,922 | -2.8% |
| Steepest decline | Lanao del Sur - I | BARMM | 452 | 140,991 | 144,341 | -3,350 | -2.3% |
| Steepest decline | Pasay City | NCR | 92 | 79,231 | 80,212 | -981 | -1.2% |
| Steepest decline | Science City of Muñoz | Region III | 51 | 22,483 | 22,719 | -236 | -1.0% |
| Steepest decline | Malolos City | Region III | 113 | 65,963 | 66,425 | -462 | -0.7% |
The table leaves out two divisions that lost far more, because the loss was administrative. Three new schools divisions appear in this file. Cabuyao City (76,697 learners) was carved from Laguna, and Himamaylan City (30,766) and Sipalay City (23,026) were carved from Negros Occidental. Laguna’s enrollment therefore fell 17.1% and Negros Occidental’s 11.0% without a single learner leaving school. Anyone ranking divisions year on year has to check for new divisions.
Public and private school enrollment: private share at its highest
| Sector | Schools | Learners | Share of learners | Kindergarten | Elementary (K to 6) | Junior high | Senior high | Schools, SY 2017-18 | Learners, SY 2017-18 | Change (%) |
|---|---|---|---|---|---|---|---|---|---|---|
| Public | 47,025 | 22,558,138 | 83.5% | 2,110,675 | 14,118,252 | 6,840,249 | 1,599,637 | 46,815 | 22,096,820 | +2.1% |
| Private | 14,562 | 4,298,566 | 15.9% | 296,266 | 1,536,798 | 1,421,817 | 1,339,951 | 14,430 | 4,065,515 | +5.7% |
| SUC/LUC laboratory schools | 309 | 148,313 | 0.5% | 1,517 | 11,816 | 54,229 | 82,268 | 318 | 149,614 | -0.9% |
| Philippine Schools Overseas | 20 | 13,492 | 0.0% | 1,324 | 8,175 | 4,332 | 985 | 0 | 0 |
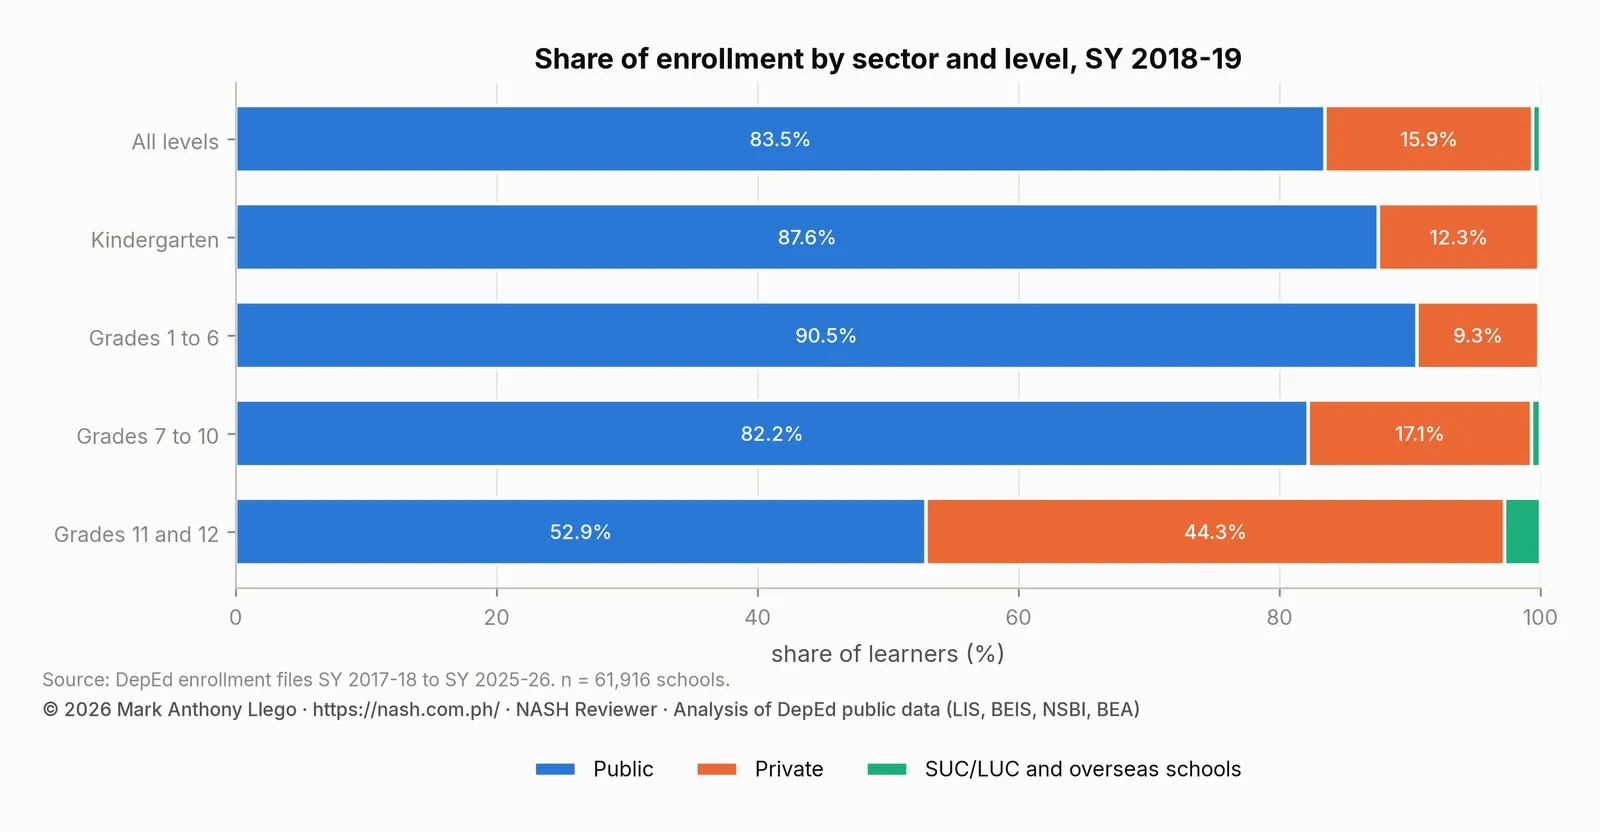
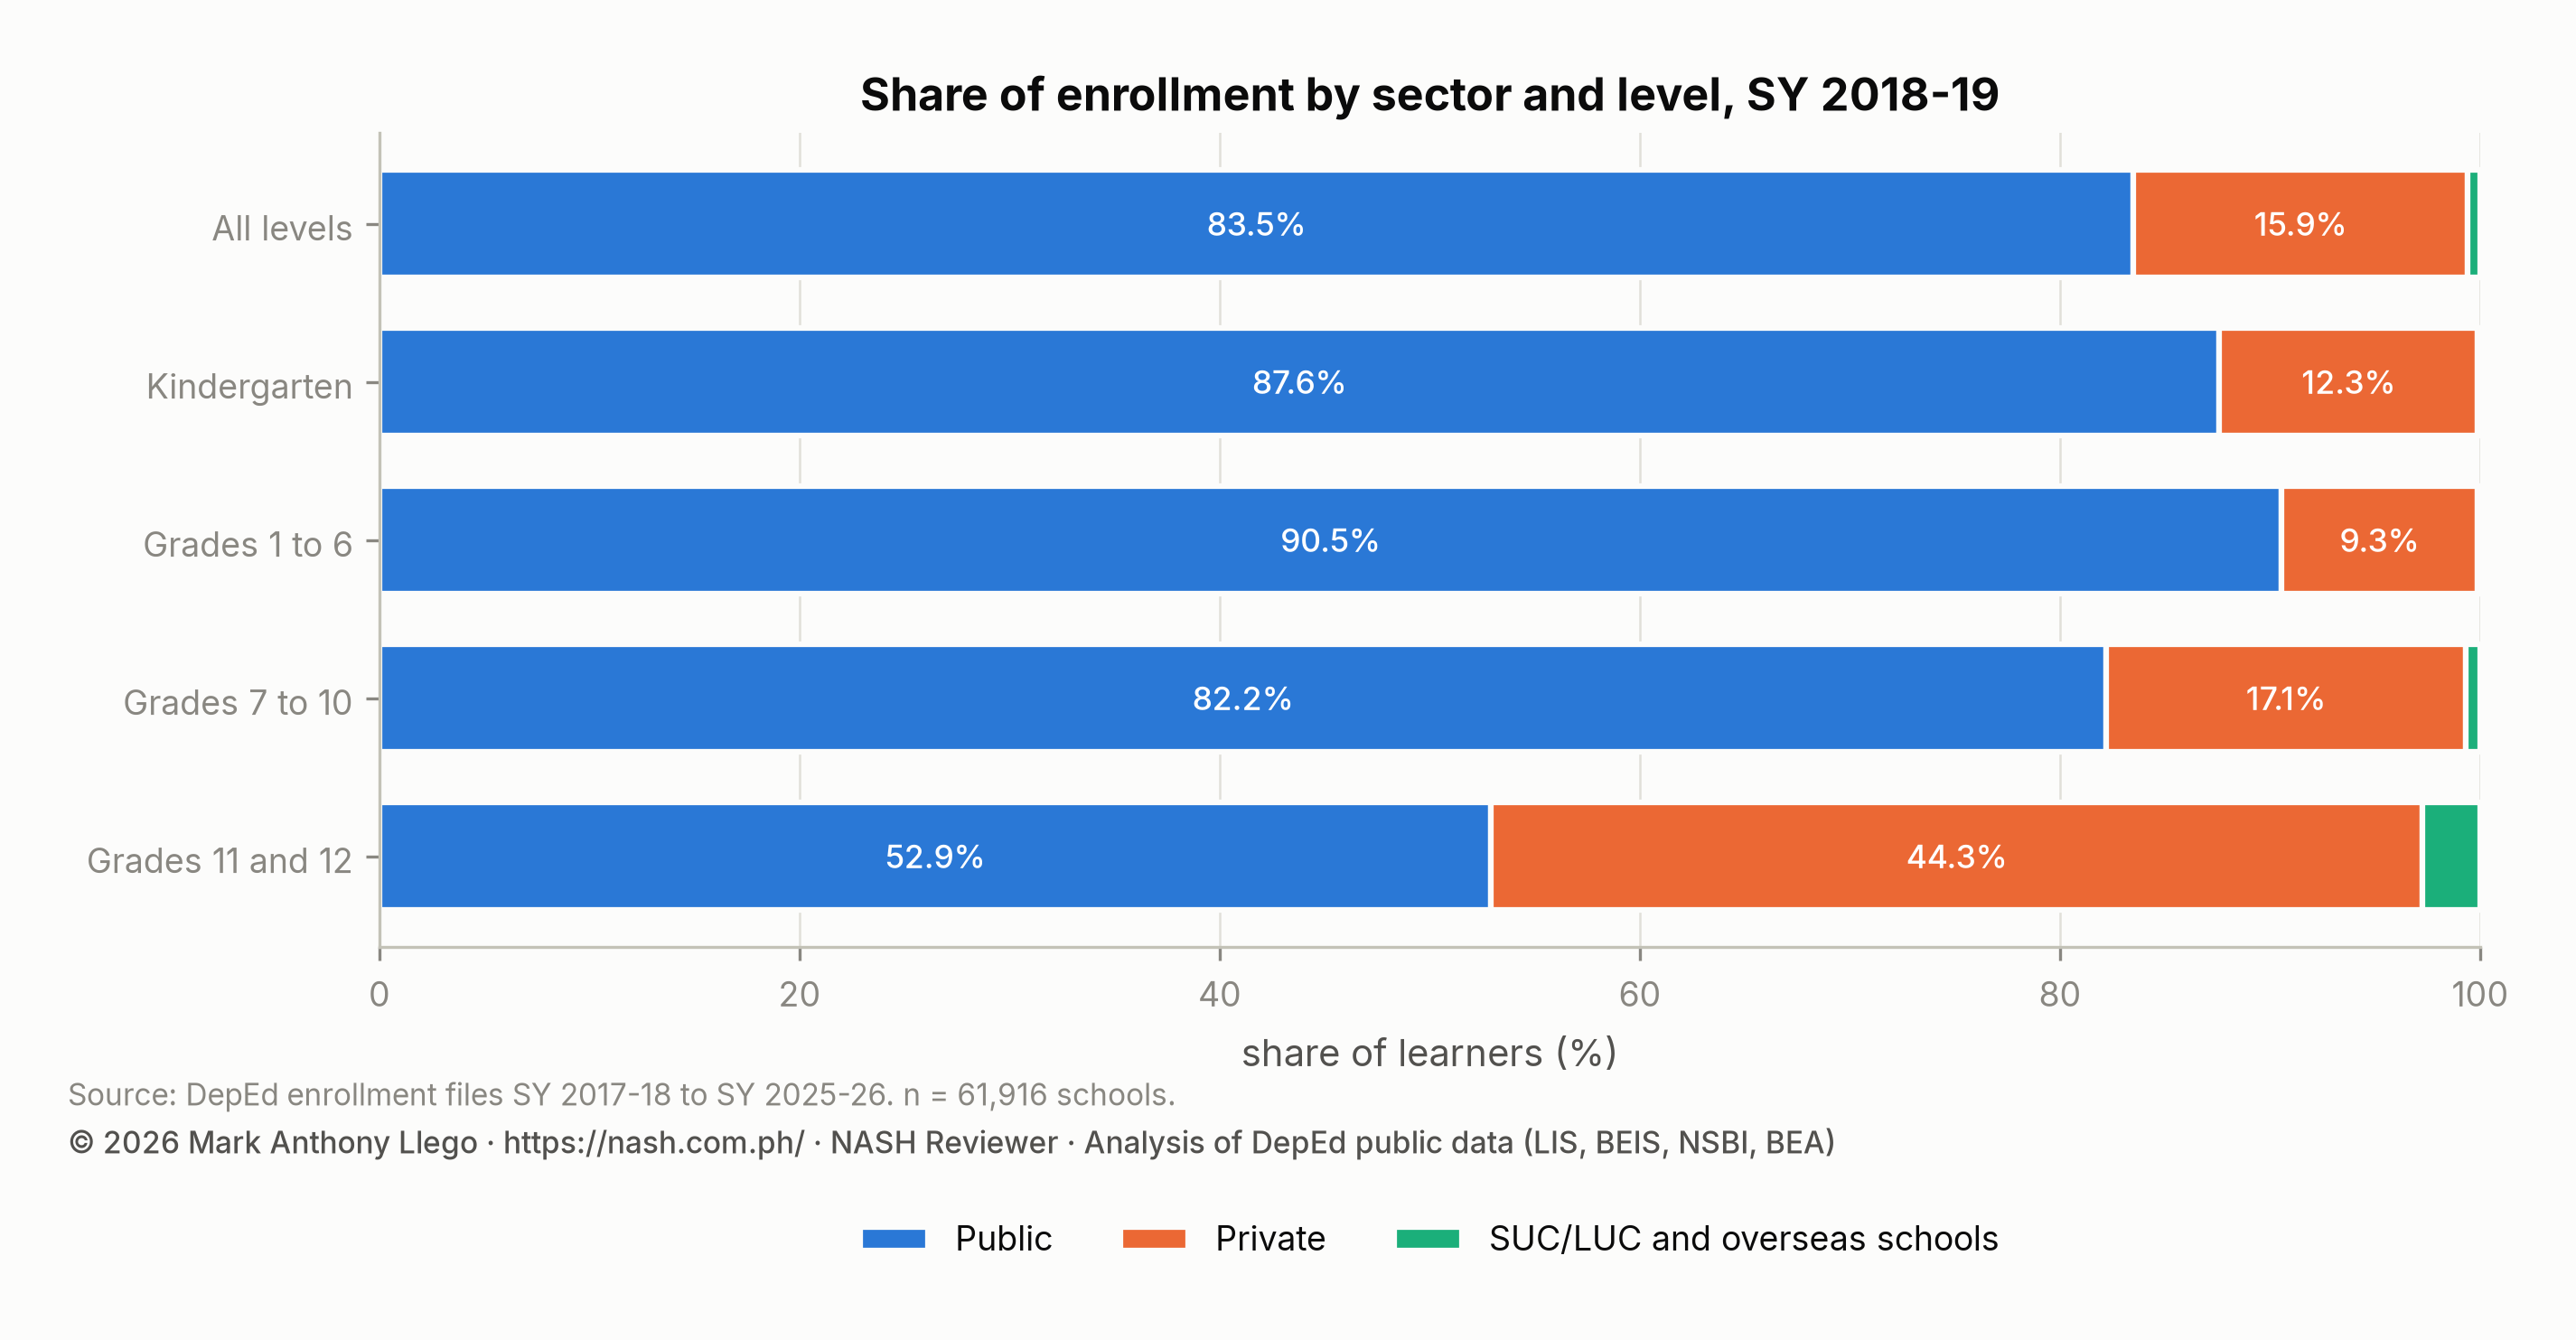
Private enrollment reached 4,298,566 learners in 14,562 schools. It grew by 233,051 learners (+5.7%), faster than public enrollment (+2.1%). The private share of all learners, 15.9%, was the highest in the series. Private schools held that share for one more year, before private enrollment fell by a fifth in the pandemic. Private schools held 12.3% of kindergarten learners and 9.3% of Grades 1 to 6. They held 17.1% of Grades 7 to 10 and 44.3% of senior high.
This is also the first file to list the Philippine Schools Overseas, 20 schools with 13,492 learners. They are left out of the regional tables. The 309 laboratory schools of state and local universities and colleges (SUC/LUC in the tables) held 148,313 learners, 82,268 of them in senior high.
Schools in the file: new, absent and by size
The file lists 61,916 schools, 353 more than the year before. Compared with the files before and after it, 1,077 schools appear for the first time, holding 183,013 learners. Most were public (496) or private (552); the rest were SUC/LUC schools and the 20 overseas schools. Another 1,034 schools present this year are absent from the SY 2019-2020 file, 581 of them private. Public entries and exits carry far more learners than private ones (144,443 entering, 119,293 exiting). Public school IDs change with mergers and conversions, so a “new” public school is often an old one under a new number.
| Sector | Schools in the file | Schools new in SY 2018-19 | Learners in new schools | Schools absent from SY 2019-20 | Their learners in this year |
|---|---|---|---|---|---|
| Public | 47,025 | 496 | 144,443 | 411 | 119,293 |
| Private | 14,562 | 552 | 24,028 | 581 | 21,030 |
| SUC/LUC laboratory schools | 309 | 9 | 1,050 | 42 | 6,829 |
| Philippine Schools Overseas | 20 | 20 | 13,492 | 0 | 0 |
The median public school had 237 learners and the median private school 109. Schools with 200 learners or fewer were 48.1% of all schools and held 11.1% of learners. The 2,180 schools with more than 2,000 learners held 28.1% of learners. Among private schools, 30.7% had 50 learners or fewer.
How to read the SY 2018-2019 enrollment file
- The SY 2018-2019 file has no column for non-graded junior high learners. The junior high total therefore excludes a group that numbered 5,463 in SY 2017-2018 and 2,141 in SY 2019-2020. The growth of junior high is slightly understated as a result.
- It is the only file to use the management label Tahderiyyah, for 29 schools, and the first to list the overseas schools.
- Regions follow the SY 2025-2026 boundaries. The 477 schools in Sulu, listed under ARMM in the file, are counted under Region IX. Cotabato City’s 86 schools, listed under Region XII, are counted under BARMM, and the Negros divisions under NIR.
- Changes compare every school in each file, not only schools present in both years. Growth measured only over schools present in both years stays within 0.4 points of the all-schools figure, as the trends report shows.
Frequently asked questions
How much did DepEd enrollment grow in SY 2018-2019?
Enrollment grew by 706,560 learners, or 2.7%, to 27,018,509. Elementary fell slightly (−0.5%) as small cohorts moved into Grades 2 to 6. Junior high grew 6.3% and senior high 10.6%.
Why did Grade 1 enrollment rise by 21.7% in SY 2018-2019?
Grade 1 rose because the SY 2017-2018 kindergarten class of 2,268,455 was much larger than the SY 2016-2017 class that fed Grade 1 the year before. Grade 1 took 1.034 learners for every kindergarten learner of the previous year, a normal ratio. The rise reflects the size of the cohort, not a change in flow.
Which schools division grew fastest in SY 2018-2019?
Marawi City grew fastest, by 164%, as its schools filled again after the 2017 siege. Among divisions that existed in both years and were not split, Talisay City (+8.5%), Tawi-Tawi (+8.0%) and Balanga City (+7.4%) came next.
Download the data
The cleaned, harmonized DepEd files behind this series are free to download in CSV and Parquet, with a codebook and checksums, under the terms of use set out in the release. Download Cleaned DepEd School Data, SY 2017-18 to 2025-26 documents every file and column. The files themselves are at data.nash.com.ph, starting with the README, the SY 2023-24 school master file (CSV, 8.0 MB) and the nine-year enrollment panel (Parquet, 17.2 MB).
More in this series
- Previous year: DepEd Enrollment SY 2017-2018: 26.3 Million Learners
- Next year: DepEd Enrollment SY 2019-2020: The Pre-Pandemic Peak
- The nine-year overview: DepEd Enrollment Trends SY 2017-2018 to SY 2025-2026
- All nine annual reports: SY 2017-18, SY 2018-19, SY 2019-20, SY 2020-21, SY 2021-22, SY 2022-23, SY 2023-24, SY 2024-25, SY 2025-26
- DepEd Data for Aspiring School Heads: Where to Start
- For aspiring school heads: How to Read DepEd Data and the full report, Philippine basic education in numbers
Analysis and charts by Mark Anthony Llego for NASH Reviewer. Data: Department of Education enrollment datasets for SY 2017-18 and SY 2018-19 (Learner Information System). Charts may be reused only with written permission from support@nash.com.ph.