Nine years of the Department of Education’s (DepEd) public enrollment files, SY 2017-2018 to SY 2025-2026, show where Philippine school enrollment is growing or shrinking. Enrollment peaked at 27,794,282 learners in SY 2022-2023 and has fallen every year since, to 25,935,863 in SY 2025-2026, in every region except BARMM. Enrollment is the number every school improvement plan starts from. It sets the teacher items a school can ask for, the classrooms it needs, the sections it opens and the budget it gets.
Philippine basic education has passed its peak. The rest of this report shows the trend by level, sector, region, grade and sex. It explains what the pandemic did and did not change, and it ends with what the numbers mean for anyone preparing to lead a school.
All figures come from DepEd’s Learner Information System (LIS) enrollment datasets, one row per school. The companion report on the NASH Reviewer app, Philippine basic education in numbers, holds the full method notes and the data behind every chart.
Key findings
- Total enrollment peaked at 27,794,282 in SY 2022-2023 and fell to 25,935,863 in SY 2025-2026, below the SY 2017-2018 starting point of 26,311,949. The compound change over the eight years is −0.18% a year, but since SY 2022-2023 it has been −2.3% a year.
- Kindergarten fell from 2.27 million to 1.99 million, 1.6% a year, and the smaller cohorts are now moving up the elementary grades. Senior high school grew 4.3% a year, from 2.73 million to 3.83 million.
- The pandemic moved learners from private to public schools, and only part of that has reversed. The private share was 15.9% in SY 2019-2020, 12.0% in SY 2021-2022 and 14.5% in SY 2025-2026. Private enrollment is still 13% below its SY 2019-2020 level.
- Regions are moving in different directions. Under constant SY 2025-2026 boundaries, BARMM grew 2.6% a year while Region I, Region VI and Region VIII lost about 1.1% a year. Since SY 2022-2023, every region except BARMM has lost learners.
- The balance of girls and boys barely changes: girls are 48% of elementary learners in every year and 50% to 53% of senior high learners.
DepEd enrollment year by year, SY 2017-2018 to SY 2025-2026
The national series has three phases. From SY 2017-2018 to SY 2019-2020, enrollment grew 1.4% a year. The first pandemic school year, SY 2020-2021, took 3.0% off the total, and the next year added 5.1%. Much of that rebound was in senior high school, which added 588,000 learners in a single year as learners who had paused returned. From SY 2022-2023 the decline has been steady: −2.6%, −2.5% and −1.8% in the three latest years.
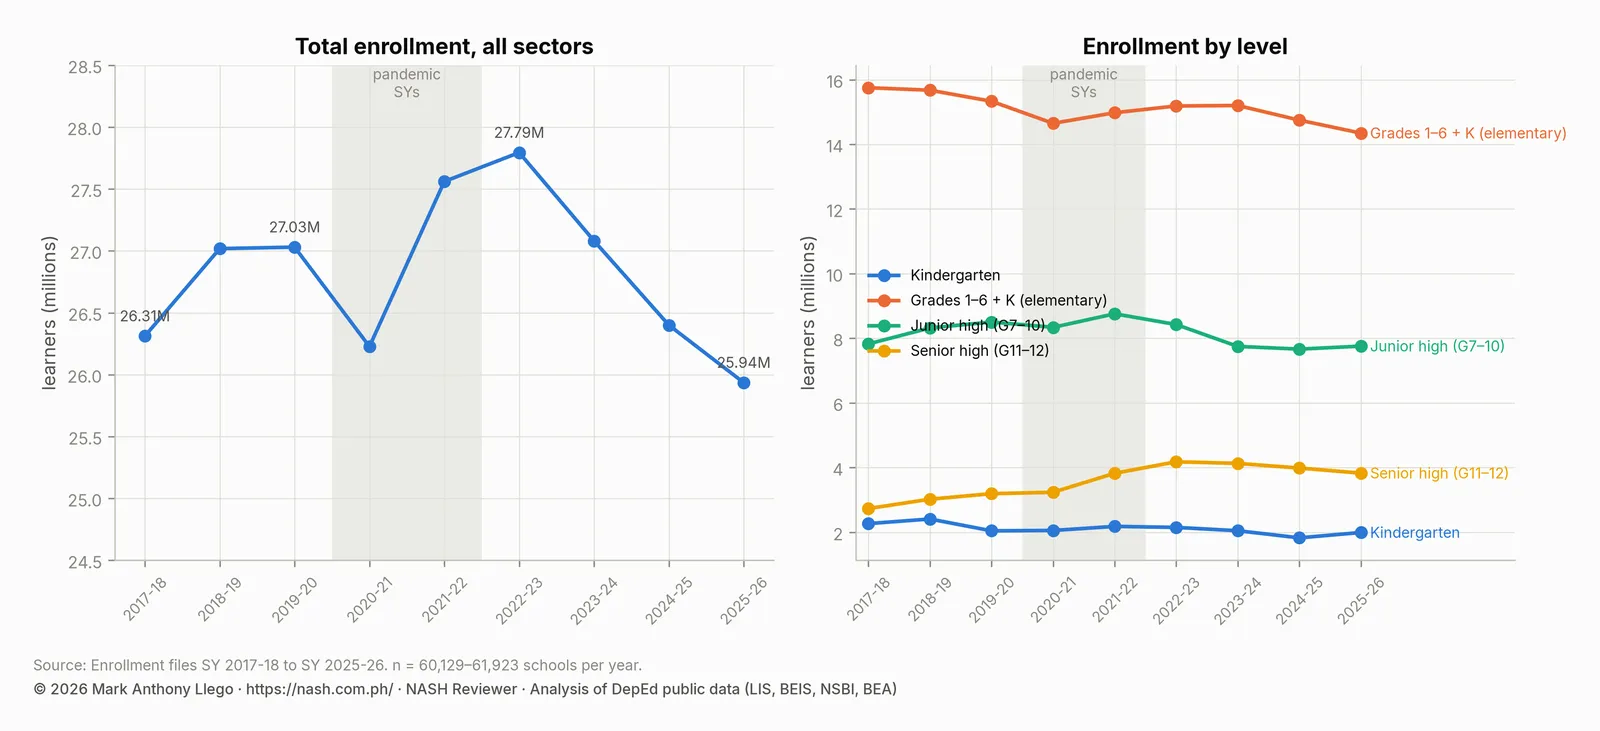
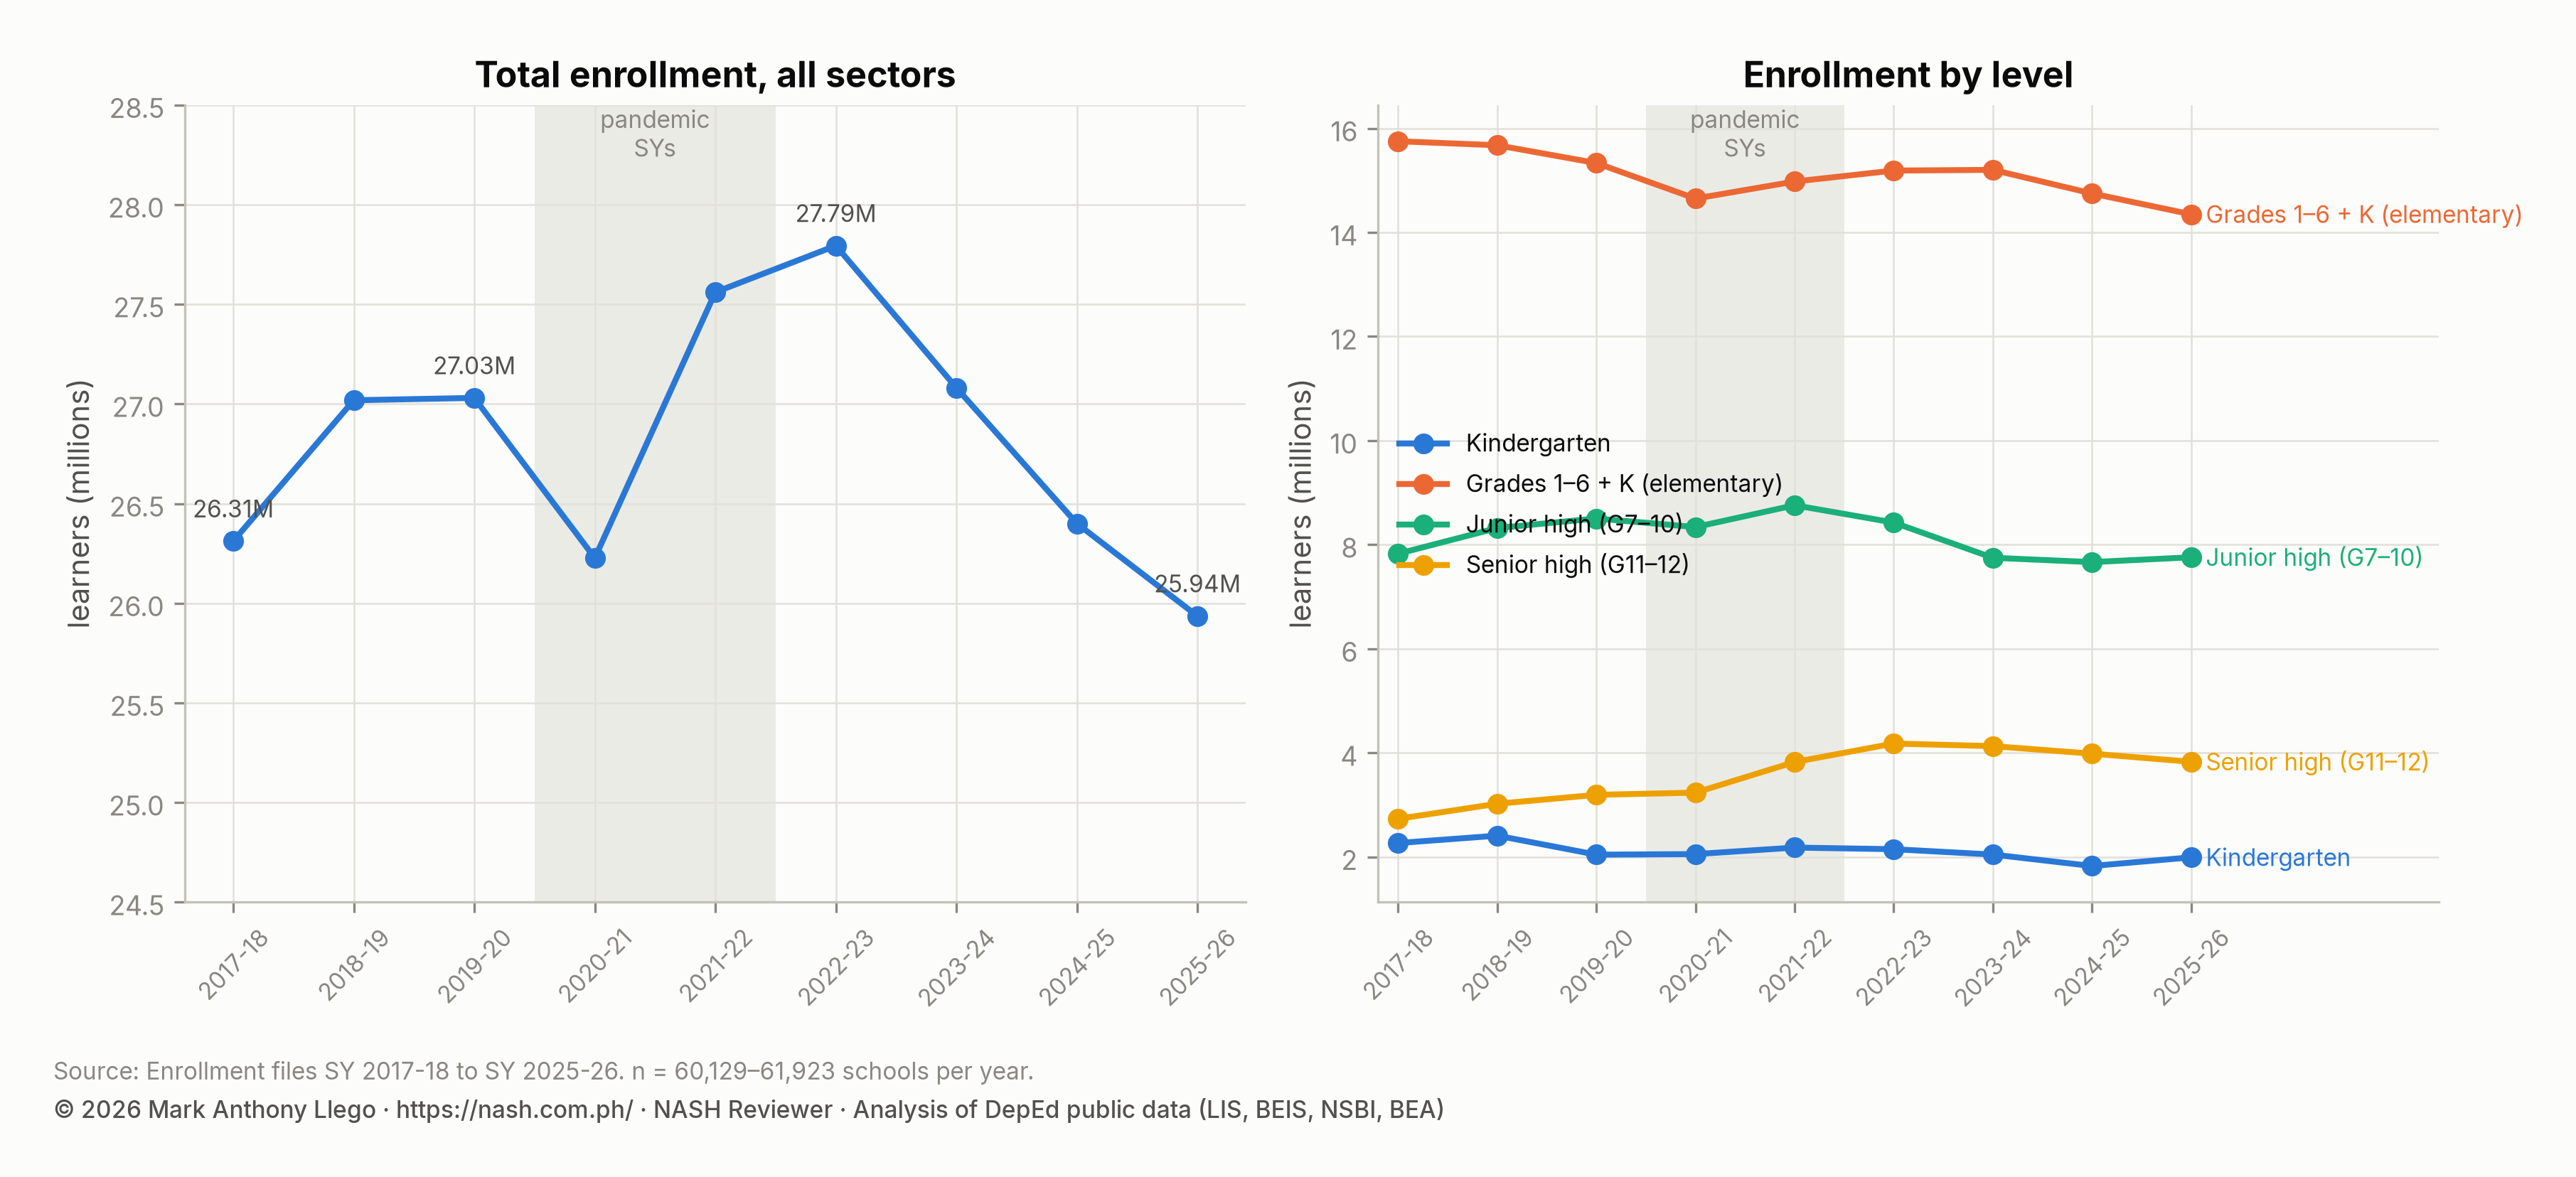
A trend line fitted to all nine years gives −0.11% a year; one that excludes the two pandemic years gives −0.15% a year. In other words, the pandemic is not what makes the long-run trend negative. Fewer children are entering the system. Kindergarten enrollment in SY 2025-2026 (1.99 million) is 12% below SY 2017-2018. It is 17% below its SY 2018-2019 peak of 2.41 million, and the SY 2024-2025 kindergarten class of 1.83 million was the smallest in the series.
| School year | Schools | Total enrollment | Year-on-year | Kindergarten | Elementary (K–6) | Junior high | Senior high | Female share |
|---|---|---|---|---|---|---|---|---|
| SY 2017-18 | 61,563 | 26,311,949 | 2,268,455 | 15,752,075 | 7,826,414 | 2,733,460 | 49.1% | |
| SY 2018-19 | 61,916 | 27,018,509 | +2.7% | 2,409,782 | 15,675,041 | 8,320,627 | 3,022,841 | 49.2% |
| SY 2019-20 | 61,923 | 27,030,391 | +0.0% | 2,044,745 | 15,332,706 | 8,503,650 | 3,194,035 | 49.1% |
| SY 2020-21 | 60,957 | 26,227,022 | -3.0% | 2,055,635 | 14,650,804 | 8,339,391 | 3,236,827 | 49.2% |
| SY 2021-22 | 60,429 | 27,560,661 | +5.1% | 2,181,189 | 14,977,991 | 8,757,957 | 3,824,713 | 49.1% |
| SY 2022-23 | 60,137 | 27,794,282 | +0.8% | 2,149,891 | 15,188,435 | 8,426,203 | 4,179,644 | 48.7% |
| SY 2023-24 | 60,167 | 27,081,292 | -2.6% | 2,047,356 | 15,201,951 | 7,749,265 | 4,130,076 | 48.8% |
| SY 2024-25 | 60,129 | 26,400,182 | -2.5% | 1,827,258 | 14,748,764 | 7,665,606 | 3,985,812 | 49.0% |
| SY 2025-26 | 60,204 | 25,935,863 | -1.8% | 1,993,117 | 14,348,159 | 7,758,408 | 3,829,296 | 49.1% |
Elementary enrollment (kindergarten to Grade 6, including non-graded learners) fell from 15.75 million to 14.35 million, 1.4 million fewer learners than in SY 2017-2018. Junior high school is roughly unchanged at 7.8 million after peaking at 8.76 million in SY 2021-2022. Senior high school is the one level that grew, from 2.73 million to 3.83 million, as the first complete cohorts moved through Grades 11 and 12. It too has fallen since SY 2022-2023.
Enrollment by sector: public, private and SUC/LUC schools
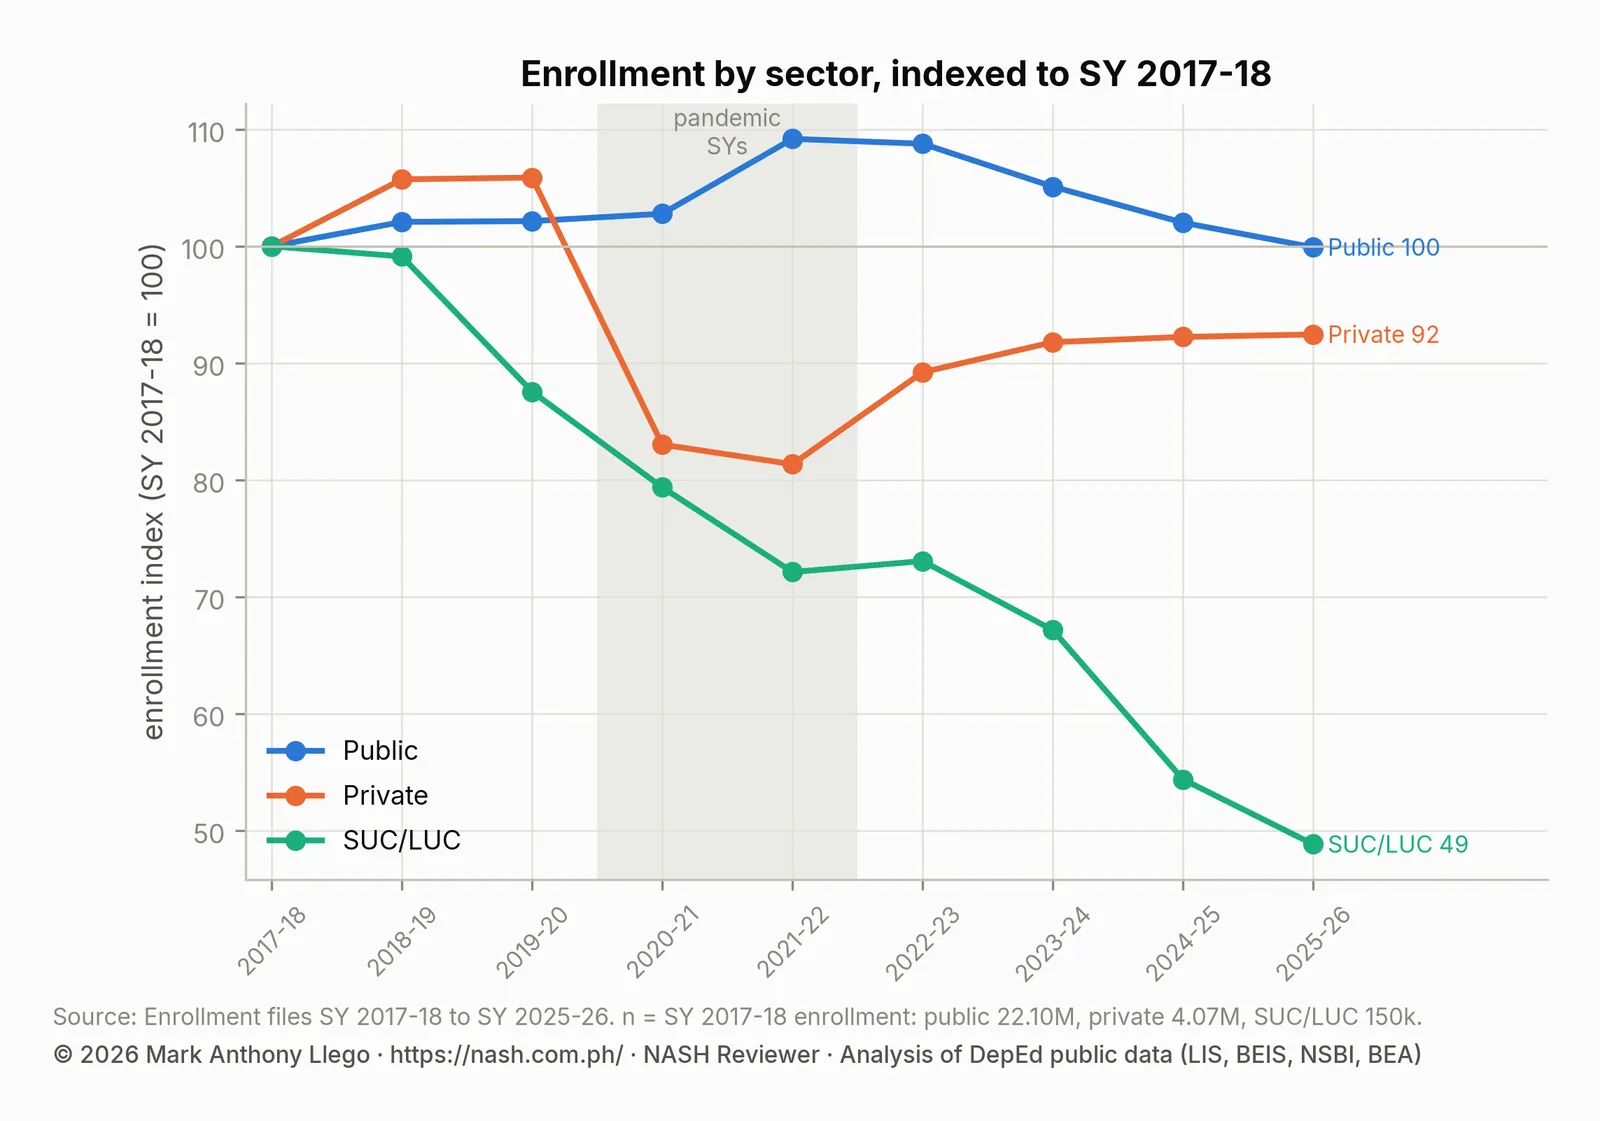
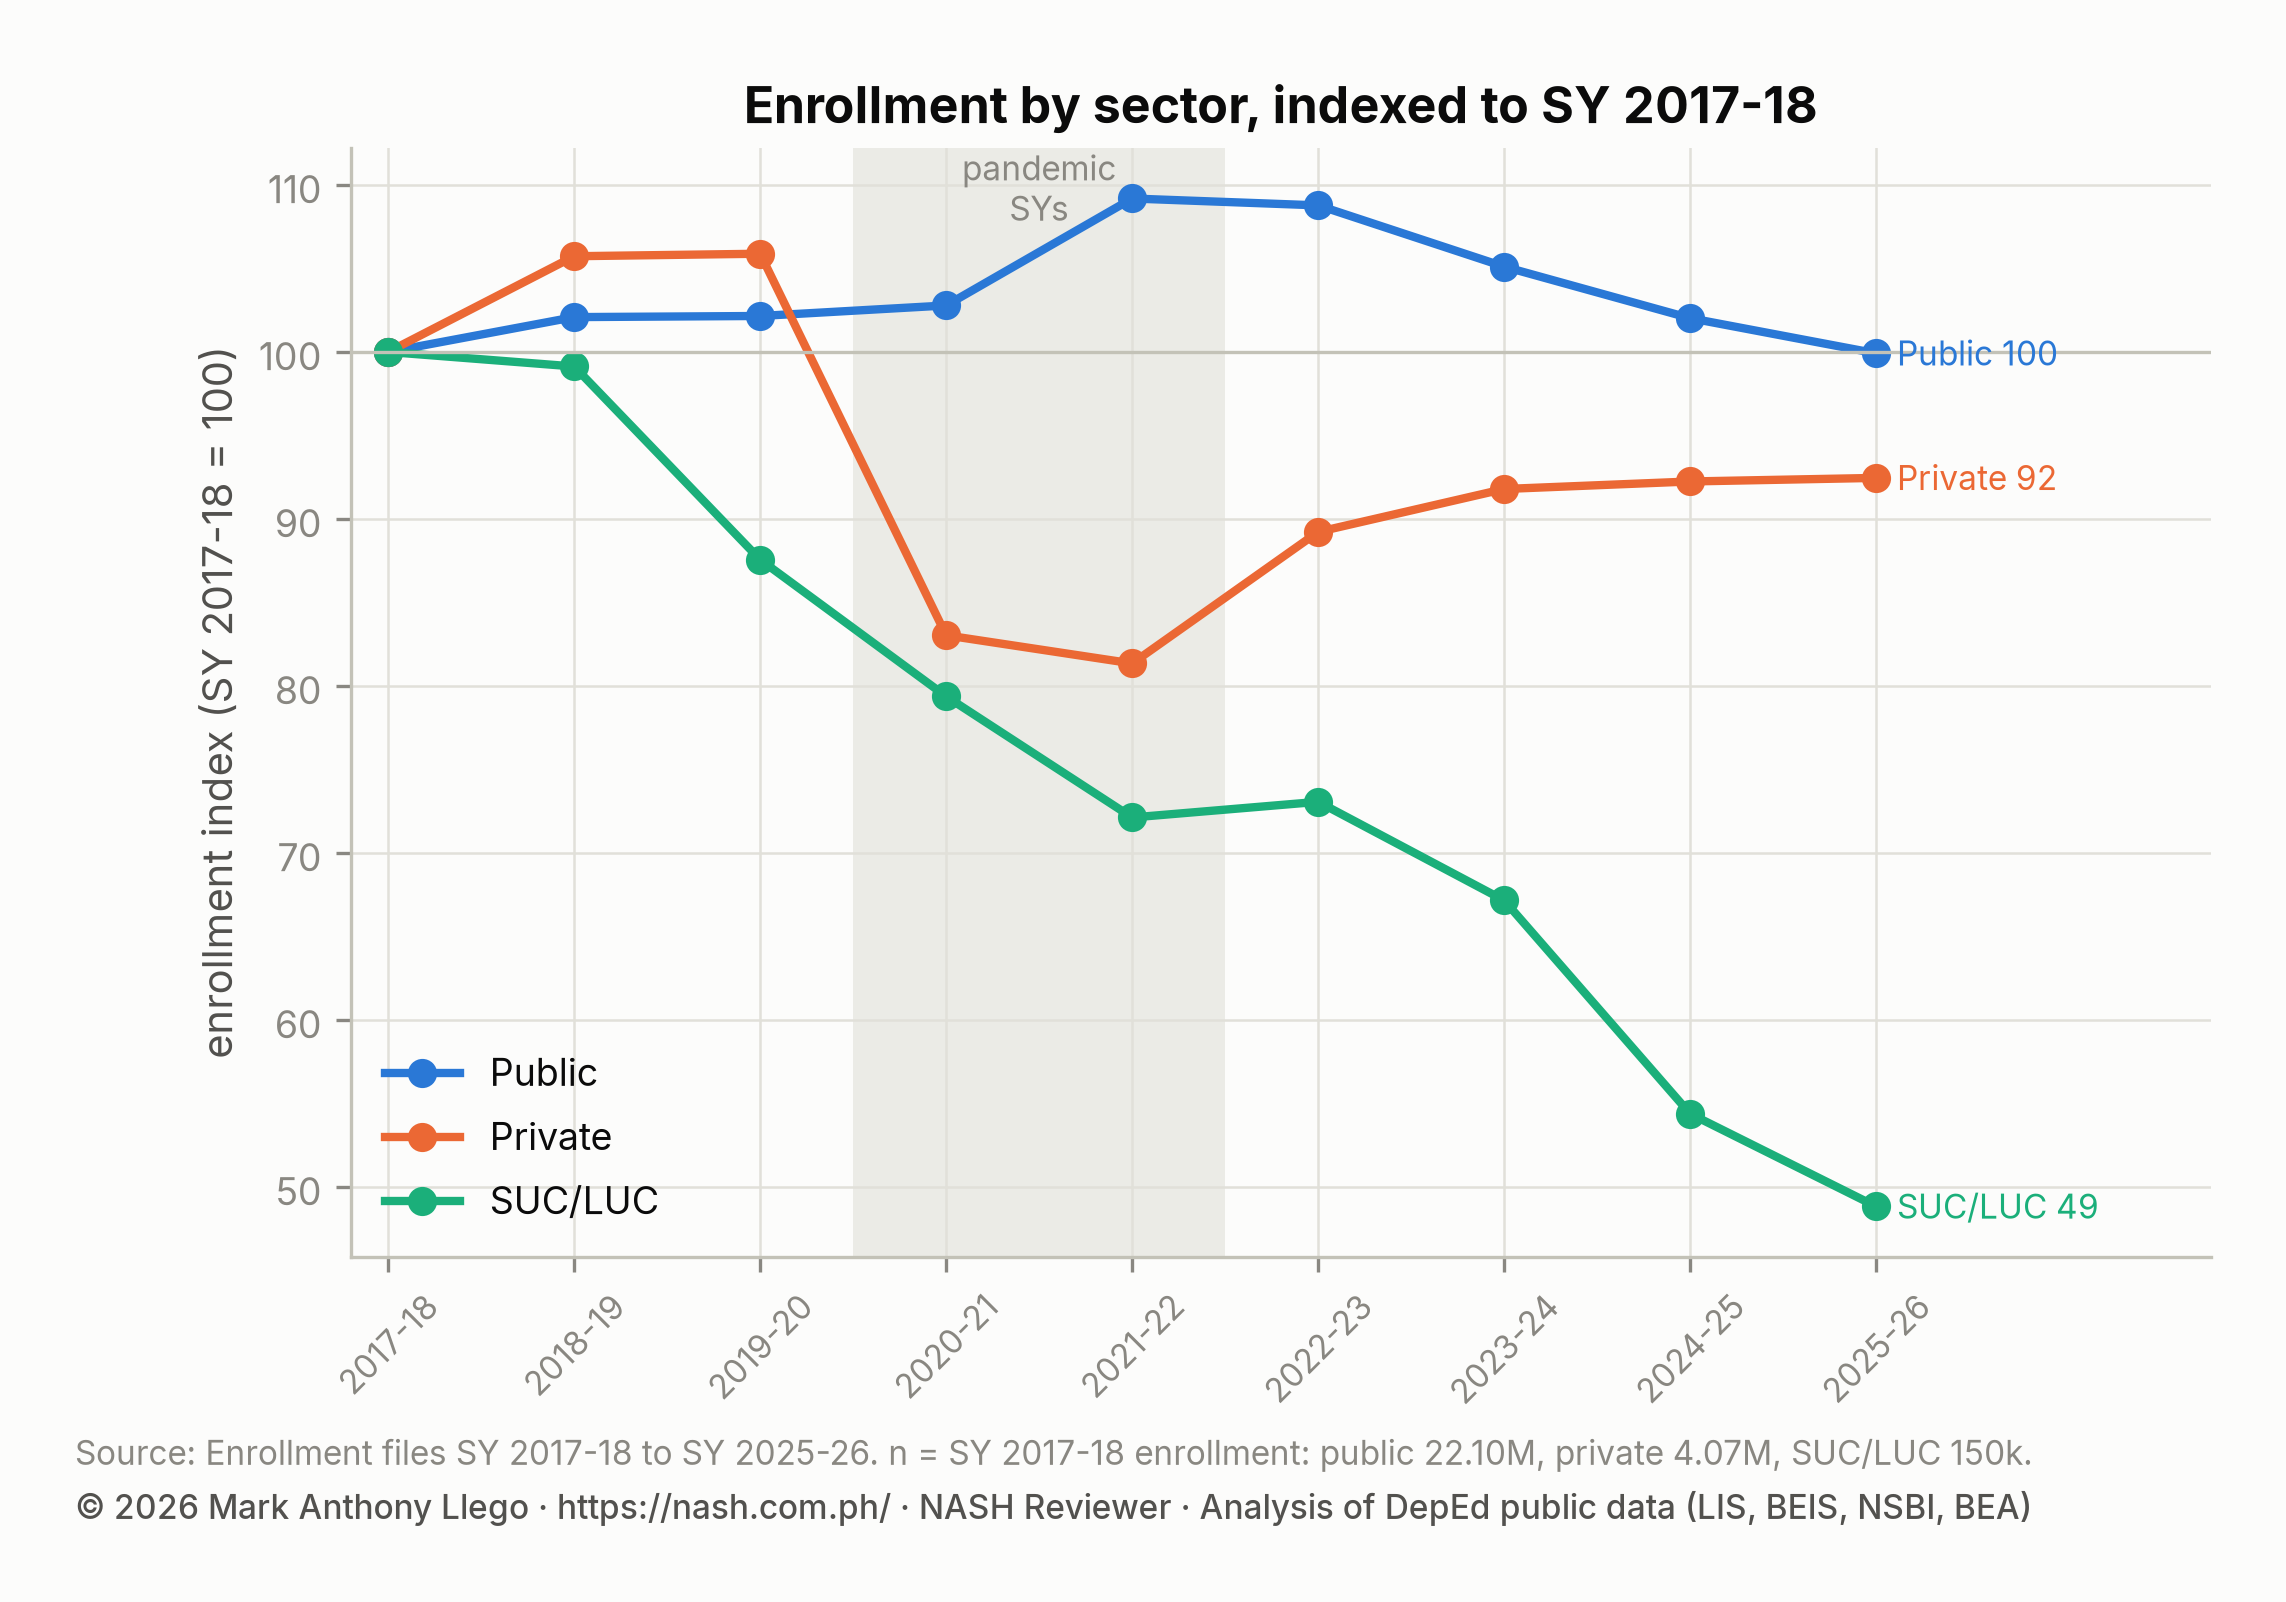
Indexed to SY 2017-2018 = 100, the three sectors moved in three different ways. Public enrollment ends the period where it began, 22.10 million to 22.08 million, after peaking at 24.13 million in SY 2021-2022. Private enrollment rose to 106 in SY 2019-2020, dropped to 81 in SY 2021-2022 and recovered only to 92. Schools managed by state and local universities and colleges (SUC/LUC) lost half their enrollment, from 149,614 to 73,060.
| School year | Public | Private | SUC/LUC | PSO | Private share |
|---|---|---|---|---|---|
| SY 2017-18 | 22,096,820 | 4,065,515 | 149,614 | 15.5% | |
| SY 2018-19 | 22,558,138 | 4,298,566 | 148,313 | 13,492 | 15.9% |
| SY 2019-20 | 22,572,923 | 4,304,676 | 131,006 | 21,786 | 15.9% |
| SY 2020-21 | 22,712,409 | 3,375,748 | 118,755 | 20,110 | 12.9% |
| SY 2021-22 | 24,127,495 | 3,307,342 | 107,912 | 17,912 | 12.0% |
| SY 2022-23 | 24,036,251 | 3,627,506 | 109,314 | 21,211 | 13.1% |
| SY 2023-24 | 23,225,427 | 3,731,936 | 100,481 | 23,448 | 13.8% |
| SY 2024-25 | 22,543,711 | 3,750,251 | 81,365 | 24,855 | 14.2% |
| SY 2025-26 | 22,078,460 | 3,758,971 | 73,060 | 25,372 | 14.5% |
The private share of enrollment shows the pandemic’s effect most clearly: 15.5% in SY 2017-2018, 15.9% in SY 2019-2020, 12.0% in SY 2021-2022 and 14.5% in SY 2025-2026. Private enrollment in SY 2025-2026, 3.76 million, is still 13% below its SY 2019-2020 level of 4.30 million. For public school heads, this was a sudden demand for capacity. Public schools held 24.13 million learners in SY 2021-2022, 1.55 million more than in SY 2019-2020, before the demographic decline brought the public total back down.
Schools that opened and closed
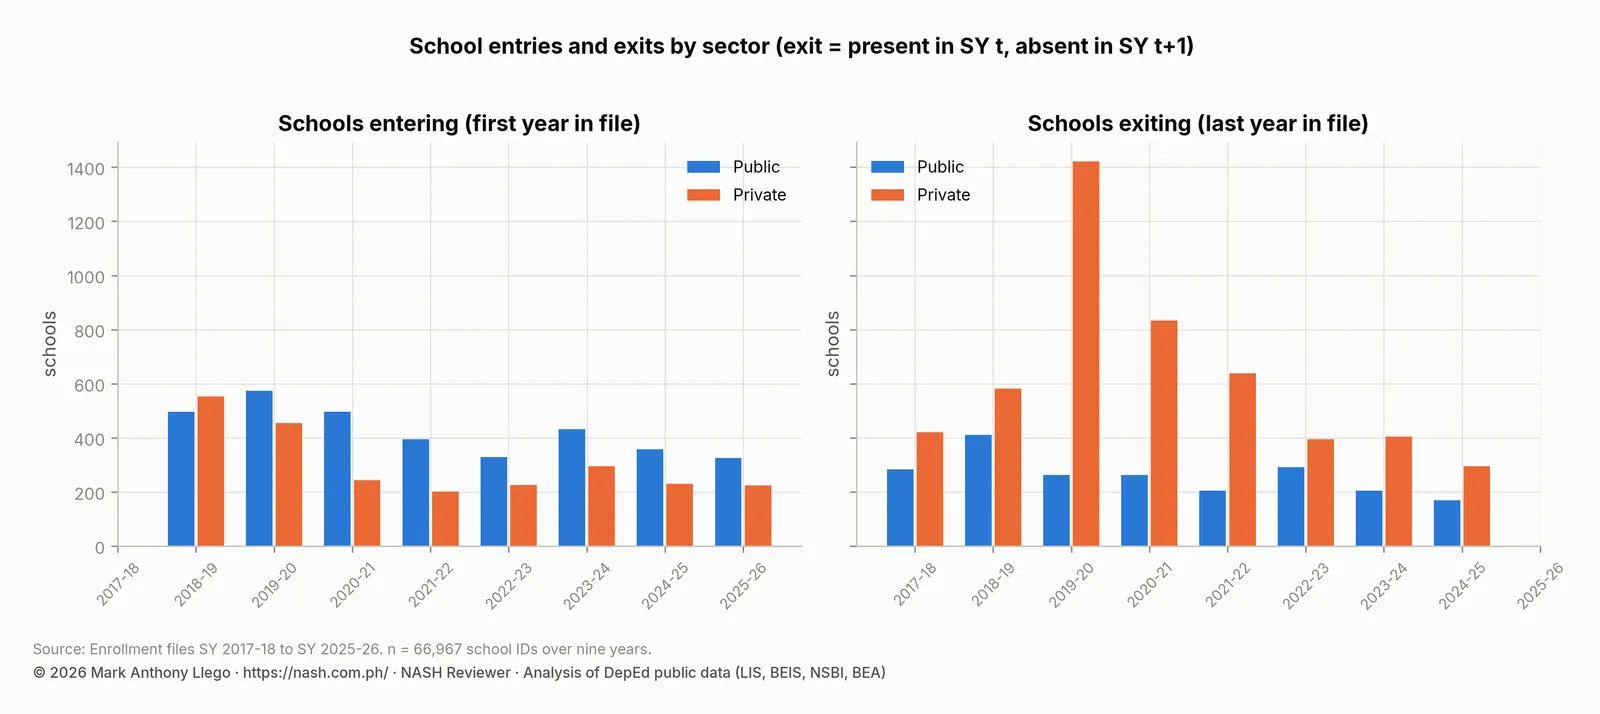
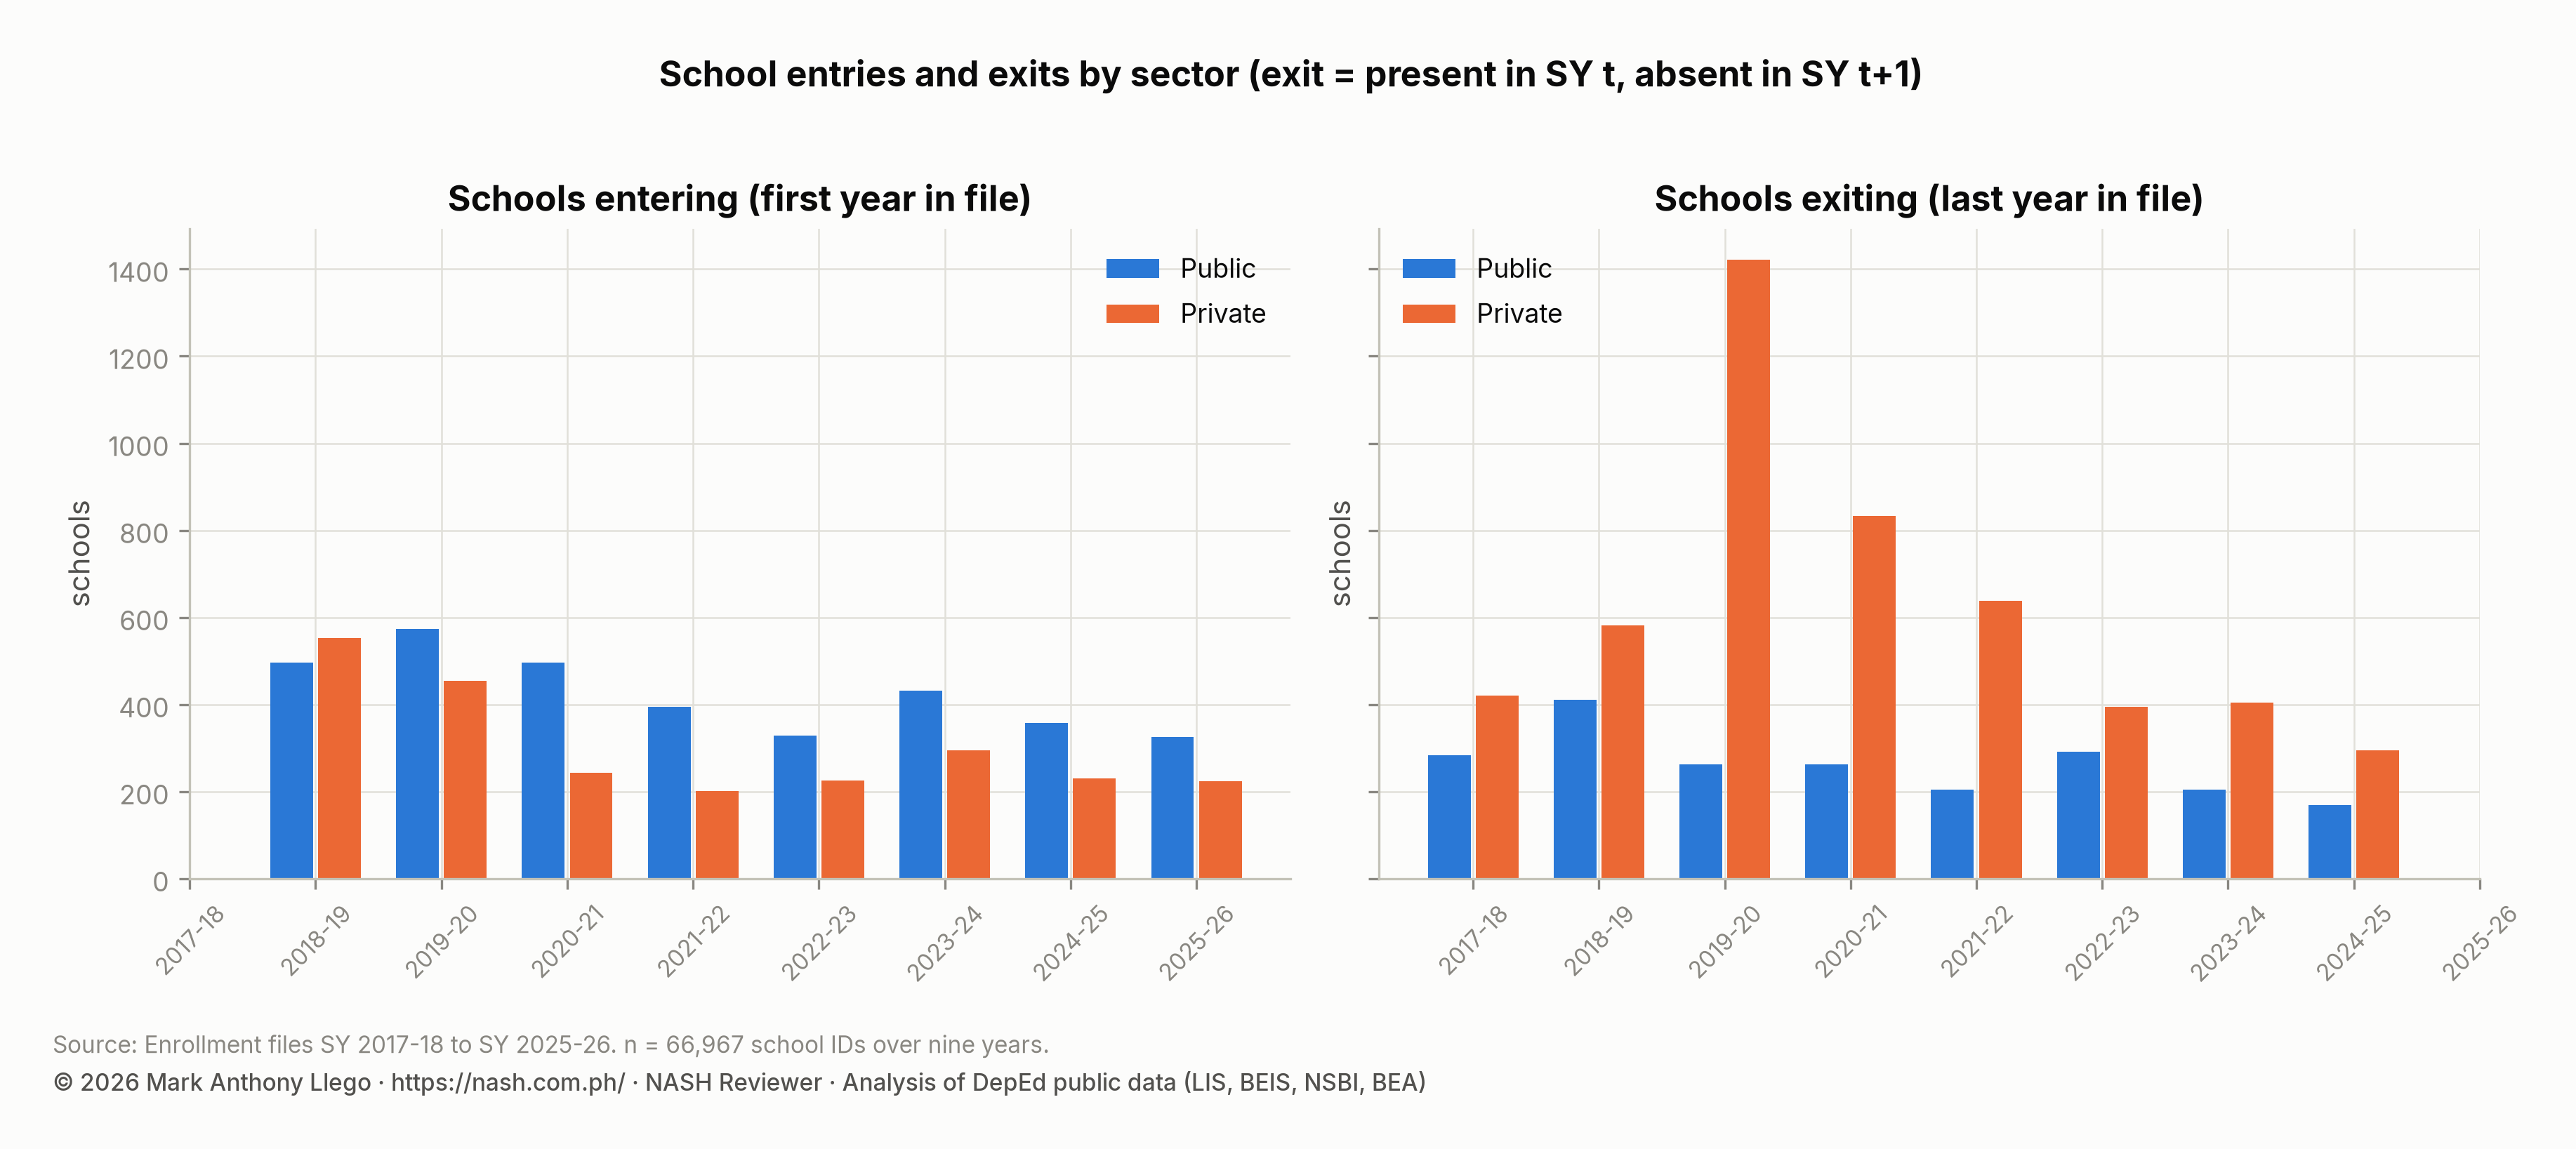
An enrollment file lists the schools that exist in that year, so comparing consecutive files shows which schools entered and which left. Most exits are private schools. After SY 2019-2020, 1,422 private schools disappeared from the file; they had 67,236 learners in their last year. Of the 1,711 schools of all sectors that left that year, 194 later reappeared, so some exits were pauses rather than closures. Public exits run 169 to 411 a year and carry 57,000 to 119,000 learners in total each year. That points to mergers and school-ID changes rather than closures of large schools.
| School year | Public entering | Private entering | Public exiting after this year | Private exiting after this year |
|---|---|---|---|---|
| SY 2017-18 | 283 | 420 | ||
| SY 2018-19 | 496 | 552 | 411 | 581 |
| SY 2019-20 | 574 | 454 | 263 | 1,422 |
| SY 2020-21 | 496 | 243 | 263 | 833 |
| SY 2021-22 | 395 | 201 | 204 | 638 |
| SY 2022-23 | 329 | 226 | 291 | 394 |
| SY 2023-24 | 431 | 295 | 204 | 404 |
| SY 2024-25 | 358 | 230 | 169 | 295 |
| SY 2025-26 | 326 | 224 |
This turnover of schools does not distort the trend. Year-on-year growth computed over the same schools present in both adjacent years stays within 0.4 percentage points of the all-schools growth in every year.
| Transition | Growth, all schools | Growth, same schools in both years | Schools in both years | Learners in exiting schools | Learners in entering schools |
|---|---|---|---|---|---|
| SY 2017-18 → SY 2018-19 | +2.69% | +2.35% | 60,839 | 93,009 | 183,013 |
| SY 2018-19 → SY 2019-20 | +0.04% | -0.19% | 60,882 | 147,152 | 210,151 |
| SY 2019-20 → SY 2020-21 | -2.97% | -2.97% | 60,212 | 144,794 | 140,811 |
| SY 2020-21 → SY 2021-22 | +5.08% | +5.00% | 59,828 | 115,314 | 143,154 |
| SY 2021-22 → SY 2022-23 | +0.85% | +0.75% | 59,577 | 96,846 | 124,121 |
| SY 2022-23 → SY 2023-24 | -2.57% | -2.76% | 59,438 | 103,515 | 154,113 |
| SY 2023-24 → SY 2024-25 | -2.52% | -2.60% | 59,537 | 90,112 | 109,892 |
| SY 2024-25 → SY 2025-26 | -1.76% | -1.93% | 59,653 | 77,157 | 120,188 |
Over the nine years, 66,967 distinct school IDs appear, and 55,029 schools are present in every file. That always-present group shrank faster, −0.46% a year, than the system as a whole. New schools therefore account for part of the stability in the national total.
Enrollment by region: BARMM grows while most regions shrink
Region names and boundaries changed during the period, so the regional series here use the SY 2025-2026 boundaries throughout. ARMM became BARMM in SY 2019-2020, and Cotabato City moved to BARMM in SY 2021-2022. The Negros Island Region (NIR) took 21 divisions from Regions VI and VII in SY 2024-2025, and Sulu moved from BARMM to Region IX in SY 2025-2026. Each school is counted in its division’s SY 2025-2026 region in every year, so the lines compare the same places.
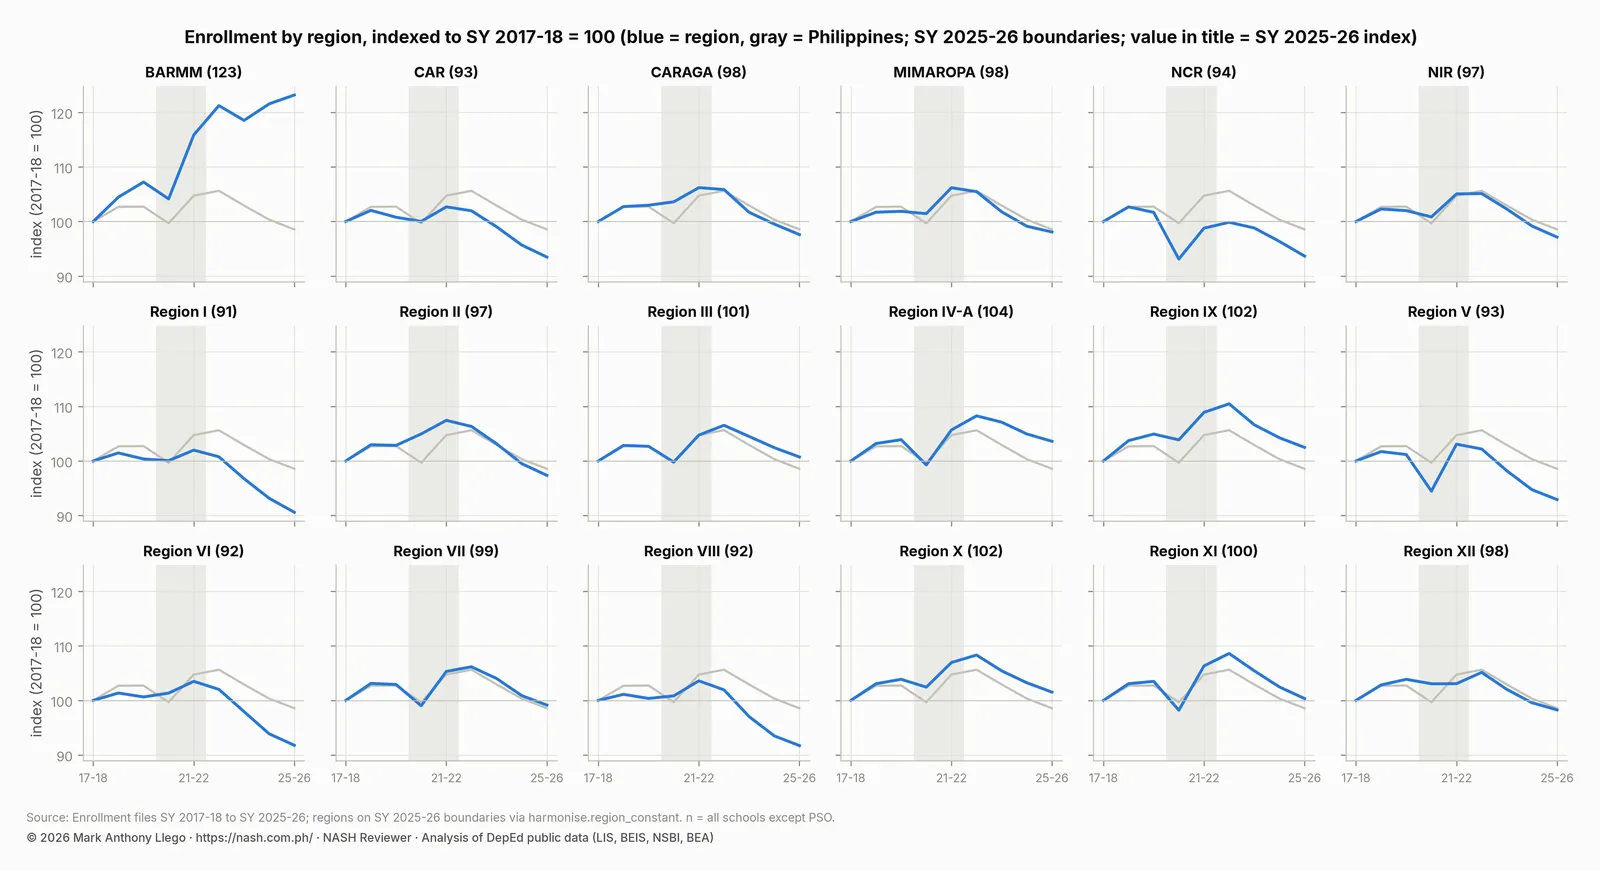
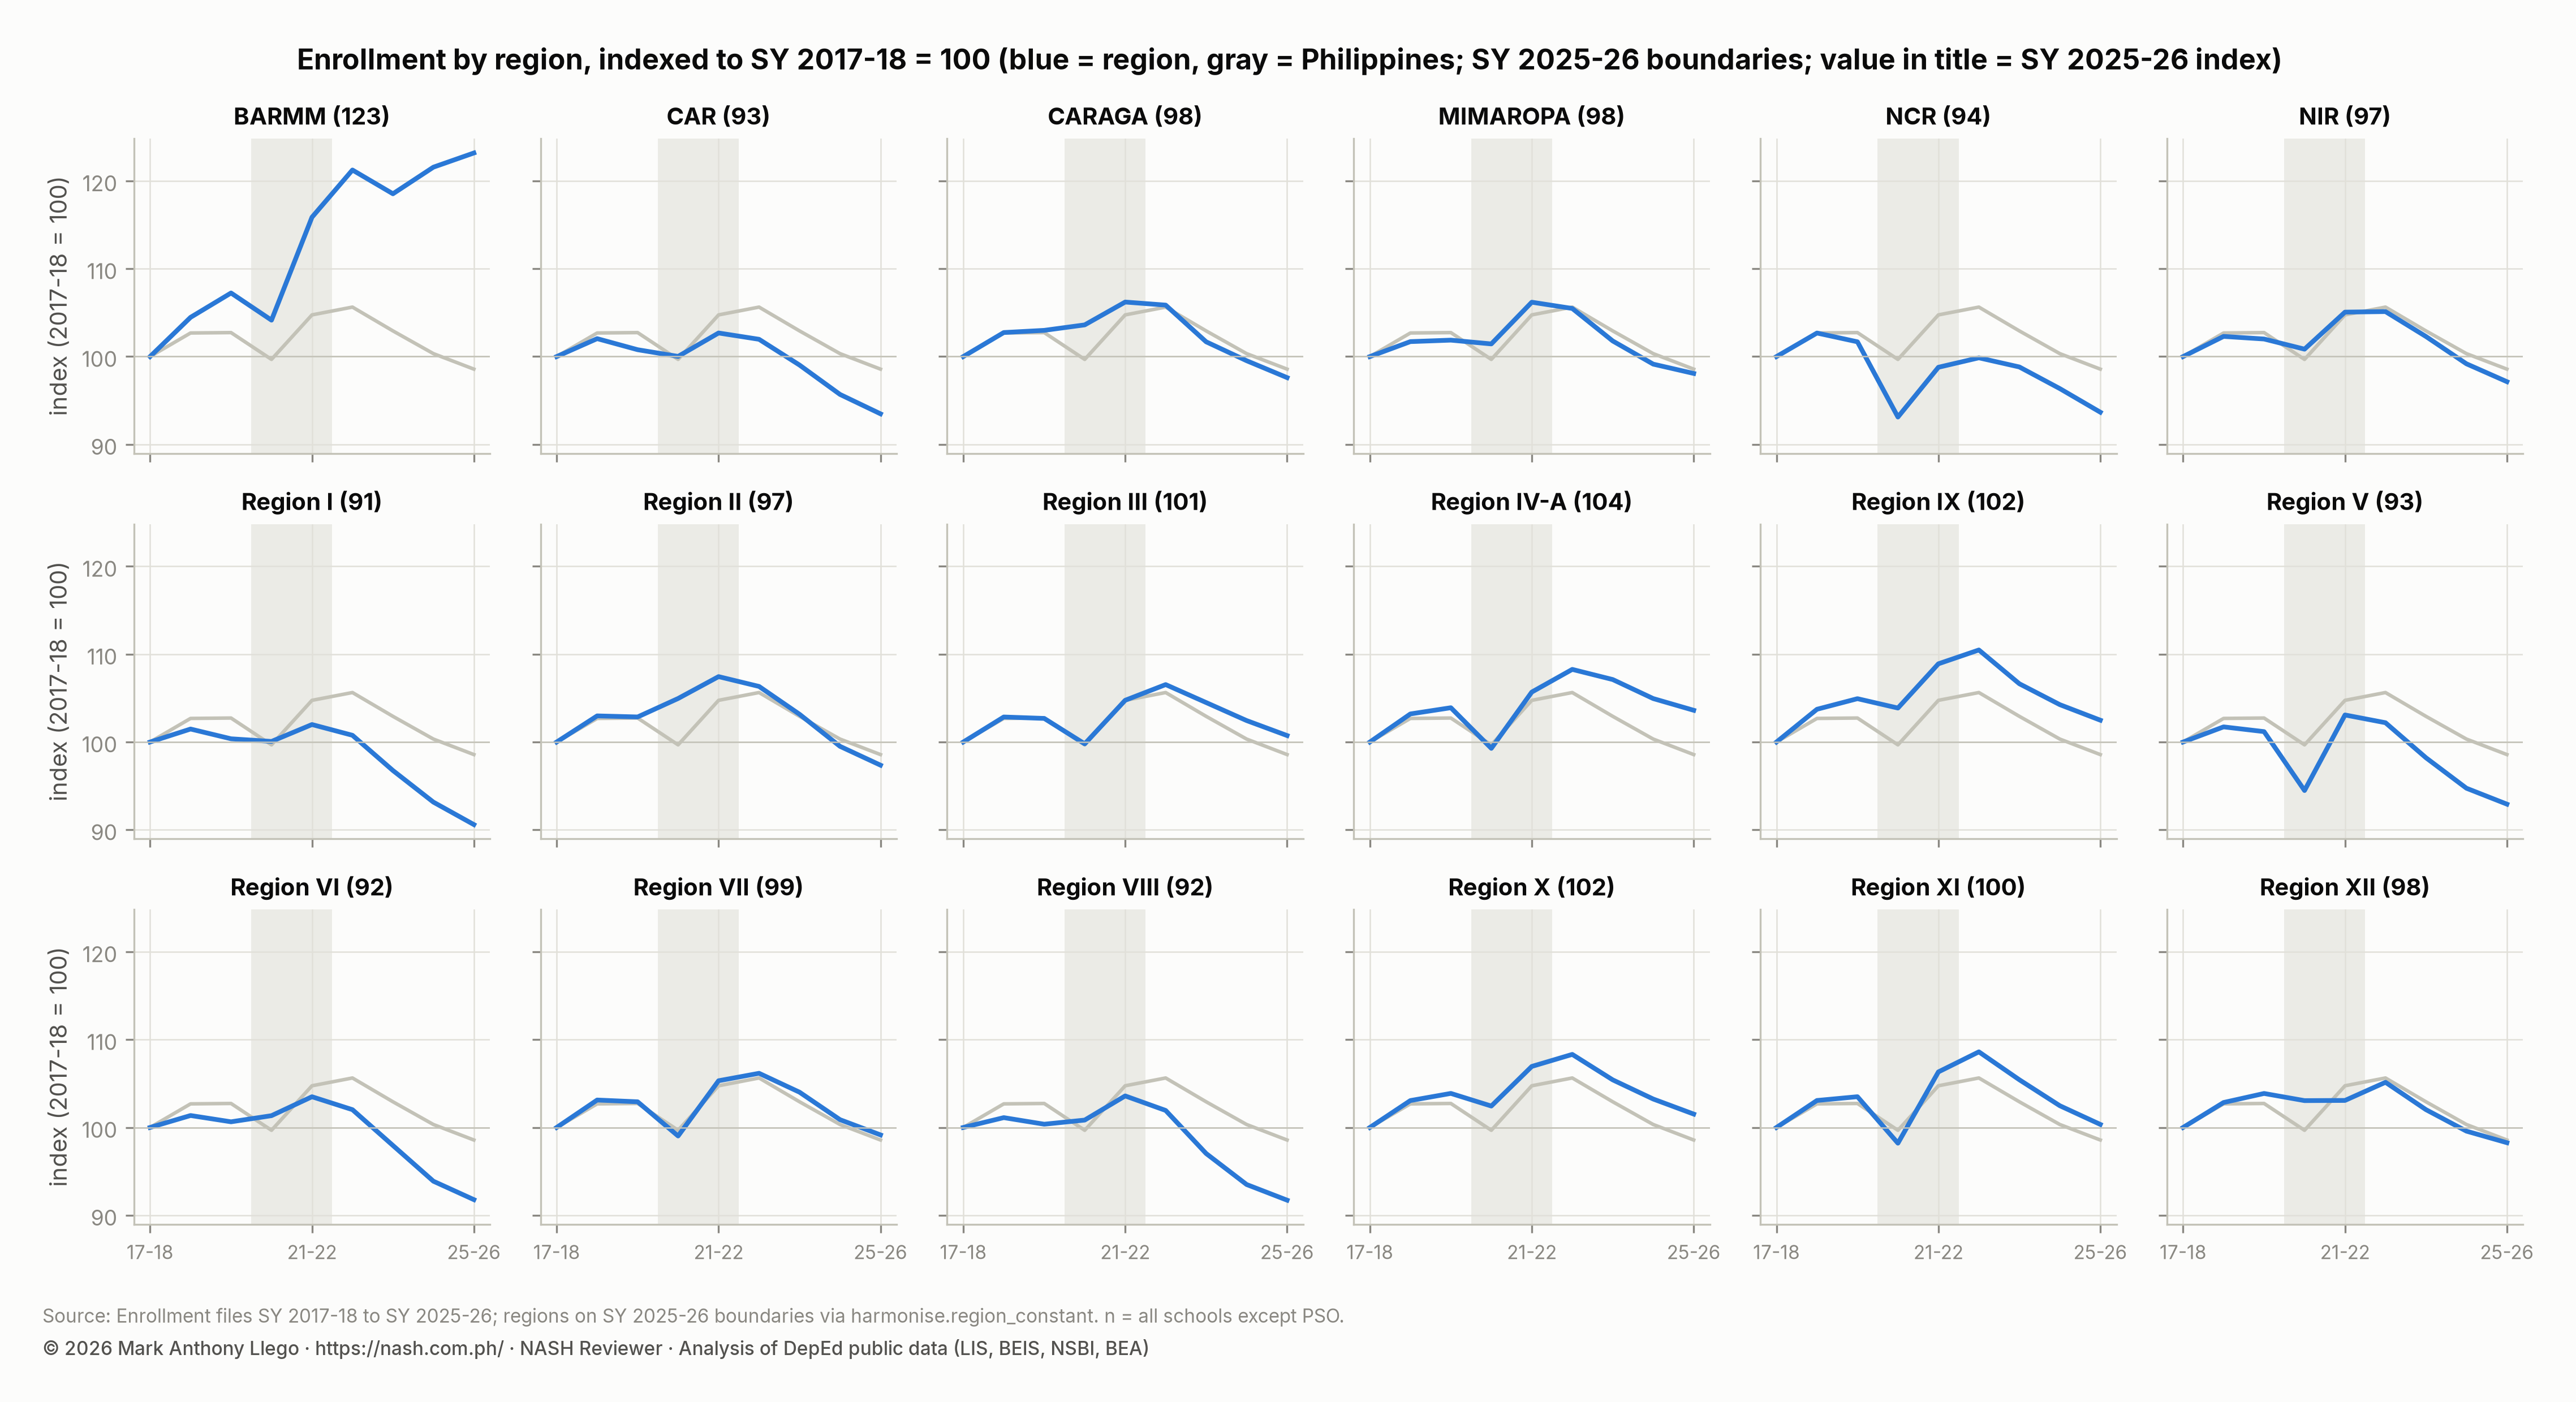
BARMM is the only region with sustained growth, from 758,518 to 934,373 learners, 2.6% a year. Region IV-A (+0.4% a year), Region IX (+0.3%) and Region X (+0.2%) grew slightly. Region I (−1.2% a year), Region VIII (−1.1%), Region VI (−1.1%), Region V (−0.9%), CAR (−0.8%) and NCR (−0.8%) shrank. Since SY 2022-2023, every region except BARMM has lost enrollment, between 1.5% a year in Region IV-A and 3.5% a year in Region I. Excluding the pandemic years changes no regional rate by more than 0.2 points. The differences between regions come from population change and migration, not from the pandemic.
| Region (SY 2025-26 boundaries) | SY 2017-18 | SY 2019-20 | SY 2025-26 | Per year, 2017-18 to 2025-26 | Per year, 2022-23 to 2025-26 | Trend excluding pandemic years |
|---|---|---|---|---|---|---|
| Region I | 1,286,348 | 1,291,071 | 1,165,403 | -1.23% | -3.48% | -1.17% |
| Region VIII | 1,256,668 | 1,261,310 | 1,152,614 | -1.07% | -3.46% | -1.03% |
| Region VI | 1,176,643 | 1,184,212 | 1,079,924 | -1.07% | -3.47% | -1.00% |
| Region V | 1,764,865 | 1,785,756 | 1,640,002 | -0.91% | -3.12% | -0.90% |
| CAR | 436,484 | 439,895 | 408,037 | -0.84% | -2.85% | -0.79% |
| NCR | 2,868,073 | 2,916,295 | 2,686,394 | -0.81% | -2.11% | -0.85% |
| NIR | 1,226,368 | 1,250,904 | 1,191,317 | -0.36% | -2.60% | -0.28% |
| Region II | 871,626 | 896,502 | 848,648 | -0.33% | -2.89% | -0.27% |
| CARAGA | 754,330 | 776,855 | 736,260 | -0.30% | -2.67% | -0.30% |
| MIMAROPA | 871,849 | 888,159 | 855,106 | -0.24% | -2.40% | -0.19% |
| Region XII | 1,155,084 | 1,199,786 | 1,135,036 | -0.22% | -2.23% | -0.29% |
| Region VII | 1,646,395 | 1,694,486 | 1,632,444 | -0.11% | -2.25% | -0.07% |
| Region XI | 1,312,861 | 1,358,826 | 1,317,420 | +0.04% | -2.60% | +0.14% |
| Region III | 2,839,168 | 2,915,454 | 2,860,078 | +0.09% | -1.85% | +0.15% |
| Region X | 1,262,319 | 1,311,257 | 1,281,565 | +0.19% | -2.14% | +0.24% |
| Region IX | 1,135,114 | 1,191,123 | 1,163,334 | +0.31% | -2.47% | +0.34% |
| Region IV-A | 3,689,236 | 3,833,280 | 3,822,536 | +0.44% | -1.45% | +0.49% |
| BARMM | 758,518 | 813,434 | 934,373 | +2.64% | +0.53% | +2.68% |
The private share fell in every region between SY 2019-2020 and SY 2021-2022 and has recovered only partly. NCR remains the region with the largest private share, 26.5% of learners in SY 2025-2026, and Region VIII has the smallest, 6.3%.
| Region | SY 2017-18 | SY 2019-20 | SY 2021-22 | SY 2023-24 | SY 2025-26 |
|---|---|---|---|---|---|
| BARMM | 9.4% | 12.4% | 10.8% | 11.9% | 15.1% |
| CAR | 20.0% | 20.2% | 15.3% | 16.3% | 16.9% |
| CARAGA | 9.0% | 9.2% | 7.8% | 8.6% | 8.7% |
| MIMAROPA | 8.3% | 8.4% | 7.0% | 7.4% | 7.8% |
| NCR | 28.1% | 28.9% | 22.2% | 25.5% | 26.5% |
| NIR | 10.6% | 11.0% | 8.5% | 9.5% | 9.7% |
| Region I | 13.1% | 13.1% | 9.9% | 11.1% | 11.4% |
| Region II | 12.1% | 12.2% | 9.6% | 10.0% | 10.5% |
| Region III | 18.7% | 19.1% | 14.0% | 16.2% | 17.0% |
| Region IV-A | 22.7% | 22.8% | 16.5% | 19.1% | 20.5% |
| Region IX | 7.8% | 8.3% | 6.9% | 7.6% | 7.8% |
| Region V | 8.6% | 9.2% | 7.6% | 8.6% | 9.0% |
| Region VI | 10.7% | 11.1% | 8.0% | 9.4% | 9.9% |
| Region VII | 16.1% | 17.0% | 12.6% | 14.9% | 15.4% |
| Region VIII | 6.7% | 6.8% | 5.3% | 5.9% | 6.3% |
| Region X | 13.0% | 13.3% | 11.1% | 12.4% | 12.3% |
| Region XI | 13.9% | 14.5% | 10.2% | 11.9% | 11.9% |
| Region XII | 10.9% | 11.6% | 8.4% | 9.6% | 10.1% |
Female share of enrollment by level
The female share of enrollment is very stable: 47.9% to 48.2% in elementary and 49.0% to 50.3% in junior high throughout the period. In senior high school it fell from 52.9% in SY 2017-2018 to 50.0% in SY 2023-2024 and was 51.0% in SY 2025-2026. The early senior high cohorts, in which girls were a clear majority, have given way to a more balanced intake.
| School year | Elementary | Junior high | Senior high | All levels |
|---|---|---|---|---|
| SY 2017-18 | 47.9% | 50.3% | 52.9% | 49.1% |
| SY 2018-19 | 48.1% | 49.9% | 52.5% | 49.2% |
| SY 2019-20 | 48.1% | 49.8% | 52.1% | 49.1% |
| SY 2020-21 | 48.2% | 49.8% | 52.6% | 49.2% |
| SY 2021-22 | 48.1% | 49.2% | 52.5% | 49.1% |
| SY 2022-23 | 48.0% | 49.0% | 50.9% | 48.7% |
| SY 2023-24 | 48.1% | 49.6% | 50.0% | 48.8% |
| SY 2024-25 | 48.2% | 49.7% | 50.4% | 49.0% |
| SY 2025-26 | 48.2% | 49.9% | 51.0% | 49.1% |
Grade-to-grade flows
Dividing this year’s enrollment in a grade by last year’s enrollment in the grade below gives a rough flow ratio. These ratios are approximations from yearly totals, not DepEd’s transition rates, which subtract repeaters. They do show where the pandemic interrupted the flow and how far it has recovered.
| School year | Grade 1 ÷ last year’s Kindergarten | Grade 4 ÷ last year’s Grade 3 | Grade 7 ÷ last year’s Grade 6 | Grade 11 ÷ last year’s Grade 10 |
|---|---|---|---|---|
| SY 2018-19 | 1.034 | 0.992 | 0.985 | 0.964 |
| SY 2019-20 | 1.016 | 0.991 | 0.996 | 0.969 |
| SY 2020-21 | 0.992 | 0.96 | 0.928 | 0.934 |
| SY 2021-22 | 1.065 | 1.011 | 1.011 | 1.084 |
| SY 2022-23 | 1.025 | 1.005 | 0.995 | 1.015 |
| SY 2023-24 | 1.005 | 0.979 | 0.971 | 0.983 |
| SY 2024-25 | 1.011 | 0.99 | 0.981 | 1.018 |
| SY 2025-26 | 1.017 | 0.988 | 0.981 | 1.006 |
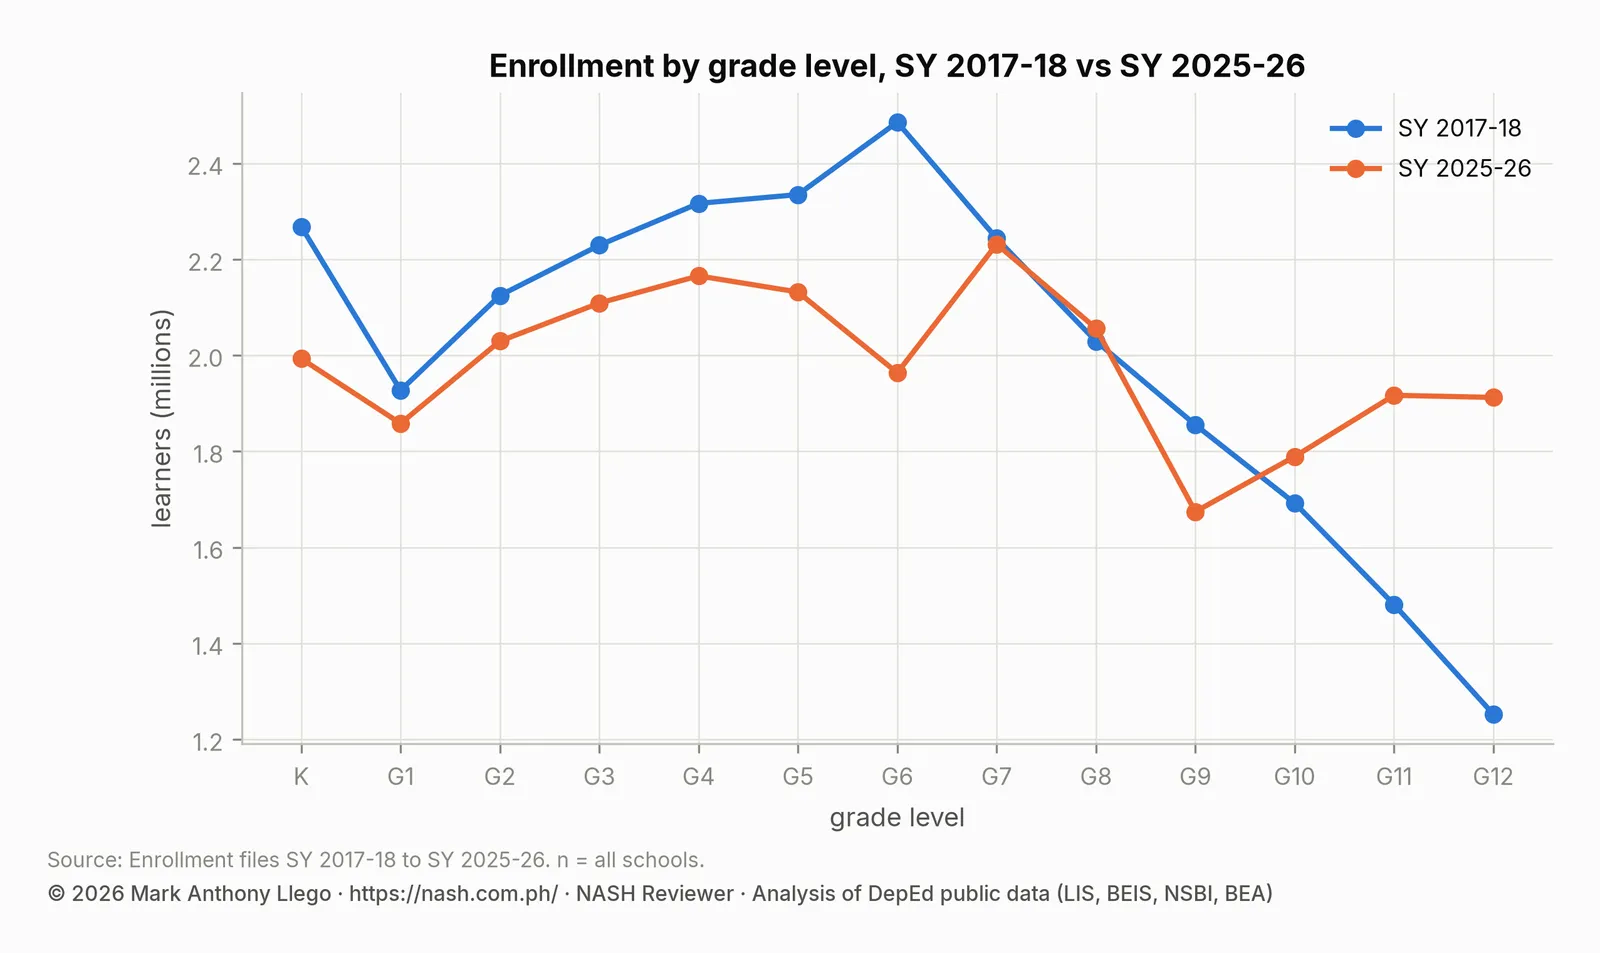
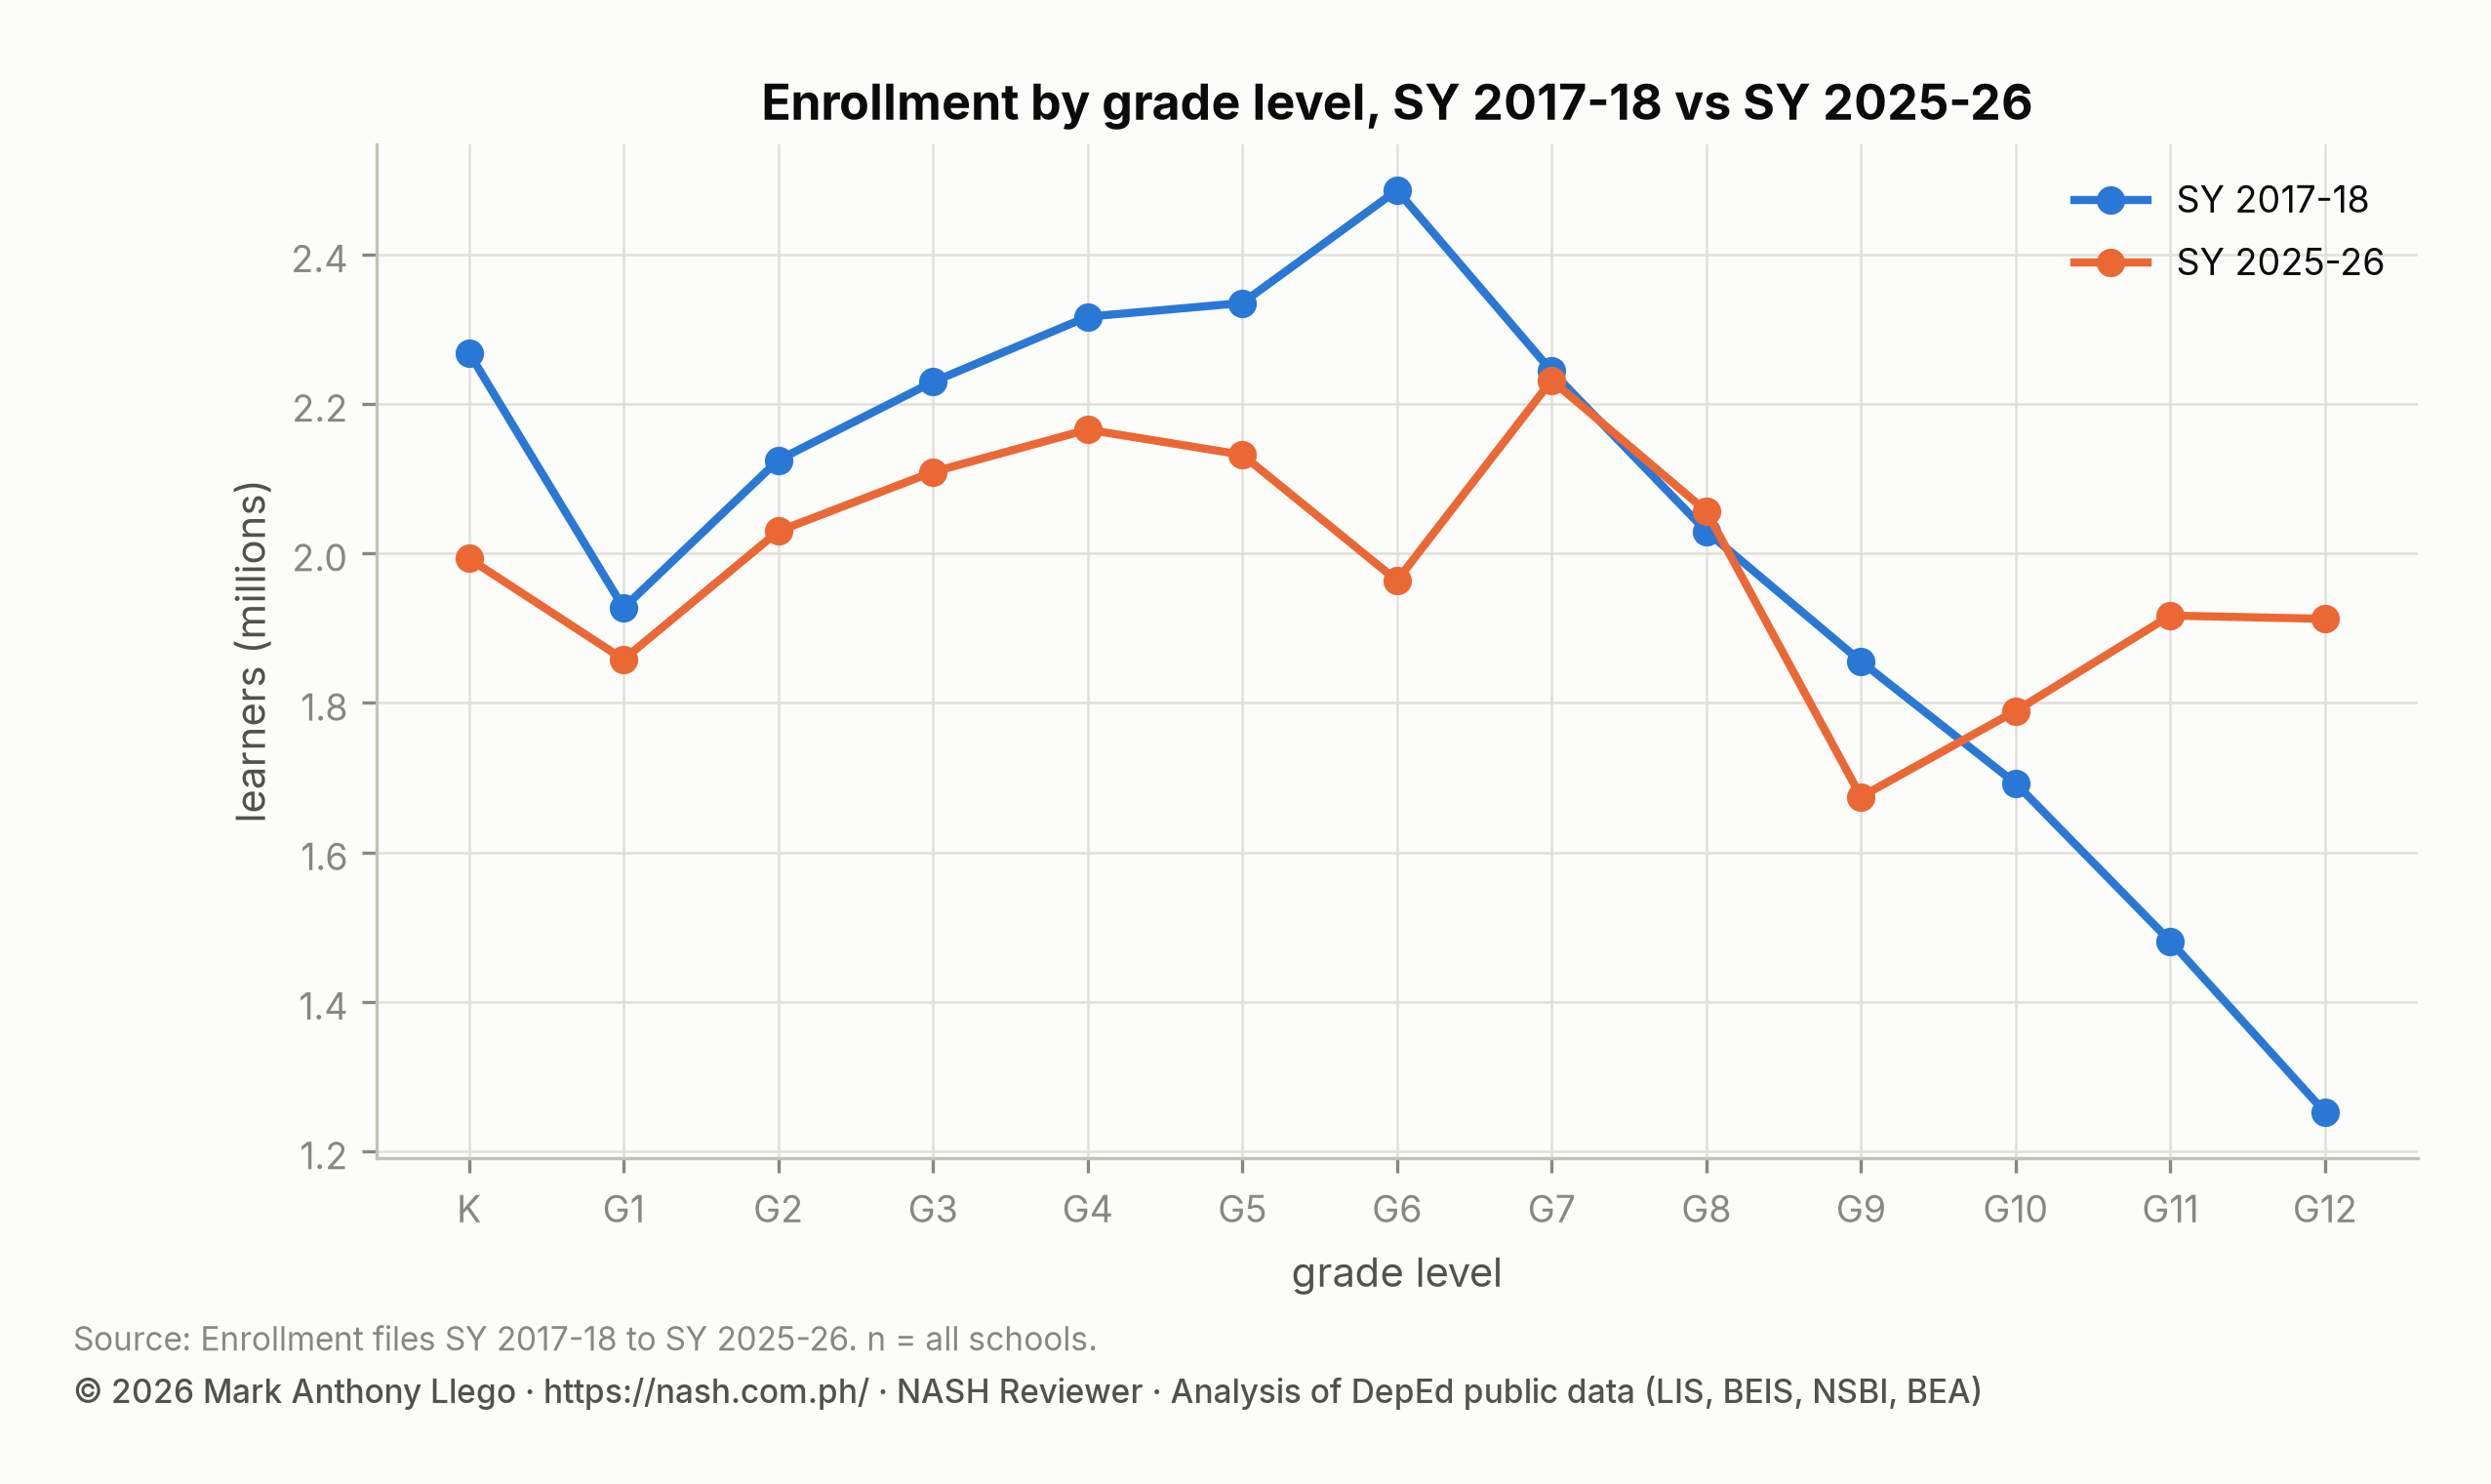
Grade 1 enrollment runs above the previous year’s kindergarten (ratios of 1.01 to 1.07) because over-age learners and children who skipped kindergarten enter at Grade 1. The one year below 1 was SY 2020-2021. The flow from Grade 6 to Grade 7 fell to 0.93 in SY 2020-2021 and has run at 0.97 to 0.98 since SY 2023-2024. The Grade 10 to Grade 11 ratio dropped to 0.93 in SY 2020-2021 and rebounded to 1.08 the next year as learners who had paused returned. Followed from grade to grade across the years, the SY 2017-2018 kindergarten cohort reached Grade 8 in SY 2025-2026 at 91% of its kindergarten size. That path mixes in repeaters and transfers, so it is a rough guide, not a survival rate.
Senior high school by track and strand
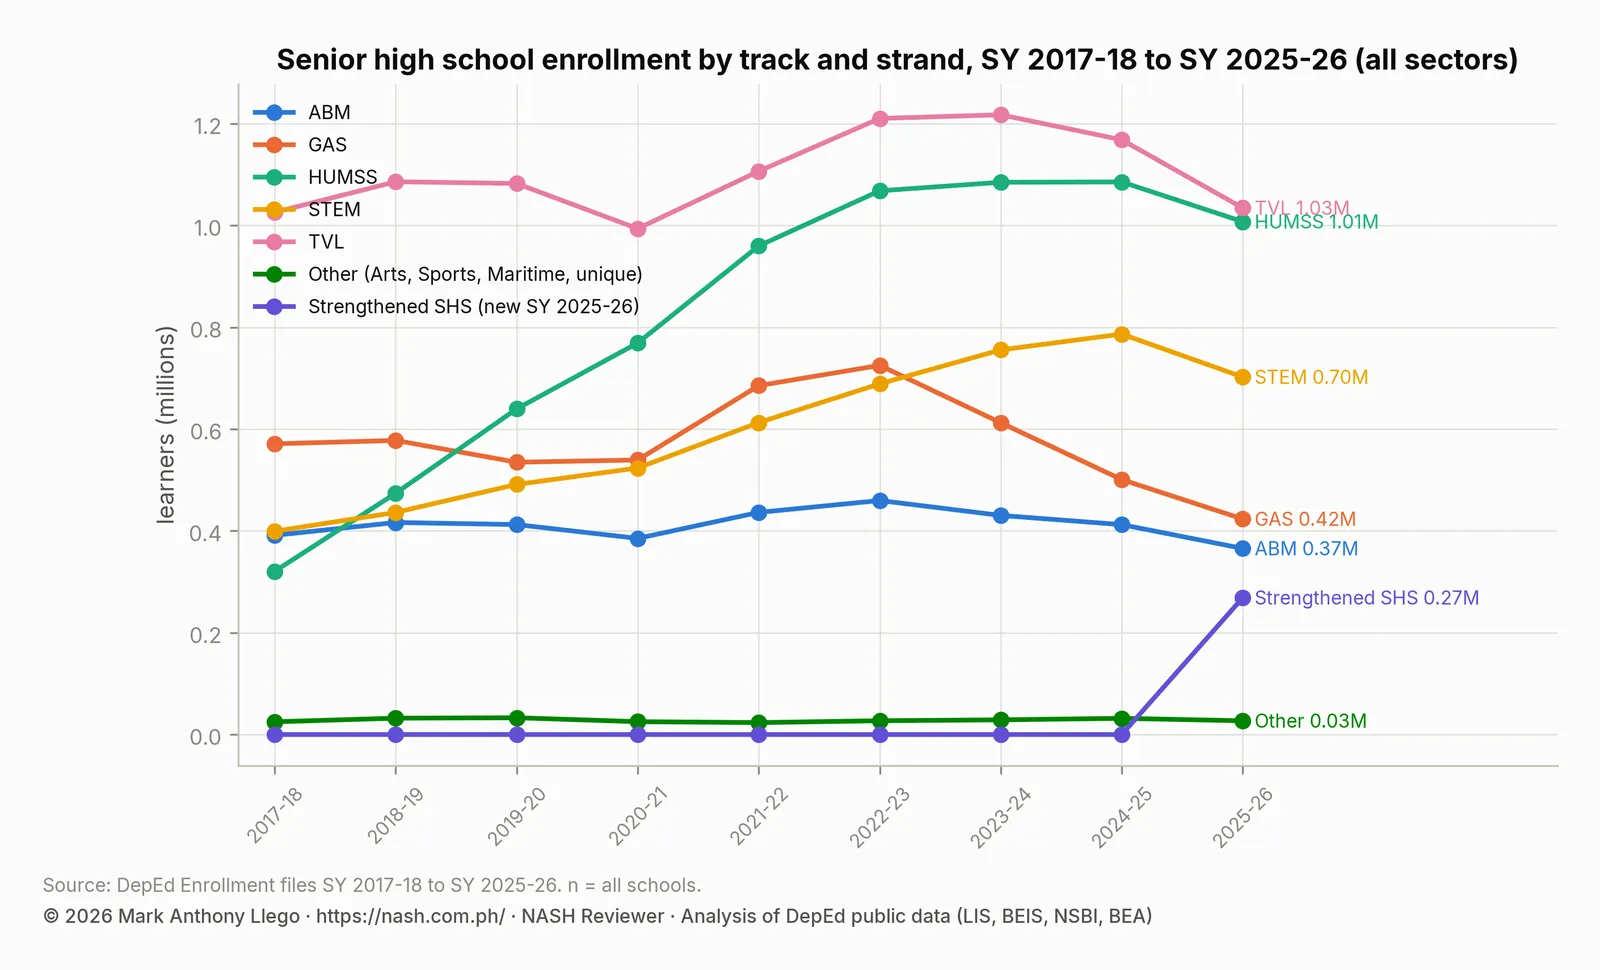
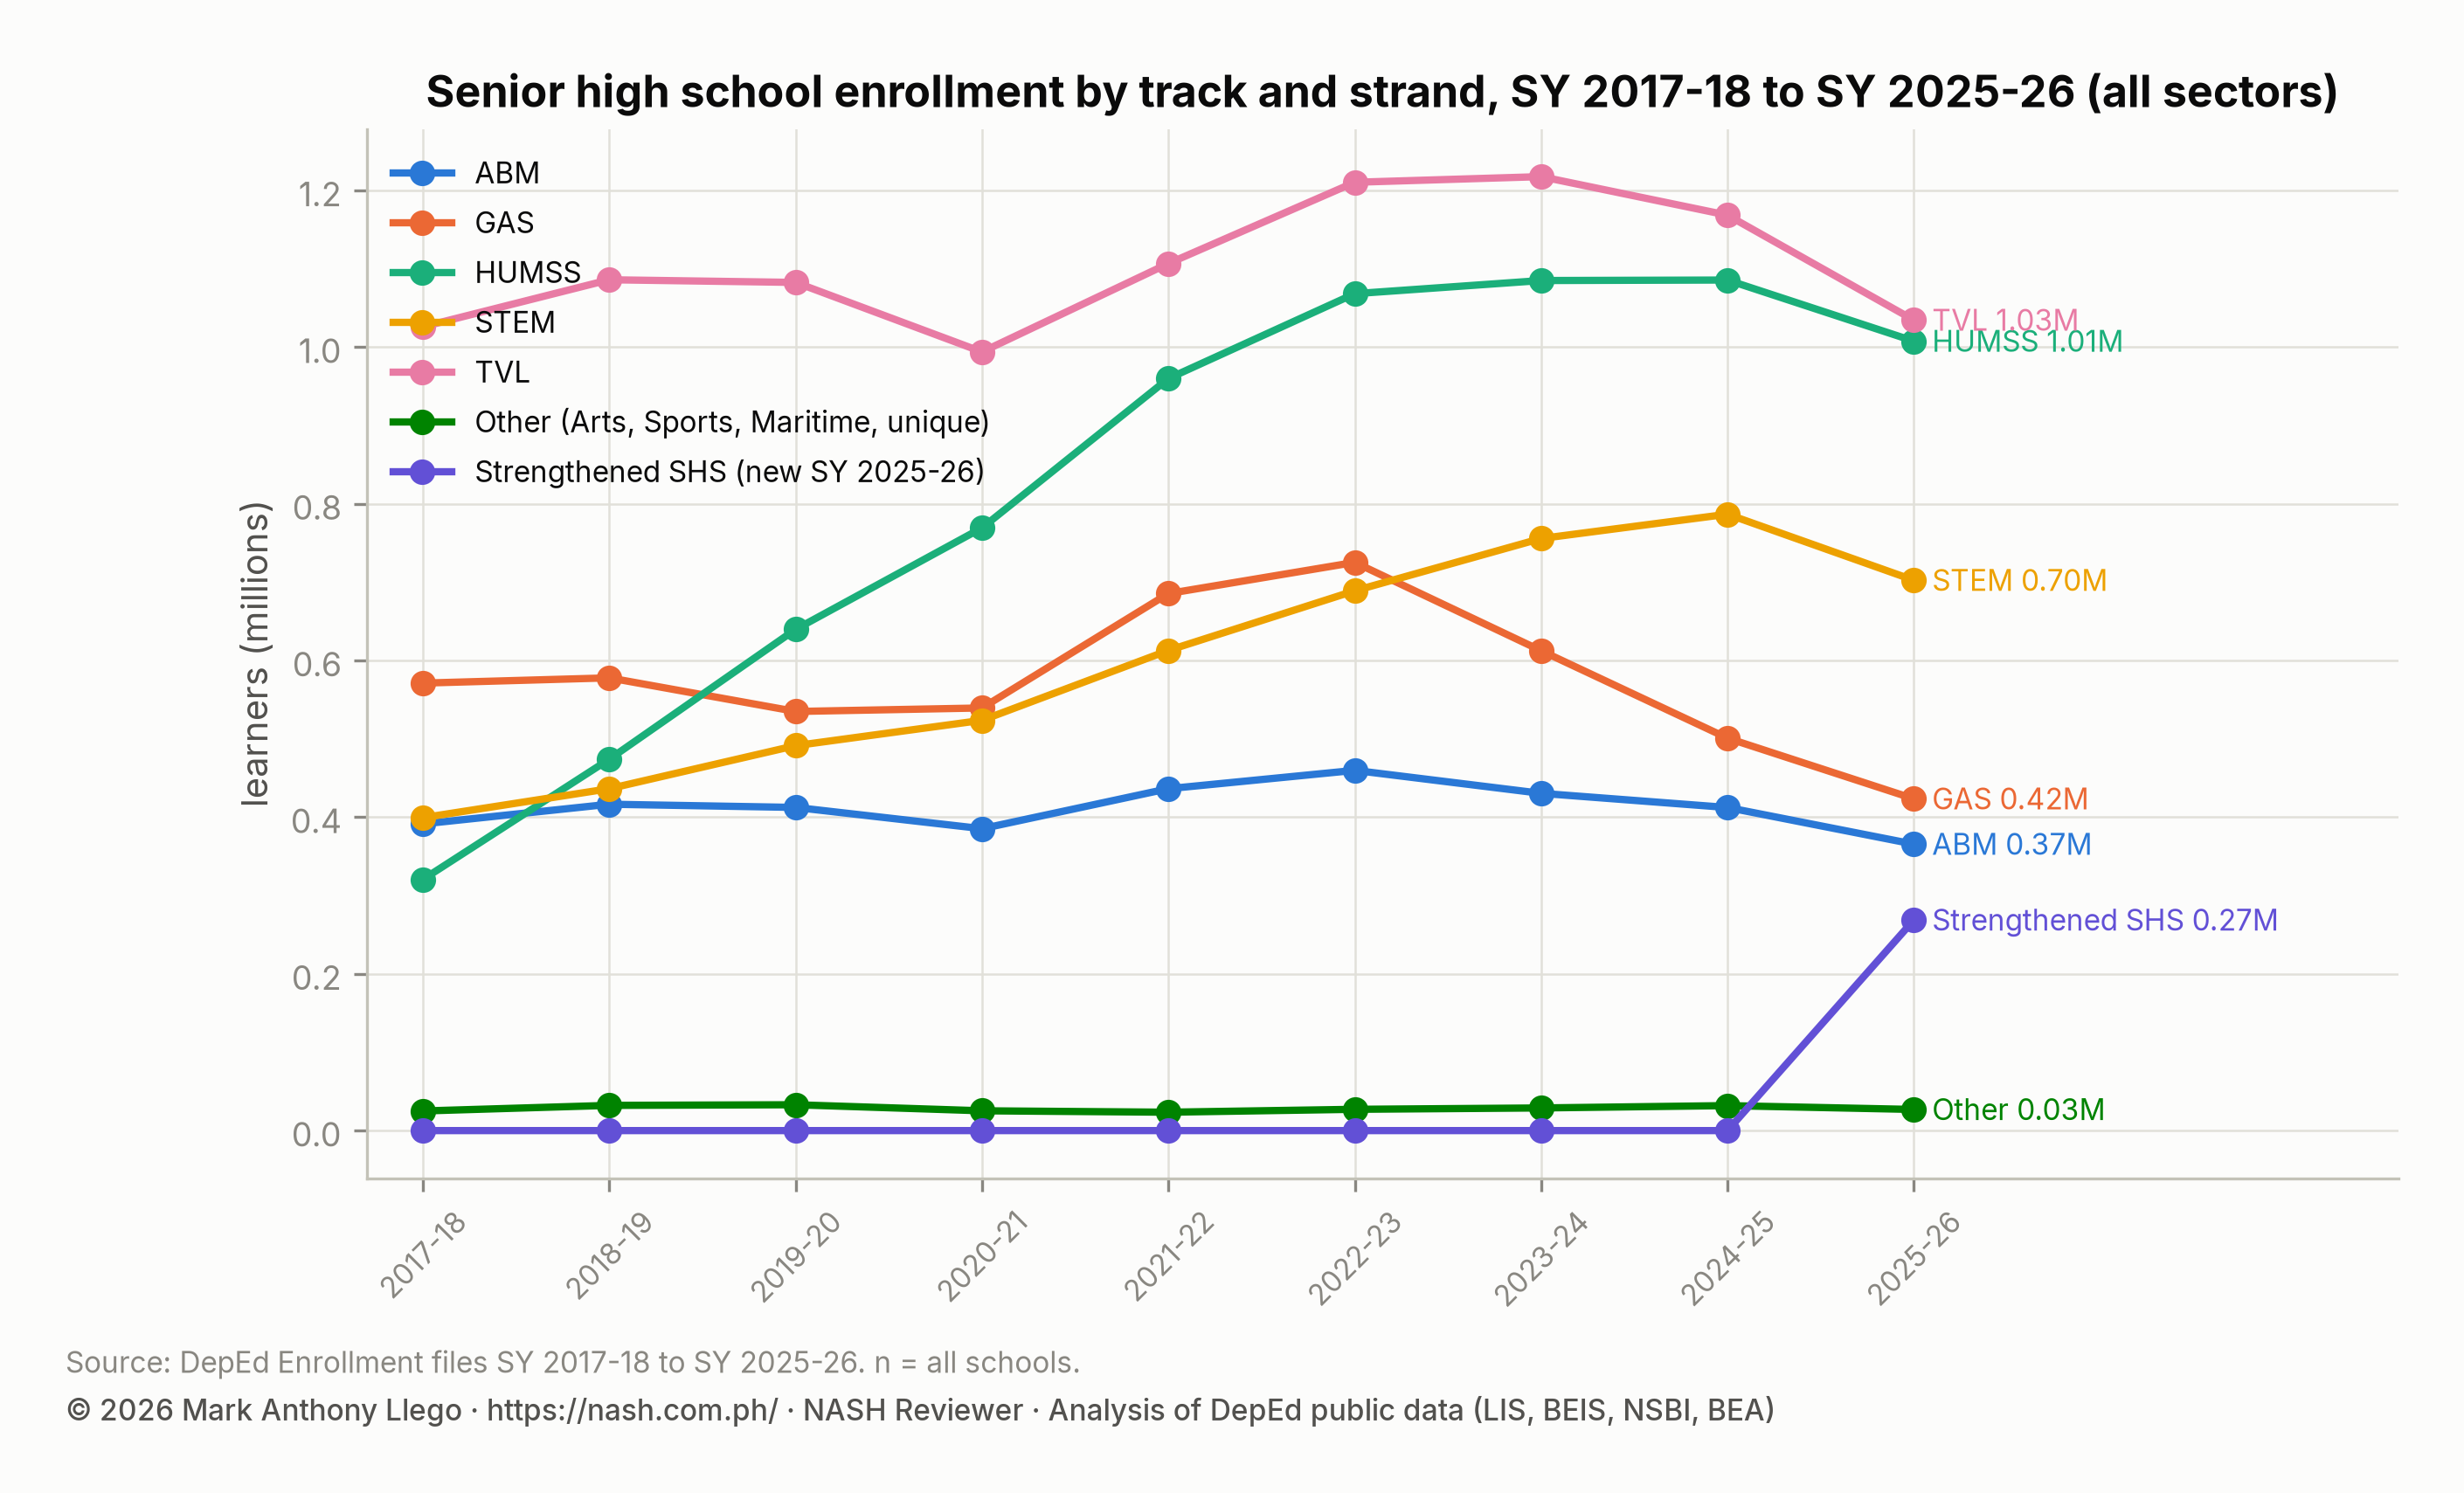
Senior high school is where the mix of learners changed most. The Technical-Vocational-Livelihood (TVL) track has been the largest throughout, peaking at 1.22 million in SY 2023-2024. The Humanities and Social Sciences (HUMSS) strand tripled, from 320,577 to about 1.0 million. Science, Technology, Engineering and Mathematics (STEM) nearly doubled, from 399,360 to 702,410, after a peak of 786,711 in SY 2024-2025. The General Academic Strand (GAS) and Accountancy, Business and Management (ABM) declined after SY 2022-2023. In SY 2025-2026 the new Strengthened Senior High School tracks appear with 268,830 learners, so strand shares for that year are not comparable with earlier ones.
| School year | ABM | GAS | HUMSS | STEM | TVL | Other (Arts, Sports, Maritime, unique) | Strengthened SHS (new SY 2025-26) |
|---|---|---|---|---|---|---|---|
| SY 2017-18 | 391,436 | 571,129 | 320,577 | 399,360 | 1,025,907 | 25,051 | 0 |
| SY 2018-19 | 416,558 | 577,830 | 473,958 | 436,376 | 1,085,926 | 32,193 | 0 |
| SY 2019-20 | 412,474 | 534,934 | 639,746 | 491,349 | 1,082,531 | 33,001 | 0 |
| SY 2020-21 | 385,359 | 539,413 | 769,252 | 523,658 | 993,856 | 25,289 | 0 |
| SY 2021-22 | 436,409 | 685,462 | 959,863 | 612,857 | 1,106,646 | 23,476 | 0 |
| SY 2022-23 | 459,753 | 725,231 | 1,068,169 | 688,983 | 1,210,330 | 27,178 | 0 |
| SY 2023-24 | 430,462 | 612,507 | 1,084,937 | 755,710 | 1,217,552 | 28,908 | 0 |
| SY 2024-25 | 412,369 | 500,915 | 1,085,575 | 786,711 | 1,168,349 | 31,893 | 0 |
| SY 2025-26 | 365,597 | 423,479 | 1,007,555 | 702,410 | 1,034,429 | 26,996 | 268,830 |
What this means for school heads
- Plan for fewer learners. The national trend is −2.3% a year, and the kindergarten cohorts entering now are the smallest in the series. A plan that assumes growth will build more than the school needs.
- Know your region’s direction. BARMM schools face rising enrollment with the fewest resources in the country. Schools in Regions I, VI and VIII face falling enrollment, merged classes and the risk of losing teacher items.
- The private-to-public shift has only partly reversed. Private enrollment is 0.55 million below its SY 2019-2020 level, and the private share of learners (14.5%) has not returned to its pre-pandemic 15.9%.
- Senior high school has stopped growing. The surge of the first cohorts is over. The mix of strands, not the total headcount, is now the number to plan around.
How these numbers were made
- Source: the nine DepEd enrollment datasets (Learner Information System), one CSV per school year with one row per school, enrollment by grade, sex and senior-high strand. Totals are sums over all schools present in each year.
- Blanks: the SY 2025-2026 file writes blanks where earlier years wrote zeros. A blank for a level the school does not offer is read as zero. A school that reports at least one level but leaves an offered level blank is read as zero at that level. The 46 schools with every cell blank reported nothing and are excluded from that year’s total; they held about 465 learners in SY 2024-2025.
- Growth: compound annual growth rate = (end ÷ start)^(1 ÷ years) − 1. Trends are log-linear fits with and without SY 2020-2021 and SY 2021-2022.
- Regions: constant SY 2025-2026 boundaries by division. Division names are not unique nationally (two San Carlos Cities, two San Fernando Cities), so the assignment uses region and division together.
- Checks: a balanced panel of the 55,029 always-present schools, and comparisons of the same schools present in both adjacent years, give the same conclusions.
Limits
Enrollment is a beginning-of-school-year count from the LIS. It does not show dropouts during the year or completers. School IDs change for a minority of schools (146 likely cases), and the panel counts each change as an exit plus an entry. The files have no population denominators, so the gross and net enrollment rates that DepEd defines in its technical notes cannot be computed here.
Frequently asked questions
Is DepEd enrollment in the Philippines going up or down?
Down since SY 2022-2023. Total basic education enrollment peaked at 27.79 million in SY 2022-2023 and was 25.94 million in SY 2025-2026, a fall of 2.3% a year. It is now below the SY 2017-2018 level of 26.31 million.
Did private school enrollment recover after the pandemic?
Partly. Private enrollment fell from 4.30 million in SY 2019-2020 to 3.31 million in SY 2021-2022. It recovered to 3.76 million in SY 2025-2026, still 13% below its pre-pandemic level. The private share of all learners was 14.5% in SY 2025-2026 against 15.9% in SY 2019-2020.
Which DepEd region is growing in enrollment?
BARMM is the only region growing, at 2.6% a year over eight years, and the only region that still grew after SY 2022-2023. Region I, Region VI and Region VIII shrank the most, by about 1.1% a year.
Download the data
The cleaned, harmonized DepEd files behind this series are free to download in CSV and Parquet, with a codebook and checksums, under the terms of use set out in the release. Download Cleaned DepEd School Data, SY 2017-18 to 2025-26 documents every file and column. The files themselves are at data.nash.com.ph, starting with the README, the SY 2023-24 school master file (CSV, 8.0 MB) and the nine-year enrollment panel (Parquet, 17.2 MB).
More in this series
- Enrollment by school year: SY 2017-18, SY 2018-19, SY 2019-20, SY 2020-21, SY 2021-22, SY 2022-23, SY 2023-24, SY 2024-25, SY 2025-26
- DepEd Learner Data SY 2023-2024: IP, ALIVE and School Size
- DepEd Teachers and School Personnel Data, SY 2023-2024
- DepEd Classroom and School Building Data, SY 2023-2024
- DepEd WASH Data SY 2023-2024: Toilets, Water, Electricity
- DepEd ICT Data SY 2023-2024: Computers and Internet
- NAT Grade 6 Results SY 2023-2024: DepEd Division Scores
- ELLNA Grade 3 Results SY 2023-2024: DepEd Division Scores
- CRLA Results SY 2025-2026: Reading Levels in Grades 1 to 3
- DepEd School Inputs vs Test Results: Multigrade and Internet
- DepEd Open Data Quality: Errors, Blanks and Coverage Limits
- Download Cleaned DepEd School Data, SY 2017-18 to 2025-26
- The full report with every chart and table: Philippine basic education in numbers
Guides for aspiring school heads
- DepEd Data for Aspiring School Heads: Where to Start
- NASH Practice Questions With Answers: 50 Items on the PPSSH
- How to Read DepEd Data: A Guide for Aspiring School Heads
- EDCOM II Final Report: Guide for Aspiring School Heads
- National Education Plan 2026-2035: Guide for School Heads
- NASH Study Guide: DepEd Memorandum 069, s. 2025 and PPSSH
- PPSSH Domain 1: Leading Strategically With DepEd Data
- PPSSH Domain 2: Managing School Operations With DepEd Data
- PPSSH Domain 3: Teaching and Learning With DepEd Data
- PPSSH Domain 4: Developing Self and Others With DepEd Data
- PPSSH Domain 5: Building Connections With DepEd Data
Analysis and charts by Mark Anthony Llego for NASH Reviewer. Data: Department of Education public datasets. Charts may be reused only with written permission from support@nash.com.ph.