DepEd’s ICT dataset for SY 2023-2024 shows how many computers public schools have, who paid for them, and what other equipment schools report; the WASH module shows which schools have internet. Both cover the 47,814 public schools with learners. Public schools report 1.9 million academic computers, but 24.6% of schools have none.
The ICT dataset is the most detailed of the school modules, with 588 columns. It counts computers and equipment in every public school by level (elementary, junior high, senior high), by type (desktop, laptop, all-in-one, tablet, tablet PC, thin client), by purpose (academic or administrative) and by funding source. The funding sources are the DepEd Computerization Program (DCP), other DepEd funds, local governments and the Special Education Fund (SEF), PTAs, private donors, other government agencies and others.
The companion report, Philippine basic education in numbers, holds the method notes and the data behind every chart.
Key findings
- Public schools report 1,948,140 academic-use computers, or 1.54 million after capping the obvious entry errors. That is 6.6 per 100 learners nationally, and the median school has 2.3 per 100.
- 24.6% of public schools (11,773) report no academic computer at all. BARMM and Region IX have the highest shares.
- The DepEd Computerization Program paid for 49.8% of academic computers. Local governments and the Special Education Fund paid for 32.7%, and other DepEd funds for 13.0%. PTAs, private donors and other agencies together paid for under 4%.
- Tablets are 47.6% of academic computers. Tablet PCs are 14.7%, desktops 13.4%, laptops 11.9% and thin clients 9.5%.
- Printers (84% of schools) and smart TVs (66%) are the most common equipment. Routers are in 30% of schools and UPS units in 24%.
- Computers per learner show no association with test results once schools are compared within a division. Internet access does.
Academic computers per 100 learners by region
DepEd’s technical notes define the computer-learner ratio as total enrollment divided by academically used computers. This report turns it around into computers per 100 learners. The national figure is 6.6 after winsorizing the counts, that is, capping them at the 99th percentile of schools (486 computers). Capping is necessary because 108 cells in the file exceed 1,000 and one school reports 15,699 tablets. The median school has 2.3 computers per 100 learners, a quarter of schools have none, and the top 5% have more than 33 per 100.
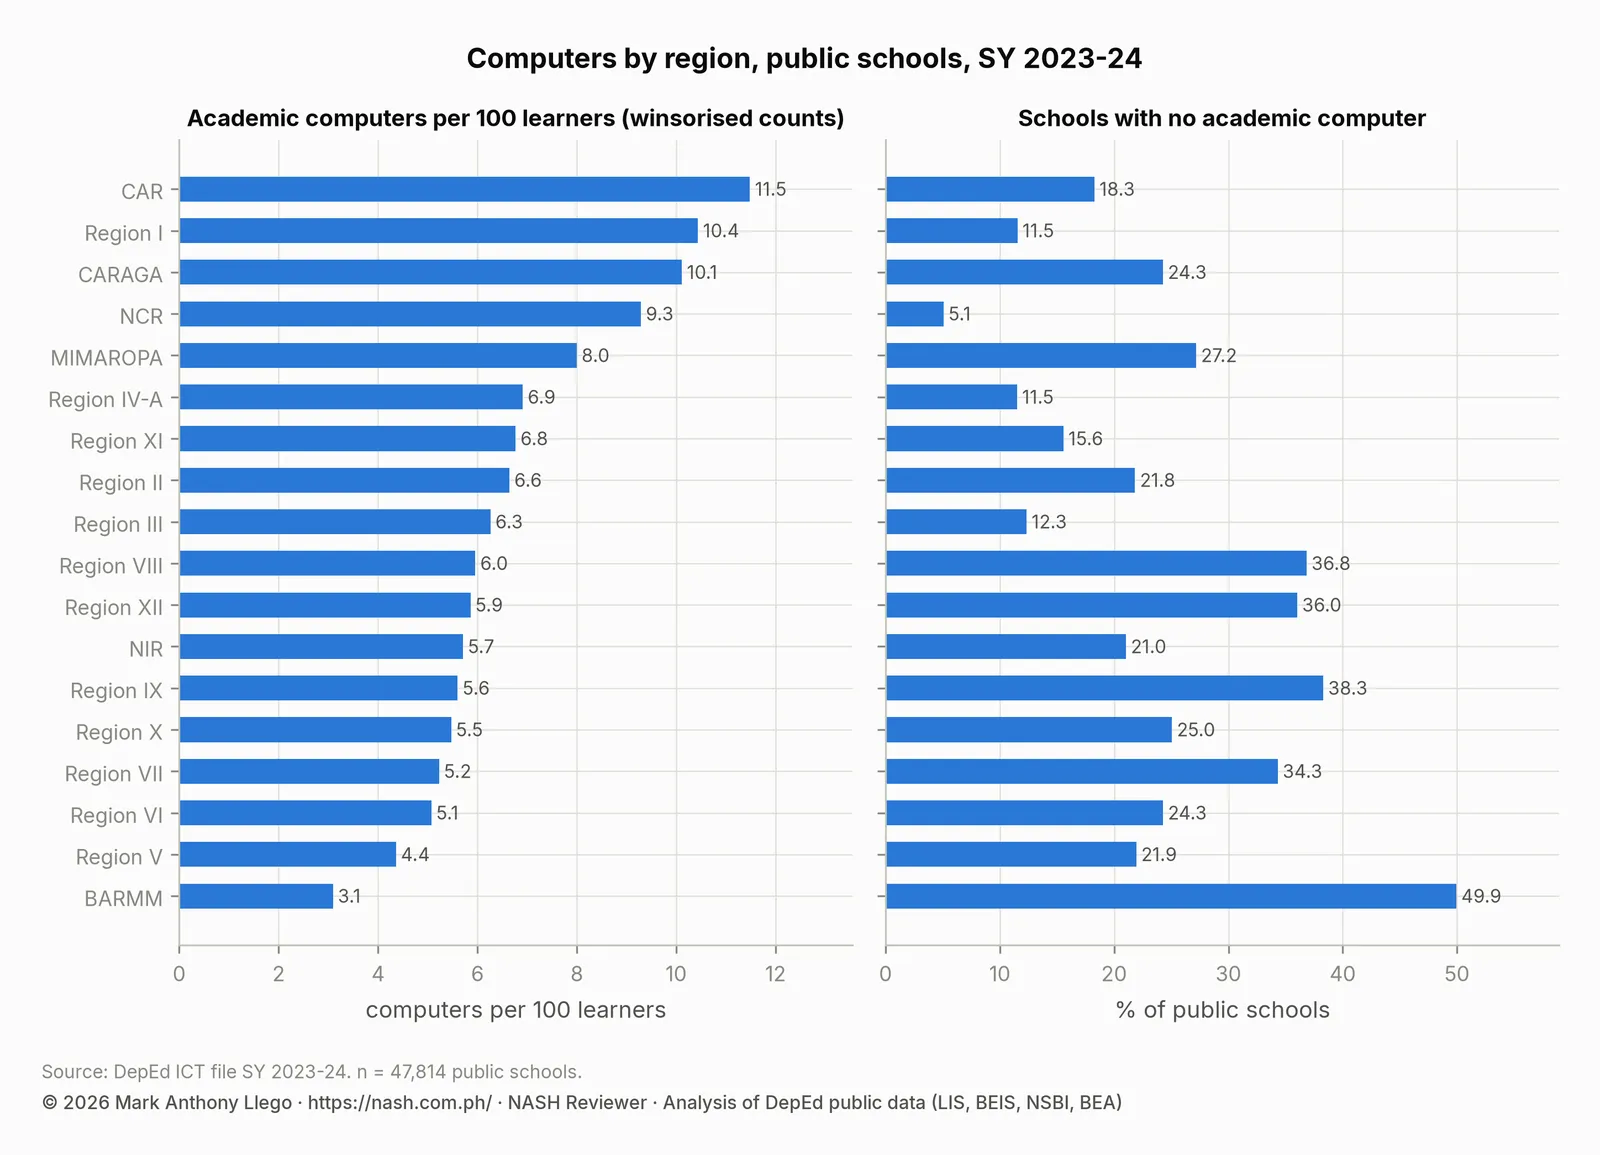
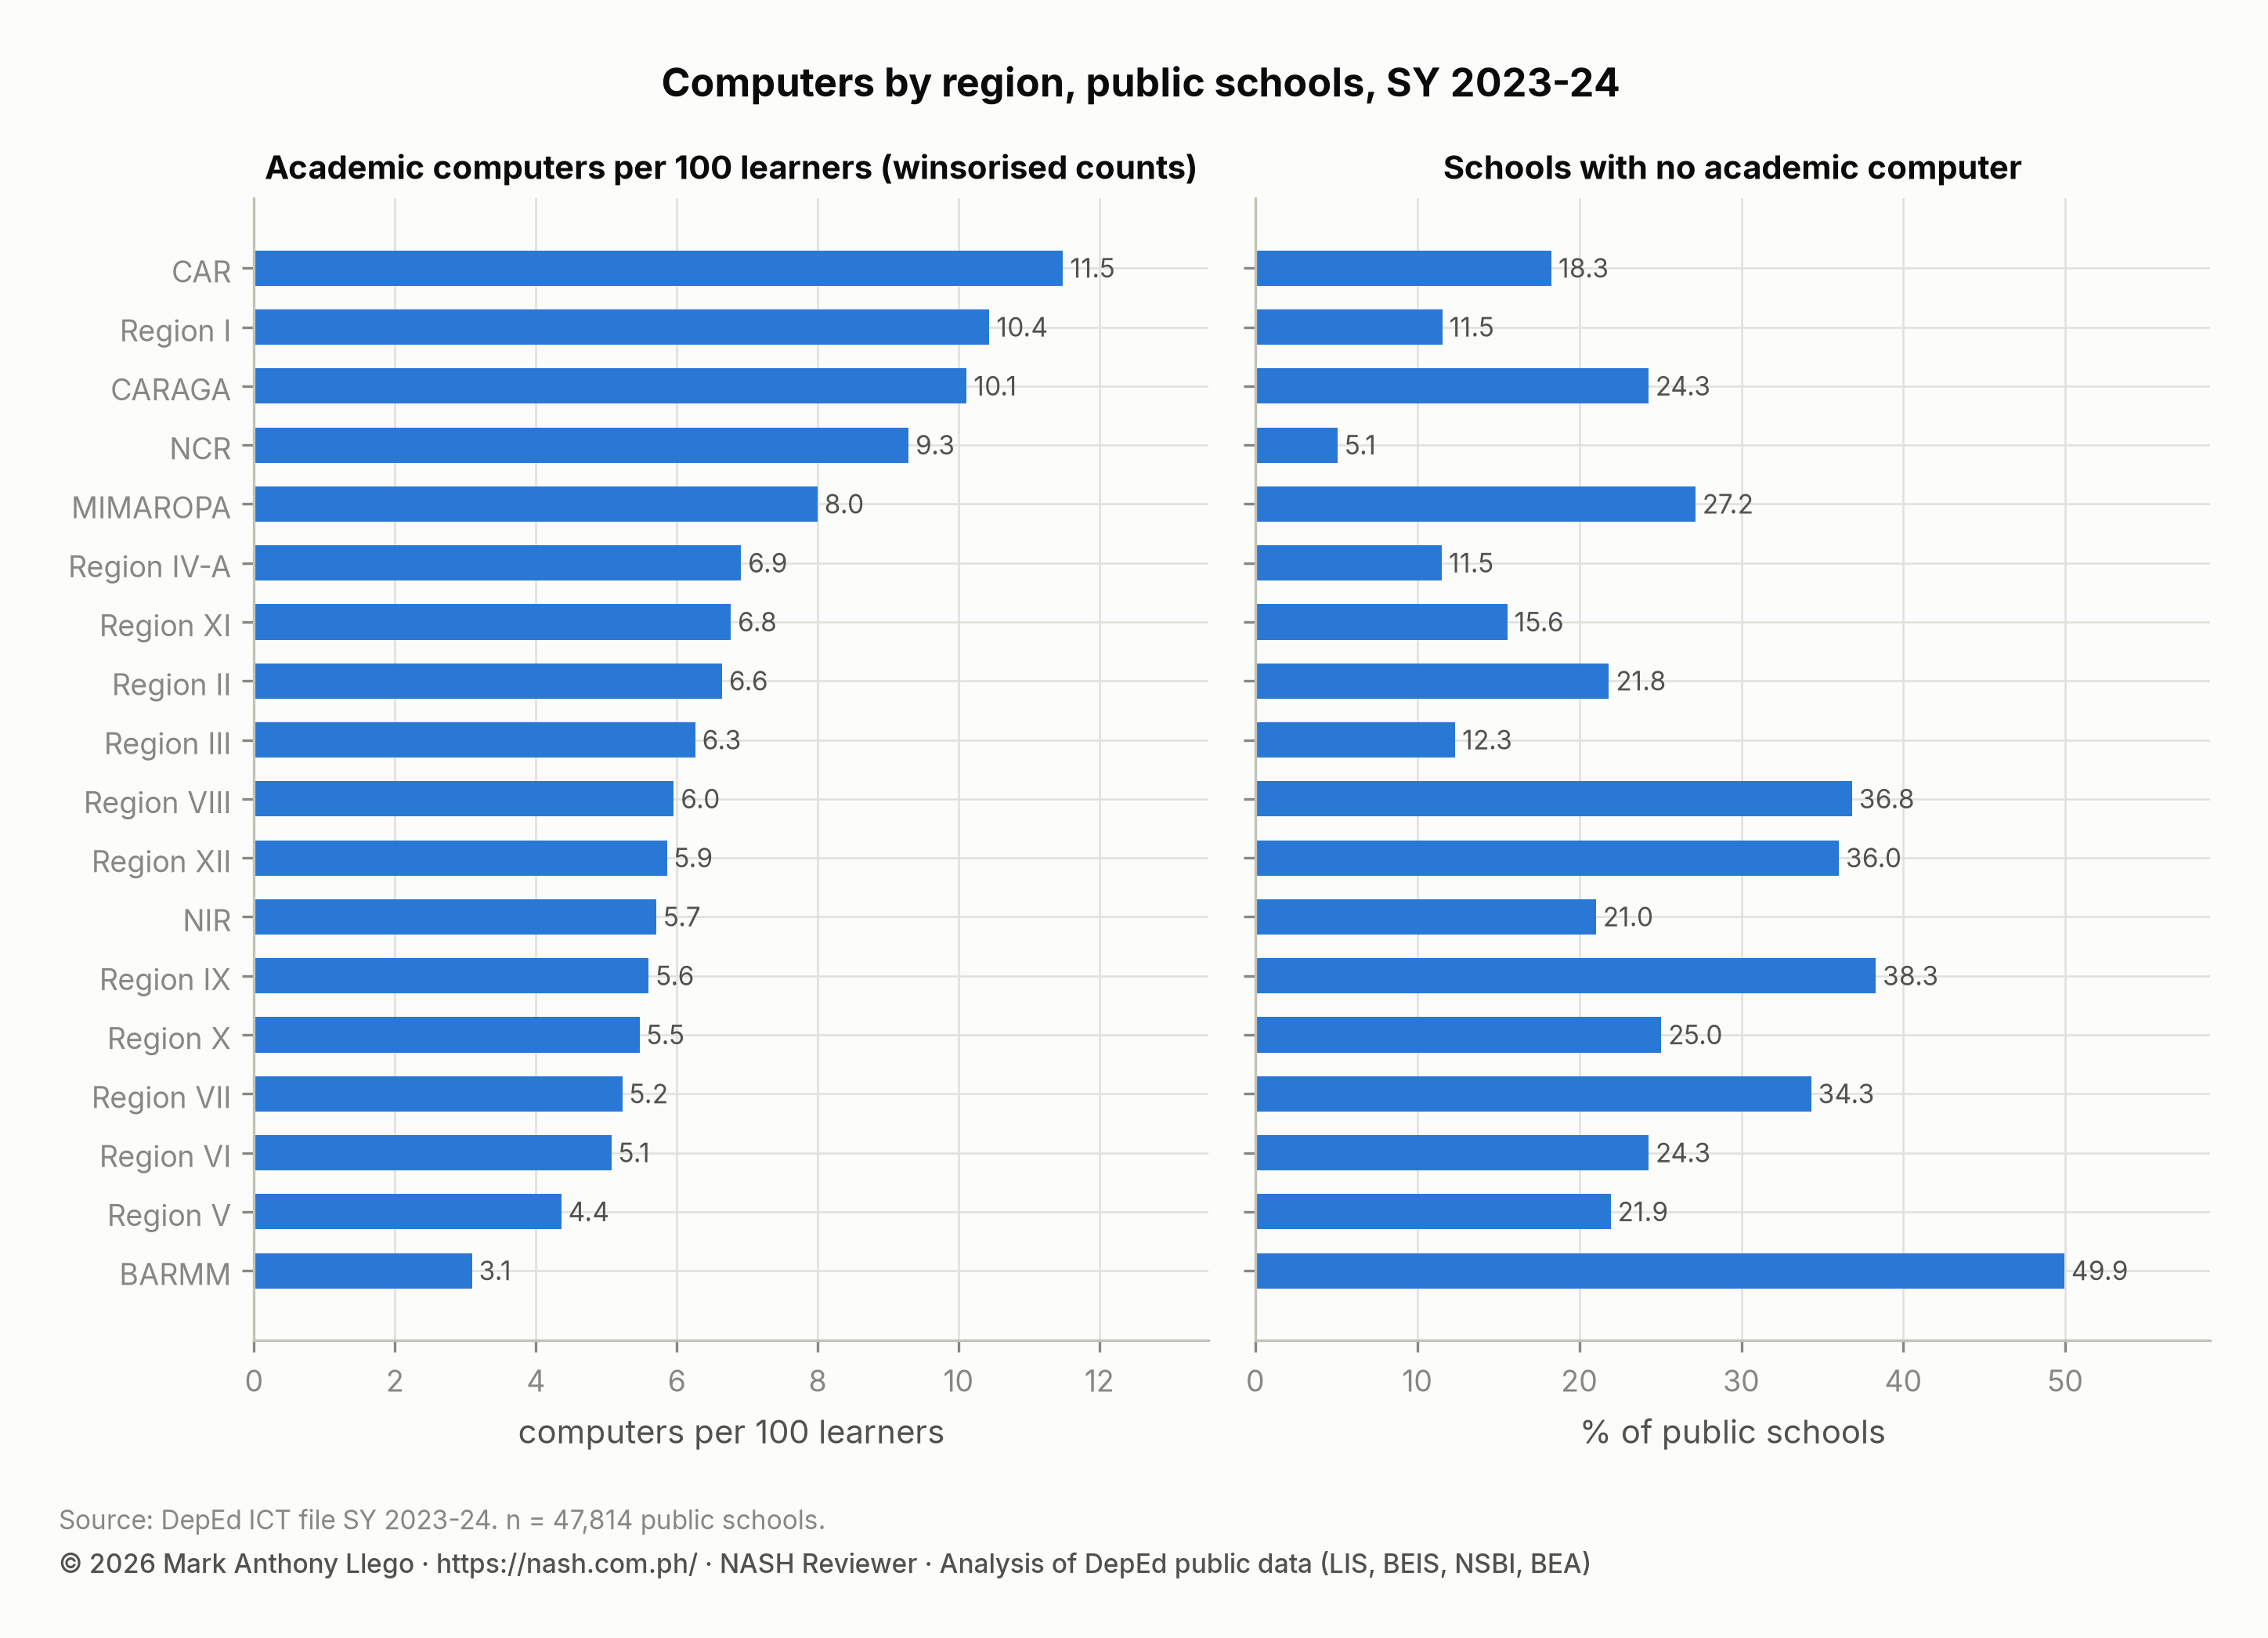
CAR (11.5 per 100 learners), Region I (10.4), CARAGA (10.1) and NCR (9.3) have the most. BARMM (3.1), Region V (4.4), Region VI (5.1), Region VII (5.2), Region X (5.5) and Region IX (5.6) have the fewest. The share of schools with no academic computer is highest in BARMM and Region IX, the two regions with the most schools without toilets and without internet.
| Region | Academic computers per 100 learners | Median school | Schools with no academic computer | ES learners with internet |
|---|---|---|---|---|
| BARMM | 3.1 | 0.1 | 49.9% | 80.4% |
| CAR | 11.5 | 6.1 | 18.3% | 81.1% |
| CARAGA | 10.1 | 4.4 | 24.3% | 89.3% |
| MIMAROPA | 8 | 2.9 | 27.2% | 73.6% |
| NCR | 9.3 | 9.1 | 5.1% | 97.4% |
| NIR | 5.7 | 2.6 | 21.0% | 82.7% |
| Region I | 10.4 | 6.7 | 11.5% | 96.5% |
| Region II | 6.6 | 2.5 | 21.8% | 94.3% |
| Region III | 6.3 | 2.7 | 12.3% | 97.9% |
| Region IV-A | 6.9 | 3.2 | 11.5% | 96.1% |
| Region IX | 5.6 | 1.3 | 38.3% | 72.6% |
| Region V | 4.4 | 1.5 | 21.9% | 73.6% |
| Region VI | 5.1 | 1.4 | 24.3% | 84.2% |
| Region VII | 5.2 | 1 | 34.3% | 90.8% |
| Region VIII | 6 | 1.3 | 36.8% | 80.2% |
| Region X | 5.5 | 2.2 | 25.0% | 82.9% |
| Region XI | 6.8 | 3.5 | 15.6% | 85.3% |
| Region XII | 5.9 | 1.1 | 36.0% | 83.1% |
| Philippines (public) | 6.6 | 2.3 | 24.6% | 87.8% |
Funding sources and device types
Half of all academic computers (969,301) came through the DCP. Local governments and the SEF supplied 32.7%, a far larger share than for teachers (2.0%) or any other input in this series. Other DepEd funds supplied 13.0%. PTAs (0.1%), private donors (1.7%), other government agencies (1.7%) and other sources (1.0%) supplied very little.
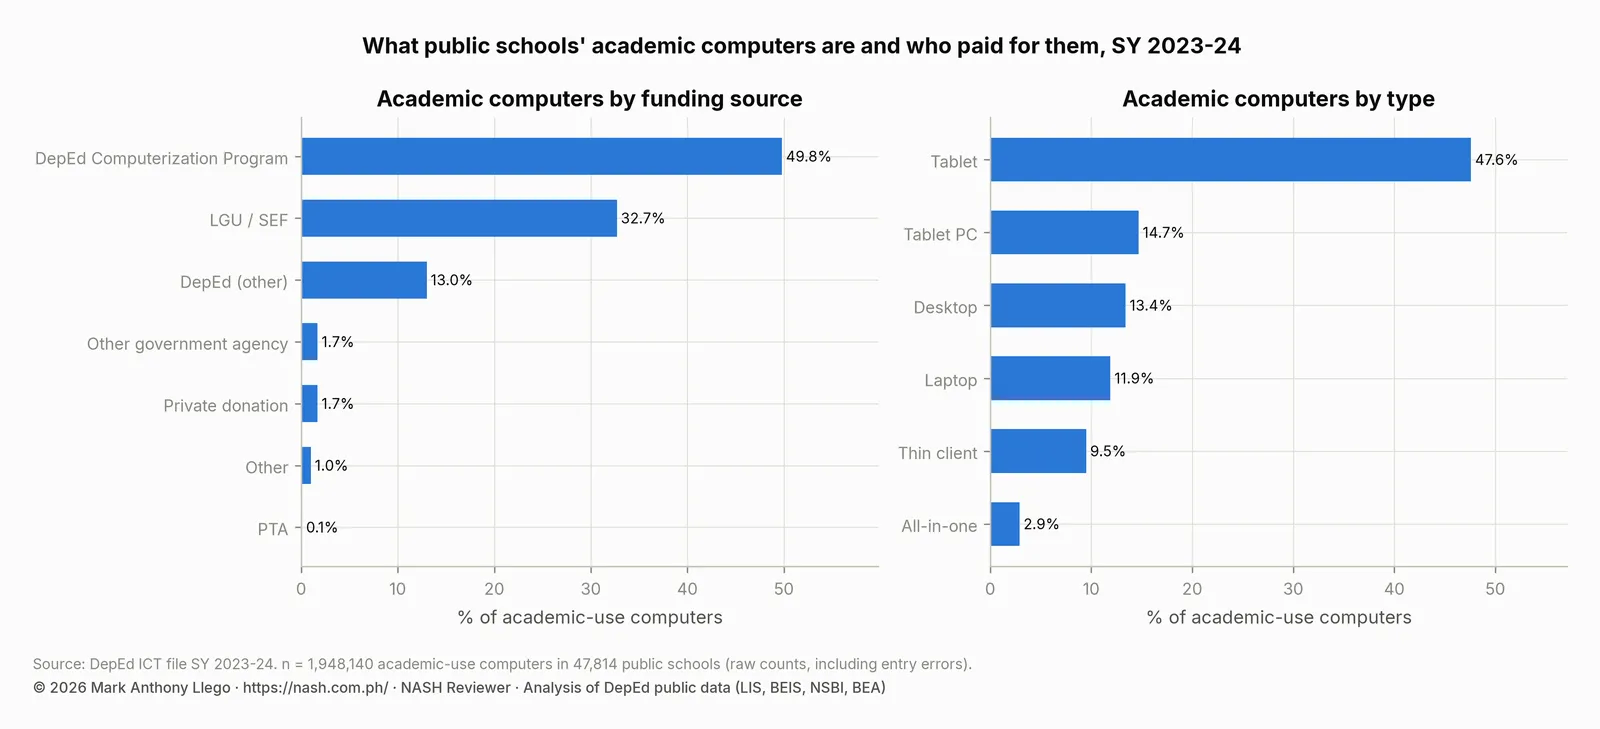
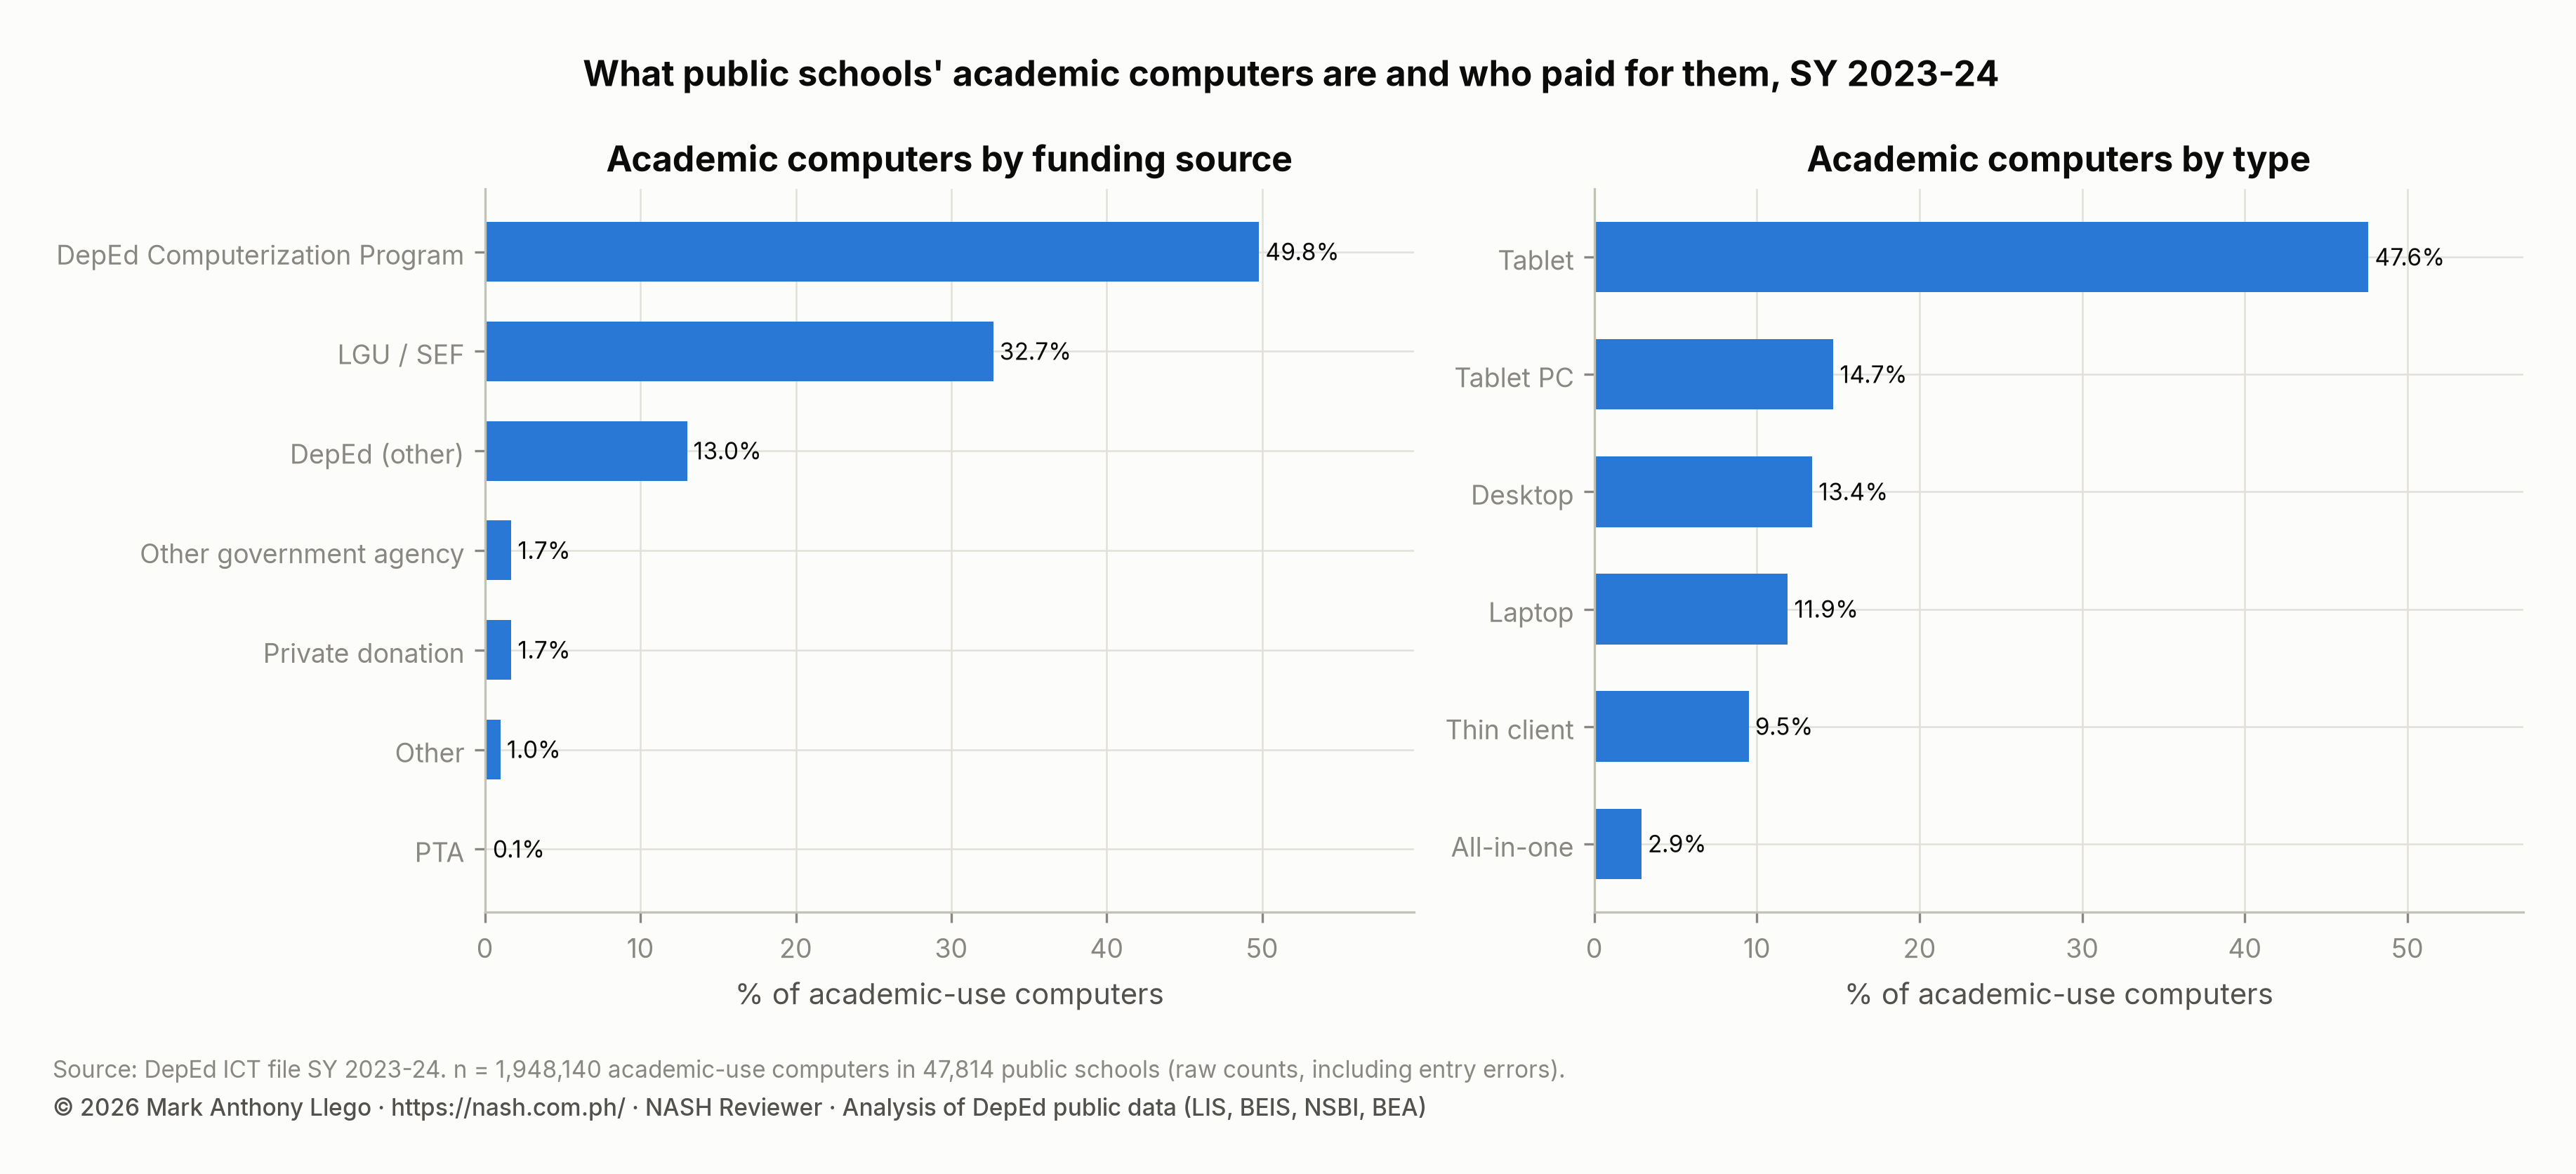
By type, tablets are the largest group at 47.6%, followed by tablet PCs (14.7%), desktops (13.4%), laptops (11.9%), thin clients (9.5%) and all-in-ones (2.9%). The entry errors mentioned above inflate the tablet share, and the school with 15,699 tablets is one of them. Even on winsorized counts, tablets are the largest category, because the DCP’s recent packages and local government purchases have mostly been tablets.
| Funding source | Academic computers | Share |
|---|---|---|
| DepEd Computerization Program | 969,301 | 49.8% |
| DepEd (other) | 252,494 | 13.0% |
| LGU / SEF | 636,869 | 32.7% |
| PTA | 2,490 | 0.1% |
| Private donation | 33,819 | 1.7% |
| Other government agency | 33,141 | 1.7% |
| Other | 20,026 | 1.0% |
| Type | Academic computers | Share |
|---|---|---|
| Desktop | 261,803 | 13.4% |
| Laptop | 231,798 | 11.9% |
| All-in-one | 55,735 | 2.9% |
| Tablet | 926,796 | 47.6% |
| Tablet PC | 286,627 | 14.7% |
| Thin client (virtual terminal) | 185,381 | 9.5% |
Printers, smart TVs, projectors and routers
The file also counts LED and smart TVs, projectors, printers, routers, network switches, external drives, UPS units and lapel microphones. Printers are nearly universal: 367,743 units, and 84.1% of schools have one. Smart TVs (188,373 units, in 65.9% of schools) have overtaken projectors (60,326, in 54.7%) as the classroom display. Only 29.9% of schools report a router and 24.0% a UPS unit. A computer without power protection or a network is a computer that stops working.
| Equipment | Units | Units per 100 schools | Schools with at least one | Share of schools |
|---|---|---|---|---|
| Projectors | 60,326 | 126 | 26,158 | 54.7% |
| Smart TVs | 188,373 | 394 | 31,524 | 65.9% |
| LED TVs | 186,355 | 390 | 24,970 | 52.2% |
| Printers | 367,743 | 769 | 40,223 | 84.1% |
| Routers | 39,409 | 82 | 14,302 | 29.9% |
| UPS units | 80,638 | 169 | 11,474 | 24.0% |
| Lapel microphones | 50,402 | 105 | 14,456 | 30.2% |
Internet access in public schools
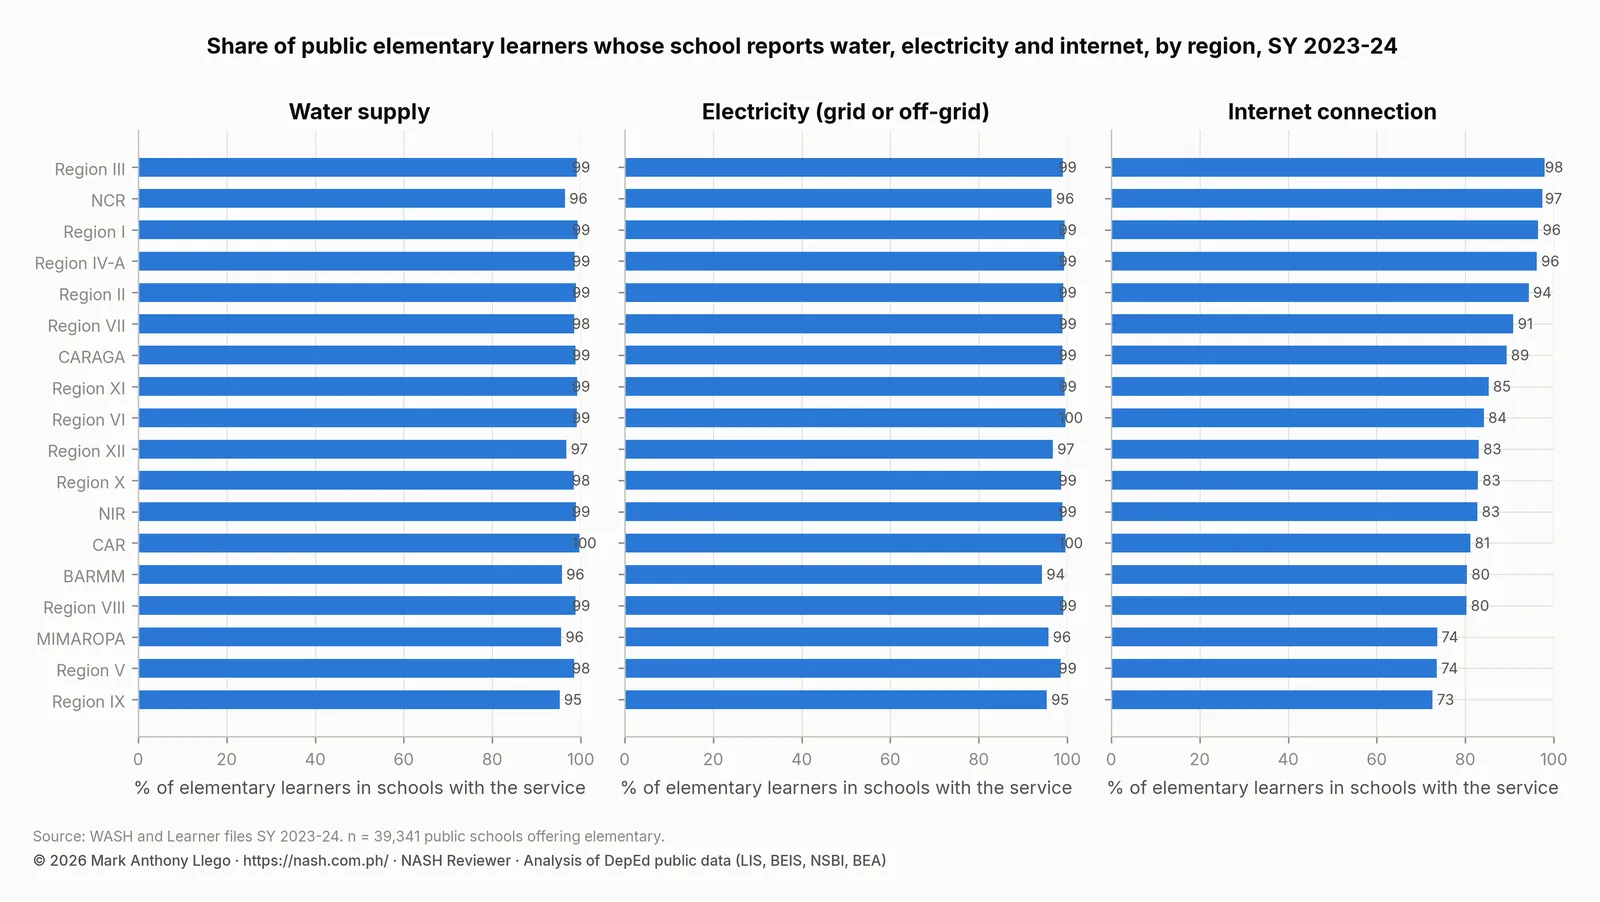
The WASH and Utilities module records internet access for each level of a school. 78.1% of public schools, holding 90.4% of learners, report a connection at some level. Among elementary schools, it is 76.2% of schools and 87.8% of learners. By region, the share of elementary learners with internet runs from 98% in Region III to 73% in Region IX. The SY 2023-2024 WASH report has the regional table.
Computers, internet and test results
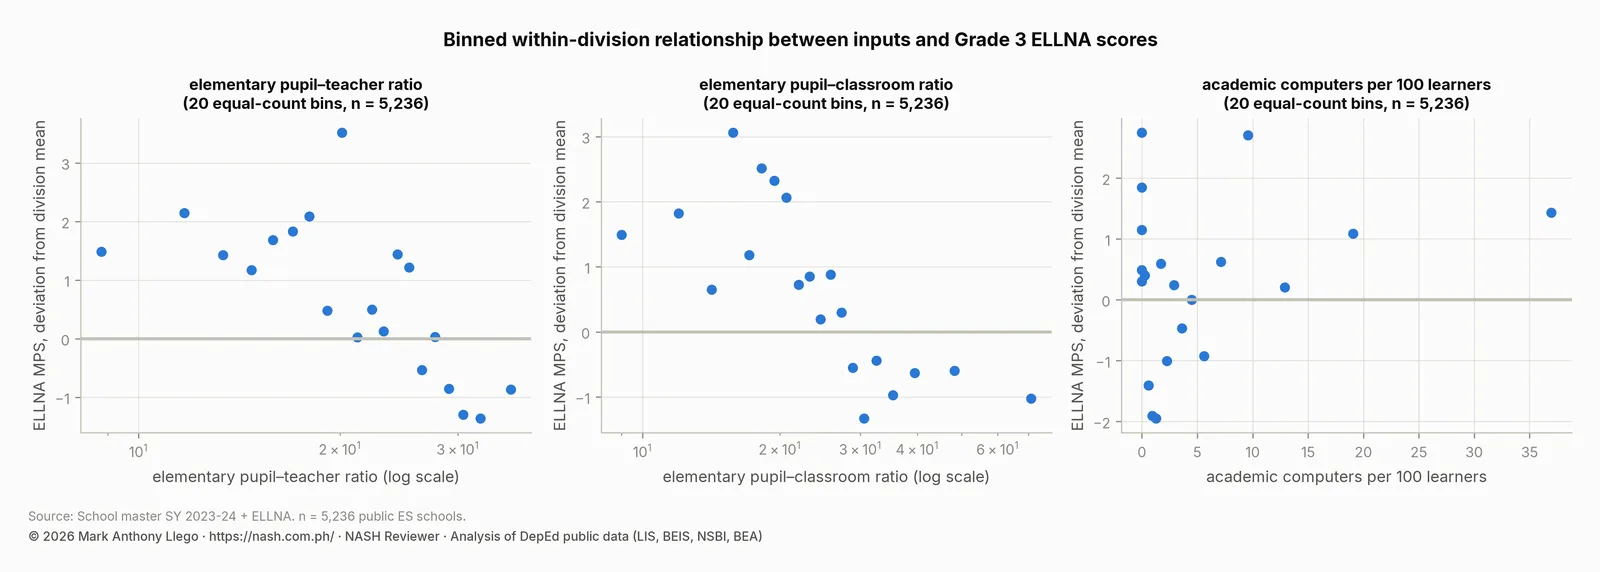
In the 44 divisions with assessment data, academic computers per 100 learners have no detectable association with test results. This holds for the Grade 3 Early Language, Literacy and Numeracy Assessment (ELLNA), the Grade 6 National Achievement Test (NAT) and the Grade 1 to 3 Comprehensive Rapid Literacy Assessment (CRLA). The comparison is between schools in the same division, with school size and internet access held constant. The coefficient is close to zero in every one of nine alternative specifications.
Internet access, by contrast, is associated with about +2.6 NAT points and +1.5 percentage points more early readers at grade level for a connected school against an unconnected one. The pattern is consistent with devices mattering only when they are connected, maintained and used, and the stock count measures none of those. The analysis of school inputs and test results has the models.
What this means for school heads
- Take an inventory before buying. The system already has 1.9 million devices, yet a quarter of schools have none. The first question is where the existing devices are and whether they work.
- Count routers and power protection, not only devices. Only 30% of schools report a router and 24% a UPS. A tablet becomes a learning resource only with a connection and protected power.
- The local government is the second-largest funder. A third of academic computers came from local governments and the SEF. The School Governing Council and the local school board are where a school head asks for them.
- Fix data entry. 316 schools report more computers than learners, and 108 cells are above 1,000, so DepEd’s planners are allocating on partly wrong numbers. The BEIS form is the school head’s responsibility.
How these numbers were made
- Source: DepEd’s ICT dataset for SY 2023-2024 (BEIS), joined to the learner file on school ID; public schools only. Internet fields come from the WASH and Utilities module.
- Academic computers = desktop, laptop, all-in-one, tablet, tablet PC and virtual-terminal columns for academic use, all levels and all funding sources. Funding and type shares use raw counts; the per-100 ratio uses counts winsorized at the public-school 99th percentile (486).
- Computers per 100 learners = winsorized academic computers ÷ enrollment × 100; regional figures are sums over sums.
- Equipment shares count schools with at least one unit of each type at any level.
Limits
The ICT file covers public schools only. School heads report the counts, and the counts contain visible entry errors: computers exceed learners in 316 schools. This report winsorizes the counts for ratios and reports raw totals with that caveat. The file does not record whether devices work, how old they are, or how often they are used, and “academic use” is the school’s own classification.
Frequently asked questions
How many computers do DepEd public schools have?
Public schools reported 1,948,140 academic-use computers in SY 2023-2024 (1.54 million after capping entry errors), or 6.6 per 100 learners. The median school has 2.3 per 100, and 24.6% of schools have none.
Who pays for computers in DepEd public schools?
The DepEd Computerization Program funded 49.8% of academic computers. Local governments and the Special Education Fund funded 32.7%, other DepEd funds 13.0%, and all other sources under 4%.
Do computers improve NAT or ELLNA scores in DepEd schools?
Not measurably in these data. Computers per learner show no association with ELLNA, NAT or CRLA results once schools are compared within a division. Internet access does show an association, about +2.6 NAT points for a connected school.
Download the data
The cleaned, harmonized DepEd files behind this series are free to download in CSV and Parquet, with a codebook and checksums, under the terms of use set out in the release. Download Cleaned DepEd School Data, SY 2017-18 to 2025-26 documents every file and column. The files themselves are at data.nash.com.ph, starting with the README, the SY 2023-24 school master file (CSV, 8.0 MB) and the nine-year enrollment panel (Parquet, 17.2 MB).
More in this series
- DepEd Enrollment Trends SY 2017-2018 to SY 2025-2026
- Enrollment by school year: SY 2017-18, SY 2018-19, SY 2019-20, SY 2020-21, SY 2021-22, SY 2022-23, SY 2023-24, SY 2024-25, SY 2025-26
- DepEd Learner Data SY 2023-2024: IP, ALIVE and School Size
- DepEd Teachers and School Personnel Data, SY 2023-2024
- DepEd Classroom and School Building Data, SY 2023-2024
- DepEd WASH Data SY 2023-2024: Toilets, Water, Electricity
- NAT Grade 6 Results SY 2023-2024: DepEd Division Scores
- ELLNA Grade 3 Results SY 2023-2024: DepEd Division Scores
- CRLA Results SY 2025-2026: Reading Levels in Grades 1 to 3
- DepEd School Inputs vs Test Results: Multigrade and Internet
- DepEd Open Data Quality: Errors, Blanks and Coverage Limits
- Download Cleaned DepEd School Data, SY 2017-18 to 2025-26
- The full report: Philippine basic education in numbers
Guides for aspiring school heads
- DepEd Data for Aspiring School Heads: Where to Start
- NASH Practice Questions With Answers: 50 Items on the PPSSH
- How to Read DepEd Data: A Guide for Aspiring School Heads
- EDCOM II Final Report: Guide for Aspiring School Heads
- National Education Plan 2026-2035: Guide for School Heads
- NASH Study Guide: DepEd Memorandum 069, s. 2025 and PPSSH
- PPSSH Domain 1: Leading Strategically With DepEd Data
- PPSSH Domain 2: Managing School Operations With DepEd Data
- PPSSH Domain 3: Teaching and Learning With DepEd Data
- PPSSH Domain 4: Developing Self and Others With DepEd Data
- PPSSH Domain 5: Building Connections With DepEd Data
Analysis and charts by Mark Anthony Llego for NASH Reviewer. Data: Department of Education public datasets. Charts may be reused only with written permission from support@nash.com.ph.