DepEd’s enrollment dataset for SY 2022-2023 covers the year Philippine school enrollment peaked. Enrollment reached 27,794,282 learners, the highest count in the nine years of DepEd’s open enrollment data, and every year since has been lower. Classes opened on August 22, 2022. By November 2, every school had returned to five days of in-person classes. In July 2022, Republic Act No. 11899 had created the Second Congressional Commission on Education (EDCOM II), whose Final Report would describe the system this file records.
The file shows both the levels that were still growing and the levels that had begun to fall. Senior high school was at its largest, 4,179,644 learners, and the private sector was recovering. Junior high was already shrinking, kindergarten had turned down, and public enrollment fell for the first time in the series. The increase over SY 2021-2022 was 233,621 learners, or 0.8%, the smallest growth of any growing year.
Key findings
- Enrollment peaked at 27,794,282 learners in SY 2022-2023. The increase over SY 2021-2022 was 233,621 learners (+0.8%), the smallest growth of any growing year, and every year since has been lower.
- Senior high school reached its largest size, 4,179,644 learners (+9.3%). Junior high lost 331,754 learners (−3.8%), and all four of its grades fell.
- Private enrollment rose 9.7% to 3,627,506, the first private increase since the pandemic. Public enrollment fell by 91,244 (−0.4%), the first public decline in the series.
- Ten regions grew and eight shrank. BARMM grew fastest (+4.6%), and Region IV-A added the most learners (95,235).
- Girls were 48.7% of all learners, the lowest female share in the series. Male enrollment grew 1.4% while female enrollment grew 0.2%.
| Item | SY 2022-23 | SY 2021-22 | Change | Change (%) |
|---|---|---|---|---|
| Schools in the file | 60,137 | 60,429 | -292 | -0.5% |
| Schools reporting enrollment | 60,137 | 60,429 | -292 | -0.5% |
| Total enrollment | 27,794,282 | 27,560,661 | +233,621 | +0.8% |
| Kindergarten | 2,149,891 | 2,181,189 | -31,298 | -1.4% |
| Grades 1 to 6 | 12,964,374 | 12,738,002 | +226,372 | +1.8% |
| Elementary non-graded | 74,170 | 58,800 | +15,370 | +26.1% |
| Elementary (K to 6 and non-graded) | 15,188,435 | 14,977,991 | +210,444 | +1.4% |
| Junior high school (Grades 7 to 10 and non-graded) | 8,426,203 | 8,757,957 | -331,754 | -3.8% |
| Senior high school (Grades 11 and 12) | 4,179,644 | 3,824,713 | +354,931 | +9.3% |
| Female learners | 13,549,306 | 13,519,031 | +30,275 | +0.2% |
| Male learners | 14,244,976 | 14,041,630 | +203,346 | +1.4% |
| Female share of learners | 48.7% | 49.1% | -0.30 points |
Enrollment by grade: senior high grew, junior high fell
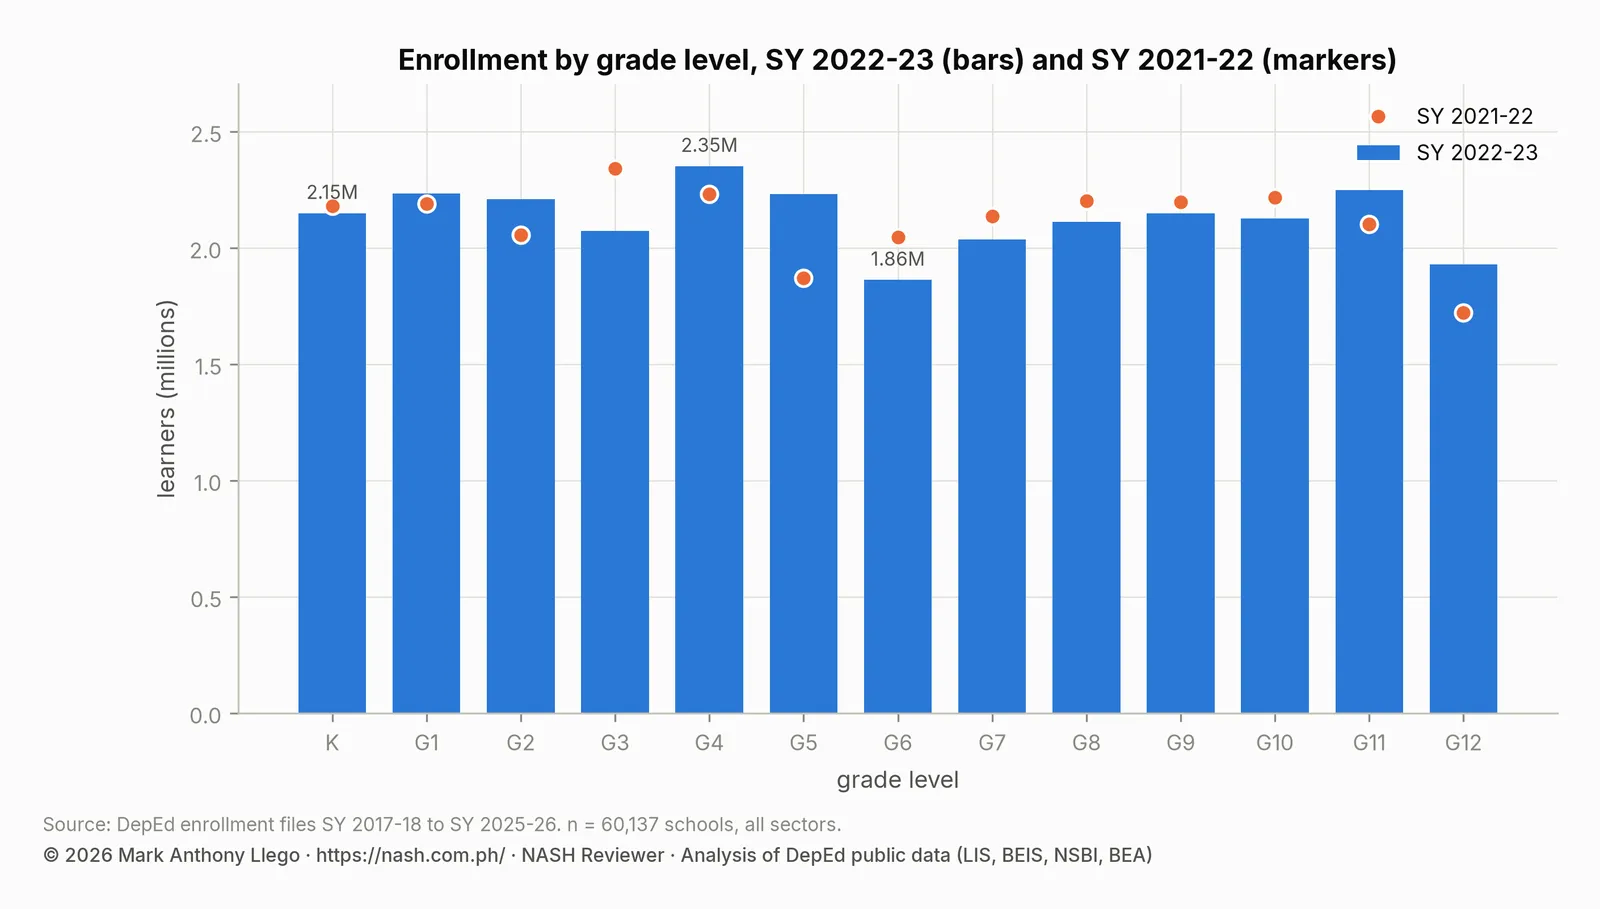
Senior high added 354,931 learners (+9.3%). Grade 12 grew 12.1% to 1,929,559 as the large returnee class of SY 2021-2022 moved up. Grade 11 grew 7.0% to 2,250,085, which made it the second-largest grade in the system, behind only Grade 4. Three years earlier, Grade 11 had been the second smallest. The flow from Grade 10 to Grade 11, this year’s Grade 11 divided by last year’s Grade 10, was still above one, at 1.015. Learners were still returning to senior high a year after the main rebound.
| Grade | Learners | Share of total | SY 2021-22 | Change | Change (%) |
|---|---|---|---|---|---|
| Kindergarten | 2,149,891 | 7.7% | 2,181,189 | -31,298 | -1.4% |
| Grade 1 | 2,235,544 | 8.0% | 2,190,067 | +45,477 | +2.1% |
| Grade 2 | 2,209,138 | 7.9% | 2,057,355 | +151,783 | +7.4% |
| Grade 3 | 2,073,187 | 7.5% | 2,341,058 | -267,871 | -11.4% |
| Grade 4 | 2,352,218 | 8.5% | 2,232,977 | +119,241 | +5.3% |
| Grade 5 | 2,231,378 | 8.0% | 1,869,837 | +361,541 | +19.3% |
| Grade 6 | 1,862,909 | 6.7% | 2,046,708 | -183,799 | -9.0% |
| Grade 7 | 2,037,475 | 7.3% | 2,137,995 | -100,520 | -4.7% |
| Grade 8 | 2,111,293 | 7.6% | 2,202,920 | -91,627 | -4.2% |
| Grade 9 | 2,148,230 | 7.7% | 2,198,737 | -50,507 | -2.3% |
| Grade 10 | 2,126,086 | 7.6% | 2,216,270 | -90,184 | -4.1% |
| Grade 11 | 2,250,085 | 8.1% | 2,102,702 | +147,383 | +7.0% |
| Grade 12 | 1,929,559 | 6.9% | 1,722,011 | +207,548 | +12.1% |
Junior high lost 331,754 learners (−3.8%), and all four of its grades fell: Grade 7 by 4.7%, Grade 8 by 4.2%, Grade 9 by 2.3% and Grade 10 by 4.1%. The large returnee cohorts had moved up into senior high, and the cohorts behind them were smaller. Elementary grew 1.4%, almost all of it in Grades 4 and 5, which received the large cohorts. Kindergarten fell 1.4% to 2,149,891, and it has fallen in every year since but one.
Grade 6: the small cohort of SY 2017-2018 reaches the end of elementary
Grade 6 held 1,862,909 learners, 9.0% fewer than the year before and the smallest Grade 6 in the series. This is the cohort first seen in the SY 2017-2018 report, when it was a Grade 1 class smaller than every grade above it. Five years later, it was still the smallest cohort in the elementary system, and it had lost a further 64,000 learners on the way. Elementary schools had taught it through all six grades with fewer sections than the cohorts before and after it needed. From SY 2023-2024, junior high schools would receive it: the next report shows Grade 7 falling 11% as this cohort arrived.
Public and private school enrollment: private recovers, public falls
| Sector | Schools | Learners | Share of learners | Kindergarten | Elementary (K to 6) | Junior high | Senior high | Schools, SY 2021-22 | Learners, SY 2021-22 | Change (%) |
|---|---|---|---|---|---|---|---|---|---|---|
| Public | 47,678 | 24,036,251 | 86.5% | 1,954,052 | 14,069,177 | 7,245,957 | 2,721,117 | 47,553 | 24,127,495 | -0.4% |
| Private | 12,212 | 3,627,506 | 13.1% | 193,122 | 1,096,540 | 1,124,651 | 1,406,315 | 12,624 | 3,307,342 | +9.7% |
| SUC/LUC laboratory schools | 215 | 109,314 | 0.4% | 1,012 | 10,019 | 48,912 | 50,383 | 220 | 107,912 | +1.3% |
| Philippine Schools Overseas | 32 | 21,211 | 0.1% | 1,705 | 12,699 | 6,683 | 1,829 | 32 | 17,912 | +18.4% |
Private enrollment rose by 320,164 (+9.7%) to 3,627,506, the first private increase since the pandemic. The recovery began at the youngest ages, where the pandemic loss had been concentrated. Private kindergarten grew 41.7%, from 136,251 to 193,122, and private elementary including kindergarten grew 18.8%. Private senior high grew 14.5%. The private share of all learners rose from 12.0% to 13.1%, and the private share of senior high rose from 32.1% to 33.6%.
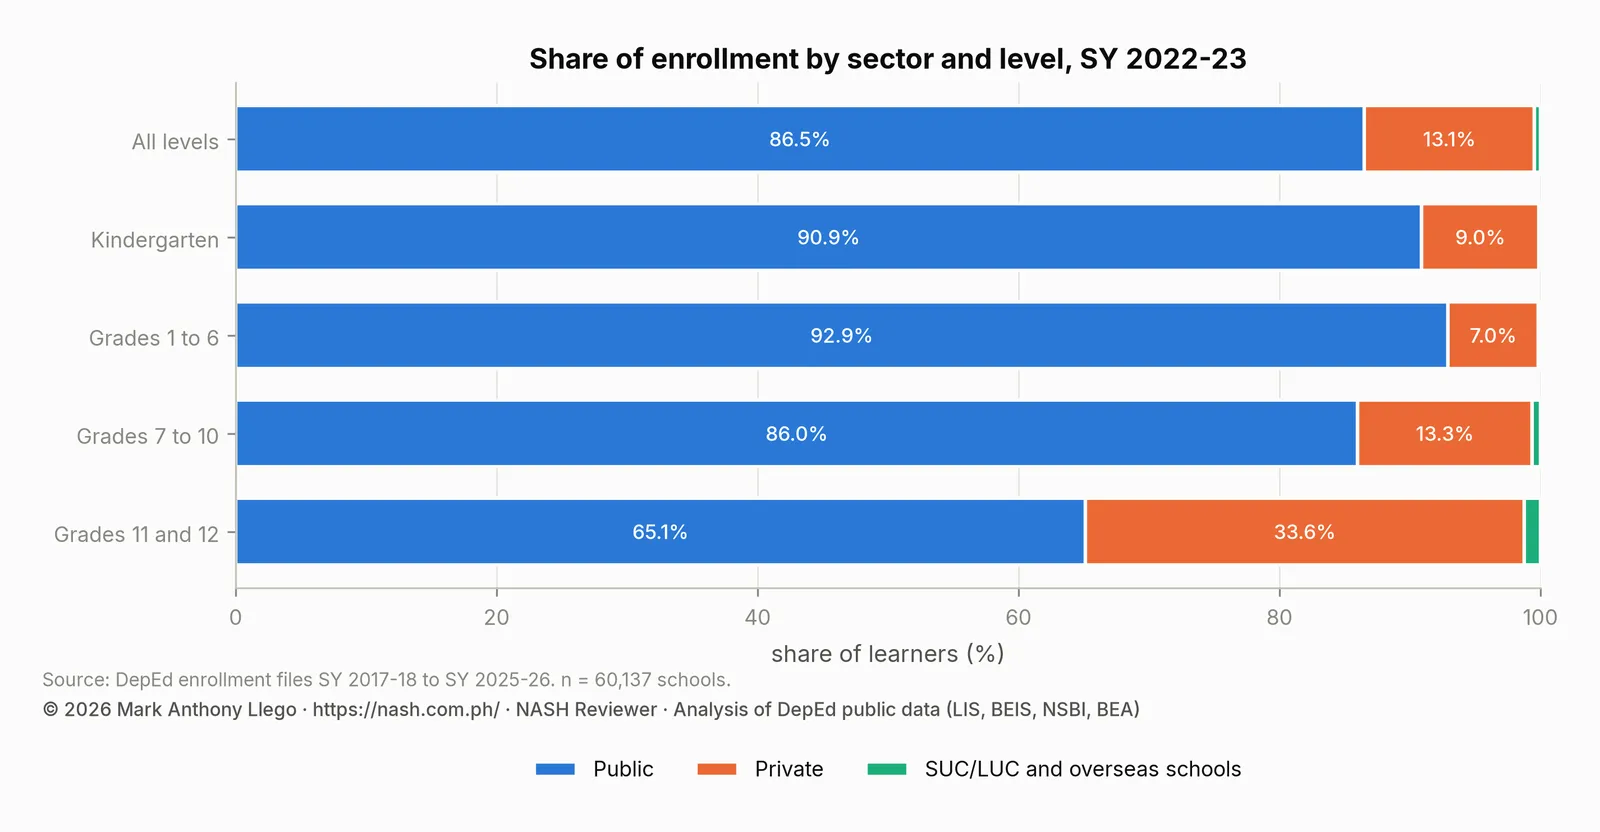
Public enrollment fell by 91,244 (−0.4%) to 24,036,251. It was the first public decline in the series, and public enrollment has fallen every year since. The SY 2021-2022 public total of 24.13 million is the peak for public schools, one year before the peak of the whole system. Total enrollment still rose in SY 2022-2023 because the private sector’s gain was larger than the public sector’s loss. The number of private schools kept falling, to 12,212, even as private enrollment rose. Private schools were fewer and larger, with a median of 109 learners, back to the pre-pandemic size.
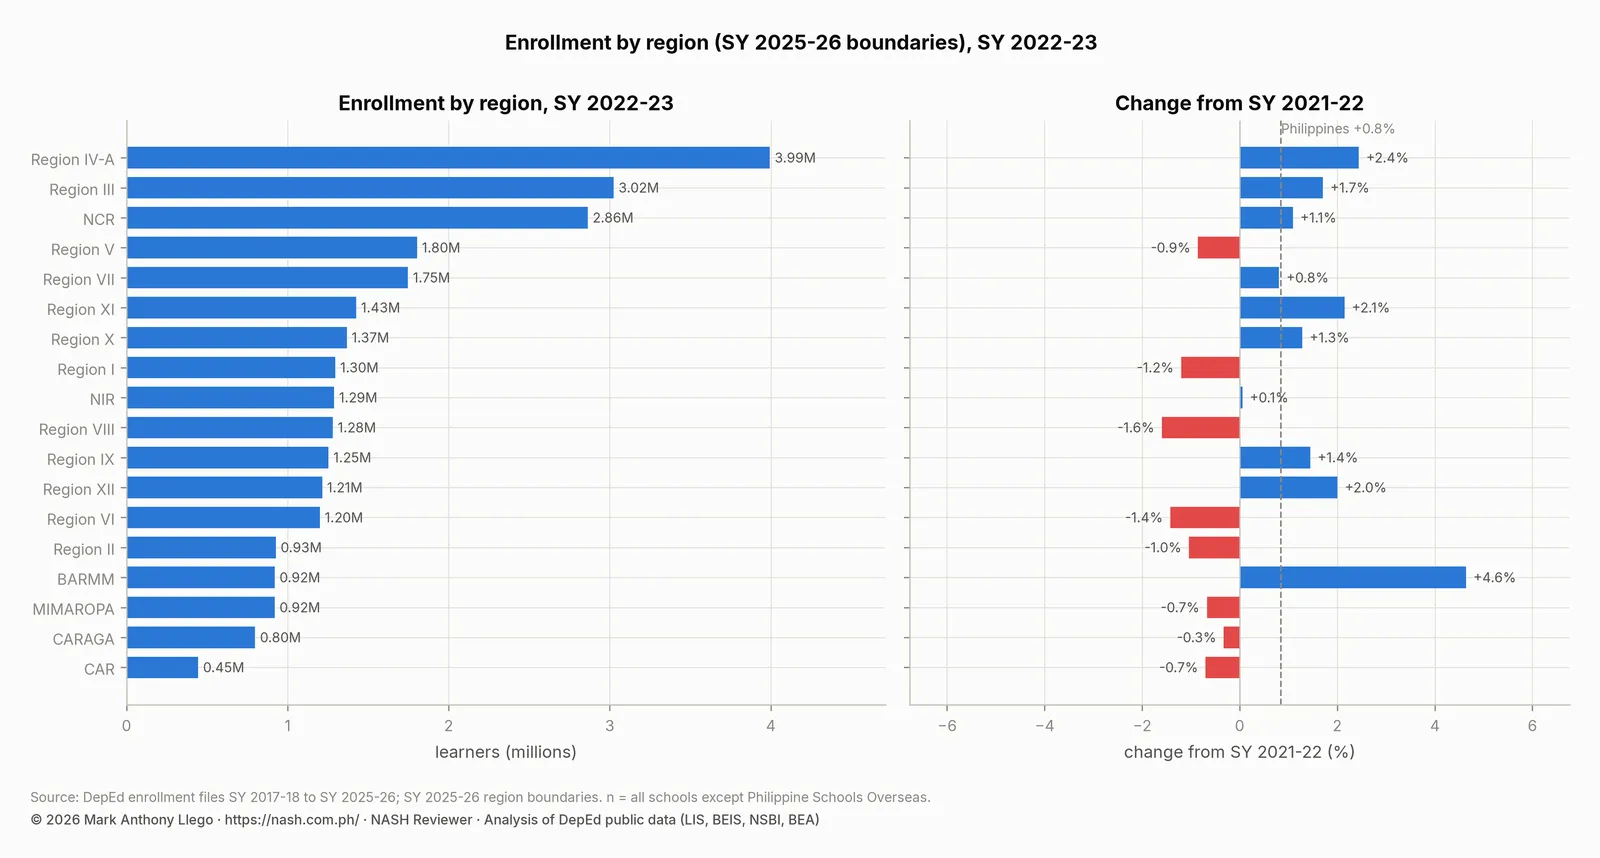
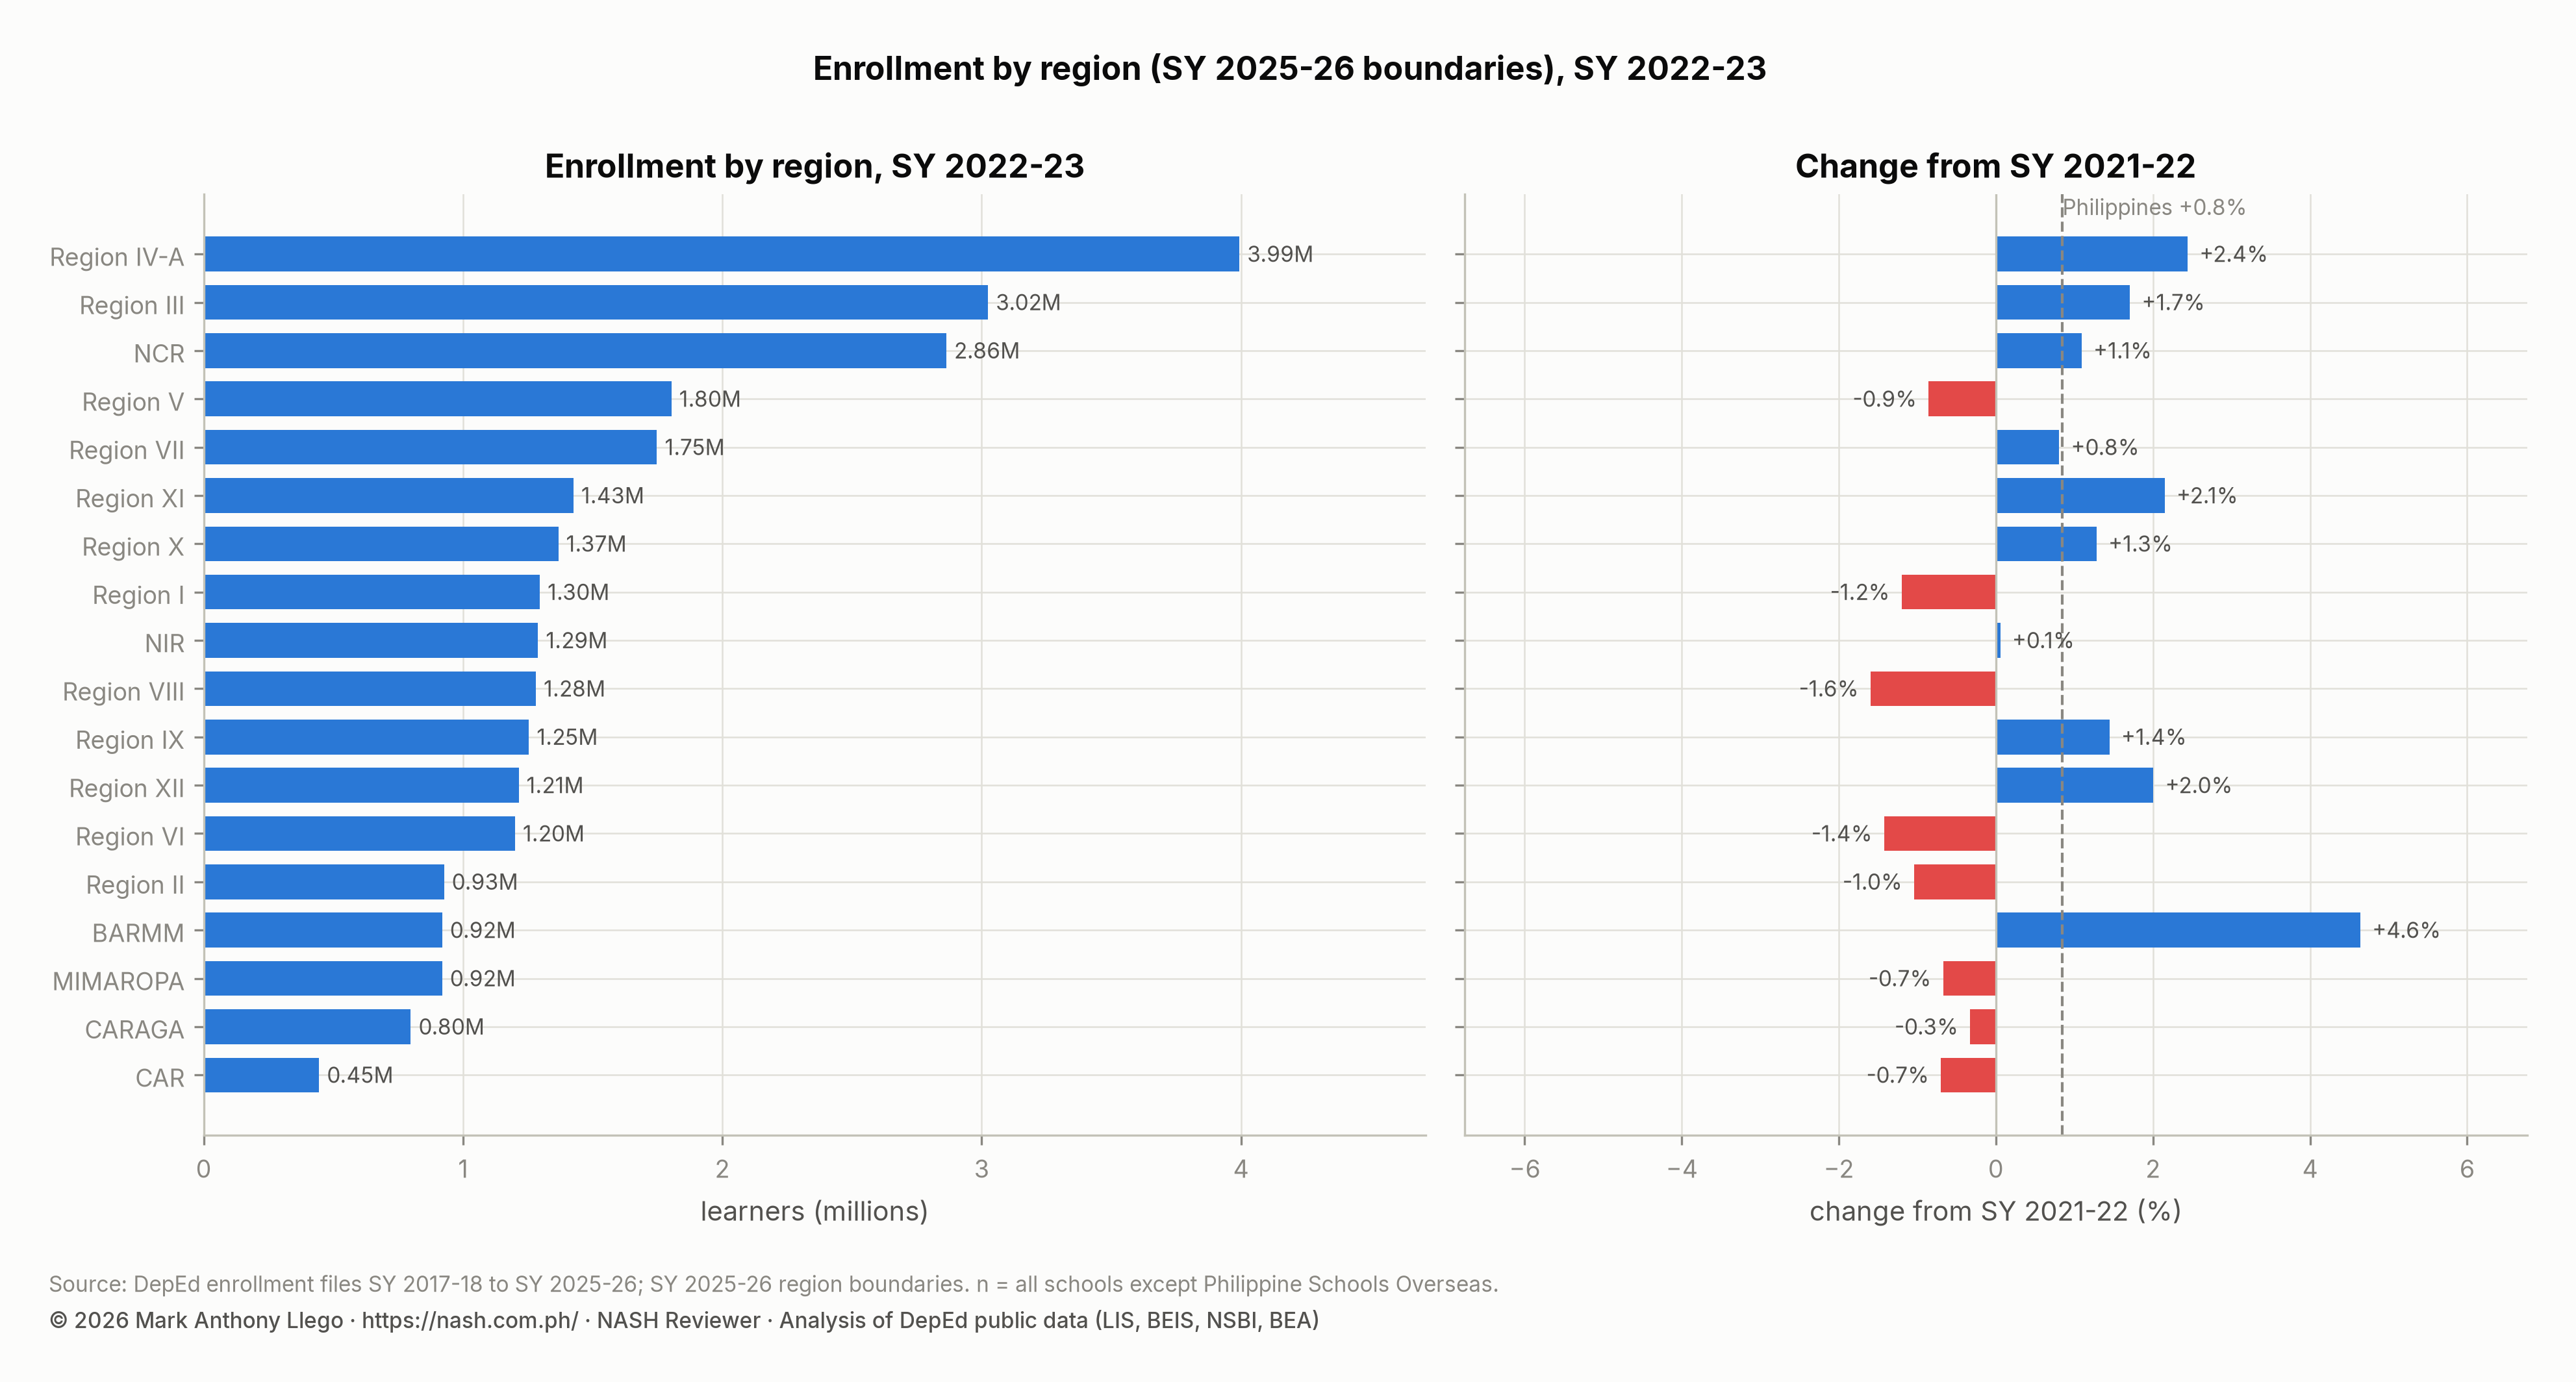
Enrollment by region: BARMM and CALABARZON grow, eight regions shrink
| Region (SY 2025-26 boundaries) | Schools | Learners | Share of learners | SY 2021-22 | Change | Change (%) | Private share | Senior high share | Female share |
|---|---|---|---|---|---|---|---|---|---|
| Region IV-A | 6,031 | 3,994,312 | 14.4% | 3,899,077 | +95,235 | +2.4% | 17.9% | 14.5% | 48.7% |
| Region III | 5,184 | 3,024,831 | 10.9% | 2,974,068 | +50,763 | +1.7% | 15.3% | 15.0% | 48.6% |
| NCR | 2,765 | 2,864,029 | 10.3% | 2,833,110 | +30,919 | +1.1% | 24.1% | 16.4% | 49.2% |
| Region V | 4,452 | 1,803,644 | 6.5% | 1,819,218 | -15,574 | -0.9% | 8.3% | 15.8% | 48.4% |
| Region VII | 3,531 | 1,747,928 | 6.3% | 1,733,956 | +13,972 | +0.8% | 14.1% | 16.3% | 48.4% |
| Region XI | 2,697 | 1,425,893 | 5.1% | 1,395,893 | +30,000 | +2.1% | 11.3% | 15.3% | 48.9% |
| Region X | 3,104 | 1,367,333 | 4.9% | 1,350,026 | +17,307 | +1.3% | 12.0% | 14.4% | 49.0% |
| Region I | 3,401 | 1,296,195 | 4.7% | 1,311,942 | -15,747 | -1.2% | 10.6% | 16.4% | 48.1% |
| NIR | 2,712 | 1,289,180 | 4.6% | 1,288,455 | +725 | +0.1% | 9.2% | 15.0% | 48.7% |
| Region VIII | 4,471 | 1,281,005 | 4.6% | 1,301,782 | -20,777 | -1.6% | 5.6% | 15.2% | 48.4% |
| Region IX | 3,313 | 1,254,073 | 4.5% | 1,236,203 | +17,870 | +1.4% | 7.4% | 14.0% | 49.3% |
| Region XII | 2,520 | 1,214,498 | 4.4% | 1,190,617 | +23,881 | +2.0% | 9.2% | 14.4% | 49.0% |
| Region VI | 3,433 | 1,200,467 | 4.3% | 1,217,790 | -17,323 | -1.4% | 8.8% | 16.9% | 47.8% |
| Region II | 2,912 | 926,788 | 3.3% | 936,533 | -9,745 | -1.0% | 9.7% | 15.0% | 48.5% |
| BARMM | 2,456 | 919,674 | 3.3% | 878,880 | +40,794 | +4.6% | 11.2% | 8.6% | 51.3% |
| MIMAROPA | 2,681 | 919,612 | 3.3% | 925,831 | -6,219 | -0.7% | 7.2% | 14.4% | 48.7% |
| CARAGA | 2,356 | 798,540 | 2.9% | 801,163 | -2,623 | -0.3% | 8.5% | 14.5% | 48.5% |
| CAR | 2,086 | 445,069 | 1.6% | 448,205 | -3,136 | -0.7% | 15.8% | 16.0% | 48.5% |
BARMM grew 4.6%, the fastest rate of any region. Region IV-A added 95,235 learners (+2.4%), the largest gain. Region XI grew 2.1%, Region XII 2.0% and Region III 1.7%. NCR grew 1.1% and was still 52,000 learners below its SY 2019-2020 count. Eight regions shrank: Region VIII (−1.6%), Region VI (−1.4%), Region I (−1.2%), Region II (−1.0%), Region V, CAR, MIMAROPA and CARAGA. These eight are the regions that the nine-year trends report identifies as shrinking over the whole series. Each of them had already passed its own peak when the national total peaked.
Four of the five fastest-growing divisions were in Mindanao’s Muslim-majority areas: Marawi City (+10.8%), Maguindanao I (+9.7%), Maguindanao II (+9.4%) and Sulu (+8.0%). The fifth, General Trias City (+8.9%), is in Luzon. The steepest declines were in NCR and Region I: the City of San Juan (−6.6%), Makati City (−5.4%) and Vigan City (−5.4%). Lanao del Sur - I and Southern Leyte followed.
| Division | Region | Schools | Learners, SY 2022-23 | Learners, SY 2021-22 | Change | Change (%) | |
|---|---|---|---|---|---|---|---|
| Fastest growth | Marawi City | BARMM | 105 | 54,232 | 48,940 | +5,292 | +10.8% |
| Fastest growth | Maguindanao I | BARMM | 380 | 166,471 | 151,786 | +14,685 | +9.7% |
| Fastest growth | Maguindanao II | BARMM | 338 | 135,884 | 124,226 | +11,658 | +9.4% |
| Fastest growth | General Trias City | Region IV-A | 106 | 99,301 | 91,223 | +8,078 | +8.9% |
| Fastest growth | Sulu | Region IX | 469 | 166,353 | 153,967 | +12,386 | +8.0% |
| Steepest decline | City of San Juan | NCR | 37 | 21,813 | 23,345 | -1,532 | -6.6% |
| Steepest decline | Makati City | NCR | 118 | 96,828 | 102,398 | -5,570 | -5.4% |
| Steepest decline | Vigan City | Region I | 35 | 18,560 | 19,612 | -1,052 | -5.4% |
| Steepest decline | Lanao del Sur - I | BARMM | 455 | 146,649 | 153,633 | -6,984 | -4.5% |
| Steepest decline | Southern Leyte | Region VIII | 377 | 87,121 | 90,437 | -3,316 | -3.7% |
Two divisions appear in the file for the first time. San Pedro City (73,353 learners) was separated from Laguna, so Laguna’s enrollment fell 20.1%. This was the second time in five years that Laguna lost a new division, after Cabuyao City in SY 2018-2019. Victorias City (26,891 learners) was separated from Negros Occidental, whose enrollment fell 7.9%. Both parent divisions are left out of the ranking.
Enrollment by sex: boys outnumber girls more than in any other year
Girls were 48.7% of all learners, the lowest female share in the series. In senior high, the female share fell from 52.5% to 50.9%, and in junior high it fell to 49.0%. The reason is the same as in the previous year. Male enrollment grew 1.4% while female enrollment grew 0.2%, so the learners still returning after the pandemic were mostly boys. Senior high’s female majority, 52.9% in SY 2017-2018, had nearly disappeared.
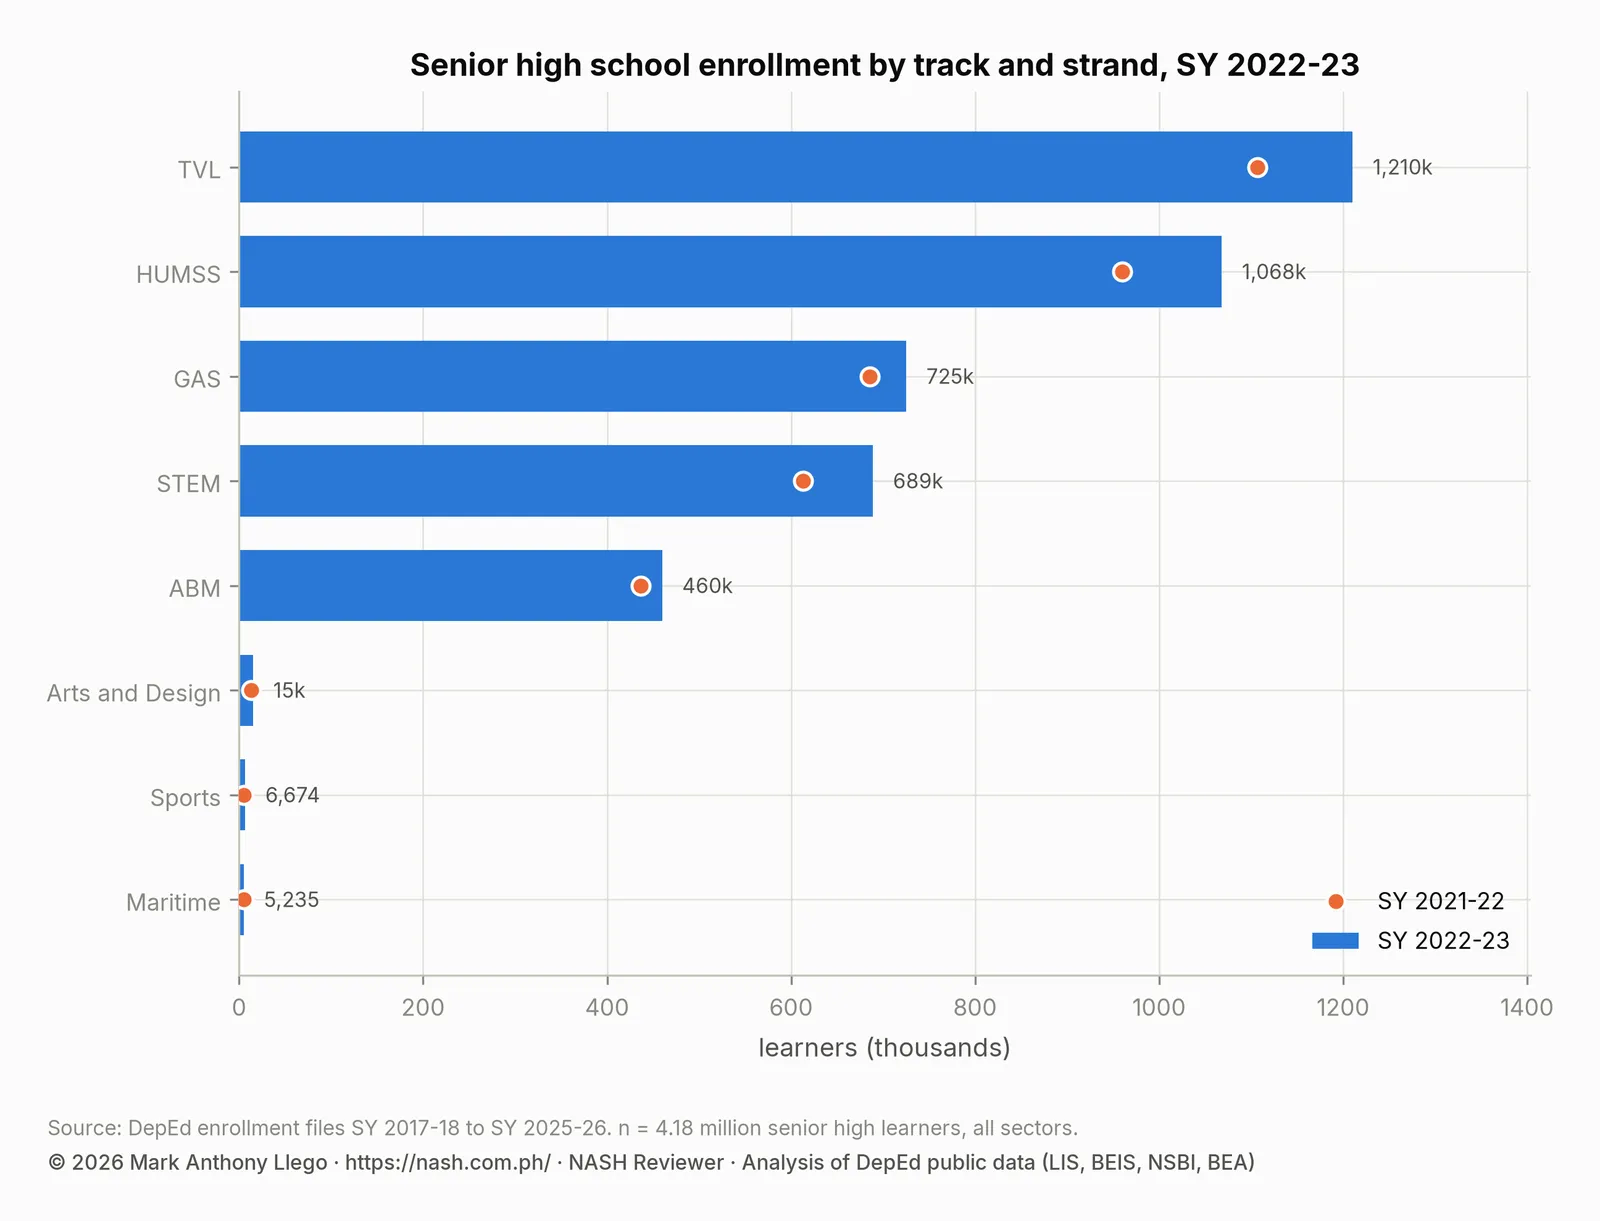
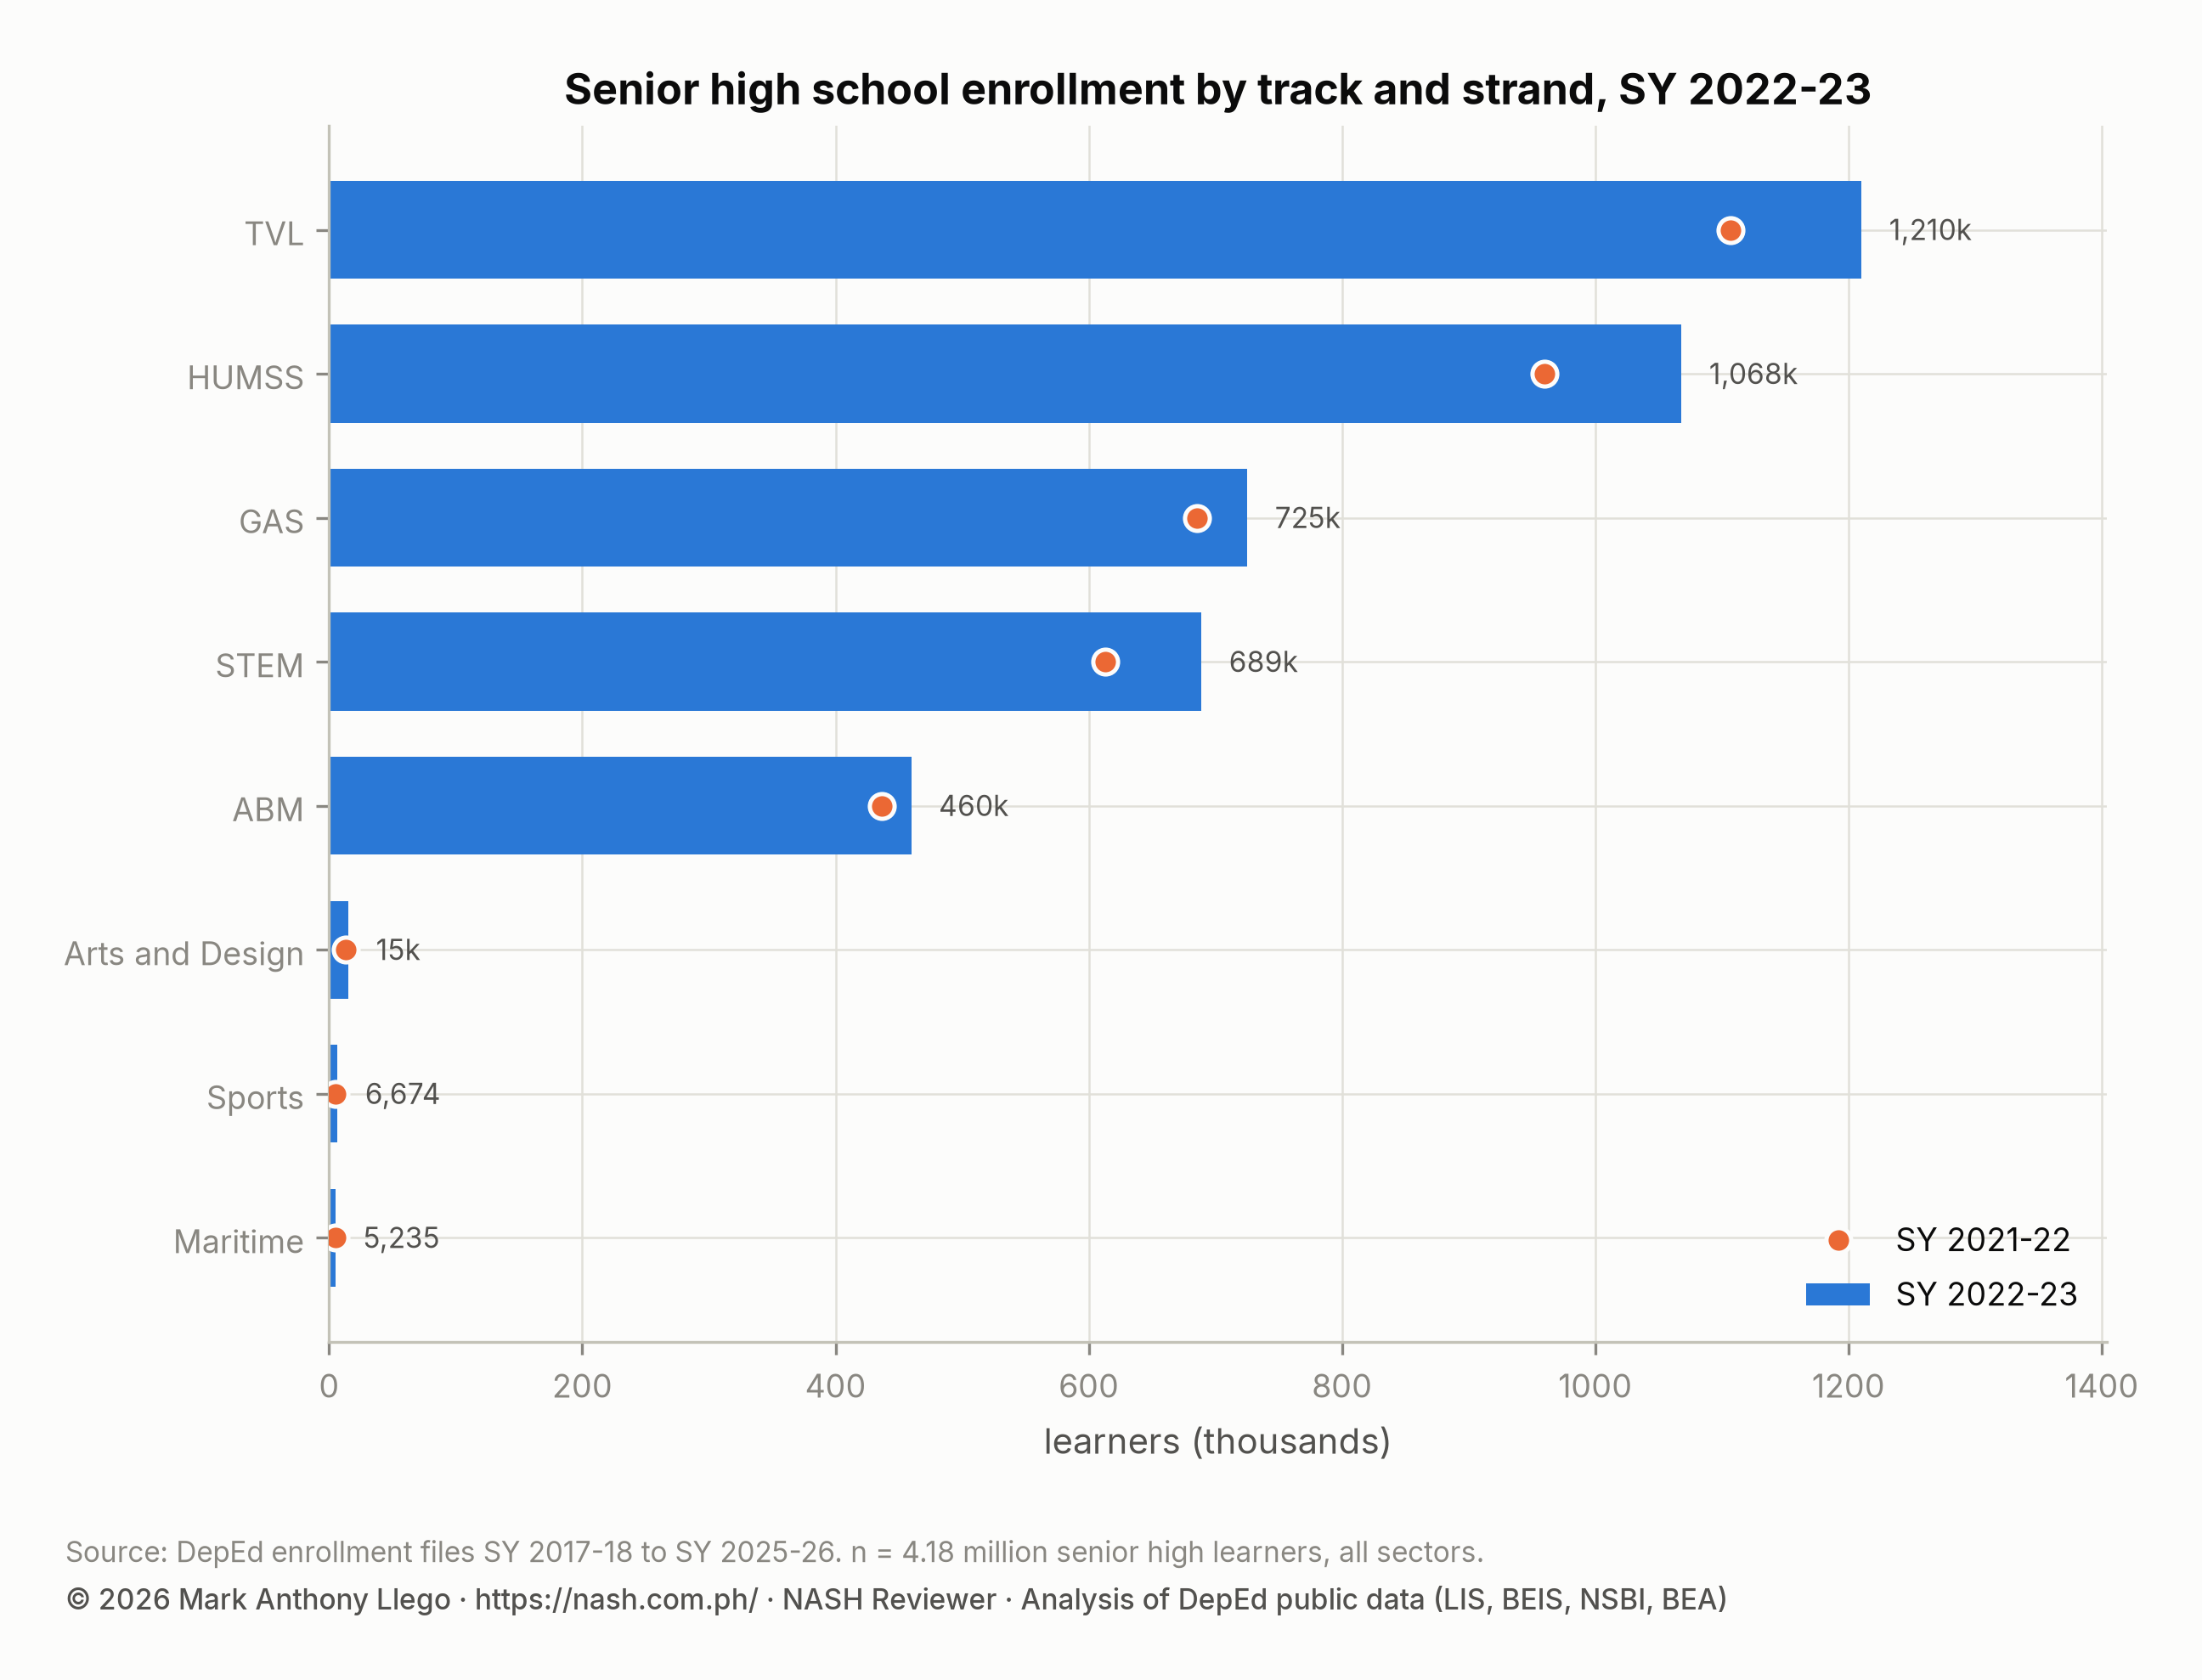
Senior high school strands: all five major strands grew
| Track or strand | Learners | Share of senior high | SY 2021-22 | Change | Change (%) |
|---|---|---|---|---|---|
| TVL | 1,210,330 | 29.0% | 1,106,646 | +103,684 | +9.4% |
| HUMSS | 1,068,169 | 25.6% | 959,863 | +108,306 | +11.3% |
| GAS | 725,231 | 17.4% | 685,462 | +39,769 | +5.8% |
| STEM | 688,983 | 16.5% | 612,857 | +76,126 | +12.4% |
| ABM | 459,753 | 11.0% | 436,409 | +23,344 | +5.3% |
| Arts and Design | 15,269 | 0.4% | 13,264 | +2,005 | +15.1% |
| Sports | 6,674 | 0.2% | 4,962 | +1,712 | +34.5% |
| Maritime | 5,235 | 0.1% | 5,250 | -15 | -0.3% |
Humanities and Social Sciences (HUMSS) passed one million learners, at 1,068,169 (+11.3%). Science, Technology, Engineering and Mathematics (STEM) grew fastest of the major strands, 12.4% to 688,983. Technical-Vocational-Livelihood (TVL) grew 9.4% to 1,210,330, its highest count in the series, but its 29.0% share of senior high was unchanged. HUMSS was now within 142,000 learners of TVL. The General Academic Strand (GAS) grew 5.8%, and Accountancy, Business and Management (ABM) grew 5.3%.
School size: a third of learners in 4% of schools
| Learners per school | Schools | Share of schools | Learners | Share of learners | Public schools | Share of public schools | Private schools | Share of private schools |
|---|---|---|---|---|---|---|---|---|
| 1–50 | 6,151 | 10.2% | 166,167 | 0.6% | 2,486 | 5.2% | 3,643 | 29.8% |
| 51–100 | 7,899 | 13.1% | 599,979 | 2.2% | 5,709 | 12.0% | 2,172 | 17.8% |
| 101–200 | 14,588 | 24.3% | 2,148,186 | 7.7% | 12,365 | 25.9% | 2,177 | 17.8% |
| 201–500 | 17,692 | 29.4% | 5,632,474 | 20.3% | 15,341 | 32.2% | 2,288 | 18.7% |
| 501–1,000 | 7,500 | 12.5% | 5,225,303 | 18.8% | 6,304 | 13.2% | 1,130 | 9.3% |
| 1,001–2,000 | 3,893 | 6.5% | 5,410,316 | 19.5% | 3,324 | 7.0% | 546 | 4.5% |
| over 2,000 | 2,414 | 4.0% | 8,611,857 | 31.0% | 2,149 | 4.5% | 256 | 2.1% |
The 2,414 schools with more than 2,000 learners were 4.0% of all schools. They held 31.0% of all learners, or 8.6 million, the highest concentration in the series. Of those large schools, 2,149 were public. At the other end of the range, 6,151 schools had 50 learners or fewer, the fewest in the series. The small private schools that closed in the pandemic did not reopen. The file lists 60,137 schools, 292 fewer than the year before, and 153 of them with zero learners. New this year were 329 public and 226 private schools. Another 394 private schools present this year are absent from the SY 2023-2024 file.
Notes on reading the SY 2022-2023 file
- The file’s structure is unchanged from the two previous years. It is the last to use the management label “Local Government”, for 106 schools.
- Regions are on SY 2025-2026 boundaries: Sulu’s 469 schools are counted under Region IX, and the Negros divisions under NIR. The file itself already lists Cotabato City and the Special Geographic Area under BARMM.
- Laguna and Negros Occidental are left out of the division ranking because new divisions were separated from them this year.
- Enrollment is a beginning-of-year count and does not show the return to in-person classes during the year.
Frequently asked questions
Was SY 2022-2023 the peak of DepEd enrollment in the Philippines?
Yes, within DepEd’s open data from SY 2017-2018 onward. Enrollment was 27,794,282 in SY 2022-2023. It fell to 27,081,292 in SY 2023-2024, 26,400,182 in SY 2024-2025 and 25,935,863 in SY 2025-2026.
Why did public school enrollment fall in SY 2022-2023 while total enrollment rose?
Public schools lost 91,244 learners while private schools regained 320,164 as families returned to them after the pandemic. Public enrollment had peaked a year earlier, at 24,127,495.
Which grade levels grew and which shrank in SY 2022-2023?
Senior high grew 9.3% to its peak of 4,179,644 learners, and elementary grew 1.4%. Junior high fell 3.8% as the returnee cohort moved up and smaller cohorts followed, and kindergarten fell 1.4%.
Download the data
The cleaned, harmonized DepEd files behind this series are free to download in CSV and Parquet, with a codebook and checksums, under the terms of use set out in the release. Download Cleaned DepEd School Data, SY 2017-18 to 2025-26 documents every file and column. The files themselves are at data.nash.com.ph, starting with the README, the SY 2023-24 school master file (CSV, 8.0 MB) and the nine-year enrollment panel (Parquet, 17.2 MB).
More in this series
- Previous year: DepEd Enrollment SY 2021-2022: Rebound to 27.6 Million
- Next year: DepEd Enrollment SY 2023-2024: The Decline Begins
- The nine-year overview: DepEd Enrollment Trends SY 2017-2018 to SY 2025-2026
- All nine annual reports: SY 2017-18, SY 2018-19, SY 2019-20, SY 2020-21, SY 2021-22, SY 2022-23, SY 2023-24, SY 2024-25, SY 2025-26
- DepEd Data for Aspiring School Heads: Where to Start
- For aspiring school heads: How to Read DepEd Data and the full report, Philippine basic education in numbers
Analysis and charts by Mark Anthony Llego for NASH Reviewer. Data: Department of Education enrollment datasets for SY 2021-22 and SY 2022-23 (Learner Information System). Charts may be reused only with written permission from support@nash.com.ph.