This guide shows aspiring school heads how to read DepEd data: the public school-level files on enrollment, personnel, facilities, and test results released under Project BUKAS since September 2025. It covers units, denominators, coverage, ratios such as the 25.5 national pupil-teacher ratio, test means and their margins of error, charts, and the decisions that follow.
The examples come from DepEd’s own public datasets. The first is nine years of enrollment, and the second is the SY 2023-24 learner, personnel, facilities, information and communication technology (ICT), and water, sanitation, and hygiene (WASH) files. The third is the National Achievement Test (NAT), Early Language, Literacy, and Numeracy Assessment (ELLNA), and Comprehensive Rapid Literacy Assessment (CRLA) results released for five regions. Every example is a real number from those files, computed in the data reports in this series.
A school head reads numbers every week. They include an enrollment return, a pupil-teacher ratio on a division memo, a CRLA profile from the Grade 1 teacher, a NAT mean on a results sheet, and a building condition line in the school building inventory. Since September 2025, under Project BUKAS, the same numbers for every public school are public.
The Philippine Professional Standards for School Heads (PPSSH) expects an aspiring school head to be able to read them. Its indicators ask a school head to “identify relevant research findings from reliable sources” (indicator 1.4.1) and to know “monitoring and evaluation processes and tools” (1.7.1). They ask a school head to manage “school data and information using technology” (2.1.1). And they ask a school head to “set achievable and challenging learning outcomes” (3.4.1) and to understand “learning assessment tools, strategies and utilization of results” (3.5.1).
The guide starts with the questions to ask before reading any number. It then moves through counts, shares, ratios, condition data, and test results, to associations, charts, and the decisions a school head makes with them. It ends with a worked example, exercises with model answers, and a glossary. It is long because the subject is; the contents list on the page lets you go directly to the part you need.
Key points
- Every number has a unit, a denominator, a coverage, a date, and a rule for blanks. Ask the five questions first. Most misreadings of DepEd data are a wrong answer to one of them.
- A ratio has three versions, and DepEd uses the aggregate. The national pupil-teacher ratio is 25.5 (all learners over all teachers), and the median school’s ratio is 22.7. A region’s ratio is computed over all its schools together. Know which one a memo quotes before comparing your school with it.
- A school’s test mean has a margin of error that depends on how many learners were tested. A Grade 6 NAT mean from six test-takers, the median, carries a 95% margin of about ±6 points. From 24 learners, the margin is ±3. Rankings of raw school means are wrong about one school in five at the bottom.
- Shares of schools and shares of learners are different numbers. Internet reaches 78% of public schools and 90% of learners. Schools with more than 1,000 learners are 11% of schools and hold 51% of learners.
- An association in school data is not an effect. Within a division, multigrade schools score about four points lower, and connected schools score about 2.6 points higher. The files measure neither poverty nor teaching, and the division a school is in explains more than any input.
- Reading ends in a decision. The guide closes with the twelve-item data pack to pull for any school, a one-page situational analysis, and the rules for telling parents and the division what the numbers can and cannot say.
Part 1. The DepEd data a school head will meet
The DepEd files
DepEd’s proactive-release datasets are one CSV file per topic and year, each with a README. Two technical notes, from the Policy and Planning Service and the Bureau of Education Assessment, define the indicators and the proficiency bands.
| File | Source system | One row is | Years released | What it holds | Who is covered |
|---|---|---|---|---|---|
| Enrollment | Learner Information System (LIS) | a school | SY 2017-18 to SY 2025-26 | learners by grade and sex, sector, management, annex status, geography | all sectors (public, private, SUC/LUC, overseas) |
| Learner data | LIS and BEIS | a school | SY 2023-24 | the enrollment columns plus IP, ALIVE, Balik-Aral, alternative delivery and multigrade counts | all sectors for enrollment; learner types for public schools |
| Personnel | Enhanced BEIS | a school | SY 2023-24 | nationally funded positions by title (Teacher I to Master Teacher IV, principals, head teachers, support staff), locally funded teachers by funding source | public schools only |
| Facilities | National School Building Inventory (NSBI) | a school | SY 2023-24 | buildings by condition, instructional rooms, makeshift rooms, temporary learning spaces, amenities, access | public schools only |
| ICT | BEIS | a school | SY 2023-24 | academic and administrative computers by type and funding source, equipment, internet | public schools only |
| WASH and utilities | BEIS | a school | SY 2023-24 | toilet bowls (functional and not), handwashing facilities, soap, water, electricity, internet by level | public schools only |
| NAT Grade 6 | Bureau of Education Assessment (BEA) | a school | SY 2023-24 | mean percentage score overall and by subject, number of test-takers | a selected set of schools in five regions |
| ELLNA Grade 3 | BEA | a school | SY 2023-24 | mean percentage score overall and by component, test-takers, language of instruction | the same selected set |
| CRLA Grades 1 to 3 | BEA | a school | SY 2025-26 | counts of learners at each of five reading levels, by grade and language | the same selected set |
Three facts about this table decide what any reading can claim. First, every row is a school. Nothing in the public files describes an individual learner or teacher, so a school’s mean is the smallest unit available.
Second, the five SY 2023-24 school files hold rows for all 60,167 schools, but the personnel, facilities, ICT, and WASH columns are filled for public schools only. The 12,349 private, state-university, and overseas rows are blank by design.
Third, the three assessment files cover CAR, Region I, Region III, Region VIII, and Region IX. They cover 44 of those regions’ 63 divisions and about half of the public schools inside those divisions, chosen by a rule DepEd has not published. These are the regions of Project BUKAS’s first rollout. An assessment finding from these files is a finding about the assessed schools in the covered divisions, not about the Philippines. Education Data, Transparency and Research covers what EDCOM II found about DepEd’s data systems and its view of Project BUKAS.
Opening a file
The enrollment files have 60,000 to 67,000 rows and about 80 columns. The SY 2023-24 school files have 60,167 rows and between 87 (facilities) and 594 (ICT) columns. A spreadsheet opens them, with three precautions. Keep the six-digit school ID as text, or a leading zero will be lost and the join to another file will fail. Expect the SY 2025-26 enrollment file to contain two text encodings; 1,892 of its lines are in Windows-1252 inside a UTF-8 file. This appears as garbled characters in school names until the file is re-saved. And read the README before the columns; it states which columns are counts, which are flags, and which did not exist in earlier years.
For anything beyond one school, a pivot table or a short script is safer than formulas across 60,000 rows. The data quality audit in this series lists every check that was run on these files and what it found.
Part 2. Five questions to ask before reading any number
What is the unit?
The unit may be a count of learners, schools, positions, buildings, rooms, or toilet bowls, or a mean score, or a proportion. The first misreading is mixing them. “Thirty percent of buildings are in good condition” is not “thirty percent of schools have good buildings”. The national split of 30% good, 31% minor repair, 29% major repair, 7% for condemnation, and 2% for demolition is a share of the 327,759 public school buildings. A school with three buildings can have one in each state.
What is the denominator?
Every share and ratio divides by something, and that something is a choice. The national pupil-teacher ratio of 25.5 is all public-school learners over all public-school teachers. The personnel file’s 7.6% master-teacher share divides master teachers by all nationally funded teaching positions. The CRLA’s “share at grade level” divides learners at that level by test-takers. The file’s percent columns are proportions from 0 to 1, even though the README calls them percentages. When a figure looks wrong, check the denominator first.
Who is covered?
The enrollment files cover every sector. The school modules cover public schools. The assessment files cover a selected set in five regions. Inside the covered divisions, the ELLNA reaches a median of 56% of public schools with Grade 3 learners, from 5% in some divisions to 100% in others. A statement that “Grade 3 learners in Region VIII average 69.9” means the test-takers in the assessed schools of the 44 covered divisions.
The public files allow one check on what the selection did. Across the covered divisions, assessed and unassessed schools differ by at most a quarter of a standard deviation on any input. Assessed schools are a little larger (290 against 233 elementary learners on average) and have a smaller share of Indigenous Peoples (IP) learners (14.7% against 22.7%). That is reassuring but not proof; the outcomes of the unassessed schools are unknown.
| Indicator | Assessed schools (mean) | Not assessed (mean) | Standardized difference |
|---|---|---|---|
| elementary enrollment | 289.81 | 232.97 | 0.17 |
| elementary PTR | 21.68 | 20.59 | 0.15 |
| elementary PCR | 27.29 | 24.86 | 0.14 |
| elementary LTR | 24 | 21.6 | 0.09 |
| computers per 100 | 6.12 | 7.31 | -0.08 |
| multigrade share | 0.15 | 0.16 | -0.05 |
| IP share | 0.15 | 0.23 | -0.23 |
| bad buildings share | 0.39 | 0.39 | 0.01 |
| handwash per 100 | 6 | 6.95 | -0.15 |
| ES internet (share) | 0.79 | 0.76 | 0.06 |
| ES electricity (share) | 0.98 | 0.99 | -0.03 |
| ES water (share) | 0.98 | 0.99 | -0.05 |
| annex school (share) | 0.01 | 0 | 0 |
When was it measured?
Enrollment is a count at one point in the school year. The CRLA is given at a different point. That is why CRLA test-takers exceed Grade 1 to 3 enrollment in 2,129 schools, and ELLNA test-takers exceed Grade 3 enrollment in 544 schools. The NAT for SY 2023-24 was given in April 2024. The CRLA file is for SY 2025-26, two school years after the ELLNA and NAT files. The Grade 3 learners it screens are therefore not the Grade 3 learners the ELLNA tested. DepEd’s technical notes also say that test difficulty differs from year to year. None of the assessments should therefore be compared across years without equating, which the files do not provide.
What does a blank mean?
A blank can mean zero, not applicable, not reported, or did not exist, and the files use all four. A school with no senior high school has blank senior-high columns (not applicable). The annex-status column is blank before SY 2019-20 (did not exist). Among public schools that offer the level, 669 have no elementary classroom count and 17 report no nationally funded elementary teacher (not reported). These schools drop out of the affected ratio rather than being scored zero. The SY 2025-26 enrollment file also writes blanks where earlier years wrote zeros. 1,403 schools have every kindergarten-to-Grade 10 cell blank, and 1,347 of them are purely senior-high schools for which the blank means zero. A blank treated as zero lowers an average; a zero treated as blank raises it. Decide which it is before the first sum.
Percent, percentage point, proportion
These three words look alike, but they are not the same. The private share of enrollment fell from 15.9% in SY 2019-20 to 12.0% in SY 2021-22. That is a fall of 3.9 percentage points, which is a 25% fall in the share. A CRLA proportion of 0.157 is 15.7%. When a memo says “internet access rose 10%”, ask whether it means ten points or a tenth.
Part 3. Reading enrollment counts and trends
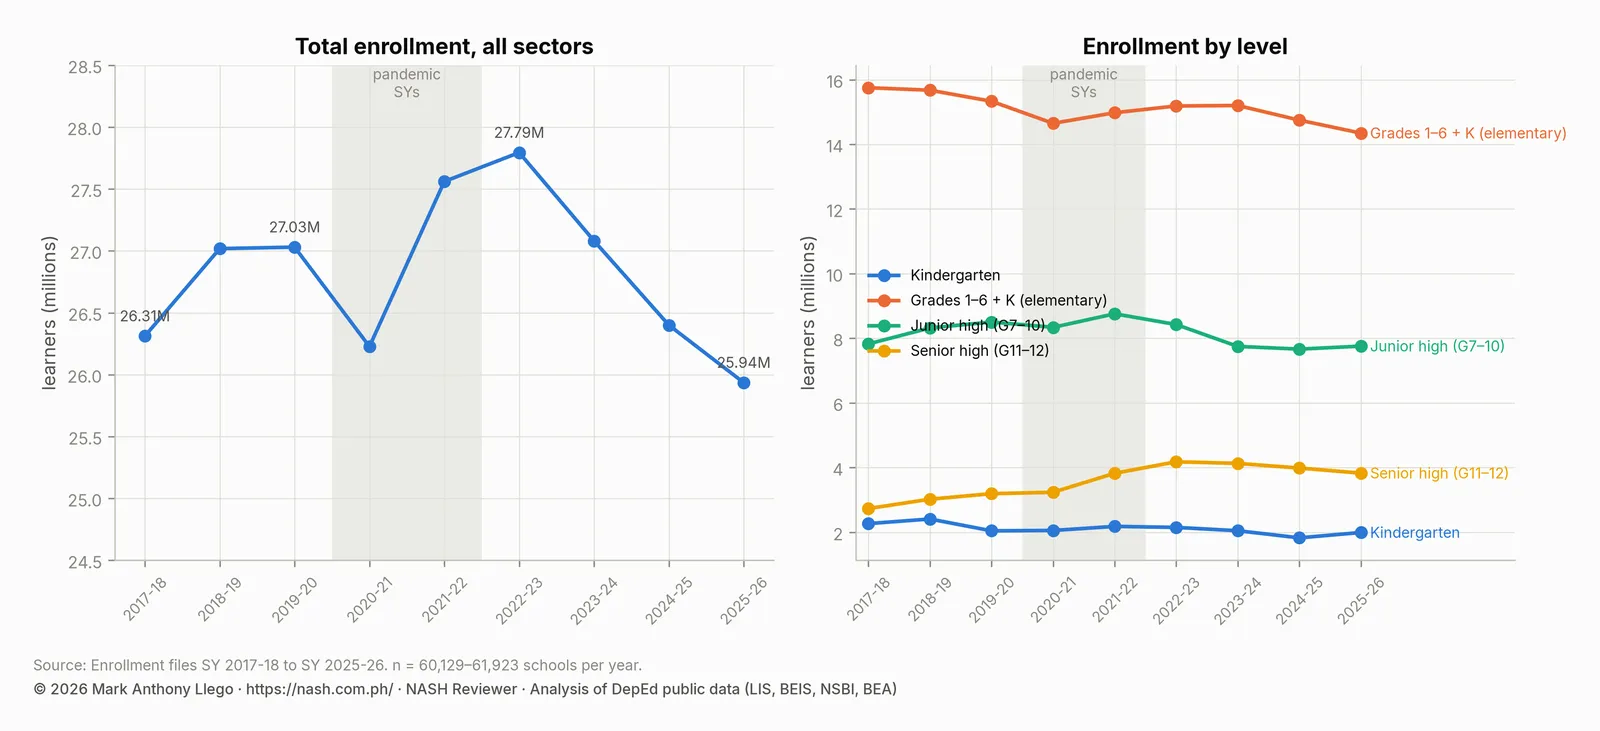
The enrollment series is the simplest file and the one most often misread, because a change over time can be described five ways.
| School year | Schools | Total enrollment | Year-on-year | Kindergarten | Elementary (K–6) | Junior high | Senior high | Female share |
|---|---|---|---|---|---|---|---|---|
| SY 2017-18 | 61,563 | 26,311,949 | 2,268,455 | 15,752,075 | 7,826,414 | 2,733,460 | 49.1% | |
| SY 2018-19 | 61,916 | 27,018,509 | +2.7% | 2,409,782 | 15,675,041 | 8,320,627 | 3,022,841 | 49.2% |
| SY 2019-20 | 61,923 | 27,030,391 | +0.0% | 2,044,745 | 15,332,706 | 8,503,650 | 3,194,035 | 49.1% |
| SY 2020-21 | 60,957 | 26,227,022 | -3.0% | 2,055,635 | 14,650,804 | 8,339,391 | 3,236,827 | 49.2% |
| SY 2021-22 | 60,429 | 27,560,661 | +5.1% | 2,181,189 | 14,977,991 | 8,757,957 | 3,824,713 | 49.1% |
| SY 2022-23 | 60,137 | 27,794,282 | +0.8% | 2,149,891 | 15,188,435 | 8,426,203 | 4,179,644 | 48.7% |
| SY 2023-24 | 60,167 | 27,081,292 | -2.6% | 2,047,356 | 15,201,951 | 7,749,265 | 4,130,076 | 48.8% |
| SY 2024-25 | 60,129 | 26,400,182 | -2.5% | 1,827,258 | 14,748,764 | 7,665,606 | 3,985,812 | 49.0% |
| SY 2025-26 | 60,204 | 25,935,863 | -1.8% | 1,993,117 | 14,348,159 | 7,758,408 | 3,829,296 | 49.1% |
Level, change and rate
National enrollment was 26,311,949 in SY 2017-18. It peaked at 27,794,282 in SY 2022-23 and is 25,935,863 in SY 2025-26. The absolute change over eight years is −376,086. The compound annual growth rate (CAGR) over the eight years is −0.18%, which looks like no change. The rate since the peak is −2.3% a year, which looks like a steady decline. Both are true. A trend statement needs its start year, its end year, and whether it is a total change or an annual rate. The honest summary is “flat over eight years because a rise to 2022-23 was followed by three years of decline”.
Structural breaks
The two pandemic years are a break in the series. Public enrollment rose as private fell; the private share went from 15.9% to 12.0% and has recovered only to 14.5%. The cohort ratios also jumped. A trend fitted through a break describes neither side of it. The enrollment report fits its trends with and without the pandemic years and reports both.
Index numbers
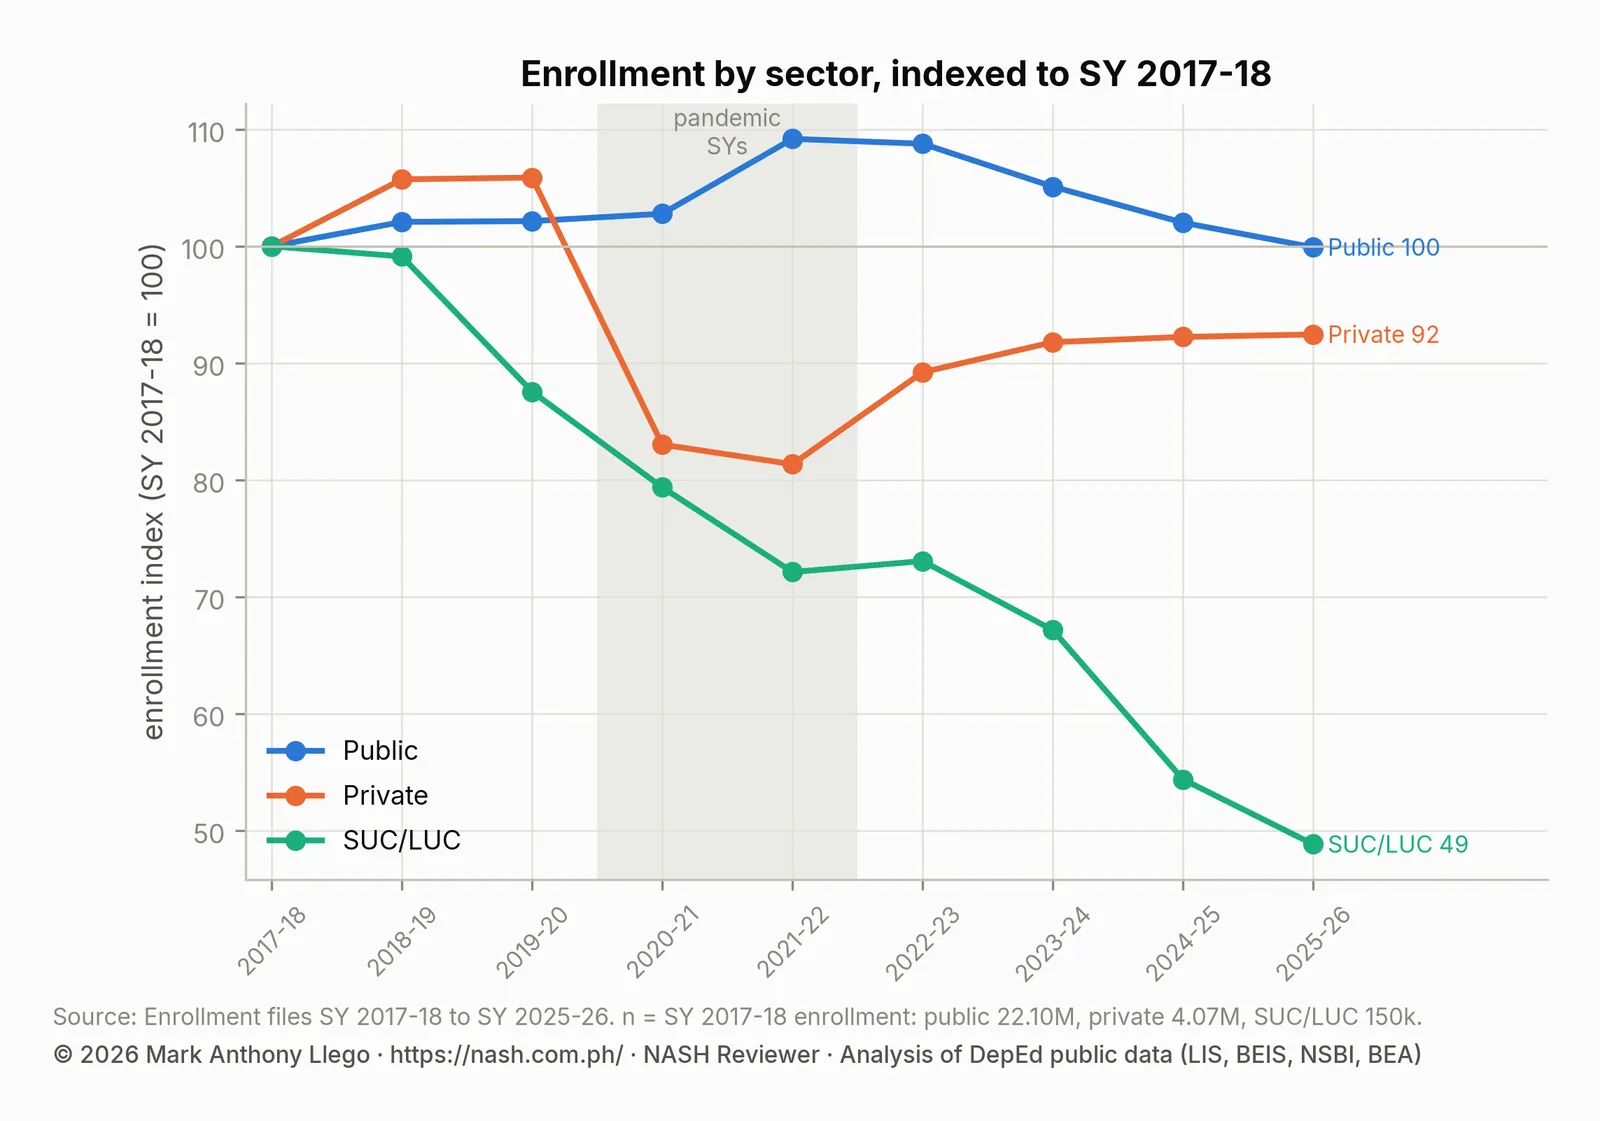
To compare the paths of groups of different size, divide each by its own starting value. Indexed to SY 2017-18 = 100, public enrollment ends at 100, private at 92, and schools managed by state and local universities and colleges (SUC/LUC) at 49. An index shows direction and proportion, not size. The SUC/LUC line’s fall to 49 is a fall from 149,614 to 73,060 learners, about 77,000, against a public sector of 22 million.
Like-for-like growth
A national total changes because schools grow or shrink and because schools open and close. Comparing only the schools present in both years separates the two. From SY 2024-25 to SY 2025-26, all-schools enrollment fell 1.76% and same-school enrollment fell 1.93%. The difference is the entering schools’ 120,188 learners against the exiting schools’ 77,157. A division that gains a new school can report growth while every existing school shrinks.
| Transition | Growth, all schools | Growth, same schools in both years | Schools in both years | Learners in exiting schools | Learners in entering schools |
|---|---|---|---|---|---|
| SY 2017-18 → SY 2018-19 | +2.69% | +2.35% | 60,839 | 93,009 | 183,013 |
| SY 2018-19 → SY 2019-20 | +0.04% | -0.19% | 60,882 | 147,152 | 210,151 |
| SY 2019-20 → SY 2020-21 | -2.97% | -2.97% | 60,212 | 144,794 | 140,811 |
| SY 2020-21 → SY 2021-22 | +5.08% | +5.00% | 59,828 | 115,314 | 143,154 |
| SY 2021-22 → SY 2022-23 | +0.85% | +0.75% | 59,577 | 96,846 | 124,121 |
| SY 2022-23 → SY 2023-24 | -2.57% | -2.76% | 59,438 | 103,515 | 154,113 |
| SY 2023-24 → SY 2024-25 | -2.52% | -2.60% | 59,537 | 90,112 | 109,892 |
| SY 2024-25 → SY 2025-26 | -1.76% | -1.93% | 59,653 | 77,157 | 120,188 |
Cohort flow between grades
Dividing this year’s Grade 1 by last year’s kindergarten, or this year’s Grade 7 by last year’s Grade 6, shows how many learners moved up. Transfers, repeaters, and late entrants are included in the ratio. The ratios are near 1.0 in normal years. They dipped to 0.93 for Grade 7 and Grade 11 in SY 2020-21 and rose to 1.07 and 1.08 the year after as learners returned. A school’s own cohort ratios, computed the same way from its Learner Information System (LIS) records, show where it loses learners between grades.
| School year | Grade 1 ÷ last year’s Kindergarten | Grade 4 ÷ last year’s Grade 3 | Grade 7 ÷ last year’s Grade 6 | Grade 11 ÷ last year’s Grade 10 |
|---|---|---|---|---|
| SY 2018-19 | 1.034 | 0.992 | 0.985 | 0.964 |
| SY 2019-20 | 1.016 | 0.991 | 0.996 | 0.969 |
| SY 2020-21 | 0.992 | 0.96 | 0.928 | 0.934 |
| SY 2021-22 | 1.065 | 1.011 | 1.011 | 1.084 |
| SY 2022-23 | 1.025 | 1.005 | 0.995 | 1.015 |
| SY 2023-24 | 1.005 | 0.979 | 0.971 | 0.983 |
| SY 2024-25 | 1.011 | 0.99 | 0.981 | 1.018 |
| SY 2025-26 | 1.017 | 0.988 | 0.981 | 1.006 |
Region boundaries and school IDs
Four region changes fall within the nine years. ARMM became BARMM in SY 2019-20. Cotabato City moved to BARMM in SY 2021-22. The Negros Island Region took 21 divisions from Regions VI and VII in SY 2024-25. Sulu moved from BARMM to Region IX in SY 2025-26. A regional series read from the files as published shows jumps that reflect boundary changes, not changes in learners.
The reports here assign every school-year to its division’s SY 2025-26 region. They key on region and division together, because two division names exist in two regions each (San Carlos City; San Fernando City). Under constant boundaries, BARMM grew 2.6% a year, and Region I, Region VI, and Region VIII lost about 1.1% a year. School IDs also change: about 146 schools over eight transitions reappear under a new ID, and they count as an exit plus an entry.
Part 4. Reading shares and who is counted
Shares of schools and shares of learners
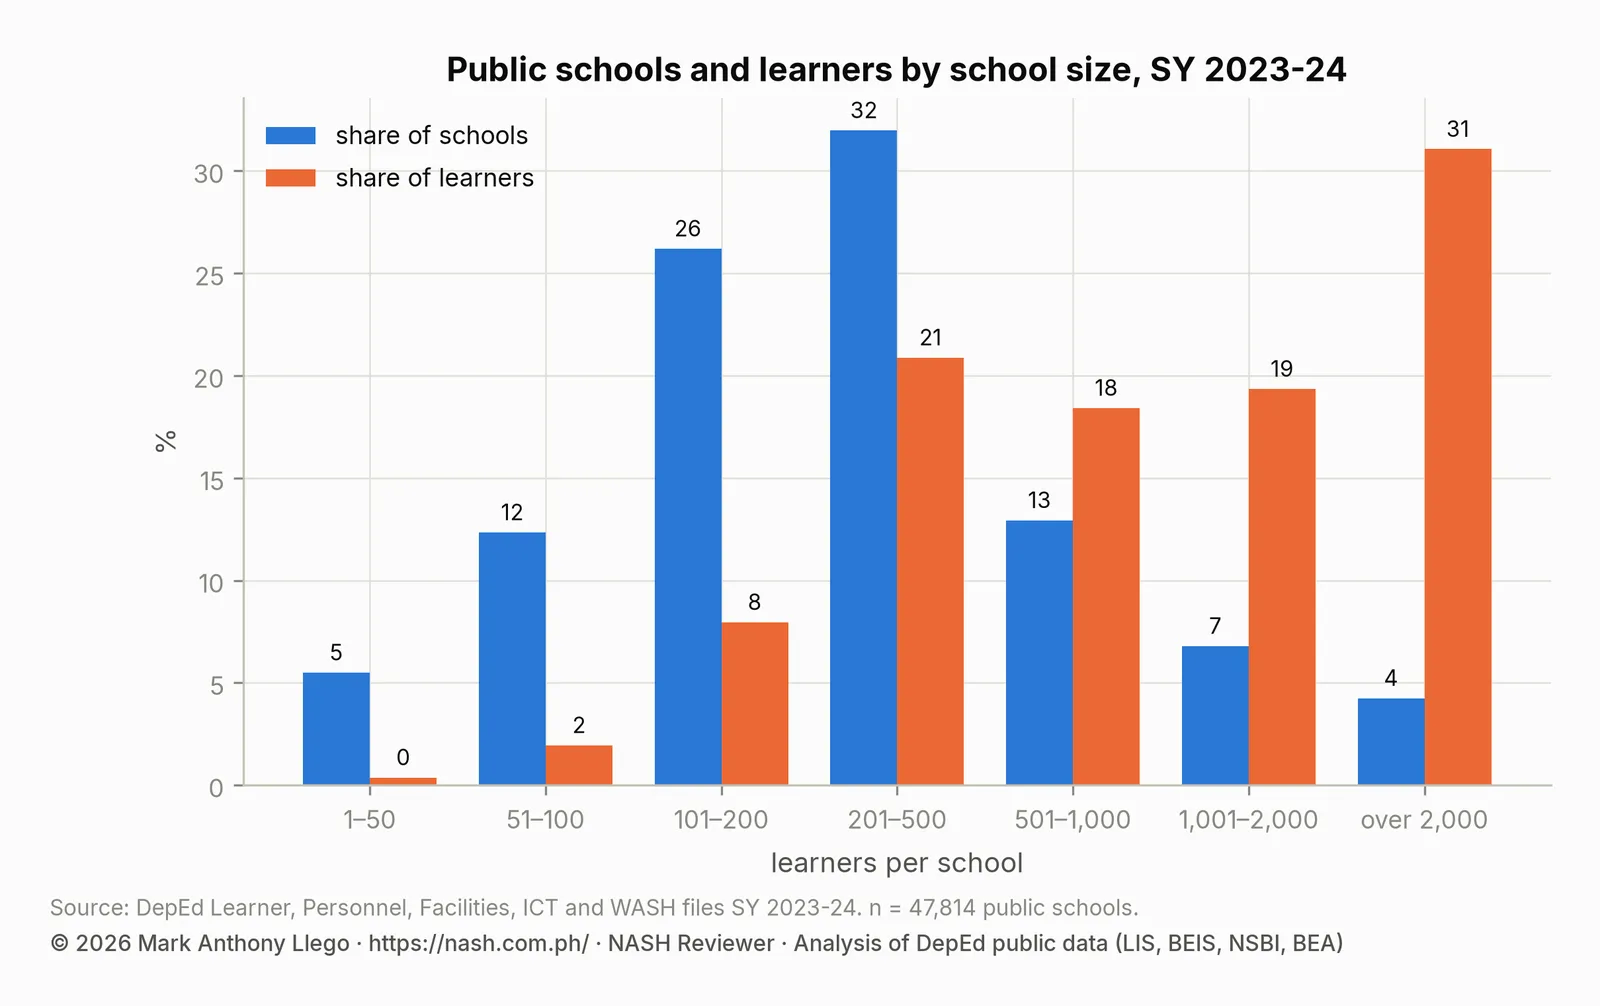
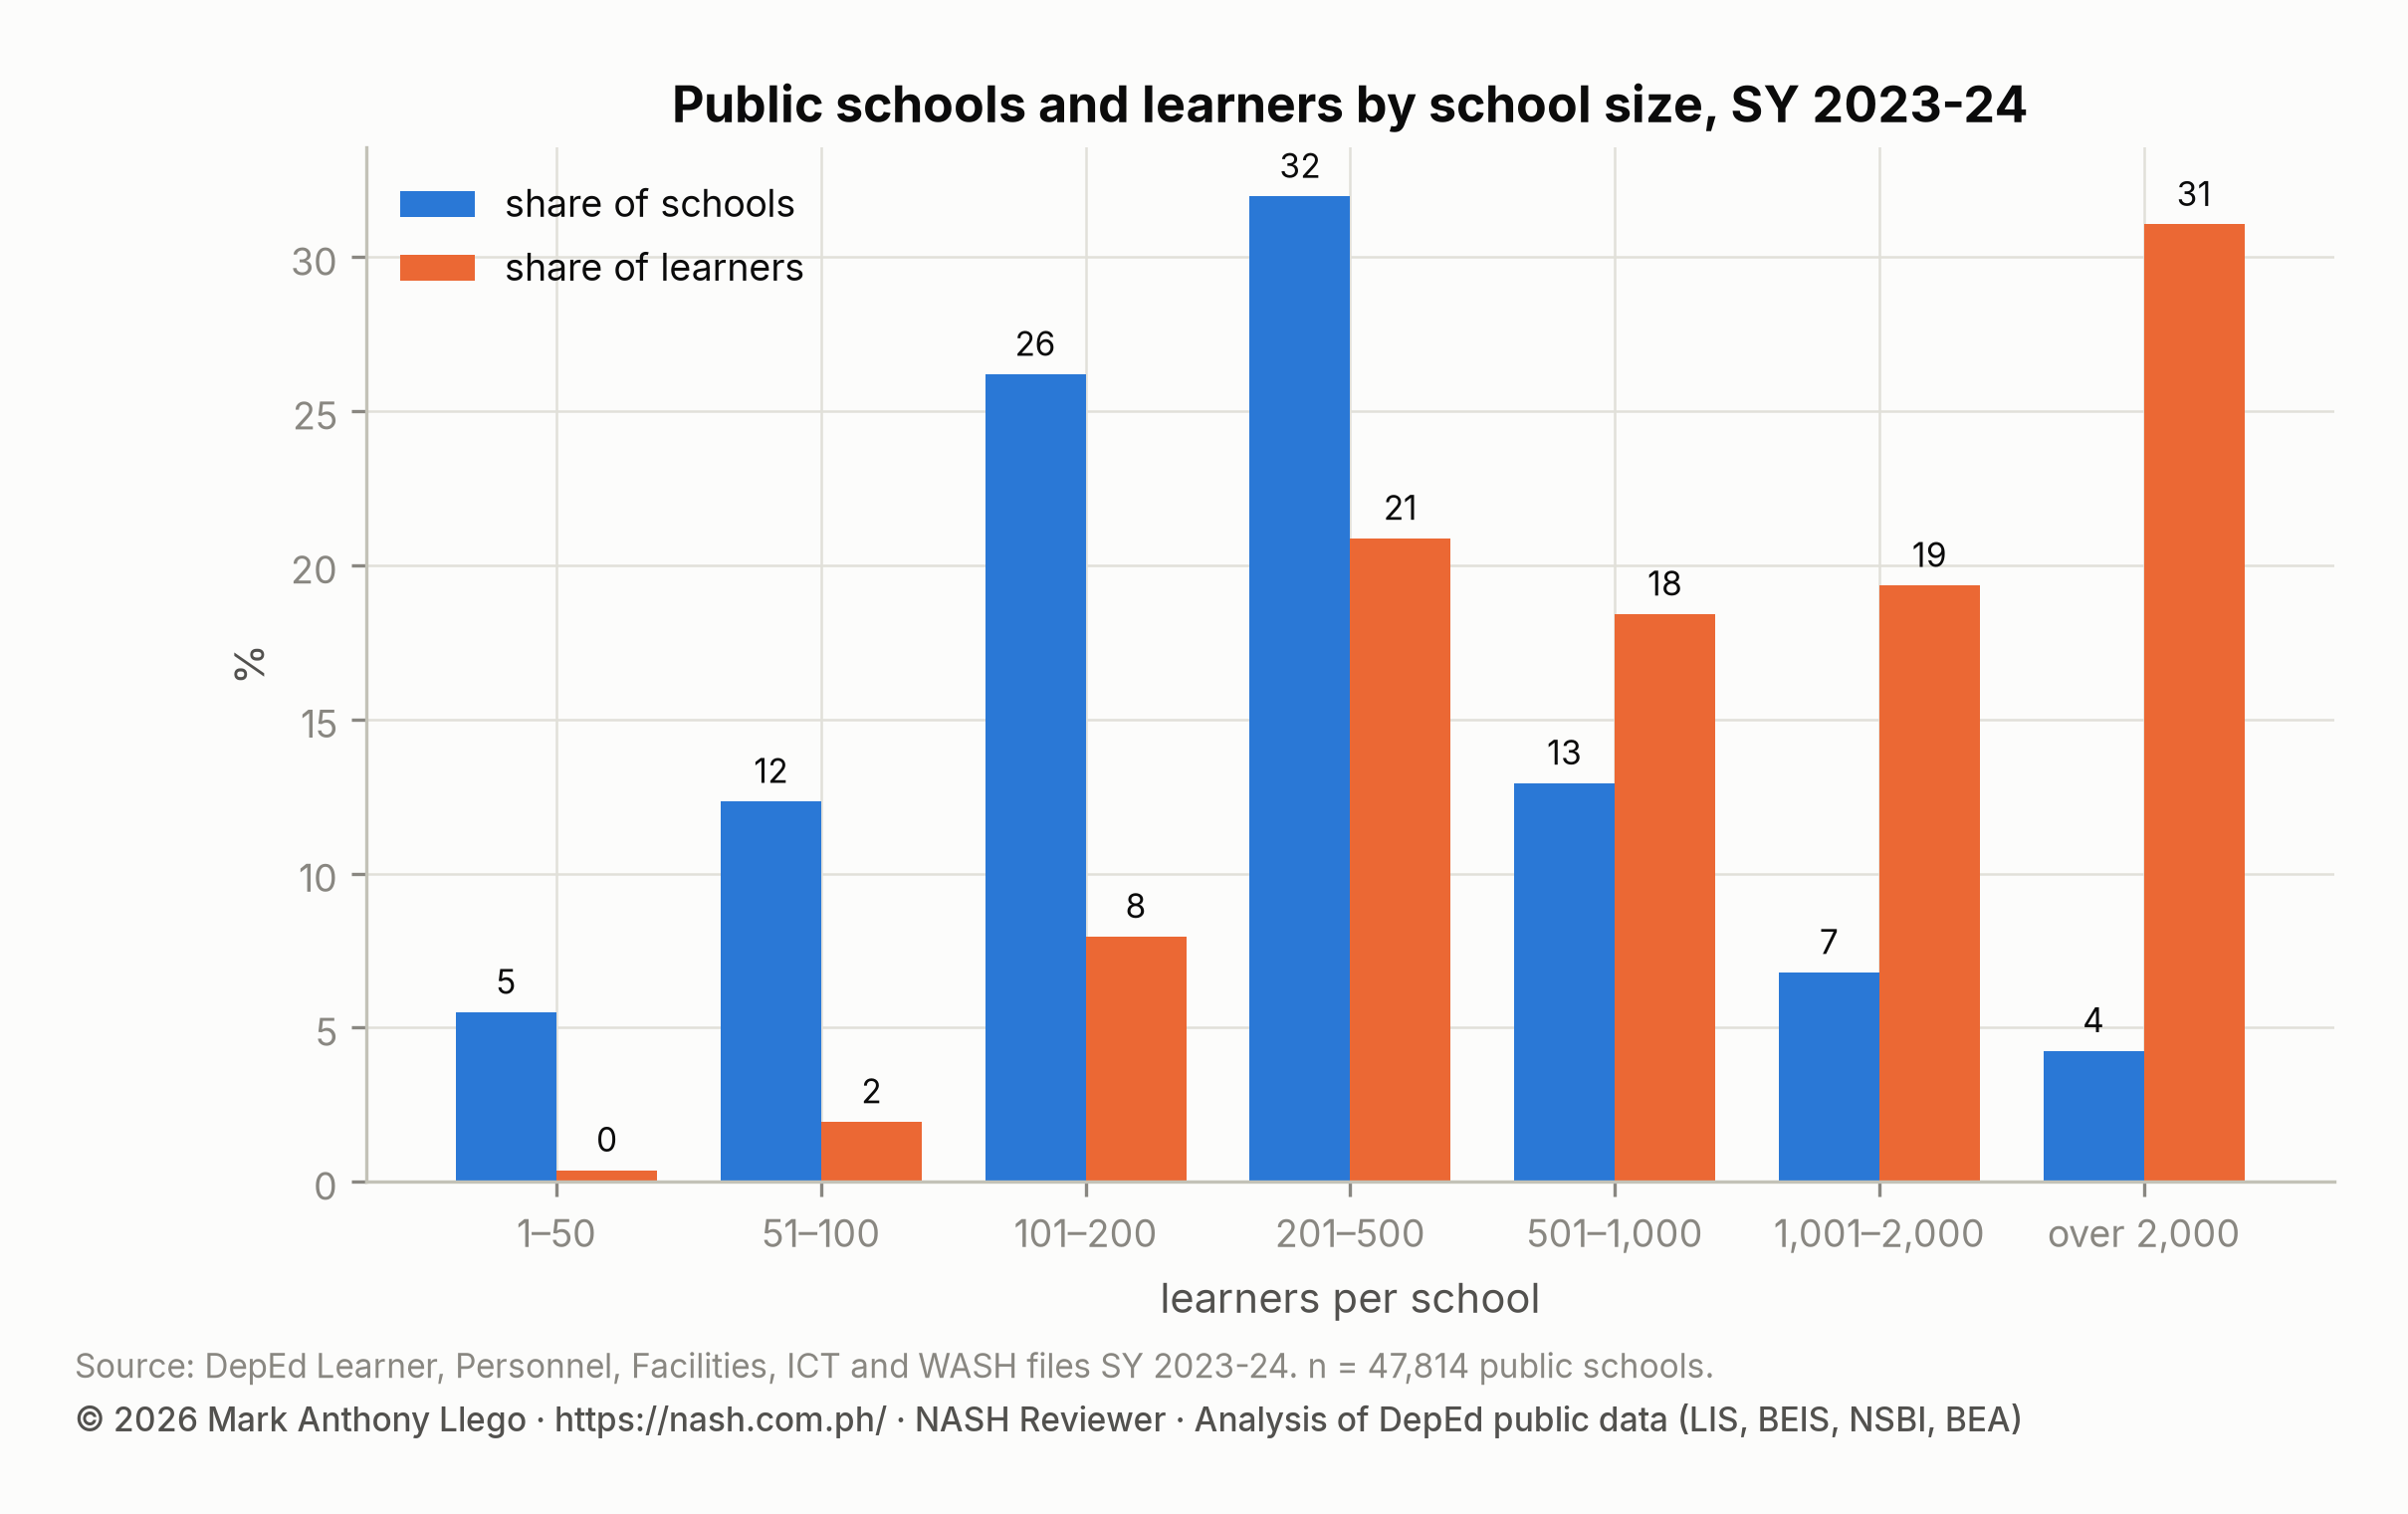
The most useful habit in this part is to compute every share twice: once over schools and once over learners. Internet reaches 78.1% of public schools and 90.4% of their learners, because the unconnected schools are small. Schools with no functional toilet bowl are 2.8% of schools and hold 1.1% of learners. Schools with more than 1,000 learners are 11% of schools and 51% of learners. Schools with 50 or fewer learners are 5.5% of schools and 0.4% of learners. A policy aimed at schools and a policy aimed at learners reach different places.
| Indicator | Schools with data | Share of schools | Share of learners |
|---|---|---|---|
| water supply (ES) | 39,341 | 97.6% | 98.1% |
| electricity, grid or off-grid (ES) | 39,343 | 97.4% | 98.2% |
| internet (ES) | 39,341 | 76.2% | 87.7% |
| water supply (any level) | 47,813 | 97.6% | 98.3% |
| electricity (any level) | 47,813 | 97.4% | 98.3% |
| internet (any level) | 47,813 | 78.1% | 90.4% |
| at least one academic computer | 47,813 | 75.4% | 86.9% |
| no functional toilet bowl | 47,814 | 2.8% | 1.1% |
Learner types
The learner file counts four learner types. IP learners are 9.3% of public-school learners: 71.9% in CAR, 33.1% in BARMM, and under 1% in NCR, Region IV-A, Region VII, and Region VIII. Learners in Arabic Language and Islamic Values Education (ALIVE) are 1.4%, and 18.2% in BARMM. Balik-Aral returnees are 0.6%, and learners in alternative delivery modes are 0.1%.
Two cautions apply. A share in a small school is a few children: 25% of a 12-learner kindergarten is three learners, and it will be 17% or 33% next year by chance. And a regional share is dominated by the large schools in it; the median school’s share can be very different from the region’s.
Multigrade classes
Two percent of public elementary learners are taught in multigrade classes, but 15.2% of public schools offer them: 39.7% in CAR and 33.1% in Region VIII. Both numbers are correct. The first says how many children, the second how many schools, and the gap between them says that multigrade schools are small.
Part 5. Reading pupil-teacher and other ratios
Pupil-teacher, pupil-classroom, learner-toilet, and computers per 100 learners: these ratios are where a school head is most often compared with a standard, and where the standard is most often misread.
Three versions of one ratio
For a set of schools there are three pupil-teacher ratios. The aggregate is all learners over all teachers; it is DepEd’s definition and what a division or region reports, and it is 25.5 nationally. The median school ratio is the ratio of the middle school when schools are sorted by ratio: 22.7. The mean of school ratios is the average of each school’s own ratio: about 24.1. The aggregate is weighted toward the large schools, which have higher ratios; the median tells you the ratio of a typical school. The chart below shows both for every region: the dot is the regional aggregate and the bar is the median school.
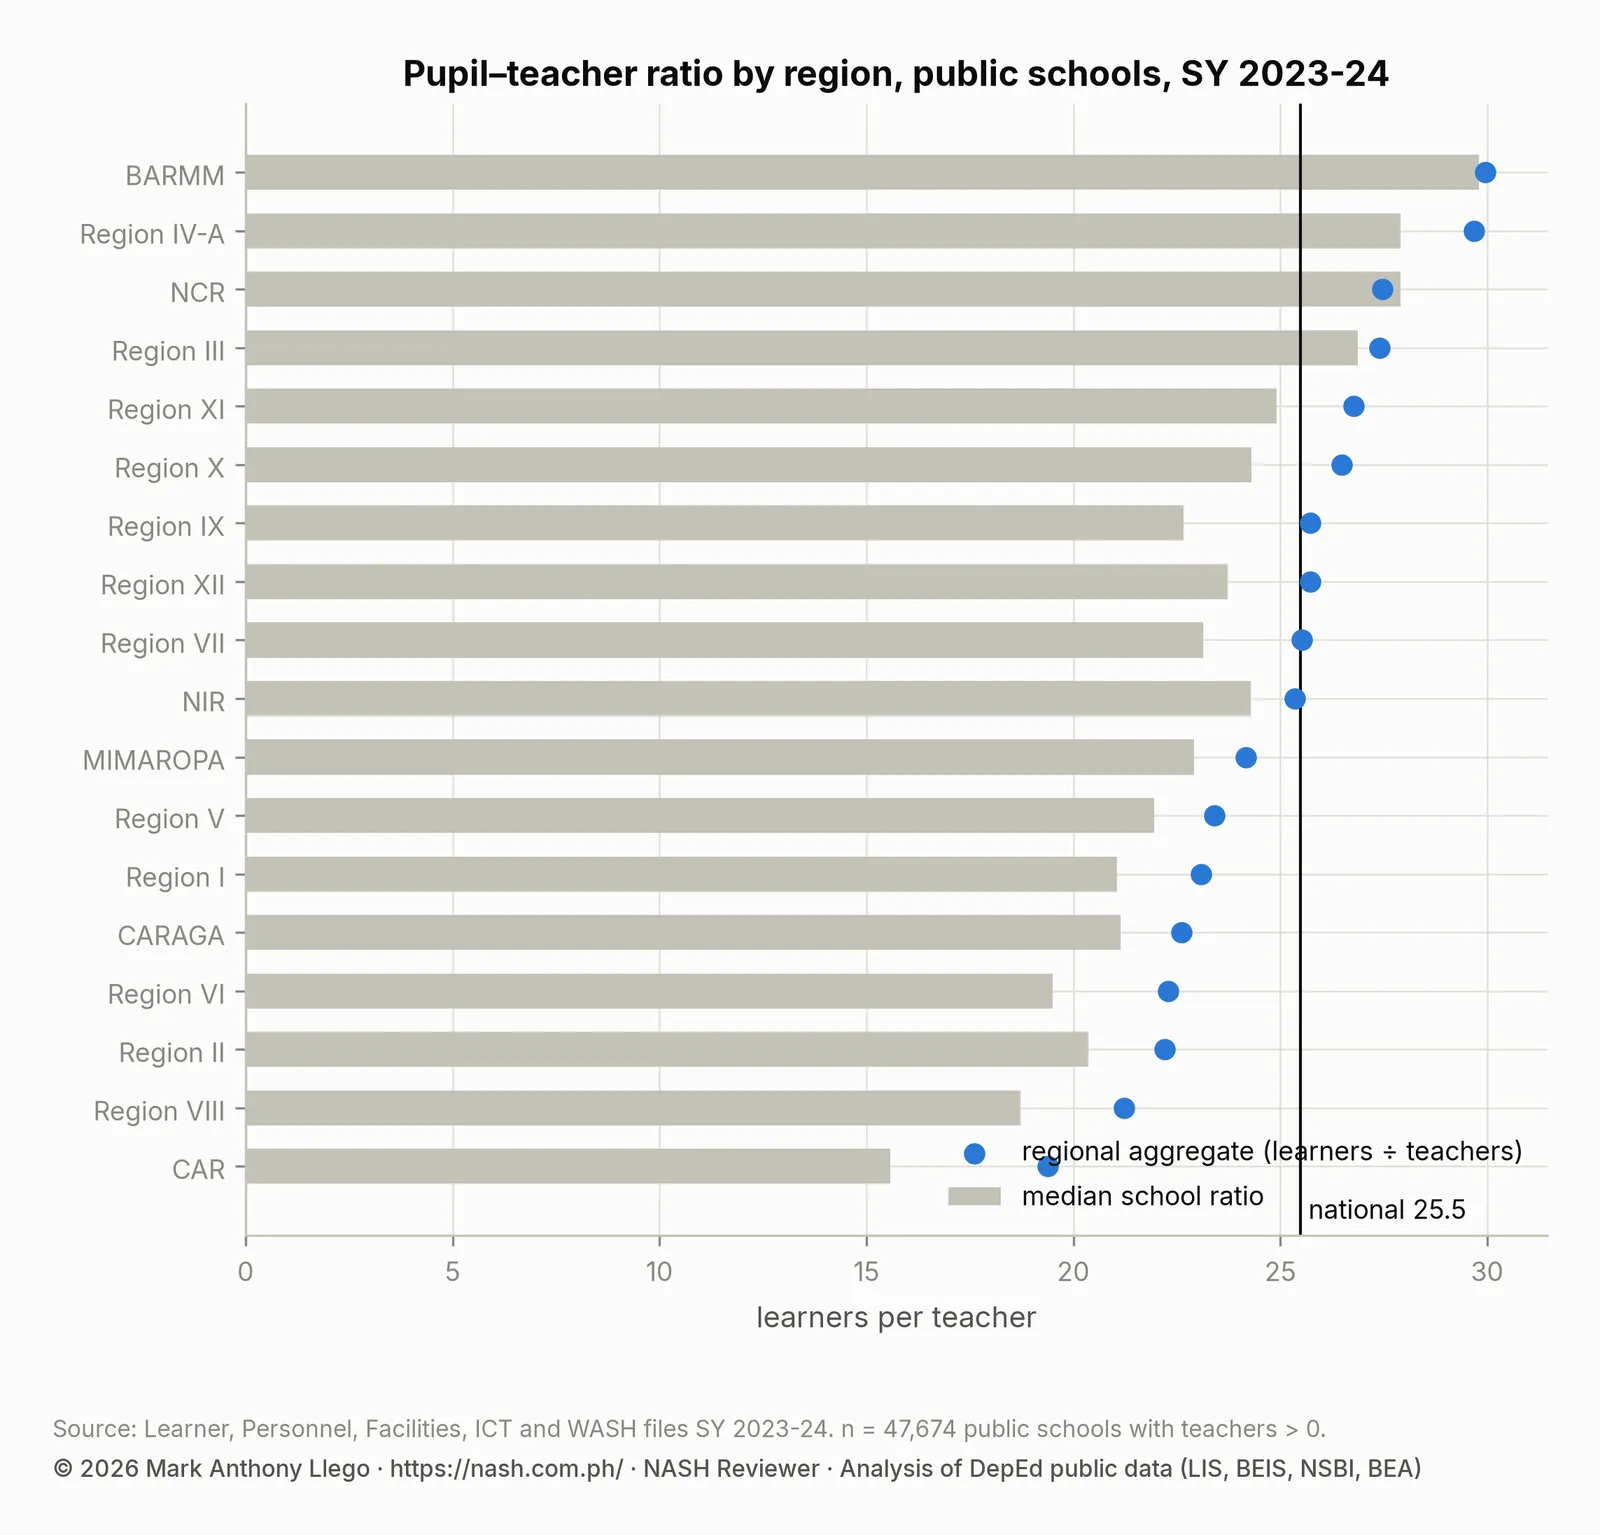
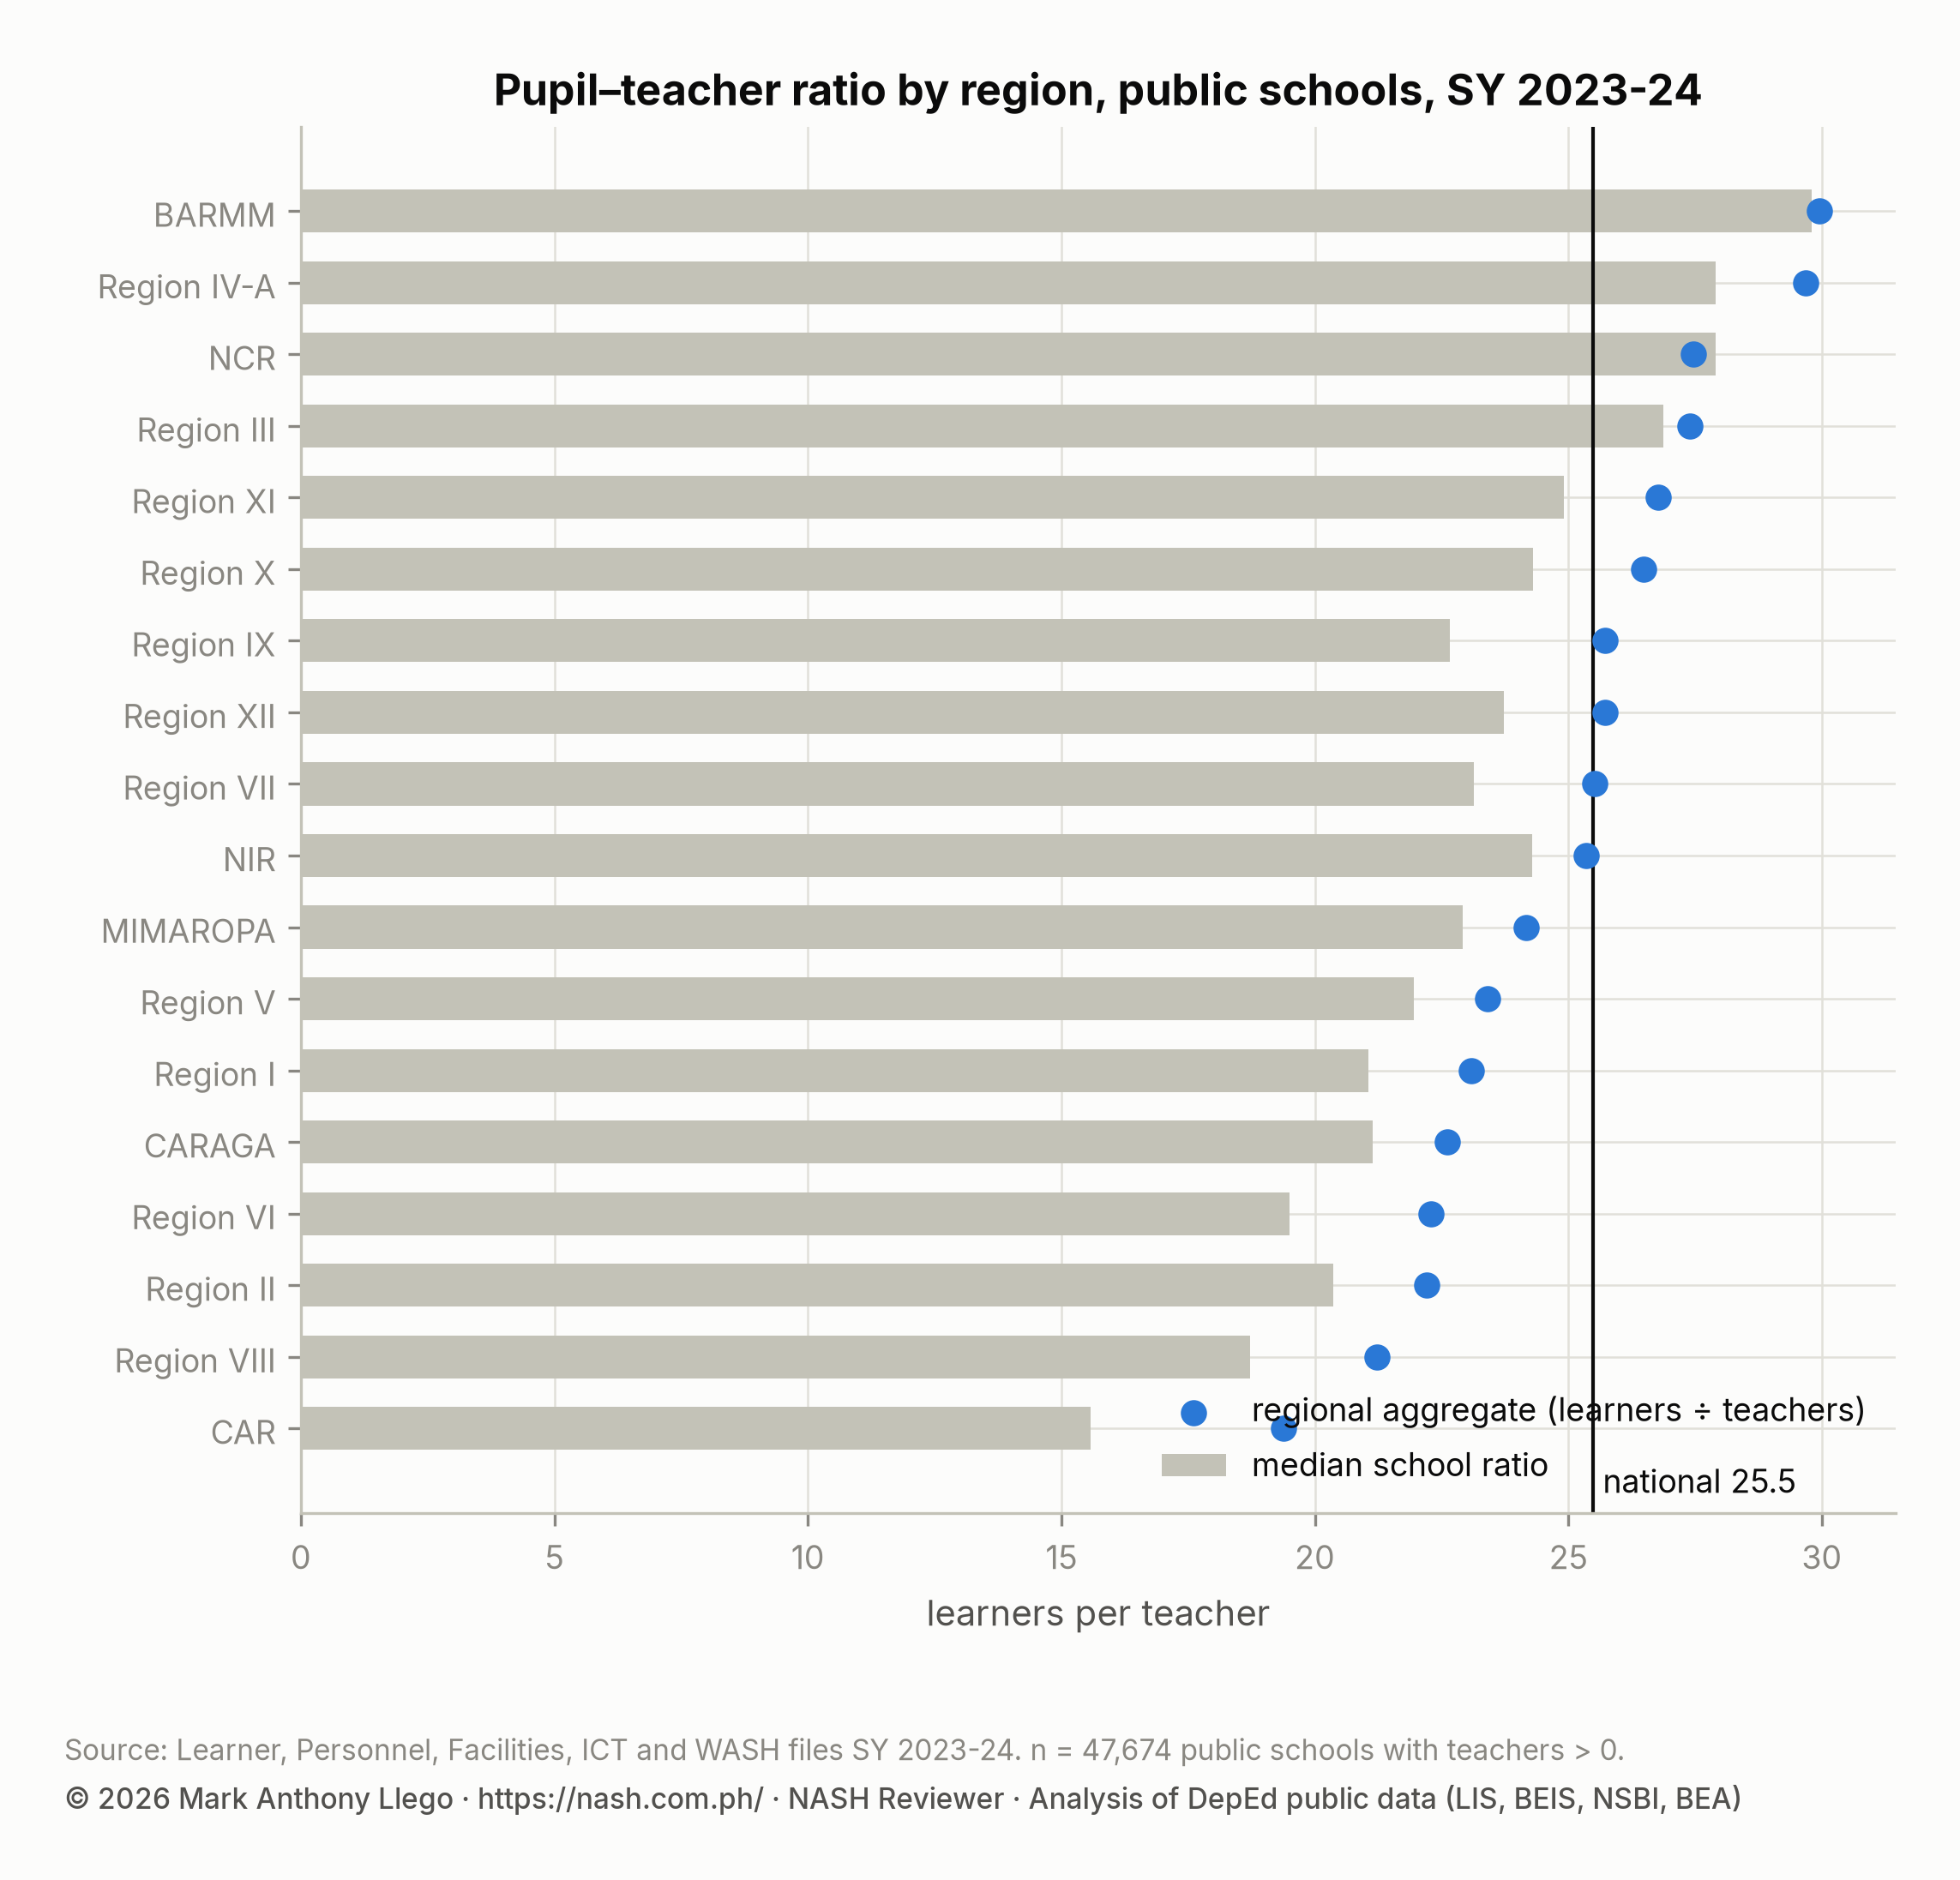
The lesson for a school head is that the ratio you will be compared with is the aggregate. A 1,200-learner school at 30 learners per teacher is above the national 25.5 and well above the median school’s 22.7. But it is near the aggregate for a city division, because the aggregate is made of schools like it.
Distributions, not averages
A ratio’s distribution across schools usually has a long tail of high values, and the mean sits in that tail. The pupil-classroom ratio has a median of 27.2 and a 95th percentile of 71.5. The learner-toilet ratio has a median of 21.7 and a 95th percentile of 86. Academic computers per 100 learners have a median of 2.3, a 75th percentile of 8.1, and a 95th percentile of 33. Read the percentiles, not the mean, to know where your school stands.
| Indicator | Schools | 5th percentile | 25th | Median | 75th | 95th percentile |
|---|---|---|---|---|---|---|
| total enrollment (learners) | 47,814 | 48 | 126 | 232 | 480 | 1795.3 |
| pupil–teacher ratio | 47,674 | 11.2 | 17.4 | 22.7 | 28.1 | 37.6 |
| elementary pupil–teacher ratio | 39,334 | 11.1 | 17.2 | 22.9 | 28.2 | 36 |
| pupil–classroom ratio | 46,939 | 12 | 19.9 | 27.2 | 37 | 71.5 |
| elementary pupil–classroom ratio | 38,674 | 11.5 | 18.9 | 25.9 | 35 | 67.6 |
| learner–toilet ratio | 46,454 | 8 | 14.5 | 21.7 | 33.4 | 86 |
| academic computers per 100 learners | 47,813 | 0 | 0.1 | 2.3 | 8.1 | 33 |
| functional handwashing facilities per 100 learners | 44,186 | 0.6 | 2.1 | 4.1 | 6.7 | 14.3 |
| share of elementary learners in multigrade classes | 39,341 | 0 | 0 | 0 | 0 | 0.9 |
| share of buildings needing major repair or worse | 47,182 | 0 | 0 | 0.3 | 0.7 | 1 |
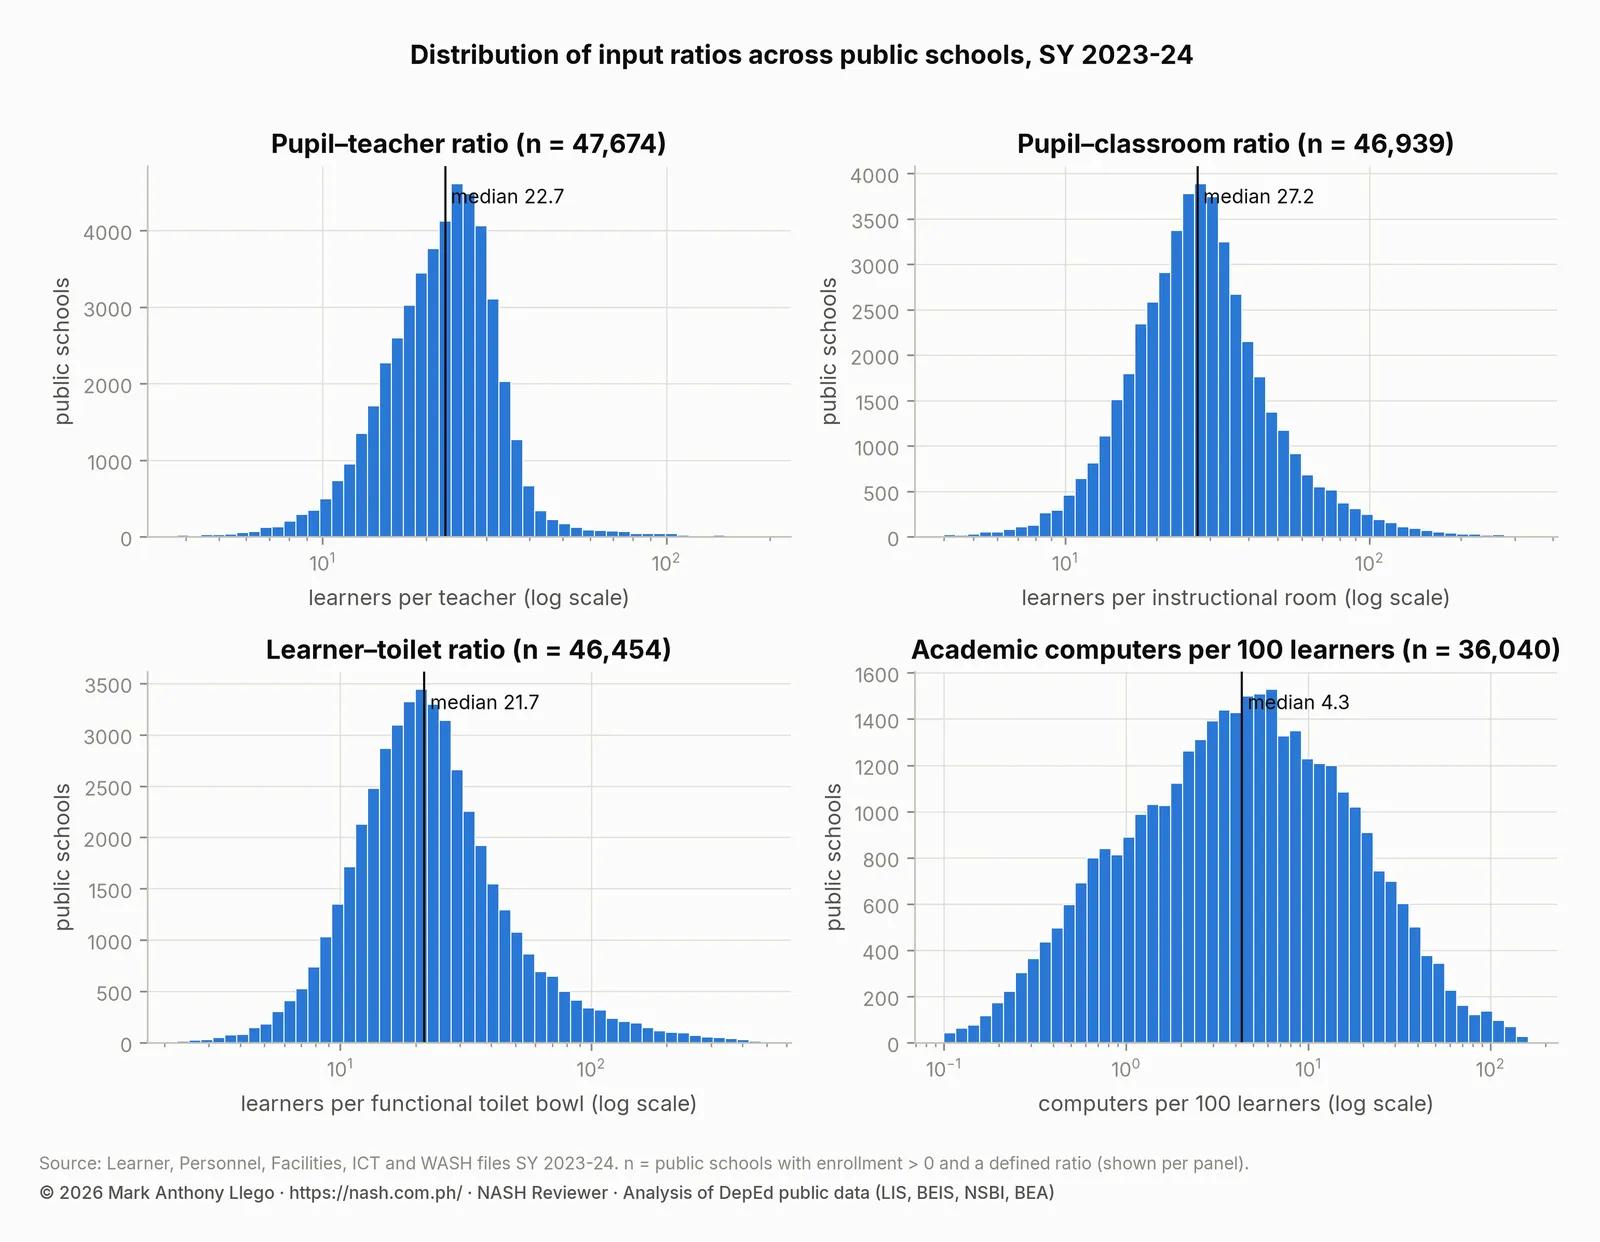
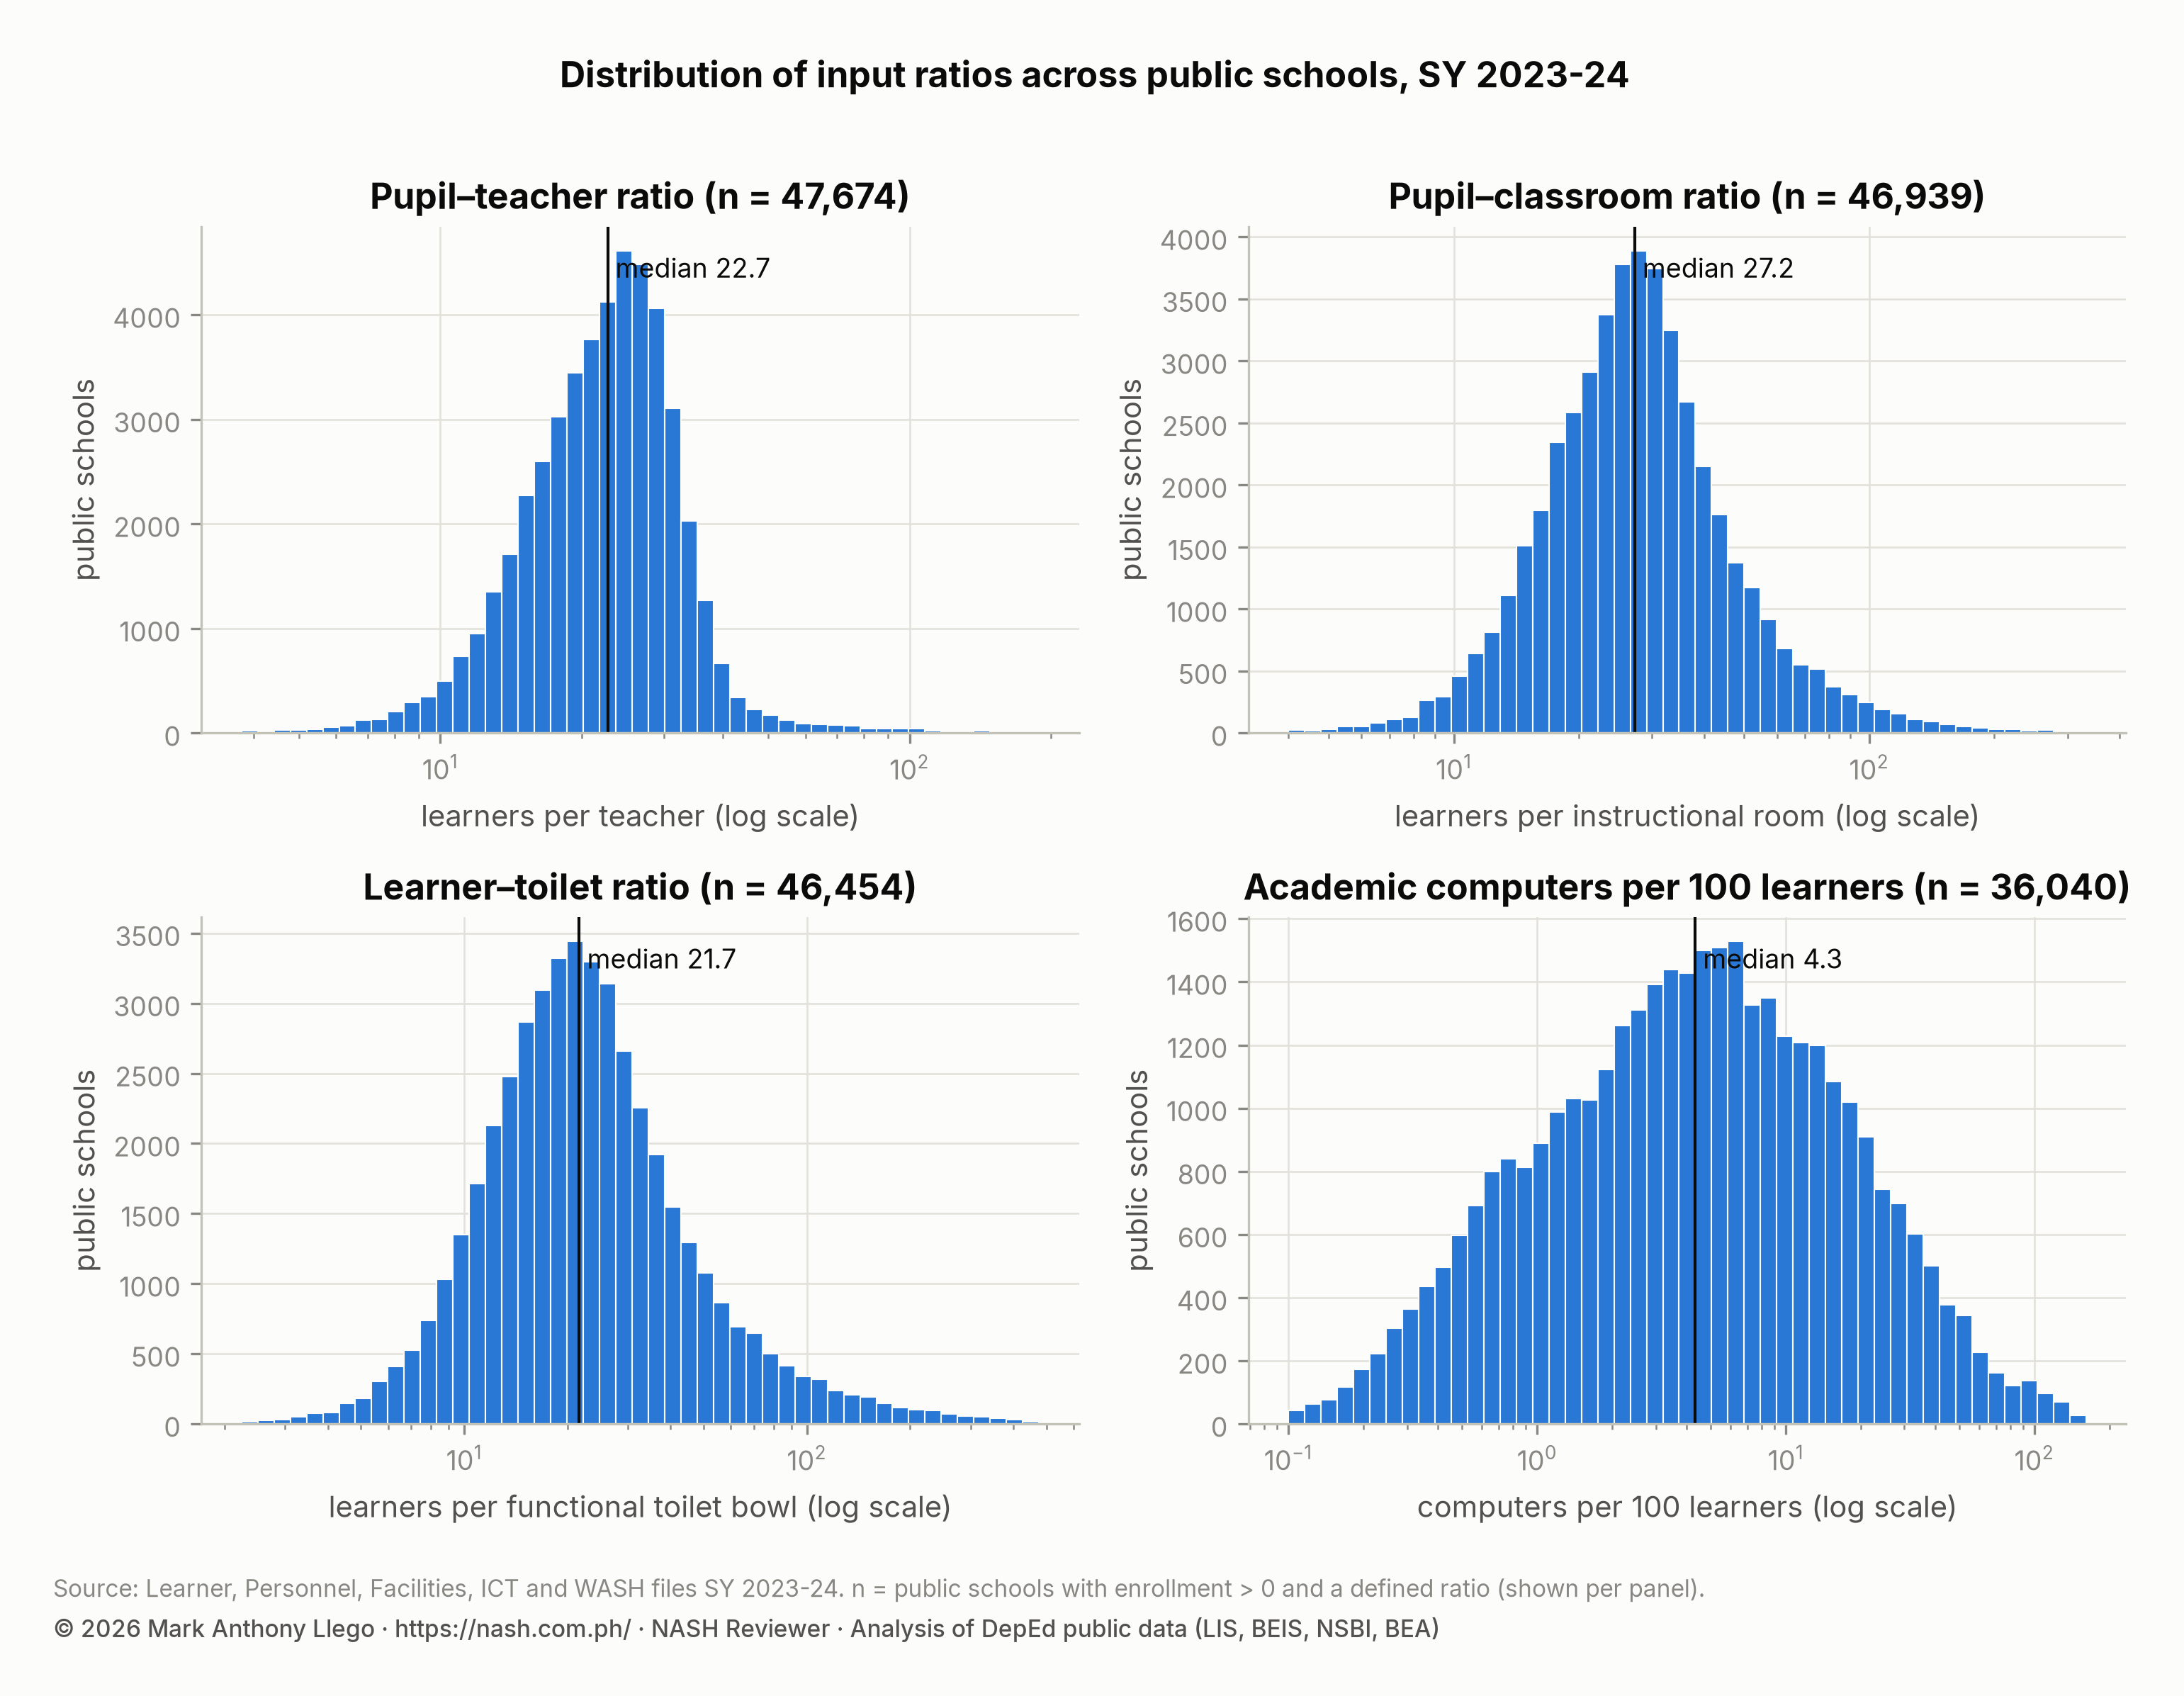
The histograms use a logarithmic scale on the horizontal axis, which is the right scale for a ratio. Each step multiplies rather than adds, so ratios of 10 and 100 are as far apart as 1 and 10. On a linear axis the same data would be a spike at the left and a long, nearly invisible tail.
Impossible values
Ratios inherit the errors in their numerator and denominator. In the SY 2023-24 files, 139 public schools report learners and no teachers, so their ratio is undefined, and 7 report more teachers than learners. 267 report learners and no instructional room, 316 report more academic computers than learners, and one school reports 15,699 tablets. The reports cap the computer counts at the 99th percentile before computing per-learner ratios, a process called winsorizing, and exclude undefined ratios. They do not silently treat them as zero. A ratio that is far outside the distribution is an entry to check before it is a finding to act on.
Zero denominators and small ones
A school with no classroom count has no pupil-classroom ratio, not a ratio of infinity. A school with one toilet bowl has a learner-toilet ratio equal to its enrollment, and one broken bowl doubles it. Read ratios in small schools with their counts beside them.
Part 6. Reading the facilities and WASH files
Building condition categories and their base
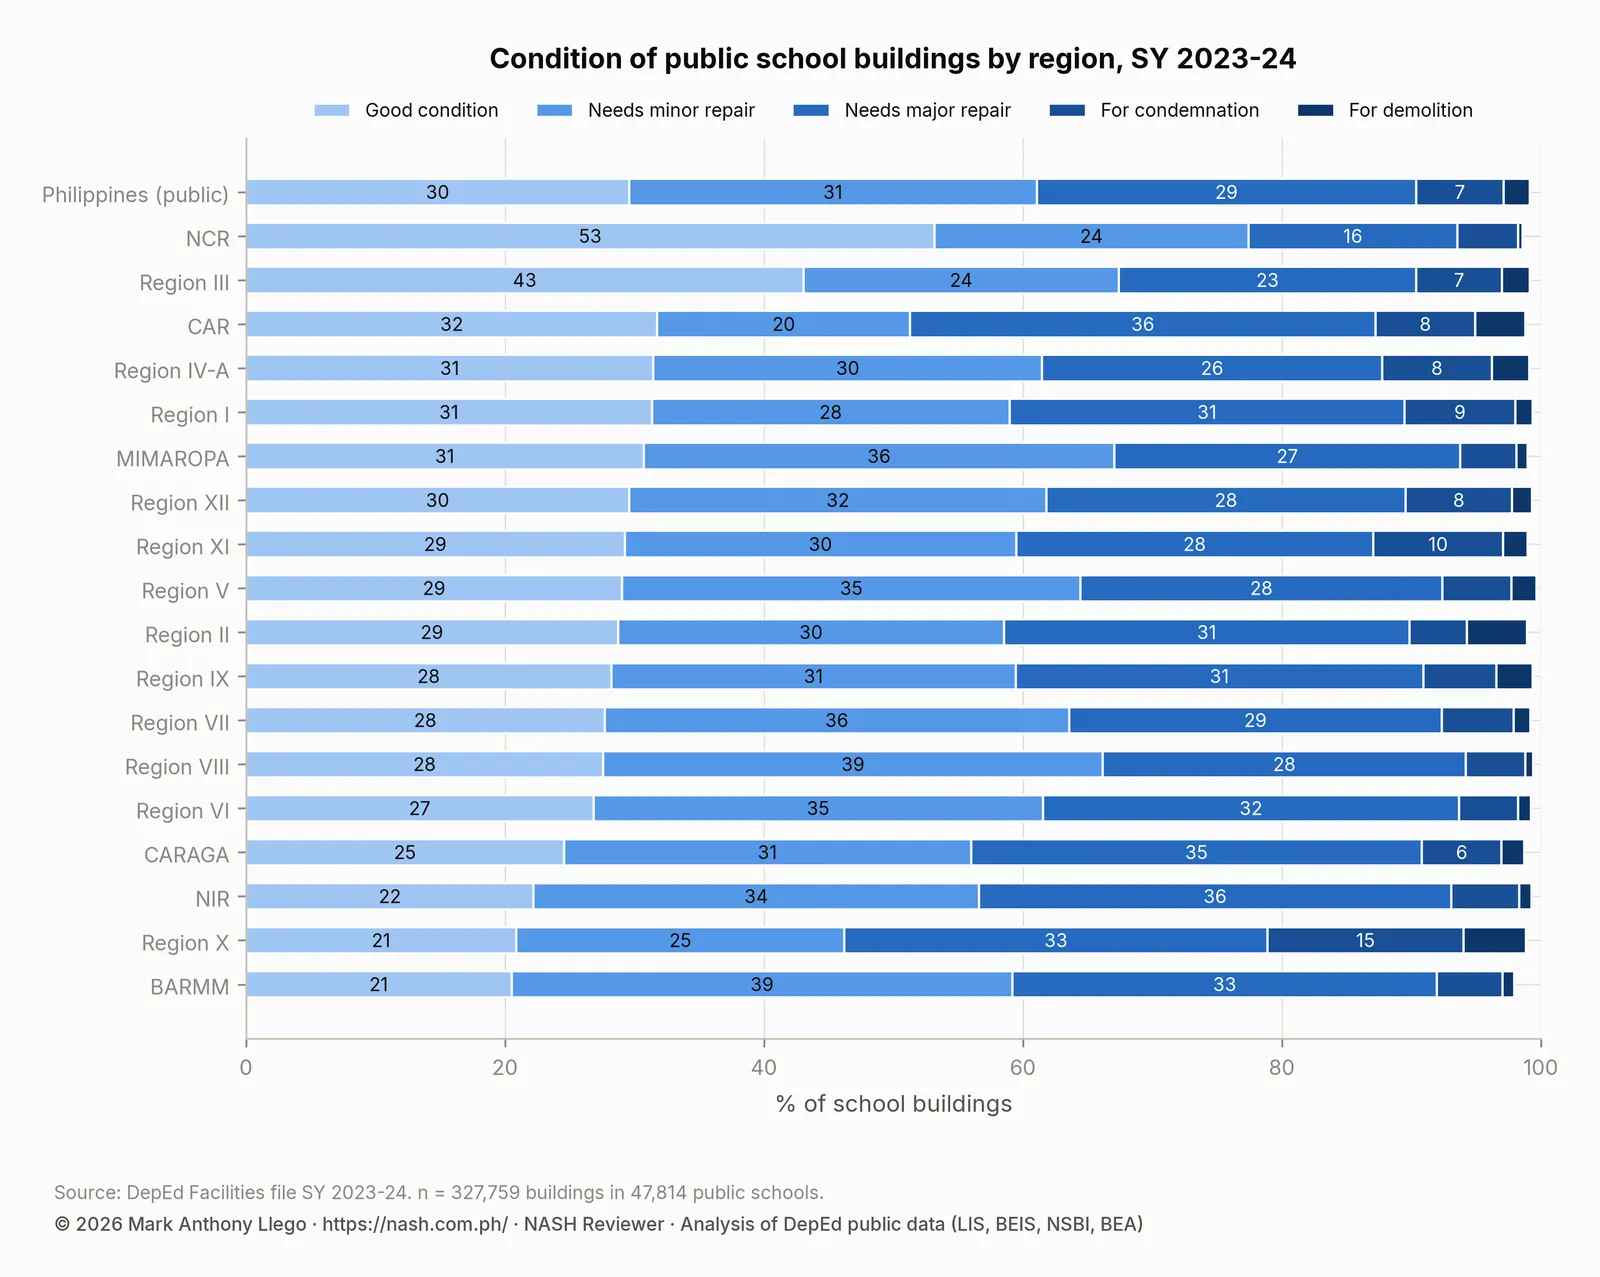
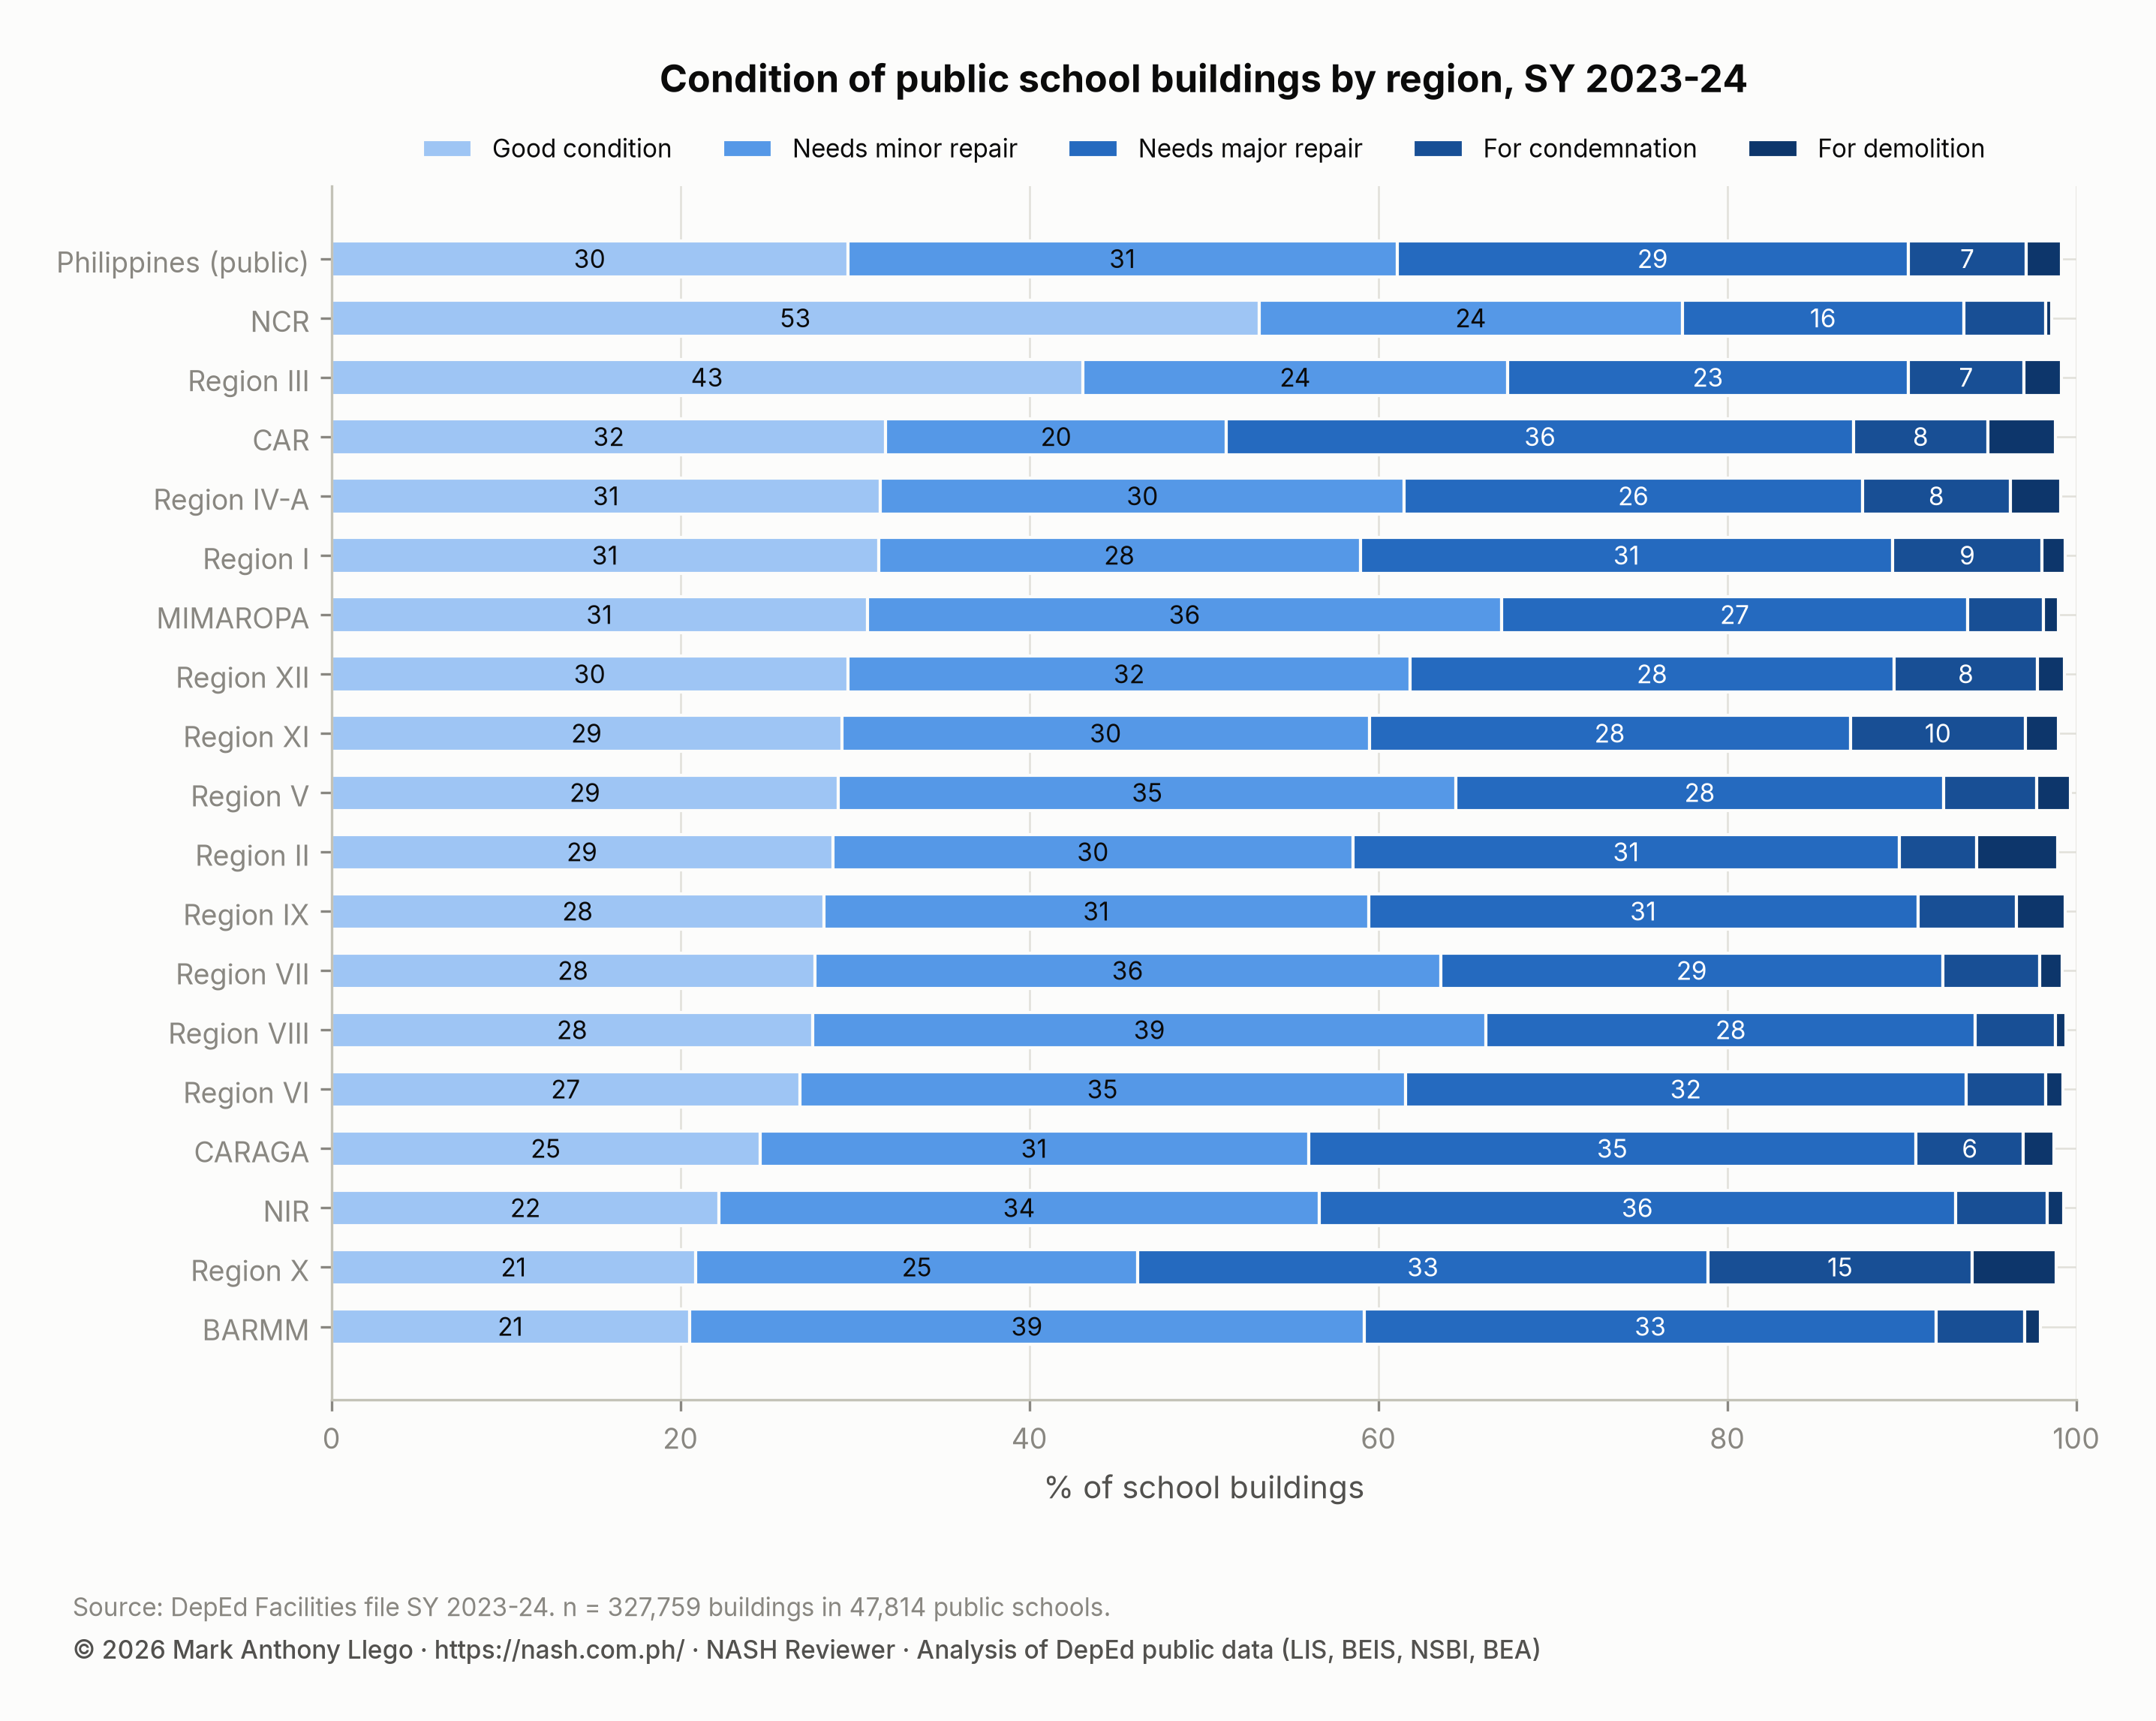
The facilities file classifies buildings, not schools: good condition, minor repair, major repair, for condemnation, and for demolition. The chart shows the split by region as stacked bars that sum to 100% of buildings. NCR has 53% in good condition, and BARMM and Region X have 21%. A stacked bar is read in two ways: the length of each segment is the share in that category, and the position of each boundary is the cumulative share. Here the first two segments together (good plus minor repair) are the “acceptable” share. Outside NCR it is below 70% in almost every region, as the report of the Second Congressional Commission on Education (EDCOM II) also notes.
| Region | Buildings | Good condition | Needs minor repair | Needs major repair | For condemnation | For demolition | Under construction | For completion |
|---|---|---|---|---|---|---|---|---|
| BARMM | 8,728 | 20.5% | 38.7% | 32.8% | 5.1% | 0.9% | 0.6% | 1.5% |
| CAR | 8,283 | 31.8% | 19.5% | 36.0% | 7.7% | 3.9% | 0.6% | 0.6% |
| CARAGA | 13,790 | 24.6% | 31.4% | 34.8% | 6.1% | 1.7% | 0.7% | 0.6% |
| MIMAROPA | 16,123 | 30.7% | 36.4% | 26.7% | 4.3% | 0.9% | 0.3% | 0.8% |
| NCR | 4,172 | 53.2% | 24.2% | 16.1% | 4.7% | 0.4% | 0.9% | 0.5% |
| NIR | 18,377 | 22.2% | 34.4% | 36.4% | 5.3% | 0.9% | 0.4% | 0.4% |
| Region I | 21,868 | 31.4% | 27.6% | 30.5% | 8.6% | 1.3% | 0.3% | 0.3% |
| Region II | 18,230 | 28.7% | 29.8% | 31.3% | 4.4% | 4.6% | 0.4% | 0.7% |
| Region III | 30,472 | 43.1% | 24.4% | 22.9% | 6.6% | 2.2% | 0.6% | 0.2% |
| Region IV-A | 29,330 | 31.5% | 30.0% | 26.3% | 8.5% | 2.9% | 0.5% | 0.4% |
| Region IX | 16,655 | 28.2% | 31.2% | 31.5% | 5.7% | 2.8% | 0.4% | 0.3% |
| Region V | 29,092 | 29.1% | 35.4% | 28.0% | 5.3% | 1.9% | 0.2% | 0.1% |
| Region VI | 20,787 | 26.8% | 34.7% | 32.1% | 4.6% | 1.0% | 0.3% | 0.5% |
| Region VII | 18,559 | 27.7% | 35.9% | 28.8% | 5.6% | 1.3% | 0.3% | 0.5% |
| Region VIII | 23,923 | 27.6% | 38.6% | 28.0% | 4.6% | 0.6% | 0.4% | 0.2% |
| Region X | 17,730 | 20.9% | 25.3% | 32.7% | 15.1% | 4.8% | 0.6% | 0.5% |
| Region XI | 16,316 | 29.2% | 30.2% | 27.6% | 10.0% | 1.9% | 0.4% | 0.6% |
| Region XII | 15,324 | 29.6% | 32.2% | 27.7% | 8.2% | 1.6% | 0.3% | 0.3% |
| Philippines (public) | 327,759 | 29.6% | 31.5% | 29.3% | 6.8% | 2.0% | 0.4% | 0.4% |
Functional and total toilet bowls
The WASH file counts toilet bowls in two groups: functional and non-functional. The learner-toilet ratio uses functional bowls: 836,572 nationally, or 27.5 learners per bowl. 11.1% of all bowls (104,058) are non-functional, and 17.6% in BARMM. A school’s ratio can be improved by repairing bowls it already has. The two columns together show this; either alone hides it.
Yes-or-no flags and counts
Water, electricity, and internet are yes-or-no flags by level. A flag answers “does the school report having it”, not how much or how reliably. Internet “access” at 78% of schools says nothing about bandwidth. The inputs analysis finds that the flag is associated with results. That is a reason to read it as a marker of a connected, usually urban school, not as a measure of connectivity.
Makeshift rooms and temporary learning spaces
The facilities file separates instructional rooms from makeshift rooms and temporary learning spaces. Nearly three in ten public schools (29.1%) use makeshift rooms, 34,372 in all, and 11,634 temporary learning spaces are in use. A pupil-classroom ratio computed on instructional rooms alone (35.1 nationally, 55.1 in NCR) understates the number of rooms in use and overstates the crowding. One computed on all rooms does the reverse. State which you used.
Part 7. Reading NAT, ELLNA, and CRLA results
This part covers the figures that matter most and are misread most often.
What a mean percentage score is
The NAT and ELLNA files give each school a mean percentage score (MPS) overall and by subject or component. DepEd’s technical notes set bands on it: Highly Proficient 90 to 100, Proficient 75 to 89, Nearly Proficient 50 to 74, Low Proficient 25 to 49, and Not Proficient below 25. The bands apply to a score. Applying them to a school’s mean says which band the mean falls in. It does not say what share of the school’s learners are proficient, because a mean of 60 can come from learners spread from 30 to 90. The public files hold means, so “27% of test-takers attend a school whose mean is Low Proficient” is the correct statement. “27% of learners are Low Proficient” is not available from these files.
| Region | Not Proficient | Low Proficient | Nearly Proficient | Proficient | Highly Proficient |
|---|---|---|---|---|---|
| CAR | 0.1% | 28.9% | 66.8% | 4.2% | 0.0% |
| Region I | 0.0% | 30.2% | 54.5% | 15.1% | 0.2% |
| Region III | 0.0% | 29.8% | 55.7% | 14.5% | 0.0% |
| Region IX | 0.1% | 38.3% | 55.5% | 6.2% | 0.0% |
| Region VIII | 0.1% | 16.7% | 48.2% | 34.3% | 0.6% |
| All assessed | 0.0% | 27.3% | 54.3% | 18.2% | 0.2% |
Census of schools, sample of learners
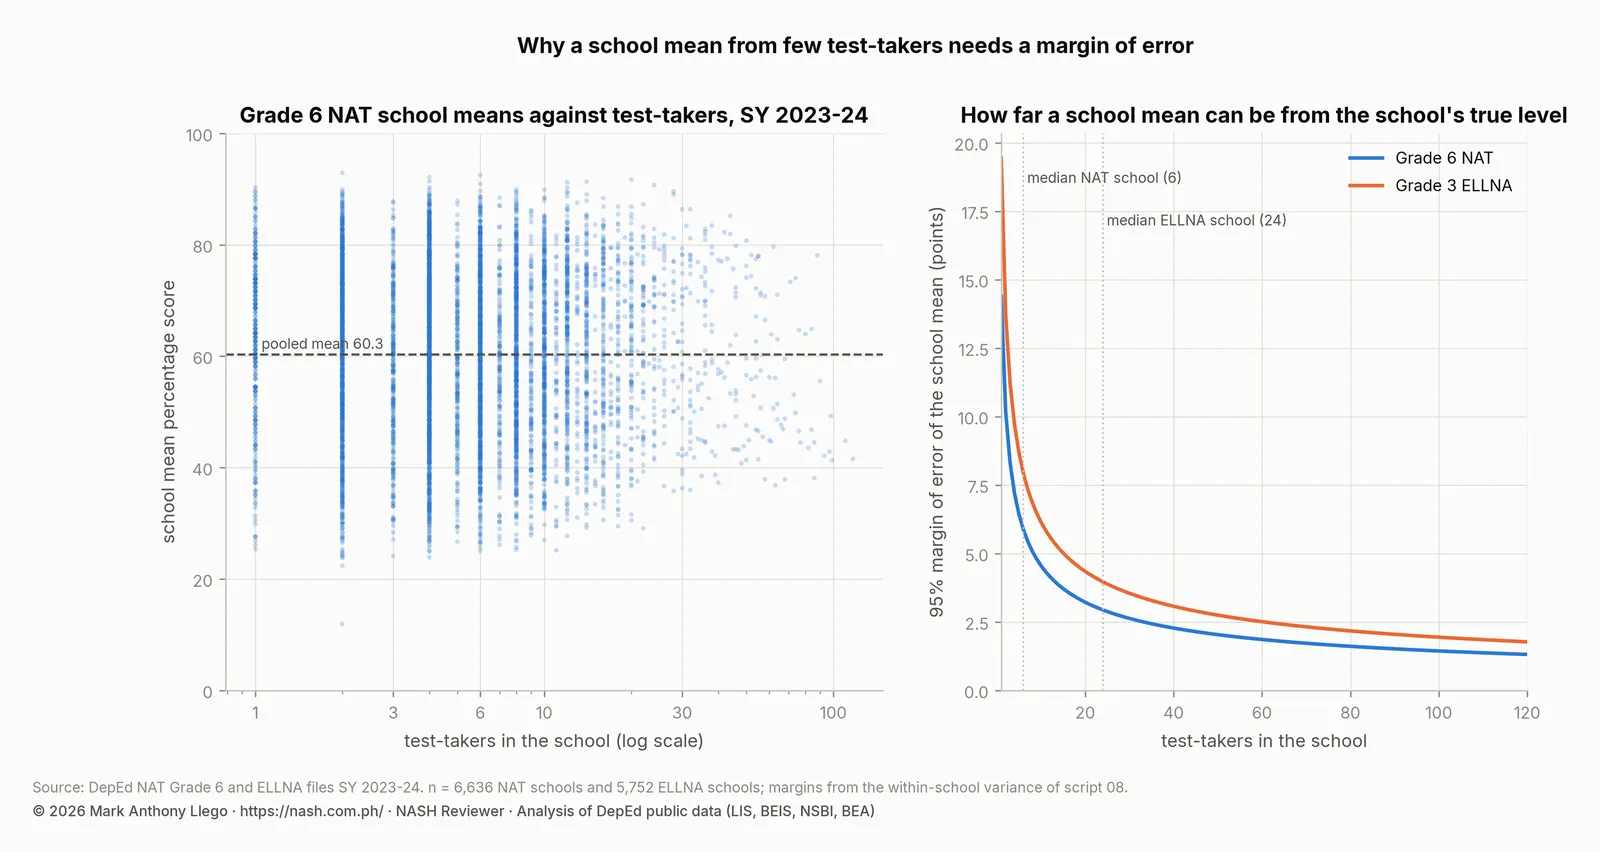
The SY 2023-24 NAT tested a census of schools but a sample of learners in each: 52,761 test-takers in 6,636 assessed schools, a median of six per school. The ELLNA tested 218,296 learners in 5,752 schools, a median of 24. Six learners is a very small sample, and the sampling design is not described in the release.
The margin of error of a school mean
A school mean from a sample of its learners sits some distance from the school’s true level. That distance shrinks with the square root of the number tested. The within-school spread of learner scores, estimated from the files themselves, gives a per-learner standard deviation of about 7.3 NAT points and 9.9 ELLNA points. The 95% margin of error of a school mean is then about 1.96 times that spread, divided by the square root of the number tested.
| Test-takers in the school | NAT: 95% margin of error (points) | NAT: weight on the school’s own mean | ELLNA: 95% margin of error (points) | ELLNA: weight on the school’s own mean |
|---|---|---|---|---|
| 1 | ±14.4 | 0.73 | ±19.4 | 0.63 |
| 2 | ±10.2 | 0.84 | ±13.7 | 0.77 |
| 3 | ±8.3 | 0.89 | ±11.2 | 0.83 |
| 6 | ±5.9 | 0.94 | ±7.9 | 0.91 |
| 10 | ±4.6 | 0.96 | ±6.1 | 0.94 |
| 12 | ±4.2 | 0.97 | ±5.6 | 0.95 |
| 20 | ±3.2 | 0.98 | ±4.3 | 0.97 |
| 24 | ±2.9 | 0.98 | ±4.0 | 0.98 |
| 30 | ±2.6 | 0.99 | ±3.5 | 0.98 |
| 50 | ±2.0 | 0.99 | ±2.7 | 0.99 |
| 100 | ±1.4 | 1 | ±1.9 | 0.99 |
At the NAT’s median of six test-takers, the margin is about ±6 points; at the ELLNA’s median of 24, it is about ±4. A NAT school mean of 52 from six learners is consistent with a true level anywhere from 46 to 58. The schools with the most extreme means are the ones with the fewest test-takers. Among schools with one to five test-takers, 10.6% have a mean below 40 and 9.5% have a mean above 80. Among schools with 21 to 50 test-takers, the shares are 4.2% and 9.1%.
| Test-takers per school | Schools | Test-takers | Mean of school means | SD of school means | SD of deviation from division mean | Schools below 40 | Schools above 80 |
|---|---|---|---|---|---|---|---|
| 1–5 | 3,153 | 9,460 | 61 | 14.9 | 13.1 | 10.6% | 9.5% |
| 6–10 | 2,167 | 16,449 | 59.8 | 14.3 | 12.2 | 9.8% | 7.5% |
| 11–20 | 966 | 14,009 | 61.1 | 14.5 | 12.5 | 8.9% | 9.1% |
| 21–50 | 287 | 8,573 | 62.4 | 13.7 | 11.6 | 4.2% | 9.1% |
| over 50 | 63 | 4,270 | 56.1 | 12.6 | 11.5 | 6.3% | 0.0% |
Three practical rules follow. Never read a school mean without its number of test-takers. Treat a difference between two schools, or between one school and its division, as real only if it exceeds the combined margin. And expect a school’s mean to move several points from one year to the next for no reason other than which six learners were sampled.
Shrinkage toward the division mean
When a school’s mean rests on few learners, the best estimate of its true level is not the raw mean. It is a weighted average of the raw mean and its division’s mean, with the weight on the school’s own mean rising with the number tested. This is called shrinkage, and the weights are in the table above: 0.94 at six NAT test-takers, 0.99 at thirty. The chart shows what it does: schools with few test-takers move toward their division mean, and schools with many barely move.
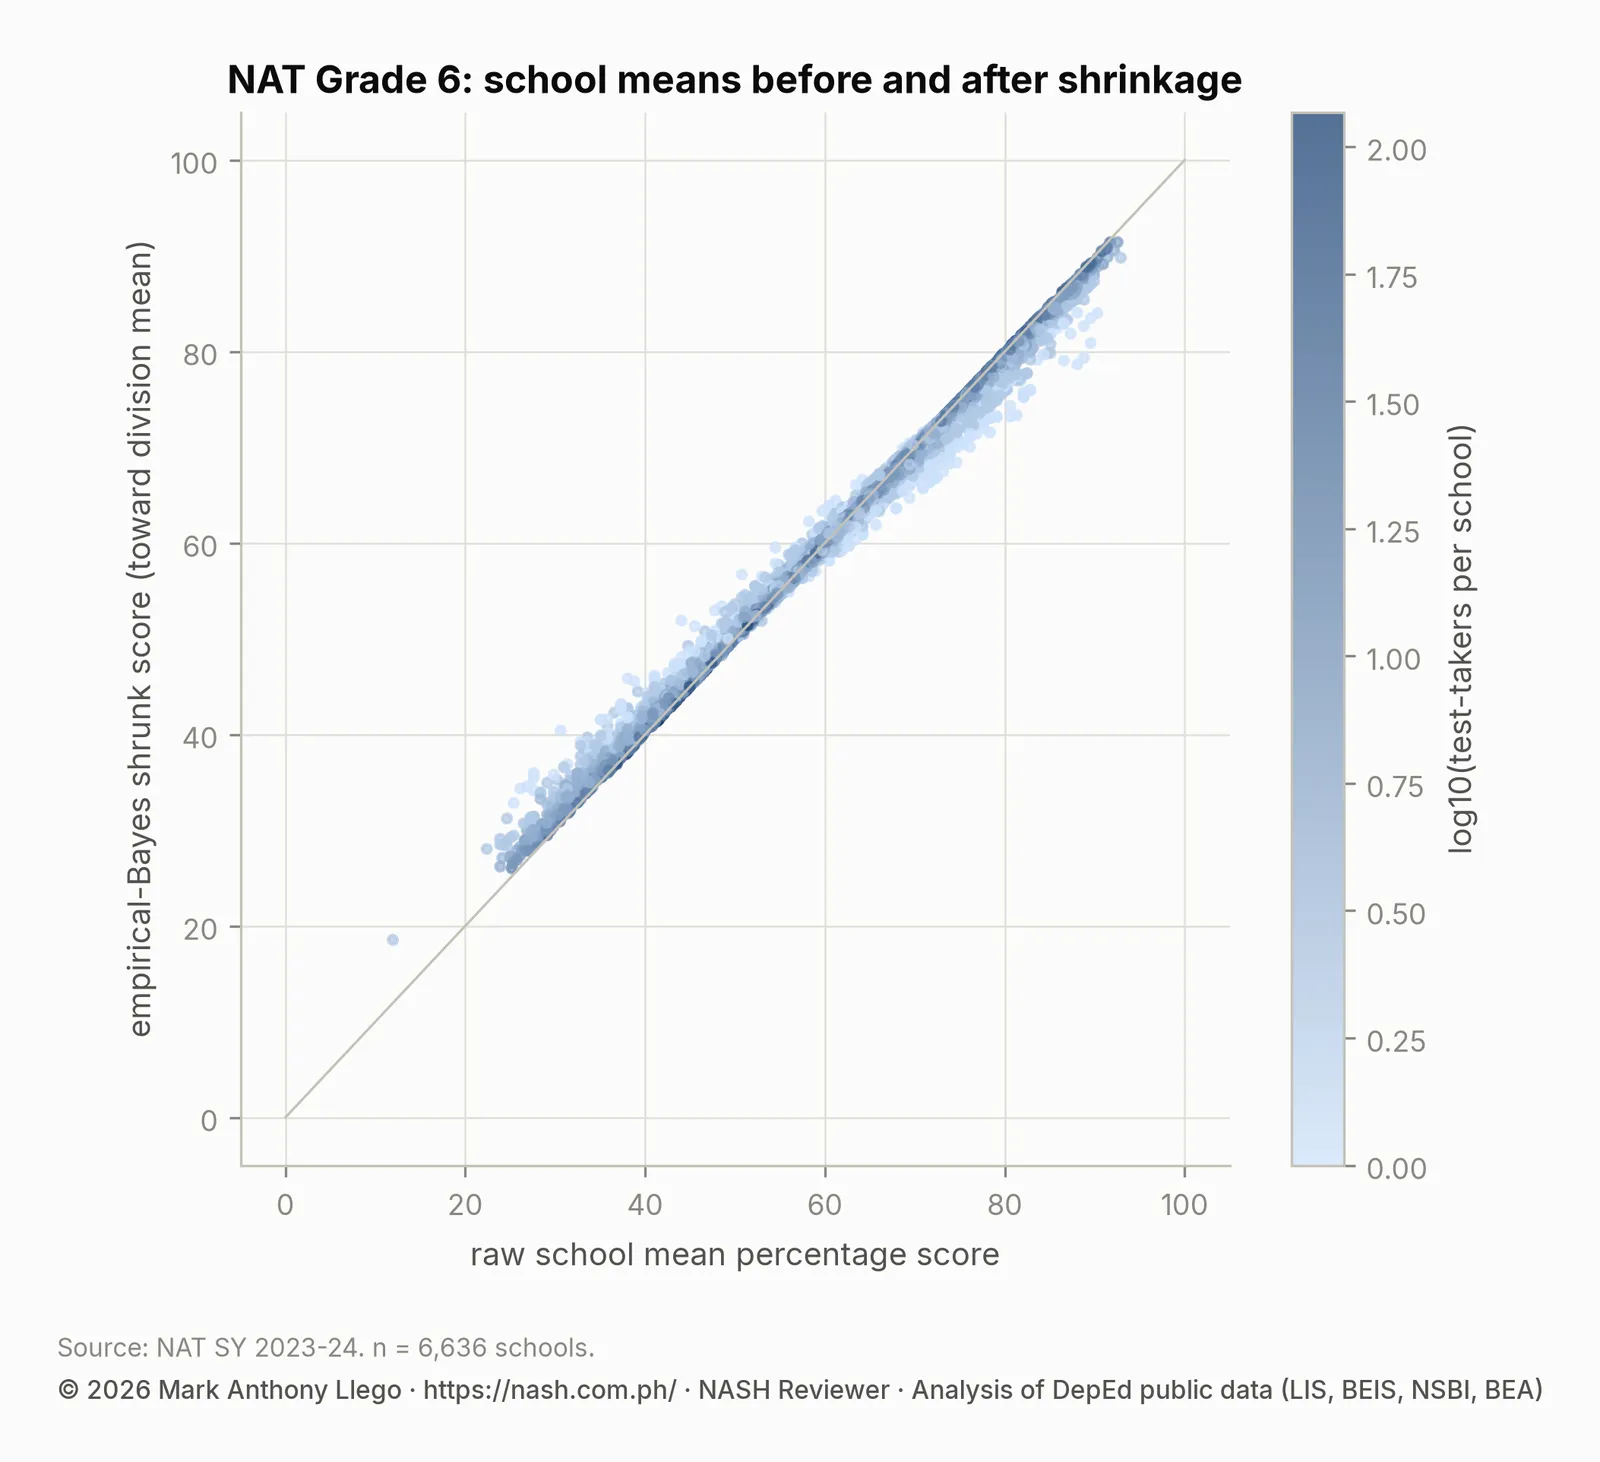
Shrinkage changes rankings at the tails. Of the 100 lowest raw NAT school means, 18 leave the bottom 100 after shrinkage; of the 100 lowest ELLNA means, 9 do. A ranked table of raw school means from these files would be wrong about one school in five at the bottom. That is exactly where a ranked table is used to assign blame.
Comparing divisions
Division estimates rest on hundreds of schools and thousands of test-takers, so they are precise where school means are not. The reports compute each division’s test-taker-weighted mean and a 95% interval by resampling schools within the division 2,000 times. This captures both the learner sampling and the school-to-school variation.
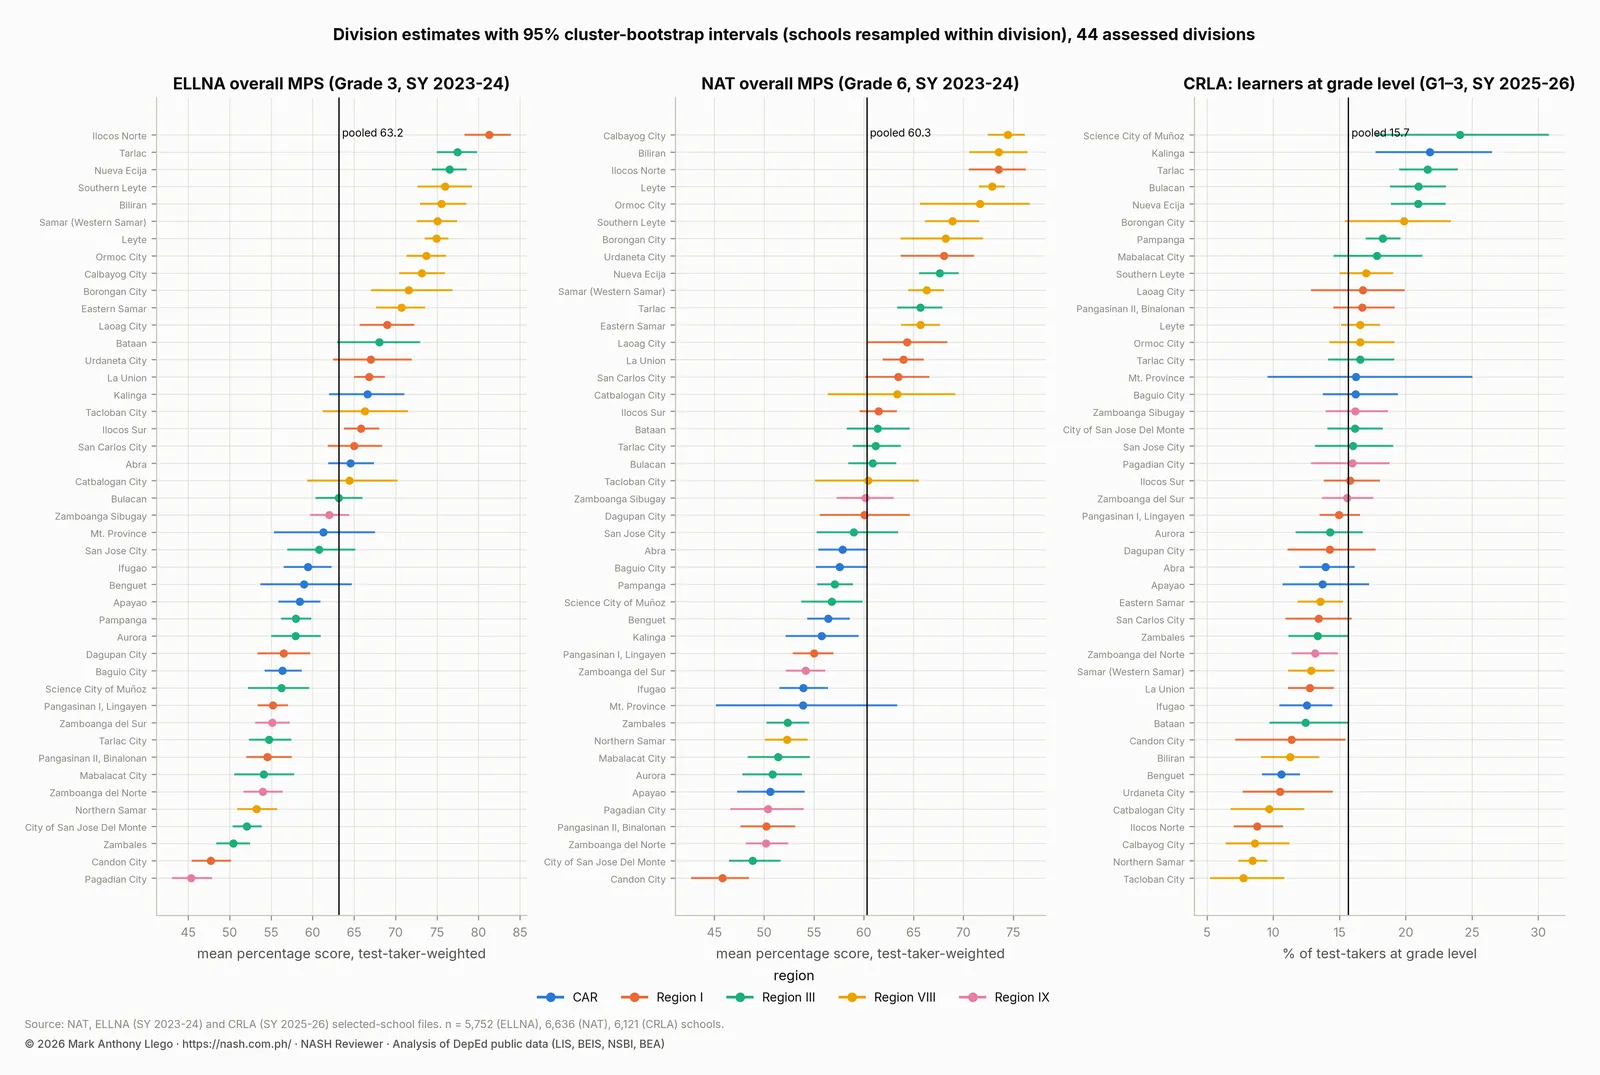
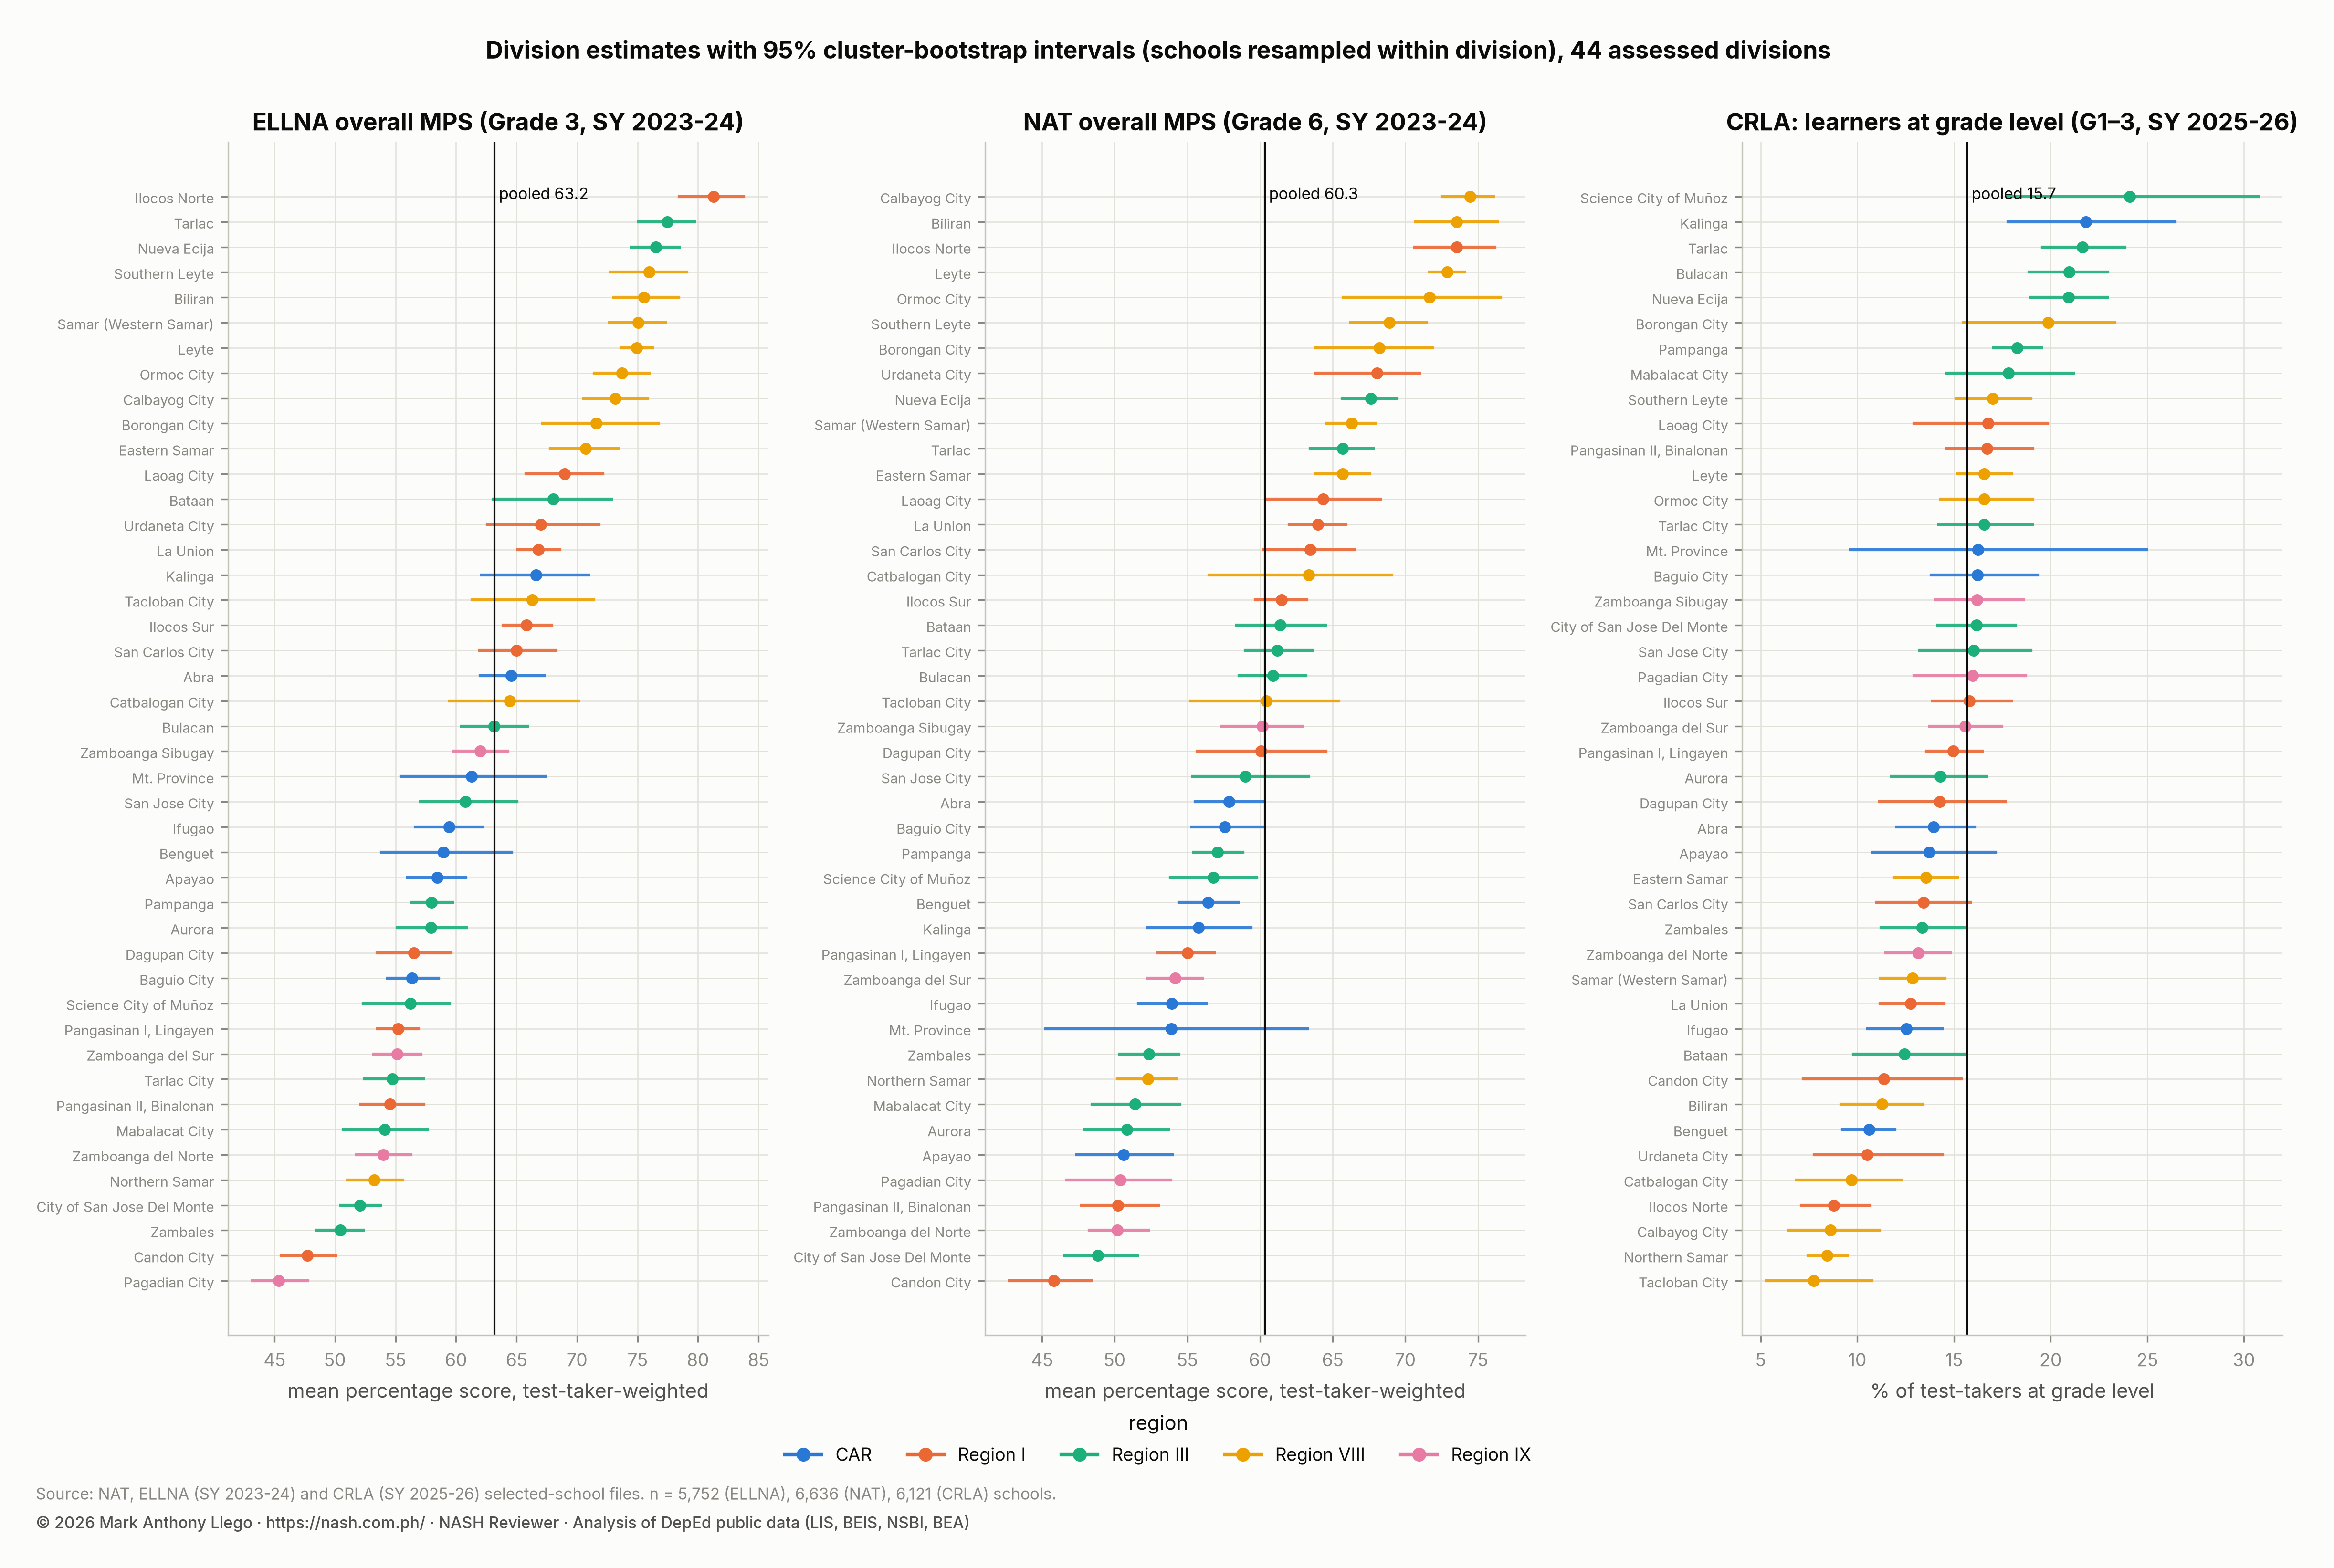
In a dot-and-interval chart, the dot is the estimate and the bar is the range the true value is likely to lie in. Two divisions whose bars overlap substantially are not reliably different. NAT division means range from 45.8 in Candon City to 74.4 in Calbayog City, with intervals about a point wide. The extremes are therefore not in doubt; the middle of the order is. When 44 divisions are each compared with the pooled mean, some will differ by chance. The reports adjust for the 44 comparisons (a Benjamini-Hochberg adjustment); after the adjustment, 18 NAT divisions are significantly below the pooled mean and 13 are above.
A rank is less stable than an estimate. Recomputing division ranks with alternative estimators (unweighted means, school medians, shrunk means, public schools only) moves NAT ranks by up to about 15 places. It keeps 8 to 10 of the bottom ten in common. ELLNA ranks move by at most 7 places.
| Assessment | Alternative estimator | Rank correlation with baseline | Bottom-10 divisions in common | Largest rank change |
|---|---|---|---|---|
| ELLNA | unweighted mean | 0.987 | 9 | 7 |
| ELLNA | school median | 0.984 | 9 | 5 |
| ELLNA | weighted mean n ge 10 | 1 | 10 | 1 |
| ELLNA | weighted mean shrunk | 1 | 10 | 0 |
| ELLNA | public only weighted mean | 1 | 10 | 0 |
| NAT | unweighted mean | 0.966 | 10 | 11 |
| NAT | school median | 0.955 | 8 | 16 |
| NAT | weighted mean n ge 5 | 0.991 | 8 | 5 |
| NAT | weighted mean shrunk | 1 | 10 | 0 |
| NAT | public only weighted mean | 0.992 | 10 | 6 |
Proportions and their intervals
The CRLA gives counts of learners at each level, so its shares are proportions with ordinary confidence intervals. Across the assessed schools, 15.7% of 647,681 Grade 1 to 3 learners read at grade level; in Grade 1 mother tongue, 5.3% do (interval 5.0% to 5.7%). A proportion’s interval narrows with the number of learners. A school’s Grade 1 proportion from 28 learners has an interval about ±18 points wide. That is why the CRLA is a screening tool for deciding which learners need what, and not a precise instrument for ranking schools.
When the CRLA, ELLNA, and NAT disagree
In the same schools, the CRLA share at grade level correlates at only 0.06 with the Grade 3 ELLNA mean, while the ELLNA and NAT means correlate at 0.62. Ilocos Norte is first of 44 divisions on the ELLNA and 41st on the CRLA. The files cannot say which of three things explains this: the instrument (a teacher-administered reading screen against a multiple-choice test), the cohort (two years apart), or the undocumented way the CRLA’s school summary is compiled. What a reader can conclude is that the three are not interchangeable measures of a school. EDCOM II’s finding of “no conceptual alignment across assessments” appears at school level.
What the assessment files cannot do
The assessment files cannot give trends, because each holds one round and difficulty differs by year. They cannot give shares of proficient learners, only means. They cannot describe the 13 regions not covered, or the unassessed schools in the covered divisions. They cannot rank schools reliably on the NAT. And they say nothing about classroom grades, where EDCOM II finds that the transmutation table of DepEd Order No. 8, s. 2015 turns an initial grade of 60 into 75. A school’s promotion rate and its NAT mean measure different things.
Part 8. Reading associations between inputs and results
School heads are asked, and ask themselves, whether an input causes a result, for example whether more computers mean better scores. The files can show associations; they cannot show causes.
Correlation and confounding
Connected schools score higher on the NAT. They are also urban, larger, better staffed, and in richer barangays. Any of those could be the reason. A variable that explains a correlation but is not in the comparison is called a confounder. The public files leave out the biggest ones: household poverty, teacher quality, and the instructional time actually delivered.
The inputs and outcomes analysis removes what it can. It compares schools only within the same division (division fixed effects) and holds school size and the share of IP learners constant. It weights by test-takers and adjusts the intervals for the clustering of schools in divisions. What remains is still an association, but a more informative one.
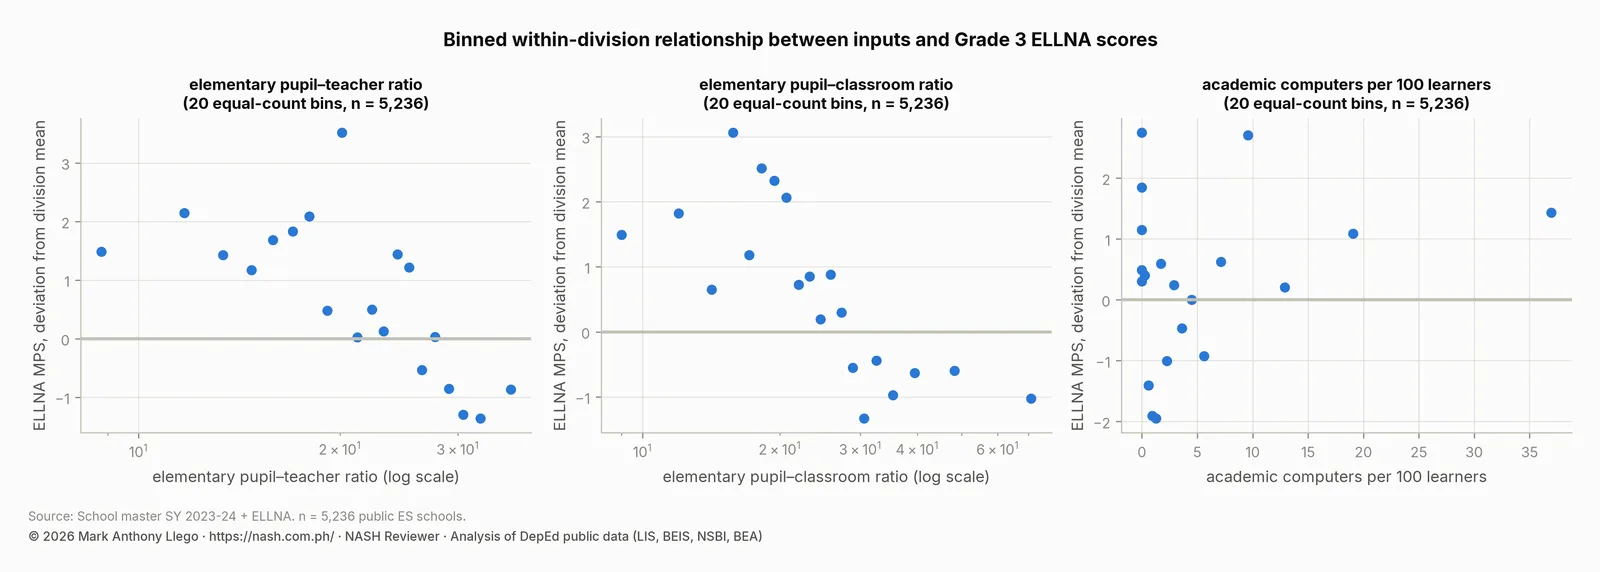
Reading a binned scatter
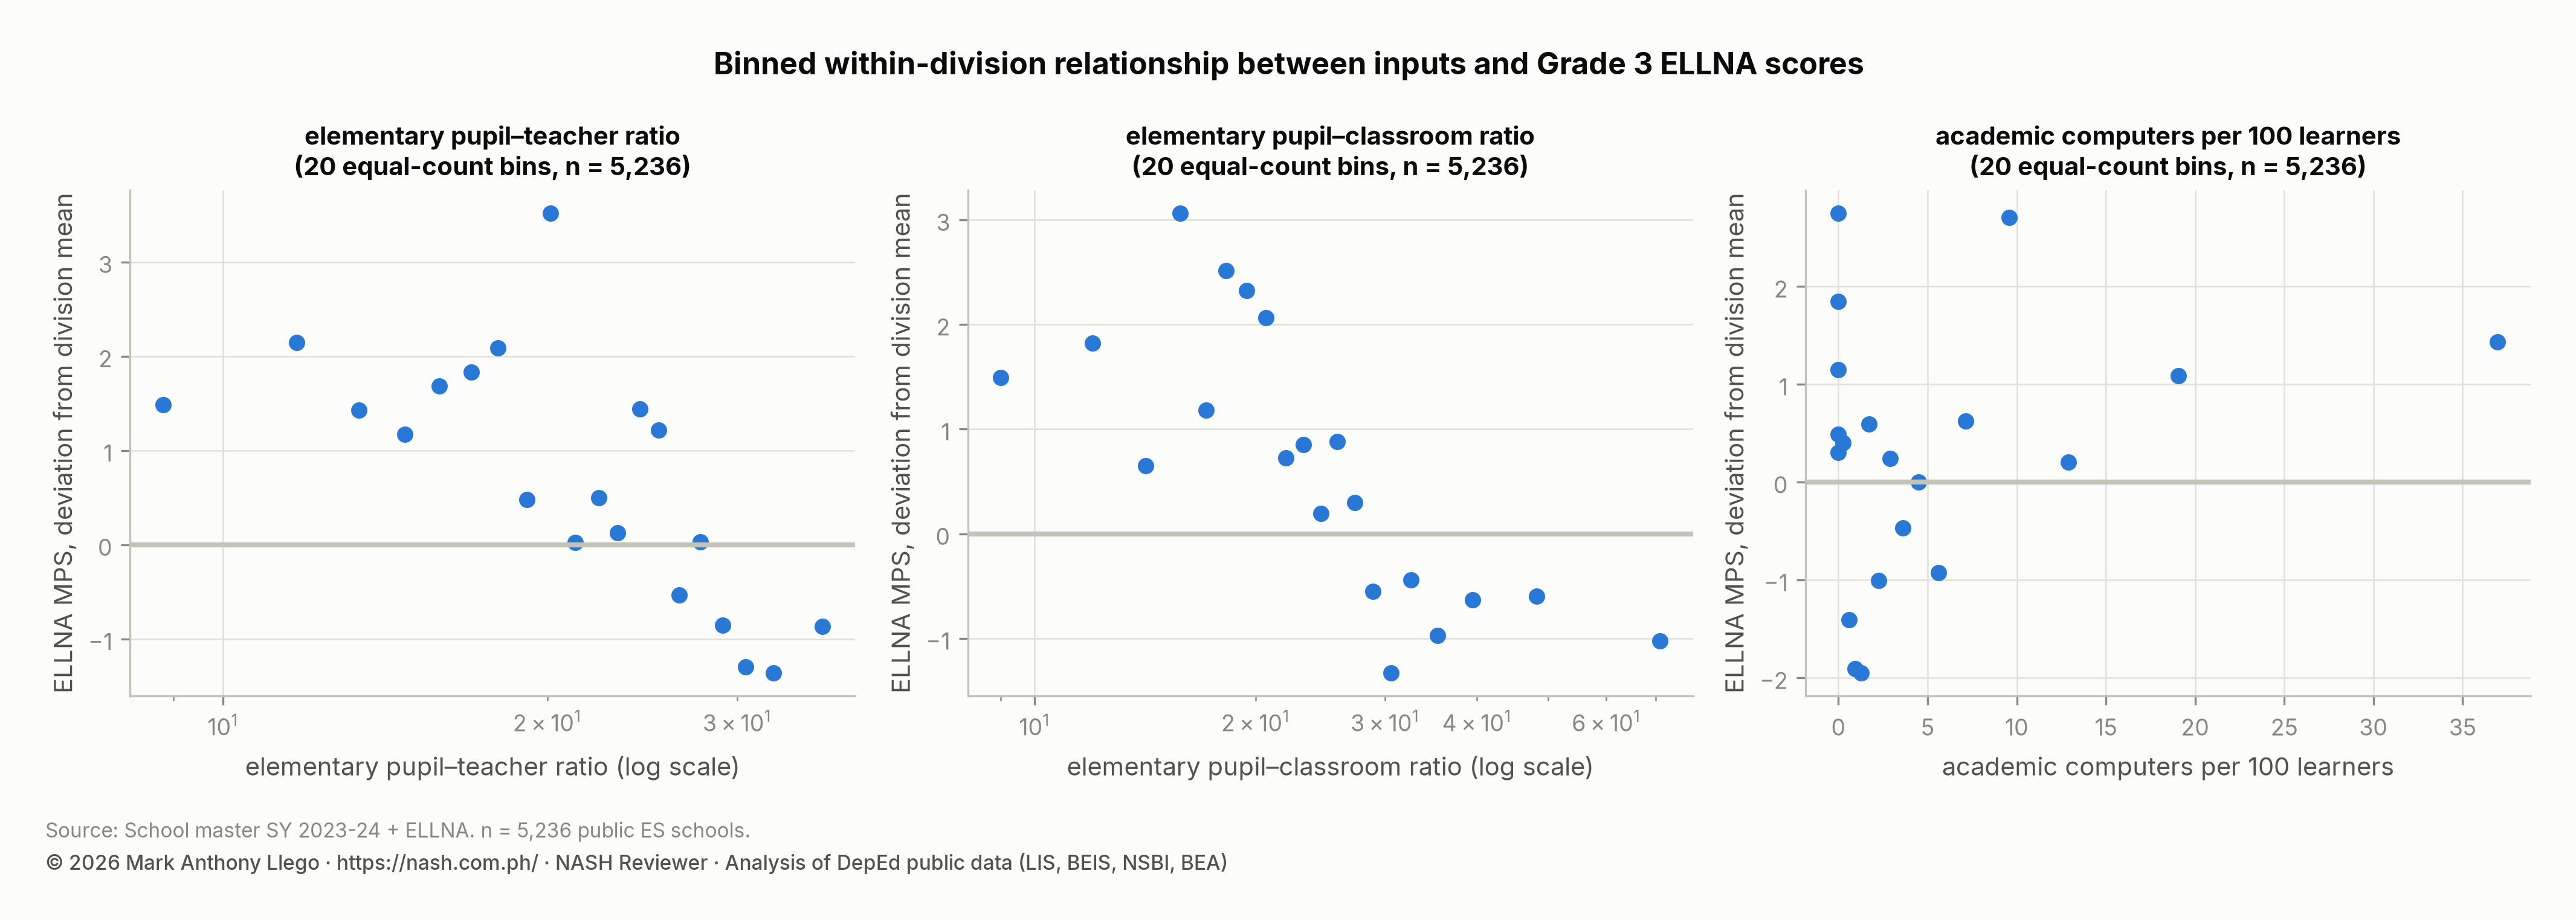
A binned scatter groups schools into bins of the input and plots each bin’s average outcome. It shows the shape of a relationship without plotting all 6,000 points. The ELLNA chart shows the score, as a deviation from the division mean, against the pupil-teacher ratio, the pupil-classroom ratio, and computers per 100 learners. The first two slope gently downward within about two points; the third shows no pattern.
Reading a coefficient plot
A coefficient plot shows, for each input, the estimated change in the outcome per unit of the input, with its interval. Inputs are standardized so that the units are comparable: the coefficient is the change in the outcome for a one-standard-deviation change in the input. An interval that crosses zero means the data cannot distinguish the association from none.
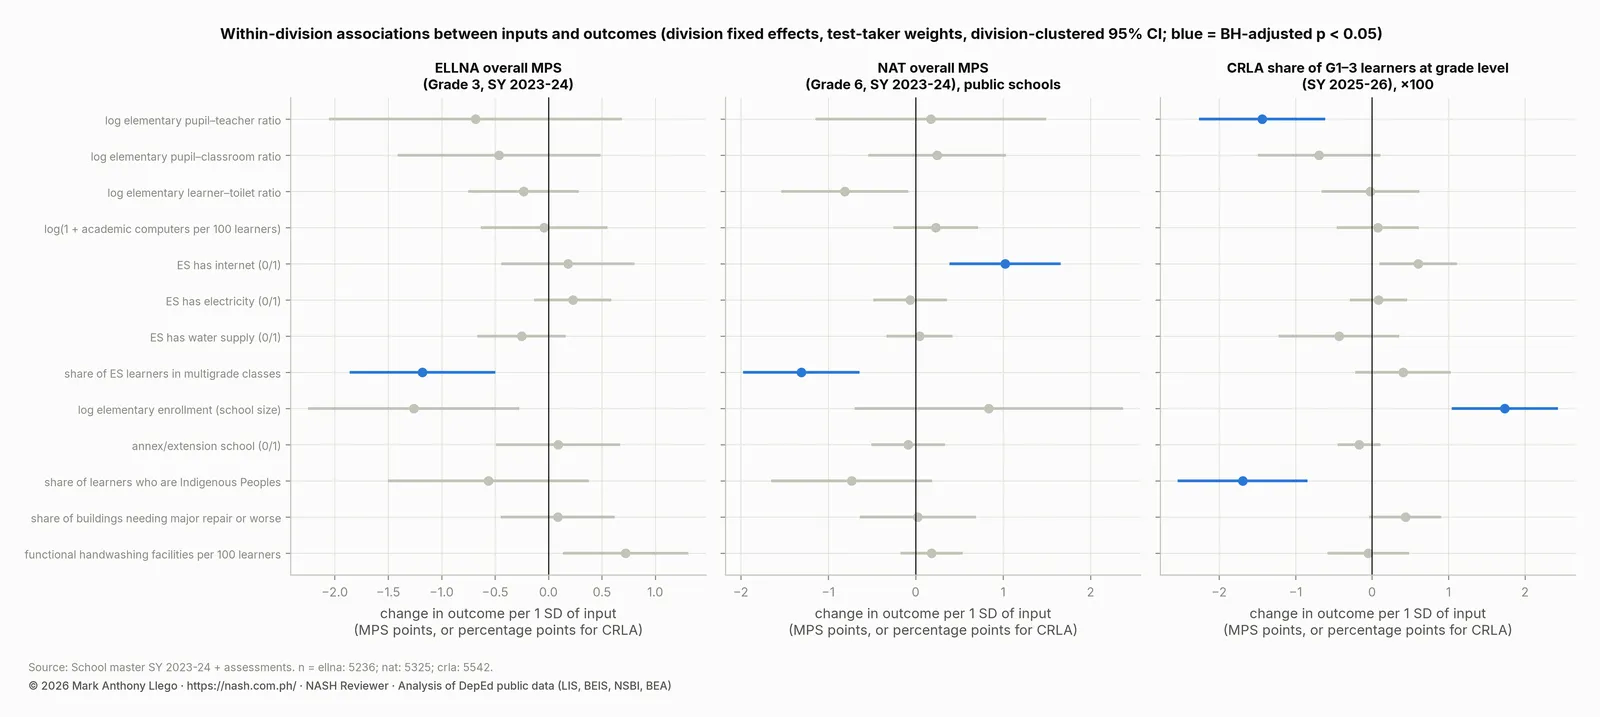
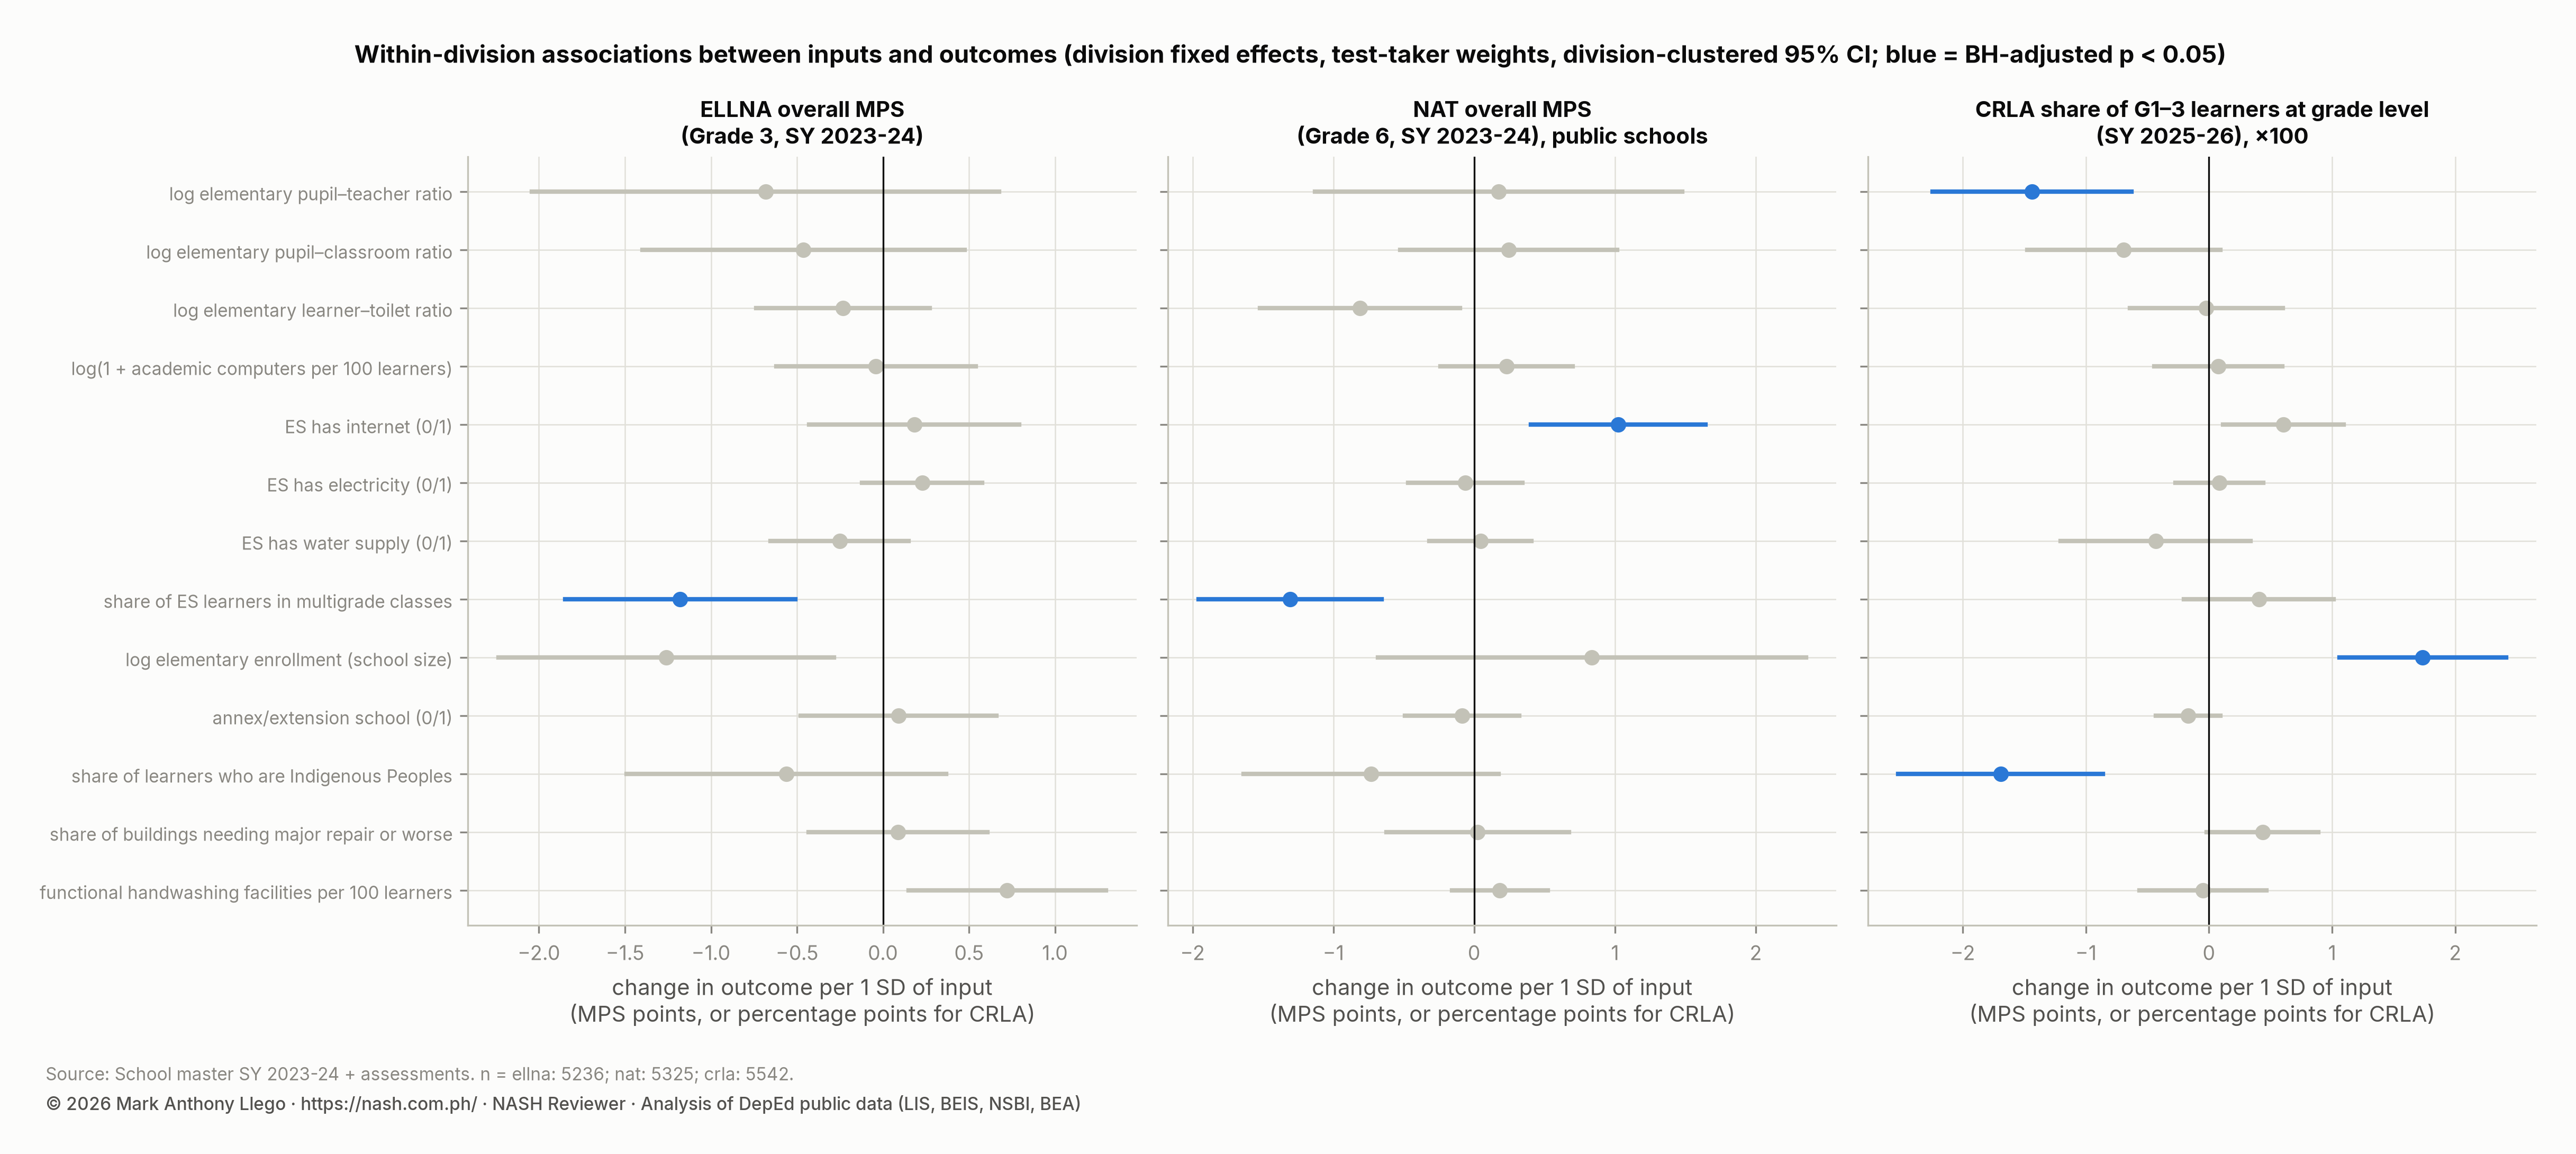
The associations that remain significant after adjustment for multiple comparisons are these. The multigrade share: −1.2 ELLNA points and −1.3 NAT points per standard deviation, which is about four points between a fully monograde and a fully multigrade school in the same division. Elementary internet access: +2.6 NAT points and +1.5 percentage points more early readers at grade level. The pupil-teacher ratio: −1.4 percentage points of readers at grade level per standard deviation, about four points between a school at 15 and one at 45 learners per teacher. It shows no detectable association with Grade 3 or Grade 6 scores. School size and the IP share, for early reading. Classrooms, toilets, and computers per learner show nothing.
Effect sizes and robustness
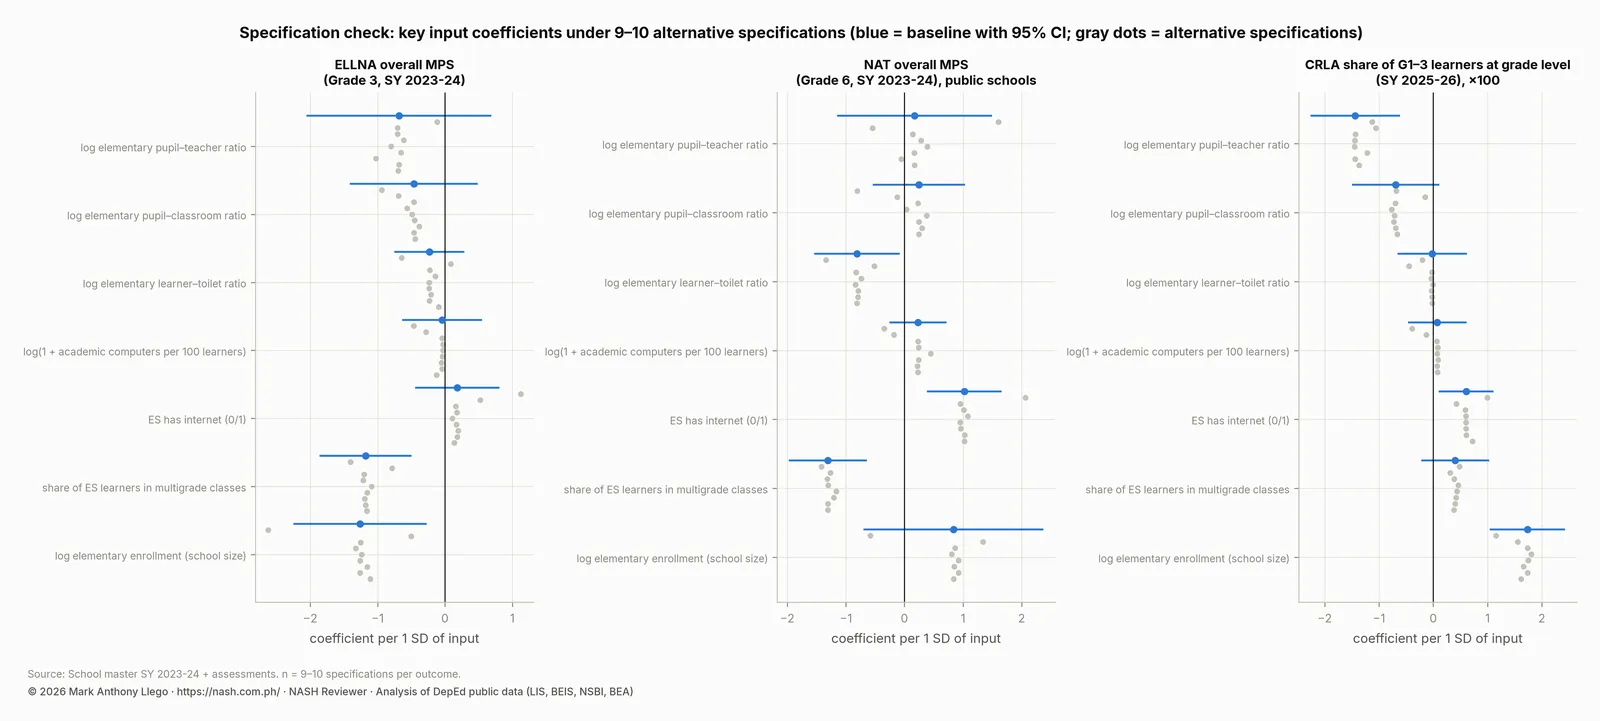
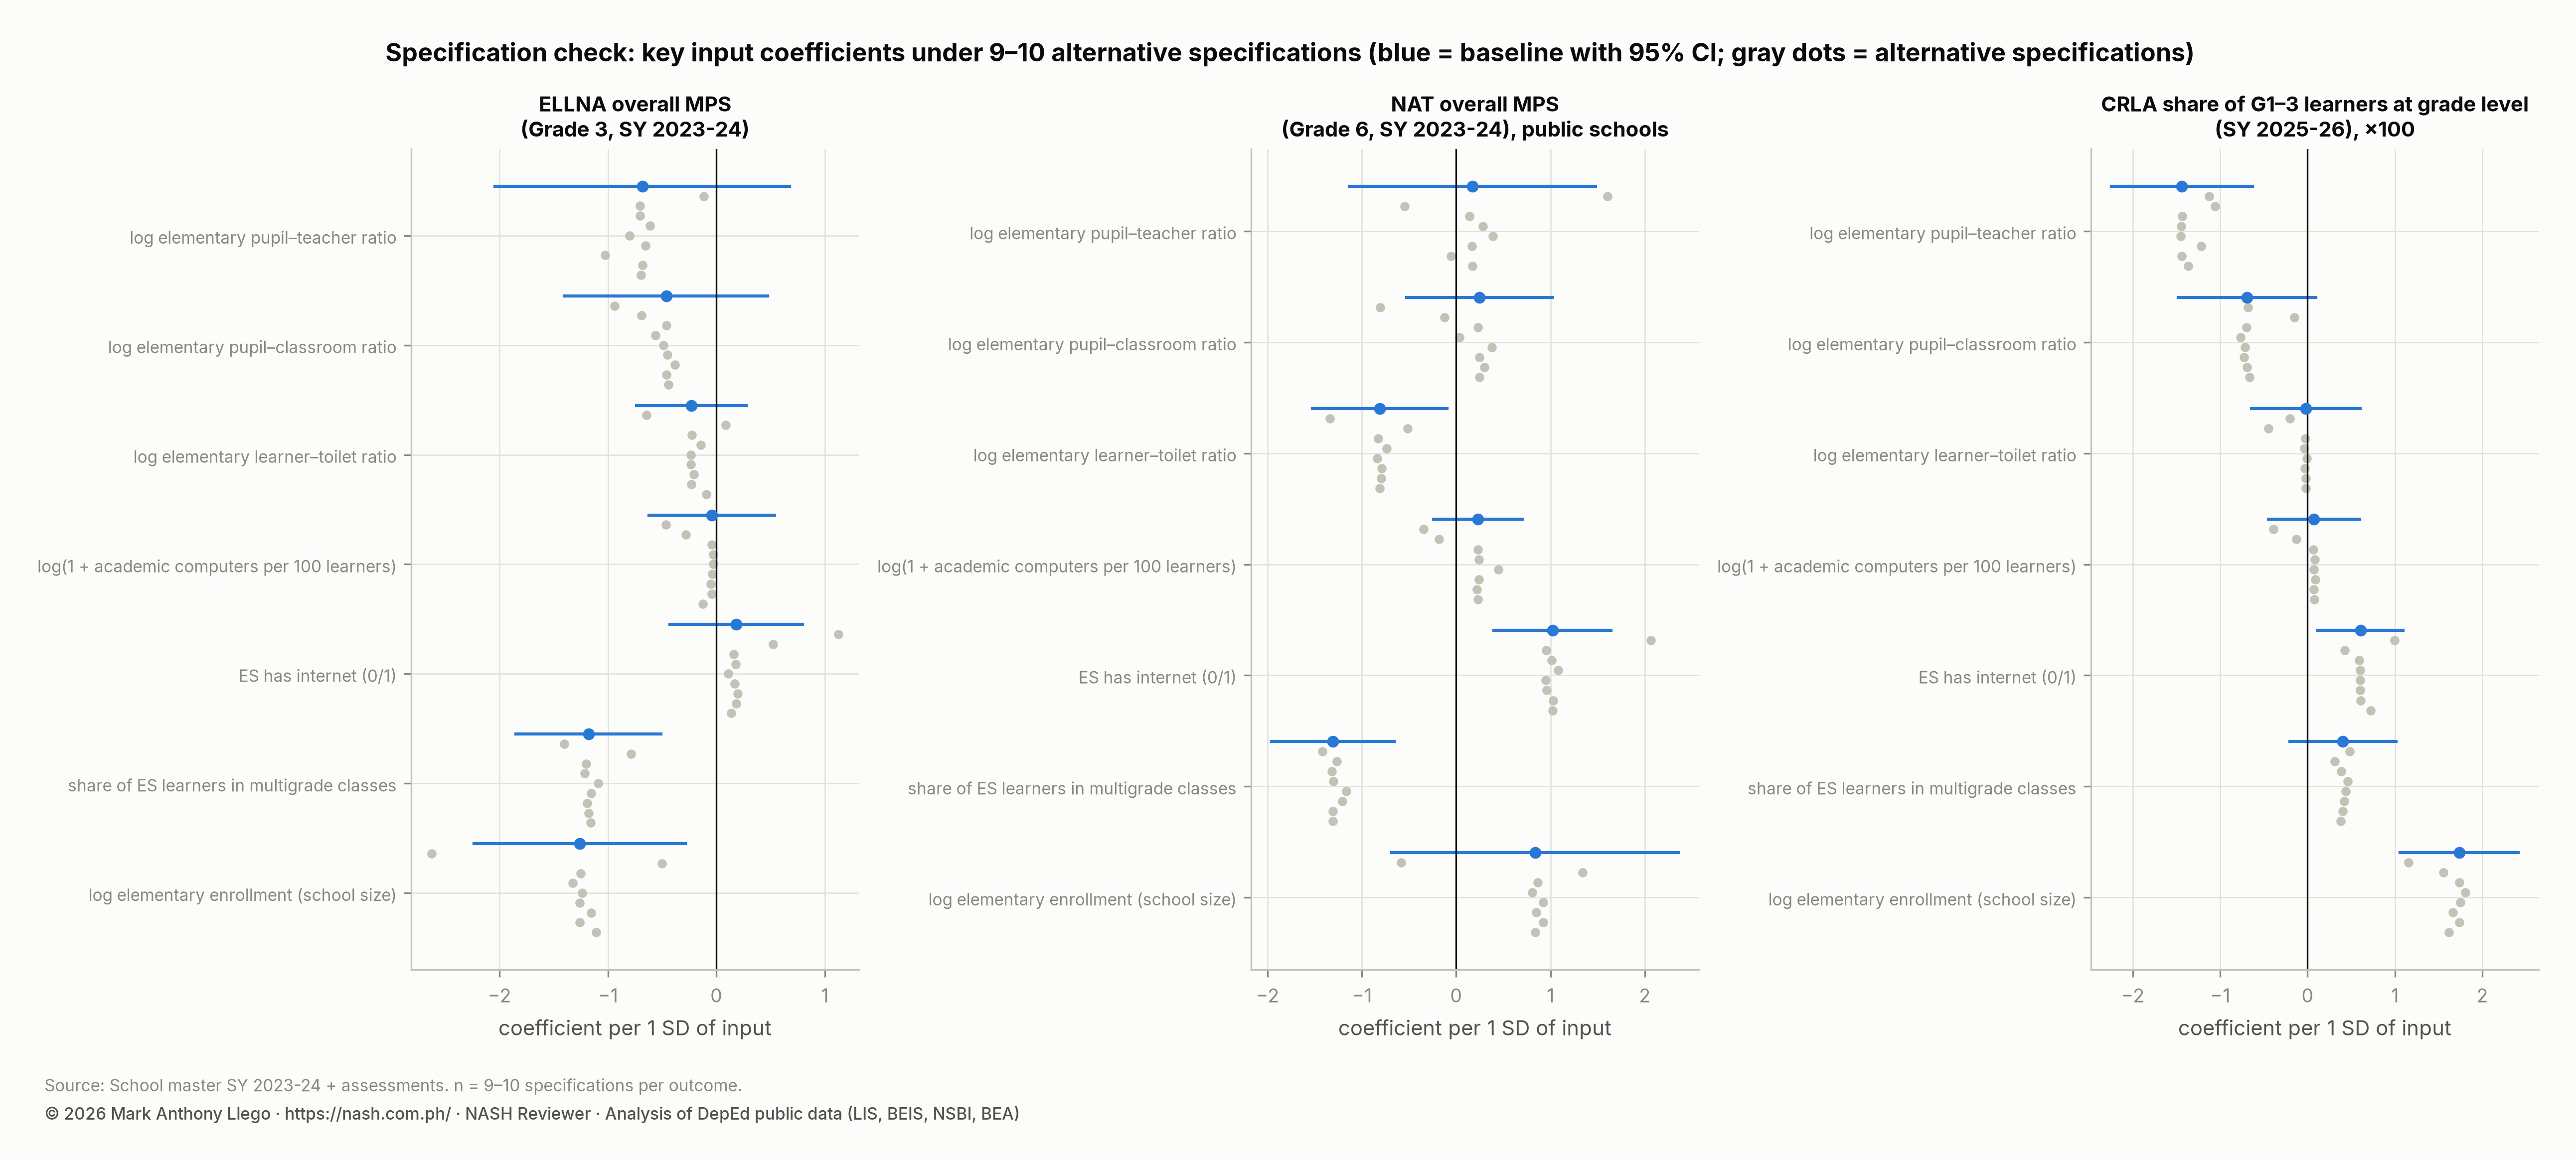
The largest association is 0.15 standard deviations of the outcome. Which division a school is in explains far more. The intraclass correlation is 0.22 to 0.25 for ELLNA and NAT, meaning about a quarter of the variation in school means is between divisions. An association that is small, and that changes sign when the model is changed, is not a basis for action. The specification chart re-estimates the key coefficients under nine or ten alternative models. Multigrade, internet, and school size keep their sign in every one.
From association to action
The right use of an association is to decide where to look, not what to conclude. The multigrade finding says a multigrade school head should expect a gap and plan for it; it does not say that converting classes to monograde would close it. The internet finding says connectivity is worth pursuing and a box of tablets without it is not; it does not say a router raises scores. EDCOM II’s own example teaches the same lesson. A UNICEF-DOF study links a 1% increase in Maintenance and Other Operating Expenses (MOOE) to a 3.1 to 3.8 point rise in Grade 6 NAT scores, “with these gains disappearing after controlling for poverty incidence”.
Part 9. Reading charts and tables
The chart checklist
Before reading the shape of any chart, read the parts around the data. These are the title (what is measured), the axis labels and units, where the axis starts, the number of observations, the source, the date, and whether intervals are drawn. A chart in this series carries all of these in its title, axes, and footer. A chart that lacks them should be read with caution.
Where the axis starts
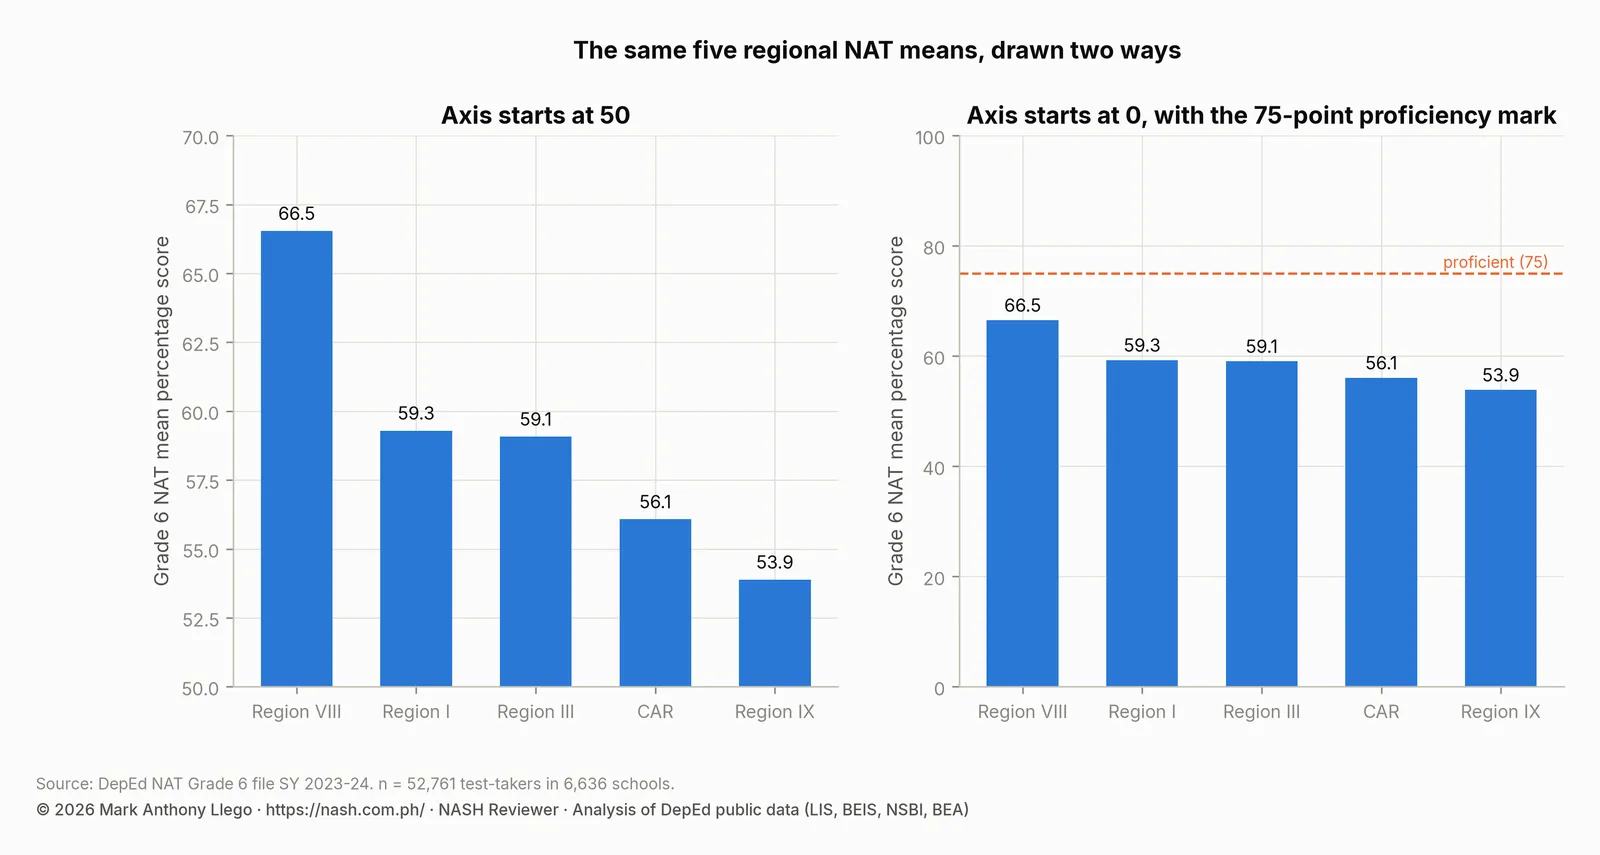
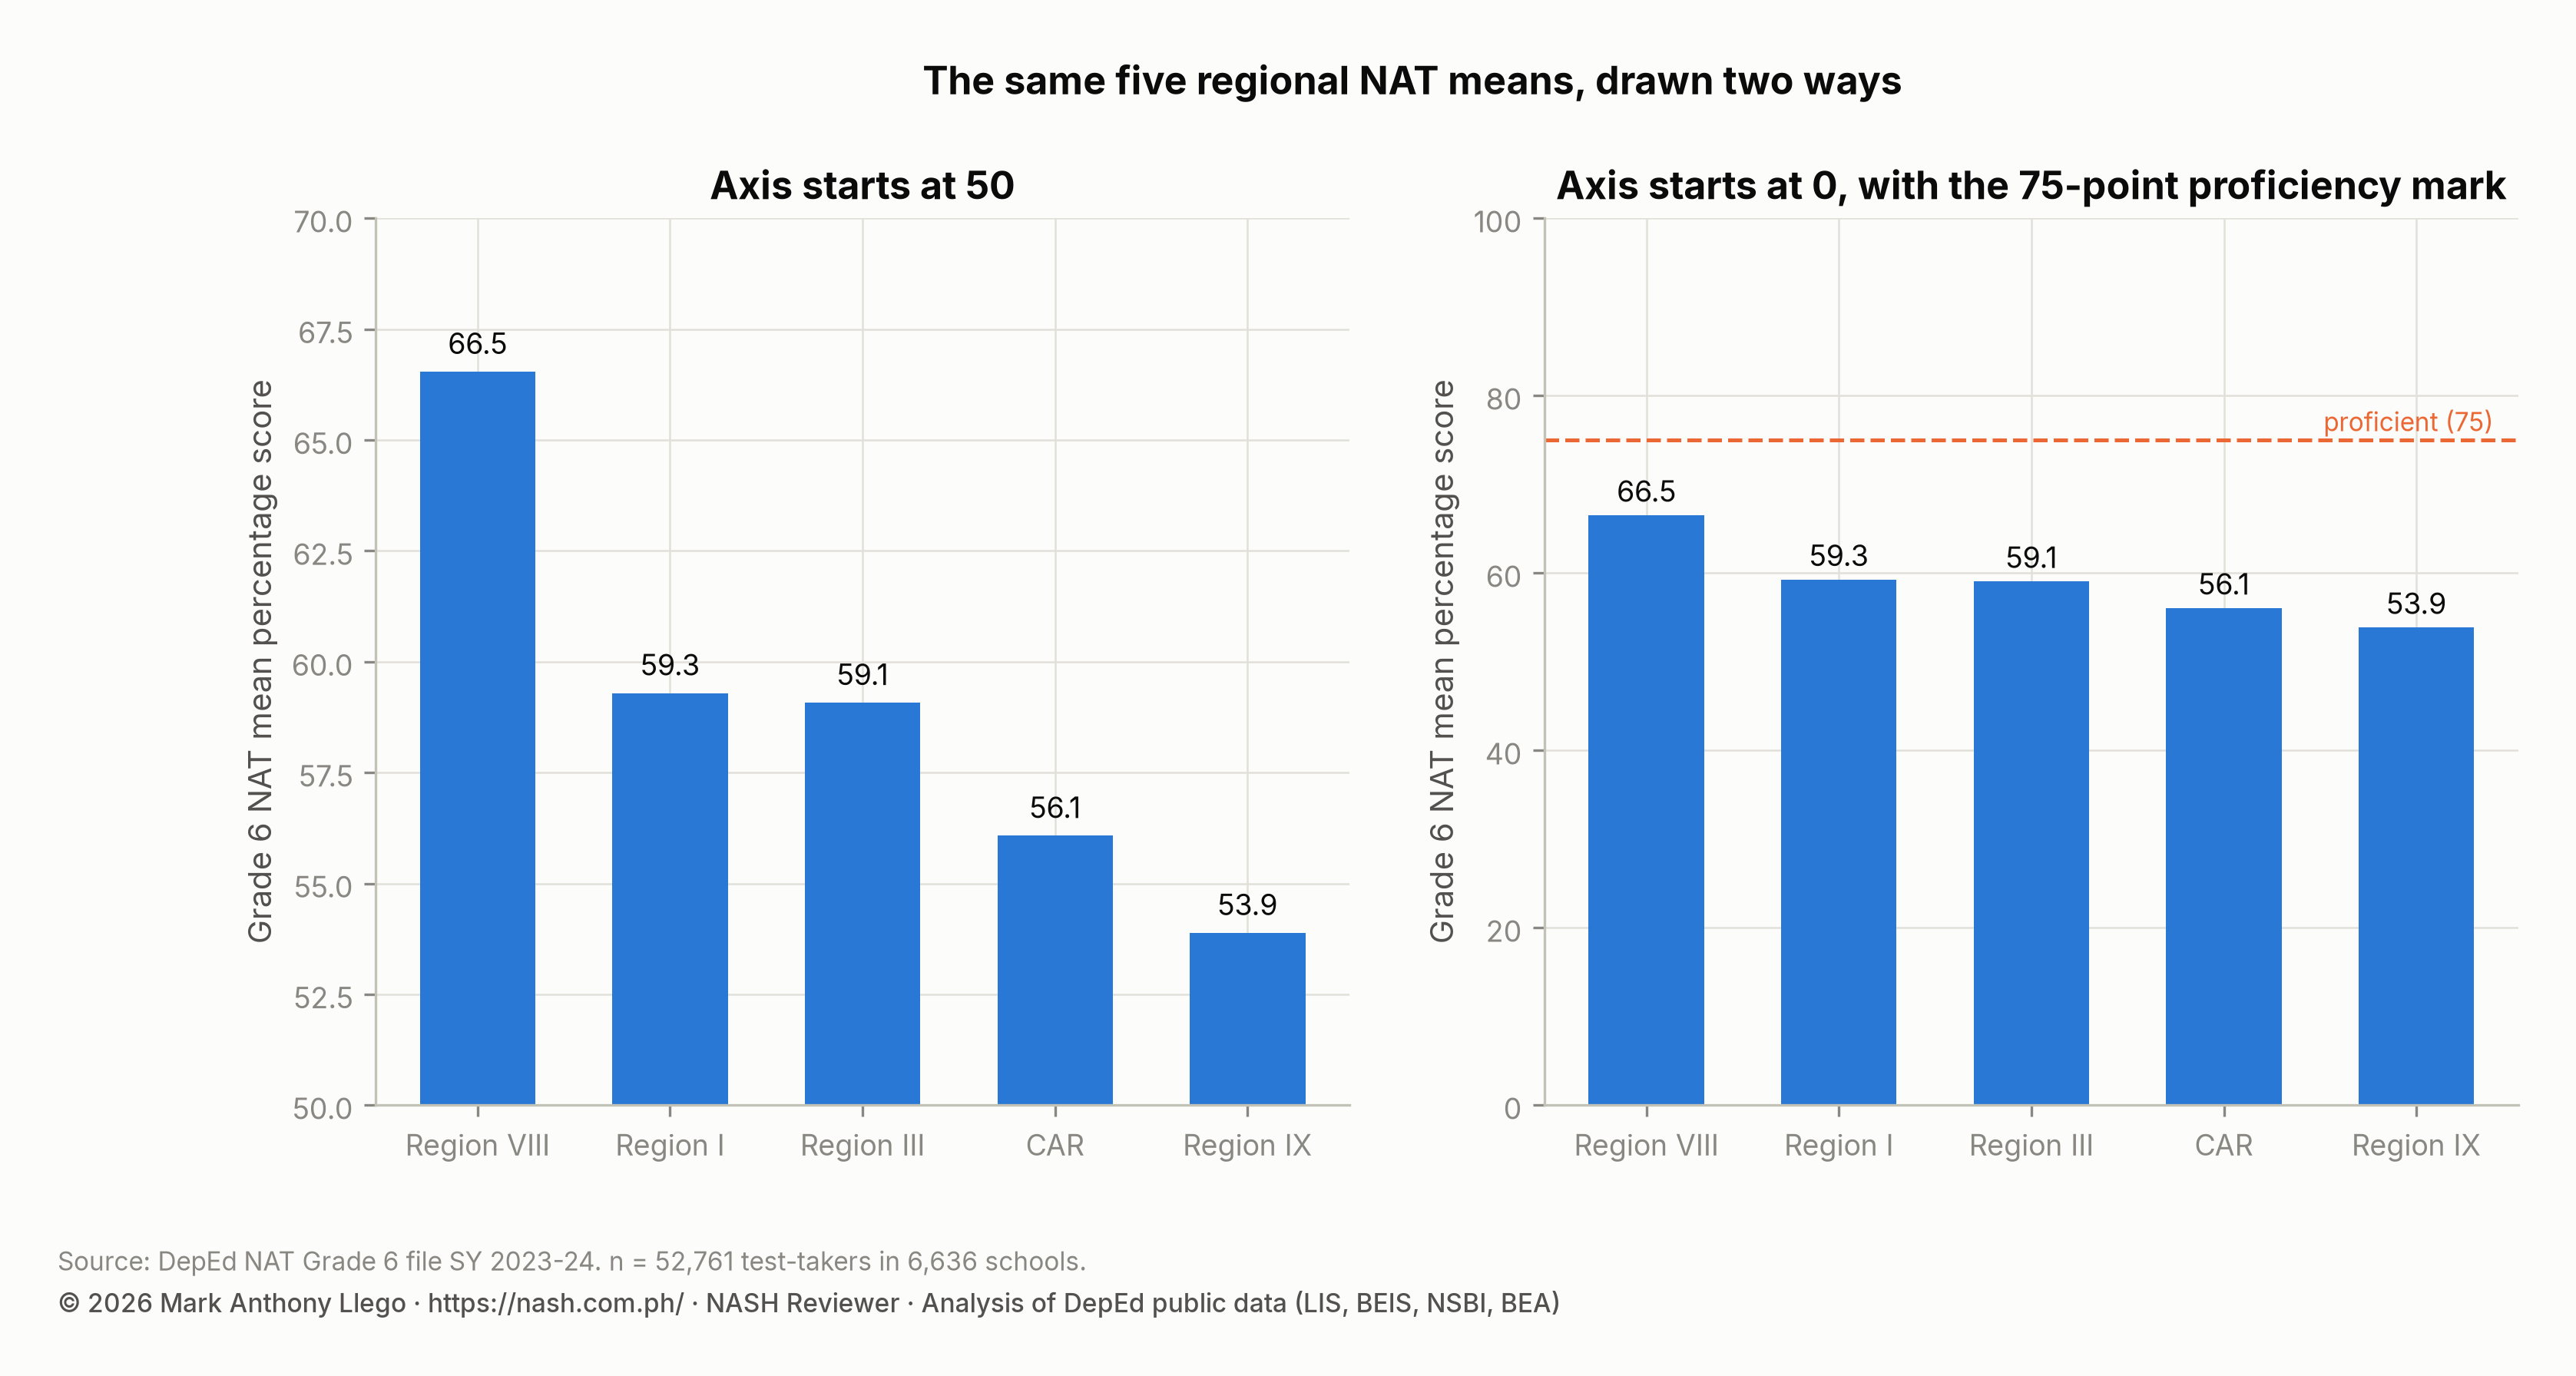
The same five regional NAT means drawn with the axis starting at 50 and at 0 give different impressions. In the first, Region VIII’s bar is four times Region IX’s. In the second, every region is below the 75-point proficiency mark and the differences are modest. The data did not change. Bar charts should start at zero, because the length of a bar is what the eye compares. Line charts of a rate can start elsewhere if the axis says so.
Scales and transforms
A logarithmic axis compresses large values and expands small ones. It is right for ratios and sizes that span orders of magnitude (school size runs from 1 to over 10,000 learners) and wrong for a score from 0 to 100. An index (Part 3) shows proportion, not size. A share of a total shows composition, not level: the Technical-Vocational-Livelihood (TVL) track’s share of senior high school can fall while its enrollment rises.
Chart types and what each hides
A line chart shows change over time and hides the number behind each point. A stacked bar shows composition and makes the middle segments hard to compare. A dot-and-interval chart shows estimates with their uncertainty and is the right form for comparing divisions. Small multiples (the eighteen regional panels in the enrollment report) show many series at once without crowding them into a single plot. A scatter shows a relationship and hides its direction of cause. A ranked table without intervals shows an order that may not exist.
What to distrust in a chart
Distrust two vertical axes on one chart, because the eye reads a crossing that the two scales created. Distrust a truncated bar axis, a percentage without its base, and a trend across years for a test that is not equated. Distrust a rank of schools on means from six learners, and a cumulative total presented as annual. Distrust a map colored by a count rather than a rate, which colors large places dark, and a chart that does not state its number of observations (n).
Part 10. From reading data to leading a school
Reading data is a PPSSH competency because it ends in a plan, a target, a request, and a conversation.
The school data pack
Pull these twelve items from the public files, or from the LIS and the Basic Education Information System (BEIS), for any school you are asked to lead or to compare with yours:
- Enrollment by grade and sex for at least five years, and the grade profile this year.
- Cohort ratios between grades, computed from item 1.
- Learner types: Indigenous Peoples, ALIVE, Balik-Aral, alternative delivery, multigrade classes, and the language of instruction.
- Teaching positions by title, master teachers, locally funded teachers, and the school-leadership position.
- The pupil-teacher ratio, with the regional aggregate and the median school beside it.
- Buildings by condition, instructional rooms, makeshift rooms and temporary learning spaces, and the pupil-classroom ratio.
- Functional and non-functional toilet bowls, handwashing facilities, water, electricity.
- Academic computers by type and funding source, and the internet flag by level.
- The CRLA profile by grade and language, with the number of learners screened.
- The ELLNA and NAT means by component or subject, with the number of test-takers and the margin of error.
- The division’s estimates and intervals for the same tests.
- The data quality notes: which cells are blank, which values look impossible, and which year’s conventions apply.
A one-page situational analysis
Write one page, in this order. The school in numbers (items 1, 3, and 4). Where it stands (items 5 to 8, against the division and the median school). What learners can do (items 9 and 10, with margins). What the data cannot say (coverage, sampling, blanks). Three findings, each a sentence with a number and its base. Three implications for the plan. This is indicator 1.2.1’s situational analysis and indicator 2.1.1’s data management on one sheet.
Setting targets
Indicator 3.4.1 asks for “achievable and challenging” outcomes. Achievable means set against the school’s own baseline and its margin of error. A target of “raise the NAT mean by three points” in a school with six test-takers is a target that chance alone will meet or miss. Challenging means set against the published milestones. The National Education Plan 2035 puts the end-of-year CRLA share of Key Stage 1 learners at grade level at 75% by 2028, 90% by 2031, and 95% by 2035, from a baseline of 47.74%. It puts the Rapid Mathematics Assessment (RMA) numeracy share at 65%, 75%, and 85% from 40.49%. A school target should name the instrument (the end-of-year CRLA, with all learners screened), the grade, the baseline, and the year.
Choosing what to monitor
Indicator 1.7.1 is about tools. Monitor with the instruments that have enough learners to move reliably: the CRLA and RMA profiles by grade, classroom assessment records, attendance, and the end-of-year CRLA against the target. Use the ELLNA and NAT at division level, where the intervals are a point wide. Do not build a school dashboard on a NAT mean from six learners.
Telling parents and the division
Indicator 5.4.1 is competent communication. Three rules keep data communication honest. Say what the number is a share of. Say how uncertain it is, in words: “our Grade 6 mean was 52 from six tested learners, which could be anywhere from 46 to 58”. Say what it cannot show. A school report card written by these rules tells parents the CRLA profile by grade, the classroom ratio and building condition, and the targets and the progress. It does not rank the school on a NAT mean.
The PPSSH indicators this guide covers
| Indicator | Data skill | Where in this guide |
|---|---|---|
| 1.2.1 phases of school planning | Situational analysis from the twelve-item pack | Parts 3, 4, 10 |
| 1.4.1 research from reliable sources | Reading an association as an association; checking coverage and quality | Parts 2, 8 |
| 1.7.1 monitoring and evaluation tools | Choosing instruments by their precision | Parts 7, 10 |
| 2.1.1 managing school data with ICT | Opening files, keys, blanks, impossible values | Parts 1, 2, 5 |
| 2.3.1 facilities policies | Reading the condition file by building and by school | Part 6 |
| 3.4.1 set learning outcomes | Baselines, margins, milestones | Parts 7, 10 |
| 3.5.1 assessment tools and results | Means, bands, samples, shrinkage, disagreeing instruments | Part 7 |
| 4.4.1 performance management | Which indicators can bear a target | Parts 7, 10 |
| 5.3.1 inclusive practice | Learner types and small denominators | Part 4 |
| 5.4.1 communication | Stating base, uncertainty and limits | Parts 9, 10 |
Part 11. A worked example: one small school
The school below is a composite assembled from pooled values in the public files, not a real school. Every figure is typical of a small elementary school in Region VIII.
The school in numbers. 180 learners from kindergarten to Grade 6, 28 in Grade 1 and 24 in Grade 3. Nine nationally funded teachers (Teacher I to III, no master teacher), one Head Teacher I, and no principal position. Two of seven classes multigrade. Five instructional rooms and one makeshift room. Two buildings, one in good condition and one needing major repair. Six functional toilet bowls and two non-functional. Water and electricity reported; no internet; three academic computers.
Where it stands. The pupil-teacher ratio is 20.0, below the median school (22.7) and the national aggregate (25.5), so staffing is not the problem. The pupil-classroom ratio is 36 on instructional rooms, or 30 if the makeshift room is counted. That is above the median 27.2 and near the national aggregate 35.1, so rooms are a problem, and one of the two buildings is tagged for major repair. The learner-toilet ratio is 30, above the median 21.7; repairing the two broken bowls would bring it to 22.5 without a new facility. Computers are 1.7 per 100 learners, below the median 2.3, with no connection to use them on.
What learners can do. On the CRLA in Grade 1 mother tongue, 16 of 28 learners are low emerging (57%) and 2 are at grade level (7%), against pooled shares of 55% and 5.3%. That is typical, and it is the gap in foundational reading. In Grade 3, 4 of 24 are low emerging and 6 are at grade level (25%), against 16% and 24.6%. The ELLNA mean is 58.0 from 22 test-takers. The margin is about ±4.1, so the true level is probably between 54 and 62, against a division mean of 62: possibly below the division, but not certainly. The NAT mean is 51.0 from 5 test-takers. The margin is about ±6.4, so the true level is between 45 and 57, against a division mean of 60: probably below, with the shrunk estimate nearer 52.
What the data cannot say. Whether the ELLNA gap is Numeracy (the component means are needed). Whether the Grade 1 profile is the start-of-year or the end-of-year screen. Whether the multigrade classes are the two with the weakest results. Why the school has no internet (coverage, cost, or a flag not updated).
Three findings. One: the school’s main constraint is rooms and a building, not teachers. Two: one Grade 1 learner in fourteen reads at grade level, and the school has no master teacher to lead early-grade reading. Three: the NAT mean is too uncertain to be a finding; the ELLNA suggests a gap, and the component means will say where.
Three implications. Request the major repair through the division engineer and record the building correctly in the inventory, because the inventory determines the allocation. Set the year’s target on the end-of-year CRLA for Grade 1 and Grade 2, and group Academic Recovery and Accessible Learning (ARAL) sessions by CRLA level. Ask the division for early-grade reading training for the two Grade 1 and 2 teachers. Pursue a connection through the local government unit (LGU) or a DepEd connectivity program before buying any more devices.
Part 12. Exercises with model answers
Each exercise names the PPSSH indicator it practices. Model answers follow. A relational answer connects the numbers; a stronger answer says what would change in a different school.
1 (1.2.1). A division memo reports enrollment growth of 1.2% last year. Your school lost 4% of its learners. Name three reasons both can be true.
Answer. A new school opened in the division (like-for-like growth is lower than all-schools growth). Large schools grew while small ones shrank (the aggregate follows the large schools). Your catchment’s kindergarten cohort fell (cohort flow). Check which applies by computing same-school growth and your own cohort ratios.
2 (2.1.1). The ICT file shows your school with 420 academic computers and 180 learners. What do you do?
Answer. Treat it as an entry error until verified (316 schools report more computers than learners). Correct the BEIS entry, and note that per-learner ratios in the division’s reports were computed with the count capped. Indicator 2.1.1 includes the skill of keeping your school’s own entries correct.
3 (3.5.1). Your Grade 6 NAT mean fell from 61 to 54. Six learners were tested each year. What can you say?
Answer. Almost nothing. Each mean carries a margin of about ±6, the two intervals overlap, the test is not equated across years, and different learners were sampled. Report the change with its margins and look at the CRLA and classroom assessments instead.
4 (3.4.1). Set a one-year reading target for a school where 60% of Grade 1 learners are low emerging on the start-of-year CRLA.
Answer. Name the instrument and the base: “on the end-of-year CRLA, with all Grade 1 learners screened, reduce the low emerging share from 60% to 35% and raise the share at grade level from 5% to 20%”. State how it will be monitored (monthly CRLA re-screens, ARAL attendance) and that the 2028 milestone is 75% at grade level by the end of Key Stage 1.
5 (1.7.1). The division asks every school to report “learning outcomes” monthly. Which measures can bear a monthly report and which cannot?
Answer. Can: attendance, CRLA and RMA re-screens, classroom assessment mastery rates. Cannot: NAT or ELLNA means (one round a year, sampled, with margins of several points), promotion rates (an end-of-year administrative decision, not a learning measure).
6 (5.4.1). Write the sentence that tells parents the school’s NAT result honestly.
Answer. “Six of our Grade 6 learners took the NAT; their average was 52, which, given so few learners, means the school’s true level is somewhere between 46 and 58, against a division average of 60. Our Grade 3 ELLNA, with 22 learners tested, was 58, between 54 and 62. The clearest picture of our learners’ reading is the CRLA profile below, which covers every child.”
7 (2.3.1). Your pupil-classroom ratio is 36 by the division’s calculation and 30 by yours. Why?
Answer. The division counts instructional rooms; you counted the makeshift room. Both are defensible; state which was used, and use the instructional-room figure in the request because the inventory does.
8 (1.4.1). A study finds that schools with more computers per learner score higher on the NAT. What does the within-division analysis in this series add, and what should you do?
Answer. Within a division, holding size and IP share constant, computers per learner show no association with any outcome; internet access does. Pursue connectivity before devices, and read both as associations in observational data.
9 (5.3.1). Your school’s IP share is 30% and the region’s is 2%. What does the region’s figure tell you about your school?
Answer. Nothing. The regional share is dominated by large lowland schools. Compare with neighboring schools in the division, and plan the language and materials for the learners actually enrolled.
10 (4.4.1). Which of these can be a performance target for a school head under a revised Office Performance Commitment and Review Form (OPCRF): the NAT mean, the promotion rate, the end-of-year CRLA share at grade level, the number of classroom observations conducted?
Answer. The CRLA share (all learners, reliable, aligned with the national milestones) and the classroom observations (an instructional-leadership activity EDCOM II asks the OPCRF to prioritize). The NAT mean is too uncertain at school level; the promotion rate rewards mass promotion.
Glossary of data terms
- Aggregate ratio. A ratio of totals: all learners over all teachers. DepEd’s definition for the pupil-teacher, pupil-classroom and learner-toilet ratios.
- Benjamini-Hochberg adjustment. A correction applied when many comparisons are made at once, so that the number of differences declared significant by chance is controlled.
- Cluster bootstrap. A way of computing an interval by resampling whole schools, many times, so that the interval reflects school-to-school variation as well as learner sampling.
- Coefficient. In a model, the estimated change in the outcome per unit of an input, holding the other inputs constant.
- Compound annual growth rate (CAGR). The constant yearly rate that would carry a series from its first value to its last.
- Confidence interval. The range within which the true value is likely to lie, usually at 95%. Narrower with more observations.
- Confounder. A variable, often unmeasured, that is related to both an input and an outcome and can create an association between them.
- Denominator. What a share or ratio divides by. Always state it.
- Division fixed effects. A model device that compares schools only with other schools in the same division, removing everything the division has in common.
- Index. A series divided by its value in a base year and multiplied by 100, so that groups of different size can be compared.
- Intraclass correlation (ICC). The share of variation in school outcomes that lies between groups (here divisions) rather than within them.
- Like-for-like growth. Growth computed over the schools present in both years.
- Margin of error. Half the width of a confidence interval; for a mean from n learners, about 1.96 times the learner-level standard deviation divided by the square root of n.
- Mean percentage score (MPS). The average share of items answered correctly, 0 to 100, as the NAT and ELLNA report it.
- Median. The middle value when observations are lined up; unaffected by extreme values.
- Percentage point. The difference between two percentages (15.9% to 12.0% is 3.9 points), as distinct from a percent change (25%).
- Proportion. A share expressed from 0 to 1; the CRLA file’s percent columns are proportions.
- Shrinkage. Pulling a noisy estimate toward a group mean, by an amount that depends on how many observations the estimate rests on.
- Standard deviation. A measure of spread; about two-thirds of values lie within one standard deviation of the mean.
- Standardized coefficient. A coefficient expressed per standard deviation of the input, so inputs in different units can be compared.
- Structural break. A point where a series changes behavior, such as the pandemic years; trends should be fitted on either side, not through it.
- Winsorizing. Capping extreme values at a percentile (here the 99th) so that entry errors do not dominate an average.
Common mistakes in reading DepEd data
- Reading a share of buildings as a share of schools, or a share of schools as a share of learners.
- Comparing a school’s ratio with a regional aggregate as if the aggregate were a typical school.
- Treating a blank as zero, or a zero as a blank.
- Reading a NAT school mean without its number of test-takers.
- Ranking schools on raw means from sampled learners.
- Comparing test results across years that were not equated.
- Applying a proficiency band to a school mean and reporting it as a share of proficient learners.
- Reading a CRLA percent column as a percentage when it is a proportion.
- Reading an association between an input and a result as the effect of the input.
- Comparing regions across years without constant boundaries.
- Reading a bar chart whose axis does not start at zero.
- Reporting a change without its start year, end year and whether it is total or annual.
Frequently asked questions
Where do I get DepEd’s public datasets?
DepEd’s proactive-release datasets, published under Project BUKAS from September 2025, are the source. Each archive holds one CSV file and a README, and the technical notes come with them. The data quality audit describes each file and what was found in it.
Can I compare my school’s NAT mean with another school’s?
Only with the margins of error. With six test-takers each, two school means need to differ by more than about eight points before the difference is likely to be real. Division estimates, with intervals about a point wide, are the reliable comparison.
Which numbers should a school head report to parents?
Report the CRLA profile by grade with all learners screened, the classroom ratio and building condition, attendance, and the school’s targets and progress, each with its base and its limits stated. Do not report a NAT mean from a few learners, and do not report a rank.
Is reading DepEd data part of the NASH coverage?
The National Assessment for School Heads (NASH) covers the PPSSH, and five Career Stage 1 indicators name data, evidence, or assessment results. This guide is a practical treatment of those indicators using real files; it does not reproduce or predict examination content.
Download the data
The cleaned, harmonized DepEd files behind this series are free to download in CSV and Parquet, with a codebook and checksums, under the terms of use set out in the release. Download Cleaned DepEd School Data, SY 2017-18 to 2025-26 documents every file and column. The files themselves are at data.nash.com.ph, starting with the README, the SY 2023-24 school master file (CSV, 8.0 MB) and the nine-year enrollment panel (Parquet, 17.2 MB).
Guides for aspiring school heads
- DepEd Data for Aspiring School Heads: Where to Start
- NASH Practice Questions With Answers: 50 Items on the PPSSH
- EDCOM II Final Report: Guide for Aspiring School Heads
- National Education Plan 2026-2035: Guide for School Heads
- NASH Study Guide: DepEd Memorandum 069, s. 2025 and PPSSH
- PPSSH Domain 1: Leading Strategically With DepEd Data
- PPSSH Domain 2: Managing School Operations With DepEd Data
- PPSSH Domain 3: Teaching and Learning With DepEd Data
- PPSSH Domain 4: Developing Self and Others With DepEd Data
- PPSSH Domain 5: Building Connections With DepEd Data
- On the app: the NASH guide, the PPSSH guide, the principal shortage and the full data report, Philippine basic education in numbers
The data reports
- DepEd Enrollment Trends SY 2017-2018 to SY 2025-2026
- Enrollment by school year: SY 2017-18, SY 2018-19, SY 2019-20, SY 2020-21, SY 2021-22, SY 2022-23, SY 2023-24, SY 2024-25, SY 2025-26
- DepEd Learner Data SY 2023-2024: IP, ALIVE and School Size
- DepEd Teachers and School Personnel Data, SY 2023-2024
- DepEd Classroom and School Building Data, SY 2023-2024
- DepEd WASH Data SY 2023-2024: Toilets, Water, Electricity
- DepEd ICT Data SY 2023-2024: Computers and Internet
- NAT Grade 6 Results SY 2023-2024: DepEd Division Scores
- ELLNA Grade 3 Results SY 2023-2024: DepEd Division Scores
- CRLA Results SY 2025-2026: Reading Levels in Grades 1 to 3
- DepEd School Inputs vs Test Results: Multigrade and Internet
- DepEd Open Data Quality: Errors, Blanks and Coverage Limits
- Download Cleaned DepEd School Data, SY 2017-18 to 2025-26
Written by Mark Anthony Llego for NASH Reviewer. Sources: DepEd public datasets and technical notes; DepEd Order No. 024, s. 2020 and the PPSSH booklet; DepEd Memorandum No. 069, s. 2025; EDCOM II Final Report, January 2026. Charts may be reused only with written permission from support@nash.com.ph.