Domain 1 of the Philippine Professional Standards for School Heads (PPSSH), Leading Strategically, has seven strands. For teachers preparing for the National Assessment for School Heads (NASH, formerly the NQESH), each one at Career Stage 1 can be read with the Department of Education’s (DepEd) public enrollment and assessment data, which show that most schools must now plan for fewer learners.
The PPSSH booklet, adopted by DepEd Order No. 024, s. 2020, says Domain 1 “highlights the role of school heads in setting the direction, goals, and objectives of schools, and in ensuring that these are understood and embraced by all stakeholders”. It says school heads in this domain “are expected to identify and comprehend relevant sources of information such as existing laws, policies, research, feedback and contexts” and to have “a complete understanding of schools’ current and desired states”.
A school’s current state is a set of numbers before it is anything else: how many learners, in which grades, taught by whom, in what rooms, and reading at what level. Career Stage 1 is the stage the PPSSH assigns to aspiring school heads. Below, each strand’s indicator is paired with three things. The first is the public data that describe the current state. The second is the account of the desired state in the Final Report of the Second Congressional Commission on Education (EDCOM II). The third is the way a situational NASH item might ask you to connect the two.
Key findings
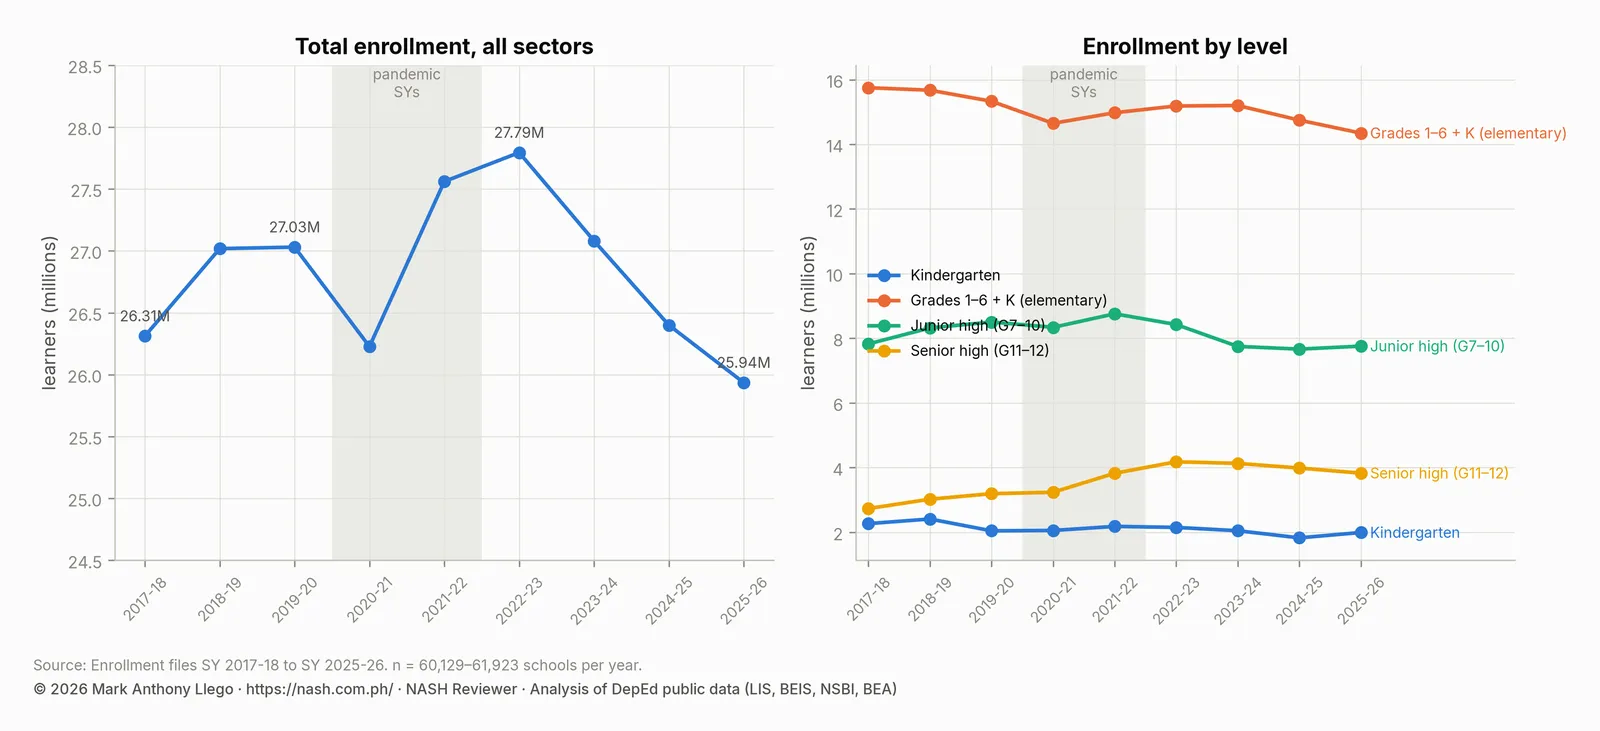
- Planning now means planning for fewer learners. National enrollment peaked at 27.79 million in SY 2022-2023 and stands at 25.94 million in SY 2025-2026. Kindergarten has fallen from 2.27 million to 1.99 million, and since SY 2022-2023 every region except BARMM has lost learners. A School Improvement Plan (SIP) that assumes growth is wrong in most of the country.
- The desired state is written down. The National Education Plan 2035 targets 75% of Key Stage 1 learners reading at grade level by 2028, up from 47.74%. It then targets 90% by 2031 and 95% by 2035, and a principal item for every school by 2028.
- The policies a school head must implement are mostly recent. DepEd Order No. 002, s. 2024 on teachers’ administrative tasks, DepEd Order No. 006, s. 2025 on school forms, Republic Act No. 12028 on the ARAL Program, Republic Act No. 12027 on the medium of instruction and Republic Act No. 12288 on career progression all date from 2024 and 2025.
- Research from reliable sources now includes DepEd’s own files. Project BUKAS put school-level enrollment, resources and assessment data in public hands. The inputs-and-outcomes analysis in this series shows what such data can and cannot establish.
- Monitoring is about to change. EDCOM II found that the Basic Education Development Plan (BEDP) carried 88 indicators, with only 8 on learning. DepEd’s Q-BEDP of 2025 narrows them.
The seven strands of Domain 1 at Career Stage 1
| Strand | Career Stage 1 indicator |
|---|---|
| 1.1 Vision, mission and core values | 1.1.1 Demonstrate knowledge of the DepEd vision, mission and core values to foster shared understanding and alignment of school policies, programs, projects and activities. |
| 1.2 School planning and implementation | 1.2.1 Demonstrate knowledge and understanding of the phases of development and implementation of school plans aligned with institutional goals and policies. |
| 1.3 Policy implementation and review | 1.3.1 Demonstrate knowledge and understanding of policy implementation and review to ensure that school operations are consistent with national and local laws, regulations and issuances. |
| 1.4 Research and innovation | 1.4.1 Identify relevant research findings from reliable sources in facilitating data-driven and evidence-based innovations to improve school performance. |
| 1.5 Program design and implementation | 1.5.1 Display understanding of the implementation of programs in the school that support the development of learners. |
| 1.6 Learner voice | 1.6.1 Demonstrate knowledge and understanding of utilizing learner voice to inform policy development and decision-making towards school improvement. |
| 1.7 Monitoring and evaluation processes and tools | 1.7.1 Display knowledge and understanding of monitoring and evaluation processes and tools to promote learner achievement. |
Career Stage 1 indicators begin with “demonstrate knowledge”, “display understanding” or “identify”. Career Stage 2, the stage of a serving principal, moves to “develop and implement”, “undertake” and “utilize”. The NASH tests the first stage. The Individual Development Report it returns points to the second.
1.1 Vision, mission and core values
The DepEd vision, mission and core values are in DepEd Order No. 36, s. 2013: “Filipinos who passionately love their country and whose values and competencies enable them to realize their full potential and contribute meaningfully to building the nation”. The PPSSH’s first guiding principle is that the standards are learner-centered, with “the learner [as] the heart of educational supervision”.
Data enter at the point of alignment. A school’s programs, projects and activities are aligned with the vision when they serve the learners the vision describes, and the data say who those learners are. In the public files, 9.3% of public-school learners are Indigenous Peoples (IP), and the share is 71.9% in CAR. Another 1.4% are in Arabic Language and Islamic Values Education (ALIVE) classes, 0.6% are Balik-Aral returnees, and 2.0% of elementary learners are taught in multigrade classes. A vision statement on the school gate is not aligned with a program list that ignores the school’s 40% IP enrollment.
1.2 School planning and implementation
Indicator 1.2.1 asks you to know the phases of school planning. Whatever the local template, the first phase is a situational analysis, and it starts with the school’s enrollment series.
| School year | Schools | Total enrollment | Year-on-year | Kindergarten | Elementary (K–6) | Junior high | Senior high | Female share |
|---|---|---|---|---|---|---|---|---|
| SY 2017-18 | 61,563 | 26,311,949 | 2,268,455 | 15,752,075 | 7,826,414 | 2,733,460 | 49.1% | |
| SY 2018-19 | 61,916 | 27,018,509 | +2.7% | 2,409,782 | 15,675,041 | 8,320,627 | 3,022,841 | 49.2% |
| SY 2019-20 | 61,923 | 27,030,391 | +0.0% | 2,044,745 | 15,332,706 | 8,503,650 | 3,194,035 | 49.1% |
| SY 2020-21 | 60,957 | 26,227,022 | -3.0% | 2,055,635 | 14,650,804 | 8,339,391 | 3,236,827 | 49.2% |
| SY 2021-22 | 60,429 | 27,560,661 | +5.1% | 2,181,189 | 14,977,991 | 8,757,957 | 3,824,713 | 49.1% |
| SY 2022-23 | 60,137 | 27,794,282 | +0.8% | 2,149,891 | 15,188,435 | 8,426,203 | 4,179,644 | 48.7% |
| SY 2023-24 | 60,167 | 27,081,292 | -2.6% | 2,047,356 | 15,201,951 | 7,749,265 | 4,130,076 | 48.8% |
| SY 2024-25 | 60,129 | 26,400,182 | -2.5% | 1,827,258 | 14,748,764 | 7,665,606 | 3,985,812 | 49.0% |
| SY 2025-26 | 60,204 | 25,935,863 | -1.8% | 1,993,117 | 14,348,159 | 7,758,408 | 3,829,296 | 49.1% |
Total enrollment rose from 26.31 million in SY 2017-2018 to 27.79 million in SY 2022-2023. It has fallen since then to 25.94 million. That is a compound change of −0.18% a year over eight years, but −2.3% a year since the peak.
Kindergarten fell 1.6% a year, and the smaller cohorts are now moving up through the elementary grades. Senior high school grew 4.3% a year to 3.83 million. The private share went from 15.9% in SY 2019-2020 to 12.0% in SY 2021-2022 and back to 14.5%. Public schools absorbed learners during the pandemic, and only some of those learners have returned to private schools.
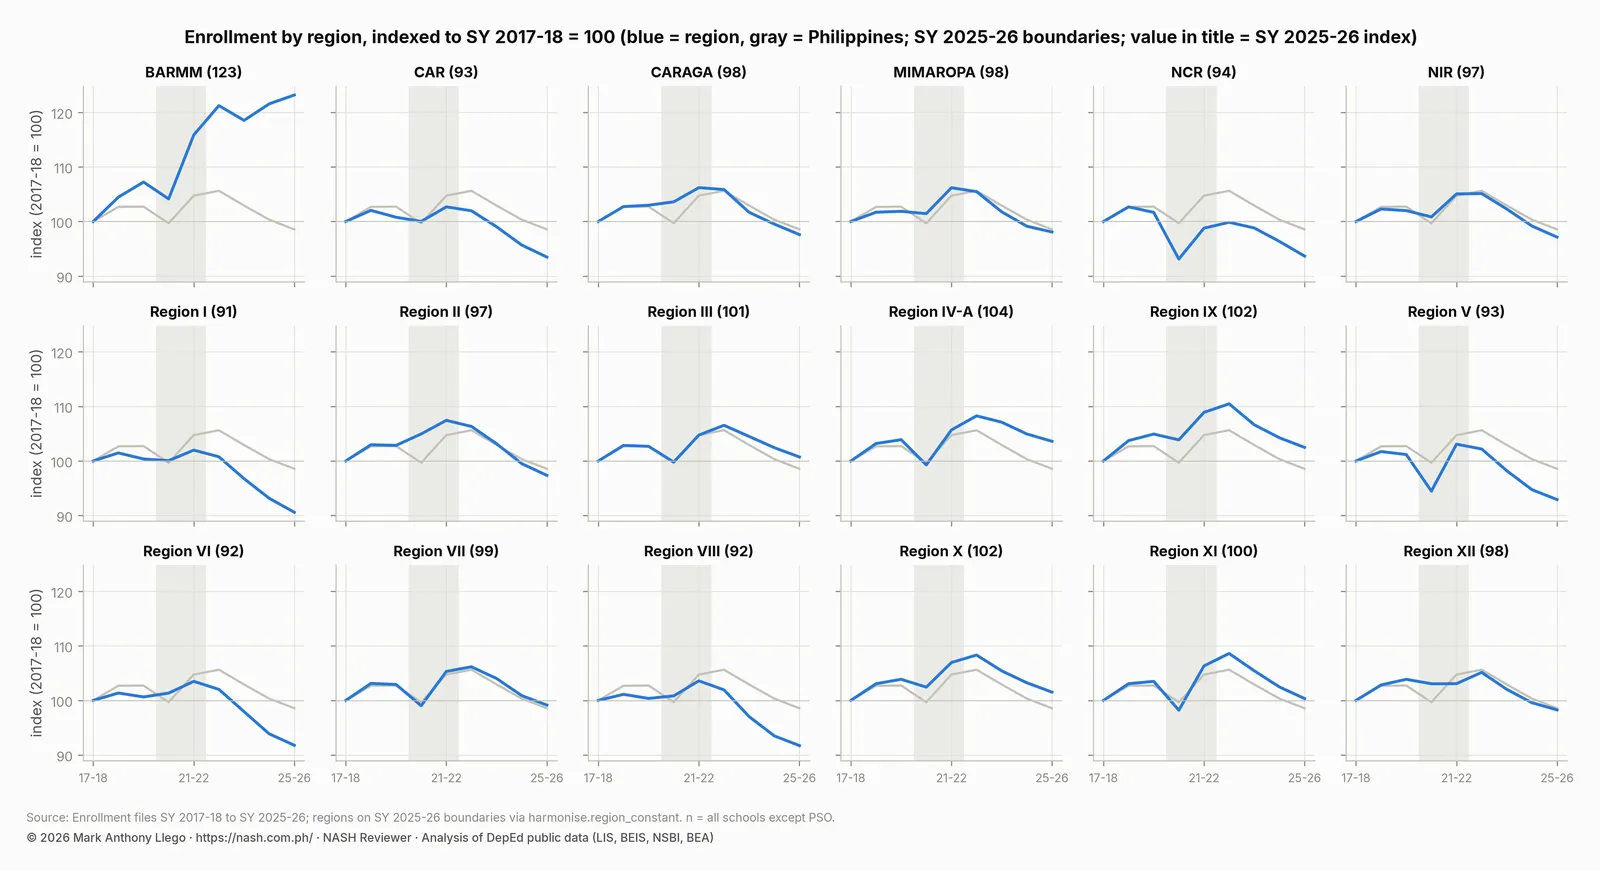
Regions differ. Under constant SY 2025-2026 boundaries, BARMM grew 2.6% a year, while Region I, Region VI and Region VIII each lost about 1.1% a year. Since SY 2022-2023, every region except BARMM has shrunk.
| Region (SY 2025-26 boundaries) | SY 2017-18 | SY 2019-20 | SY 2025-26 | Per year, 2017-18 to 2025-26 | Per year, 2022-23 to 2025-26 | Trend excluding pandemic years |
|---|---|---|---|---|---|---|
| Region I | 1,286,348 | 1,291,071 | 1,165,403 | -1.23% | -3.48% | -1.17% |
| Region VIII | 1,256,668 | 1,261,310 | 1,152,614 | -1.07% | -3.46% | -1.03% |
| Region VI | 1,176,643 | 1,184,212 | 1,079,924 | -1.07% | -3.47% | -1.00% |
| Region V | 1,764,865 | 1,785,756 | 1,640,002 | -0.91% | -3.12% | -0.90% |
| CAR | 436,484 | 439,895 | 408,037 | -0.84% | -2.85% | -0.79% |
| NCR | 2,868,073 | 2,916,295 | 2,686,394 | -0.81% | -2.11% | -0.85% |
| NIR | 1,226,368 | 1,250,904 | 1,191,317 | -0.36% | -2.60% | -0.28% |
| Region II | 871,626 | 896,502 | 848,648 | -0.33% | -2.89% | -0.27% |
| CARAGA | 754,330 | 776,855 | 736,260 | -0.30% | -2.67% | -0.30% |
| MIMAROPA | 871,849 | 888,159 | 855,106 | -0.24% | -2.40% | -0.19% |
| Region XII | 1,155,084 | 1,199,786 | 1,135,036 | -0.22% | -2.23% | -0.29% |
| Region VII | 1,646,395 | 1,694,486 | 1,632,444 | -0.11% | -2.25% | -0.07% |
| Region XI | 1,312,861 | 1,358,826 | 1,317,420 | +0.04% | -2.60% | +0.14% |
| Region III | 2,839,168 | 2,915,454 | 2,860,078 | +0.09% | -1.85% | +0.15% |
| Region X | 1,262,319 | 1,311,257 | 1,281,565 | +0.19% | -2.14% | +0.24% |
| Region IX | 1,135,114 | 1,191,123 | 1,163,334 | +0.31% | -2.47% | +0.34% |
| Region IV-A | 3,689,236 | 3,833,280 | 3,822,536 | +0.44% | -1.45% | +0.49% |
| BARMM | 758,518 | 813,434 | 934,373 | +2.64% | +0.53% | +2.68% |
Three consequences follow for a school plan. First, classroom and teacher requests should rest on the grade profile three years ahead, not on last year’s headcount. A school in Region I or Region VIII should expect its early grades to keep shrinking, and a school in BARMM should expect the opposite.
Second, senior high schools should plan for the strand shifts shown in the enrollment trends report for SY 2017-2018 to SY 2025-2026. Technical-Vocational-Livelihood (TVL) remains the largest track, Humanities and Social Sciences (HUMSS) has tripled, and the General Academic Strand (GAS) and Accountancy, Business and Management (ABM) have declined since SY 2022-2023. Third, where enrollment falls, the pupil-teacher ratio falls with it. That is an opportunity for the early grades, where the ratio is the one input associated with more readers at grade level.
EDCOM II’s Priority Area 8 adds a planning constraint the files do not show. The commission found 58 government housing projects with 167,120 units that were built without school sites. That implies about 8,000 classrooms of demand, concentrated in Rizal, Cavite, Laguna, Bulacan, Pampanga and Metro Manila. A school near a resettlement site should plan for an increase in enrollment that the division may not have forecast.
1.3 Policy implementation and review
Indicator 1.3.1 asks for knowledge of the laws and issuances that school operations must follow. The table lists the ones the EDCOM II Final Report discusses most, which a school head appointed in 2026 will implement.
| Issuance | What it does | Why EDCOM discusses it |
|---|---|---|
| Republic Act No. 9155 (2001) | Defines the school head as “a person responsible for the administrative and instructional supervision of the school or cluster of schools” and lists twelve functions | EDCOM finds its vision of shared governance unrealized; 48% of schools have no principal item |
| DepEd Order No. 024, s. 2020 | Adopts the PPSSH | The basis of the NASH and of all school-head HR systems |
| DepEd Order No. 8, s. 2015 | Classroom assessment and the transmutation table | EDCOM recommends phasing out transmutation, which turns an initial grade of 60 into 75 |
| DepEd Order No. 9, s. 2005 | Prescribes 205 school days of engaged time on task and bars suspensions for celebrations | EDCOM finds about 191 actual class days and 28 nationally observed activities a year |
| DepEd Order No. 002, s. 2024 | Removes administrative tasks from teachers and transfers them to school heads and non-teaching staff | The core of EDCOM’s workload reform; the tasks now sit with the school head |
| DepEd Order No. 006, s. 2025 | Cuts teacher-accomplished forms from 174 to 75 | Listed among EDCOM’s accomplishments |
| Republic Act No. 12028 (2024) | Establishes the ARAL Program for K to 10 learners below minimum proficiency | EDCOM’s preferred vehicle for learning recovery; SY 2025-26 is its first full year |
| Republic Act No. 12027 (2024) | Ends compulsory MTB-MLE and requires periodic review | EDCOM asks for language mapping and school-level language plans |
| Republic Act No. 12288 (2025) | Career Progression System for Public School Teachers and School Leaders | Approved September 12, 2025 (passed by Congress June 11, 2025); EDCOM asks DepEd to review QS and fund new positions |
| Executive Order No. 174, s. 2022 and DepEd Order No. 24, s. 2025 | Expanded Career Progression system and its guidelines | EDCOM asks that the master’s requirement move from Master Teacher I to a later step |
| DepEd Order No. 021, s. 2024 and DepEd Order No. 019, s. 2025 | Recruitment guidelines and the amended qualification standards | Item 27 requires the school head assessment for first appointment as principal |
| Republic Act No. 10821 (2016) | Schools as evacuation centers only as a last resort | EDCOM finds thousands of classrooms still converted, nearly half of them in Region IV-A |
Policy review is the other half of the strand. EDCOM II’s report is an example of review at national scale. Its method is the one a school head uses at school scale: state what the policy intends, measure what happens, and recommend the change.
Policies also have a legal side. The Supreme Court’s decisions on school heads show how rules on school funds, personnel and learner safety have been enforced against principals, and what the Court held in each case.
1.4 Research and innovation
Indicator 1.4.1 asks for “reliable sources” and “data-driven and evidence-based innovations”. Two habits matter.
The first habit is knowing what a source can establish. The analysis of school inputs and learning outcomes in this series compares schools within the same division. It finds that multigrade organization is associated with about four points lower means on the Early Language, Literacy, and Numeracy Assessment (ELLNA) and the National Achievement Test (NAT). Elementary internet access is associated with about 2.6 more NAT points and 1.5 more percentage points of early readers at grade level. The pupil-teacher ratio is associated with early reading but not with Grade 3 or Grade 6 scores.
The same analysis finds that classrooms, toilets and computers per learner show no detectable association once division and school size are held constant. Every association is small. Which division a school is in explains far more than any input.
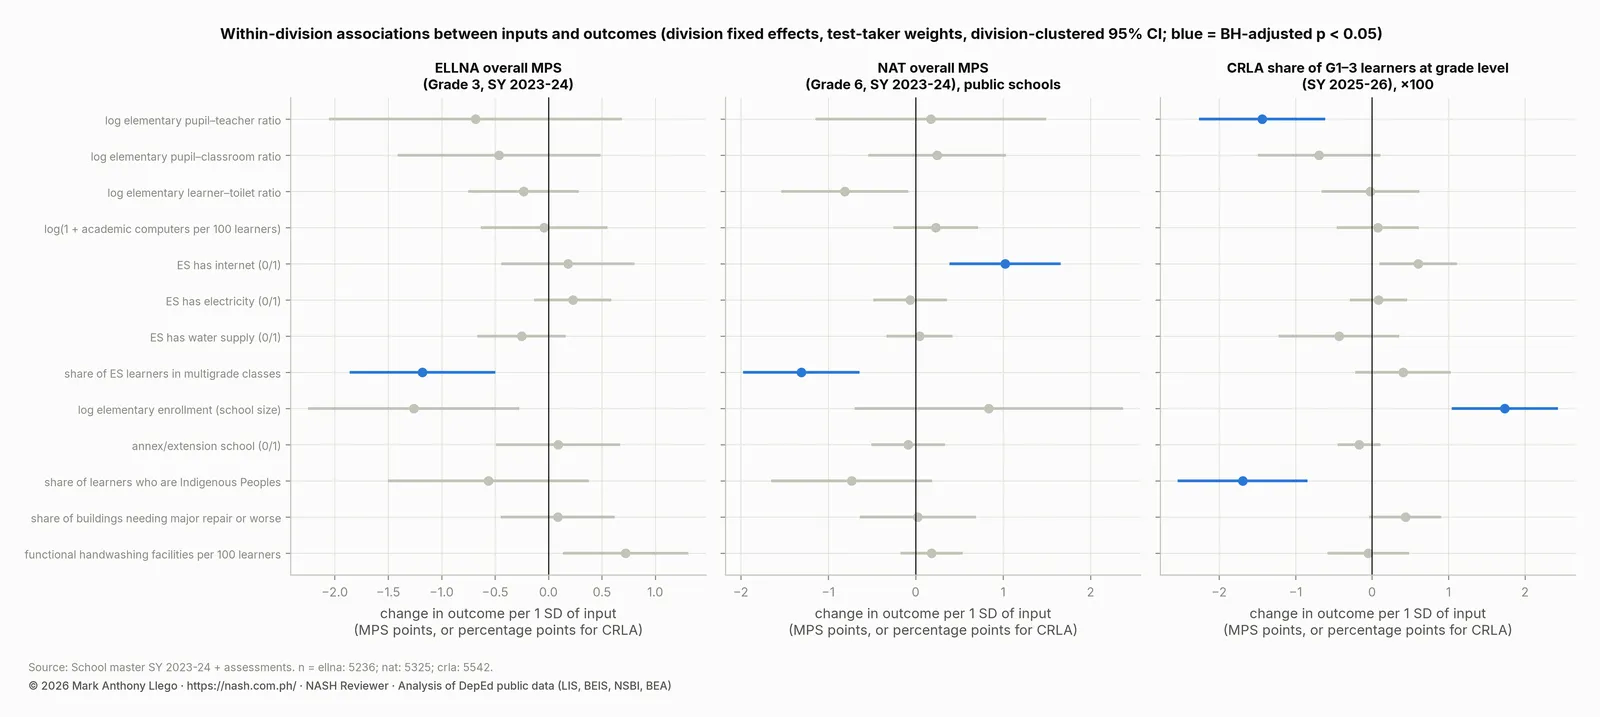
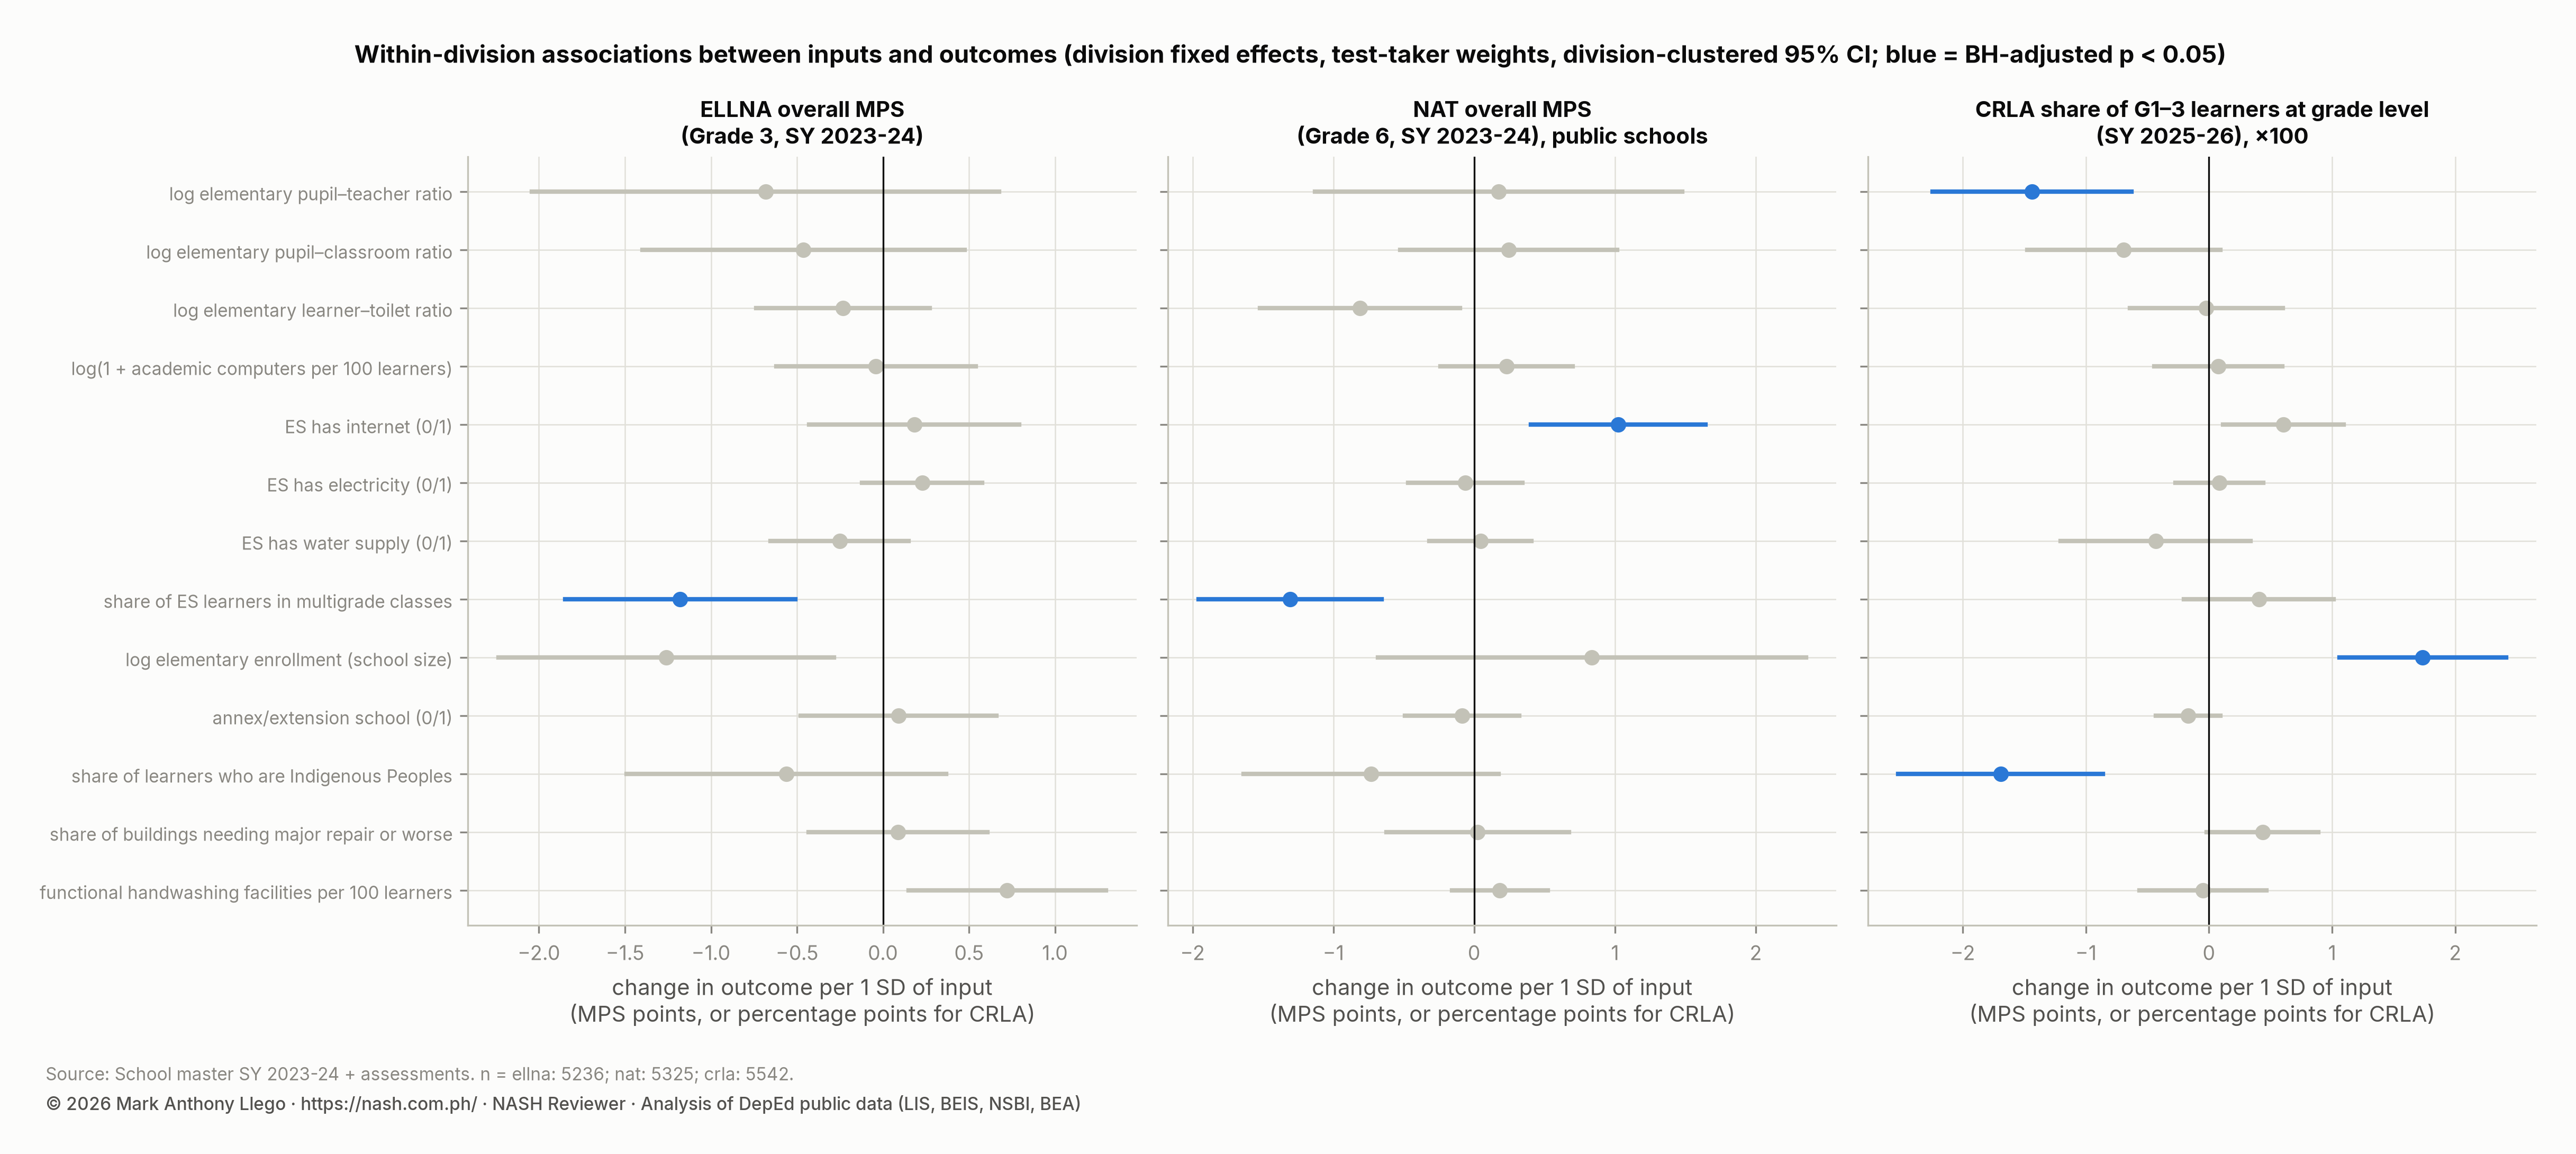
The second habit is reading such findings as associations, not effects. Multigrade schools are small and remote, and connected schools are urban. The files measure neither poverty nor teaching quality. A school head who orders tablets because connected schools score higher has misread the evidence. One who pursues a working internet connection and uses it has read the evidence correctly.
EDCOM II gives the same caution. It cites a UNICEF-DOF study that links a 1% increase in Maintenance and Other Operating Expenses (MOOE) to 3.1 to 3.8 more NAT points, “with these gains disappearing after controlling for poverty incidence”.
Reliable sources for a Philippine school head now include the Project BUKAS datasets and DepEd’s technical notes on the assessments. They also include EDCOM II’s three reports and the studies those reports cite from the Philippine Institute for Development Studies (PIDS) and the World Bank. Regional and division reports built from the Learner Information System (LIS) and the Basic Education Information System (BEIS) are a further source. The DepEd open data quality audit shows what checking a source looks like. It covers 17 files with 2,216 columns. It finds zero duplicate IDs, 139 schools reporting learners but no teachers, and one school reporting 15,699 tablets. Education Data, Transparency and Research covers what EDCOM II found about DepEd’s data systems, Project BUKAS and the state of education research.
1.5 Program design and implementation
Indicator 1.5.1 asks for understanding of programs that support learner development. The programs EDCOM II reviews are the ones a school head will run.
The Academic Recovery and Accessible Learning (ARAL) Program under Republic Act No. 12028 provides free tutorial support for kindergarten to Grade 10 learners. It covers learners who are returning after a gap, who are below minimum proficiency in reading, mathematics and science, or who are failing examinations. EDCOM II’s school visits found that the constraints “lie in time, workforce, and family level barriers, rather than in the absence of policy”. Teachers deliver ARAL on top of full teaching loads, and learners flagged for intervention are often absent.
Two programs show what remediation can do. The Bawat Bata Makababasa pilot in Region IX produced gains of up to 1.3 years of schooling in 20 days. The national Literacy Remediation Program moved 96% of low emerging readers up at least one level in 18 days. EDCOM II also warns that programs have prioritized the lowest readers and left more than 1.6 million transitioning readers without targeted comprehension support.
The Comprehensive Rapid Literacy Assessment (CRLA) file shows the size of the need by grade. In the mother tongue, 55.0% of Grade 1 learners are at the low emerging level, 27% in Grade 2 and 13% to 16% in Grade 3. The share at grade level rises from 5.3% in Grade 1 to about 25% in Grade 3. A program designed from this profile puts the most intensive support in Grades 1 and 2. It builds comprehension work for the Grade 3 majority who are between the two levels.
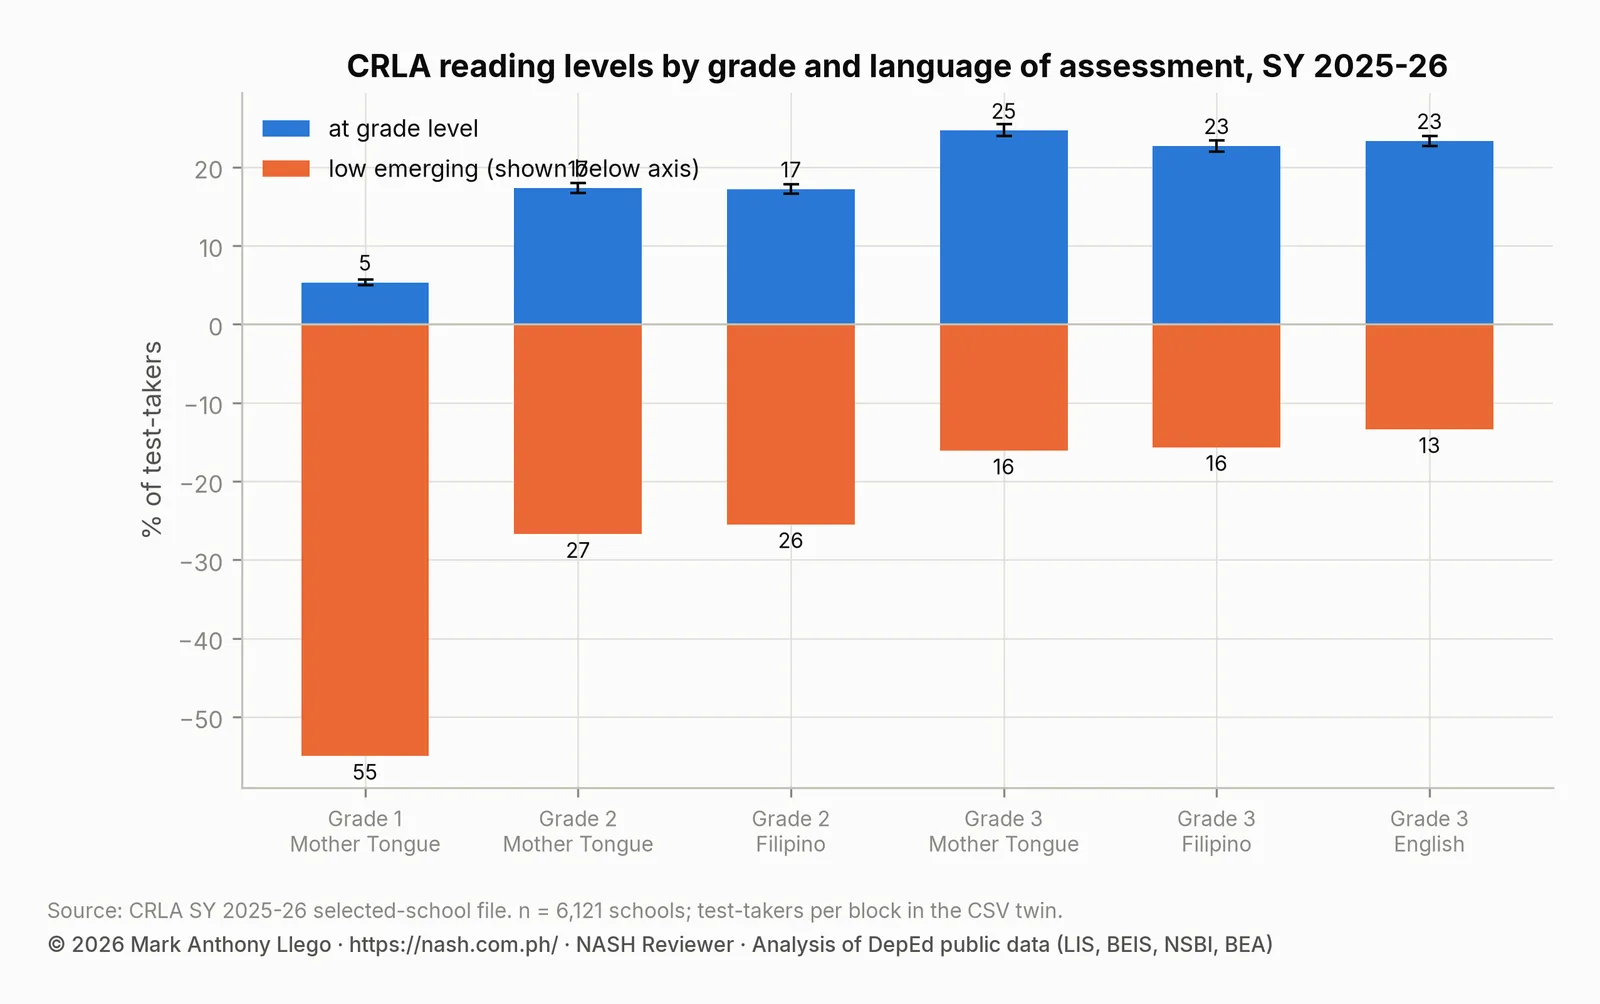
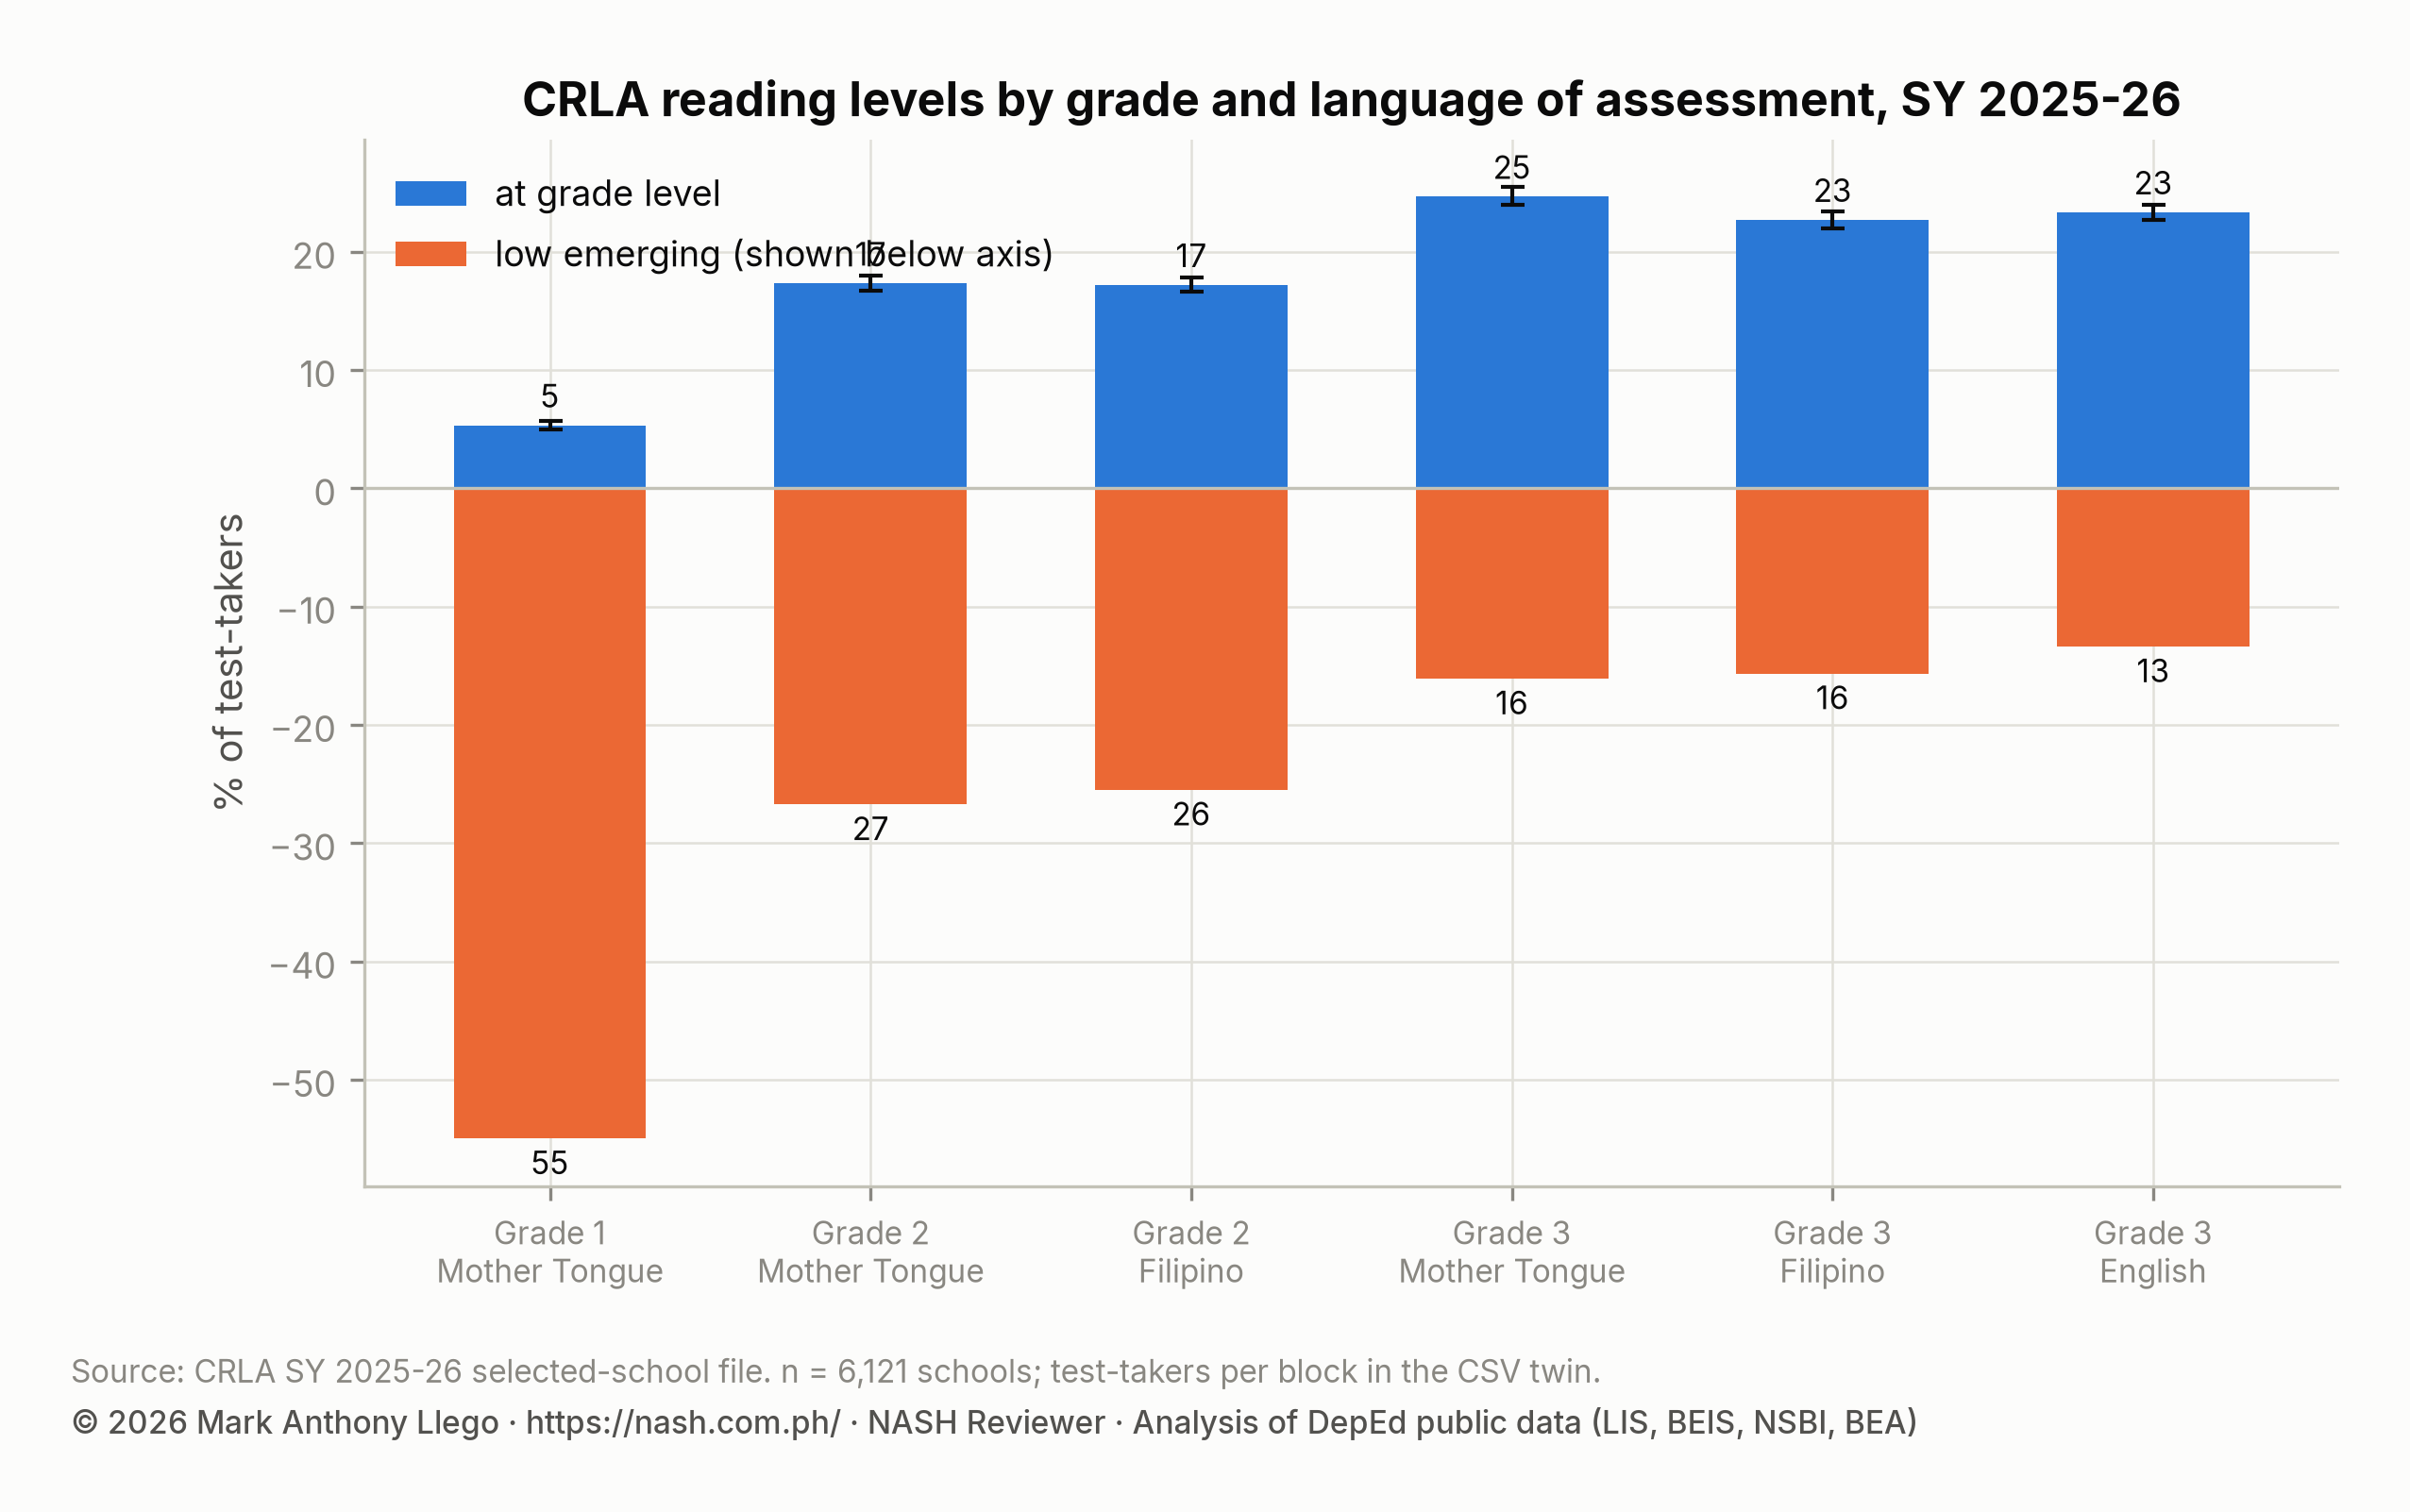
The report discusses other programs too. Bayang Bumabasa, launched in December 2025, used school-level CRLA profiles to identify 131 priority schools eligible for up to PHP 1 million in literacy grants. The School-Based Feeding Program and early childhood nutrition fall under Key Priority Area 1. The Pasay City model uses dedicated reading teachers funded by the local government unit (LGU) and daily pull-out sessions. EDCOM II credits that model with moving almost all flagged non-readers up at least one level. Local Education Models in EDCOM II covers the Region IX pilot, the Literacy Remediation Program, Pasay City and other local models, with the evidence behind each result.
1.6 Learner voice
Indicator 1.6.1 asks for knowledge of how learner voice informs policy and decisions. The EDCOM II report gives two reasons the strand is not a formality. In the Southeast Asia Primary Learning Metrics (SEA-PLM) 2024, the Philippine figure for head teachers reporting bullying among pupils at least once a month was 50%, down from 63% in 2019 and far above the 4% to 20% range in Cambodia, Lao PDR and Vietnam.
SEA-PLM’s regression analysis adds three findings. Learners whose parents often talk, read or engage with them about schoolwork have lower odds of low performance. Grade repetition is one of the strongest predictors of low proficiency, and 28% of Grade 5 learners had repeated a grade. Learners who speak the test language at home do better.
Facts like these are not visible in a school’s administrative data. A school learns them by asking learners: through the Supreme Pupil or Student Government, the learner-feedback mechanisms a school sets up, and the anti-bullying structures under the revised rules of Republic Act No. 10627.
1.7 Monitoring and evaluation
Indicator 1.7.1 asks for knowledge of monitoring and evaluation (M&E) processes and tools “to promote learner achievement”. EDCOM II’s Priority Area 25 is the critique. The BEDP 2030 carries 88 indicators, with only 8 on learning, while high-performing systems use at most 15 indicators with at least 60% on learning. The commission also finds that “school monitoring focuses on documentary requirements as ‘means of verification’ rather than the quality of instruction”, and that for principals “the OPCR lacks standardization across the system”. The OPCR is the Office Performance Commitment and Review form. DepEd’s Q-BEDP of 2025 is the reply, with a smaller set of indicators focused on literacy, numeracy and 21st-century skills.
The data series shows which measures a school-level monitoring set can rest on, and which it cannot. A Grade 6 NAT school mean rests on a median of six sampled learners, so a one-year change in it is mostly noise. The NAT Grade 6 results report for SY 2023-2024 shows that shrinking school means toward the division mean changes which schools are in the bottom 100 for 18 of them. Division estimates carry confidence intervals about a point wide and are stable.
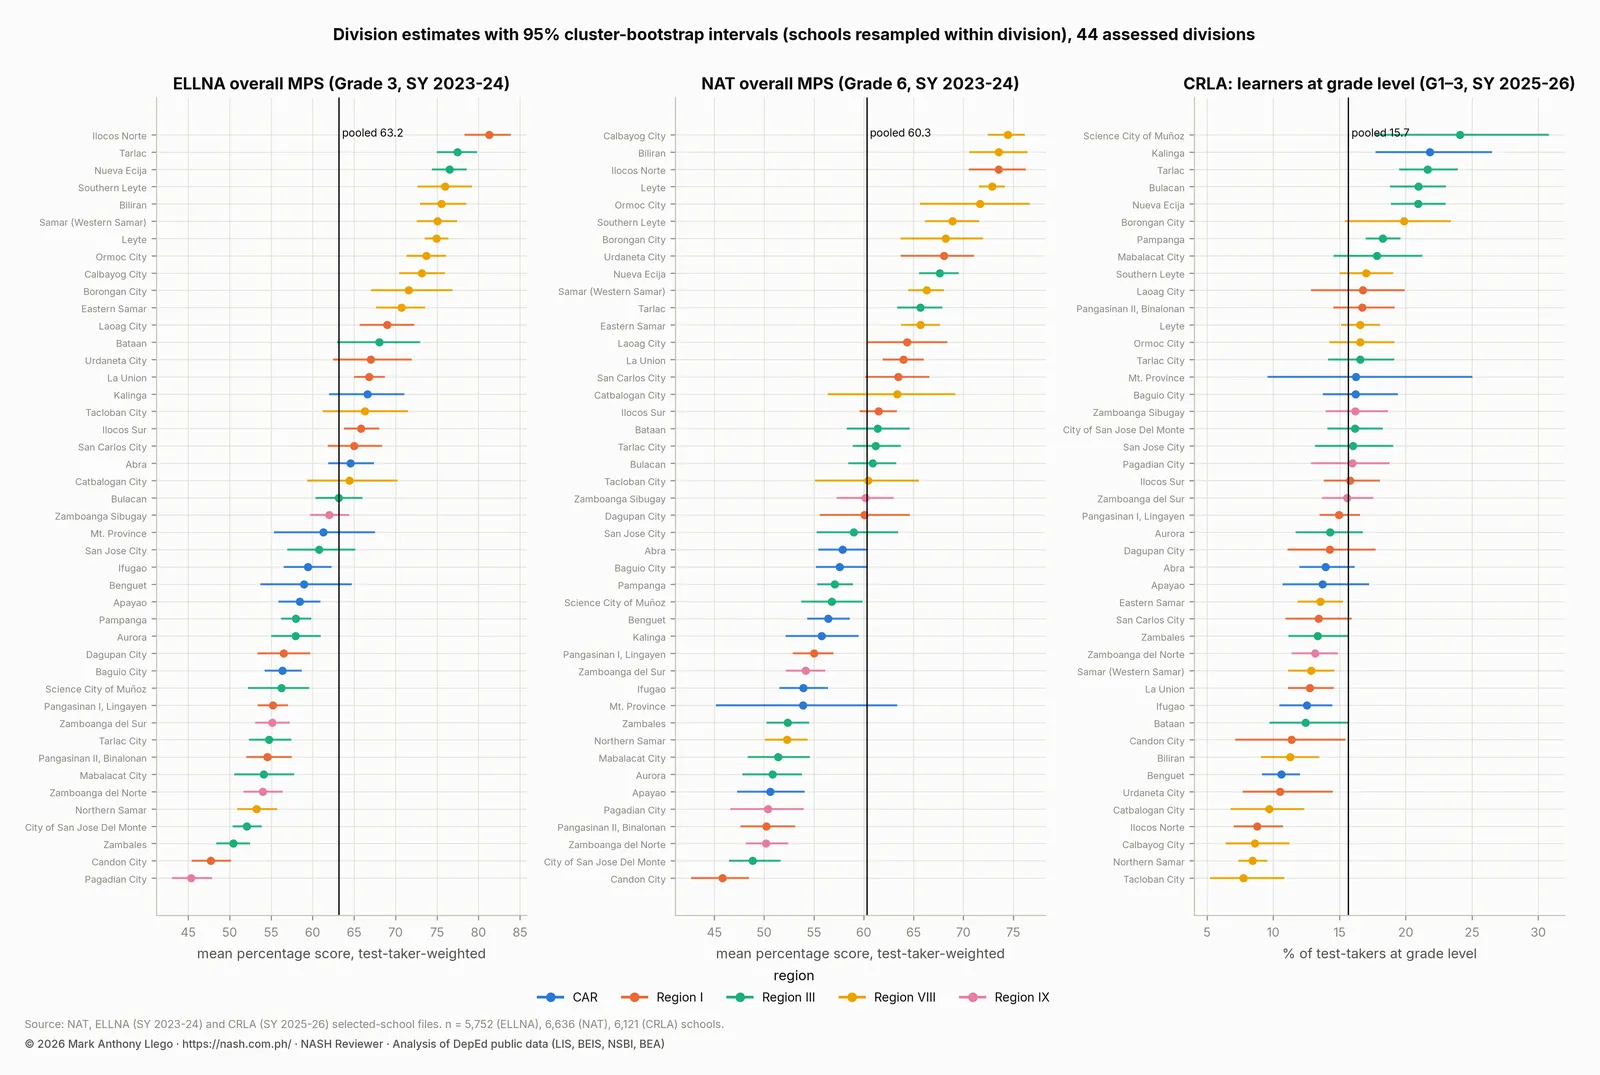
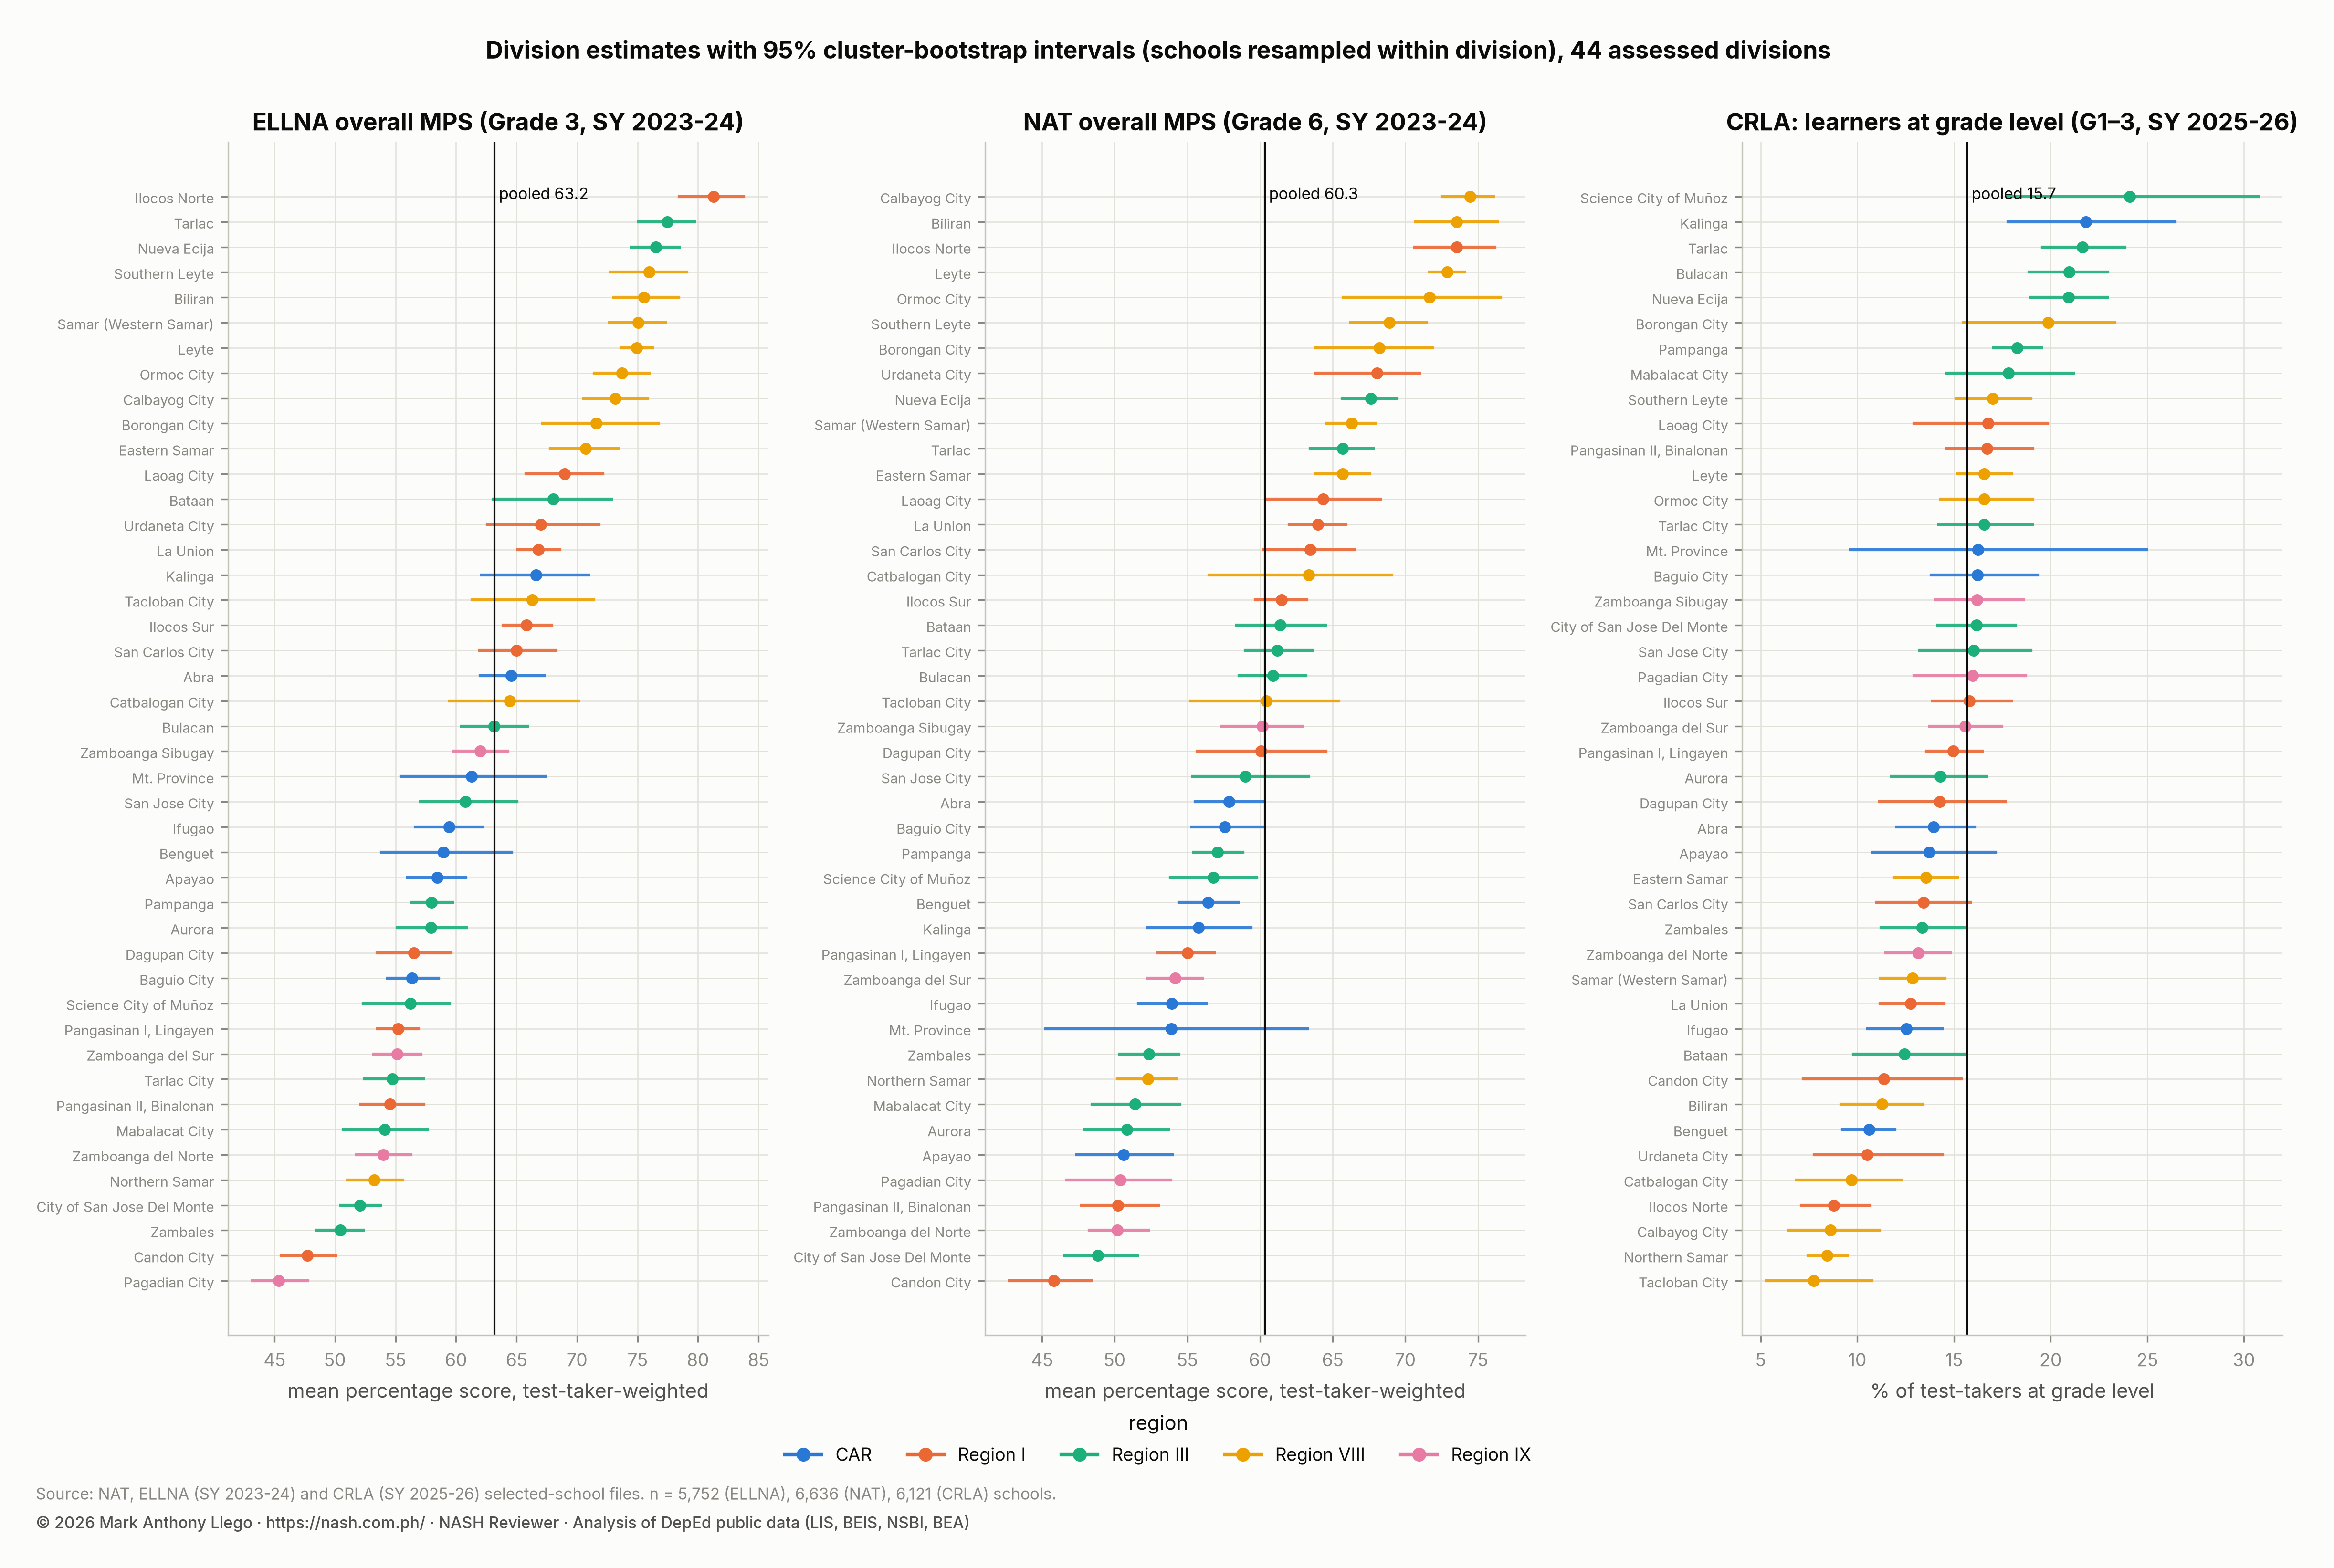
A school’s own monitoring should therefore rest on the instruments that cover enough learners to be reliable. Those are the CRLA and Rapid Mathematics Assessment (RMA) profiles by grade, classroom assessment records, attendance, and the end-of-year CRLA, which is the measure for the National Education Plan’s targets. The NAT and ELLNA belong in the division’s monitoring, not in a ranking of schools.
How the NASH may test Domain 1
A situational item might give you a school’s enrollment for five years, its CRLA profile and its current SIP, and ask what to revise. At the unistructural level, you notice the decline. At the multistructural level, you list the decline, the CRLA gap and the SIP’s growth assumption. At the relational level, you connect them. The smaller cohorts free teacher time in Grades 1 to 3, where the CRLA gap is widest and the pupil-teacher ratio is associated with reading. So the plan redirects the request from a classroom to an early-grade teacher item and sets a CRLA target, with the end-of-year screen as the measure. At the extended abstract level, you note that in BARMM, the one growing region, the same data would point the other way.
Before you apply
- Read your prospective school’s five-year enrollment and grade profile from the LIS, and its CRLA profile by grade, before you read its SIP.
- List the issuances in the table above with their numbers. The NASH assesses policy knowledge, and the EDCOM II report is the current digest of it.
- Practice saying what an association in school data does and does not show.
- Know the National Education Plan targets for 2028: 75% of Key Stage 1 learners at grade level on the CRLA, 65% on the RMA, and a principal item in every school.
Frequently asked questions
What is PPSSH Domain 1, Leading Strategically?
PPSSH Domain 1, Leading Strategically, has seven strands: vision, mission and core values; school planning and implementation; policy implementation and review; research and innovation; program design and implementation; learner voice; and monitoring and evaluation. Its Career Stage 1 indicators ask aspiring school heads to demonstrate knowledge and understanding of each strand.
Which DepEd data should a School Improvement Plan start from?
A School Improvement Plan should start from the school’s enrollment by grade for at least five years. It should also use the school’s learner types (IP, ALIVE, Balik-Aral, multigrade), its CRLA and RMA profiles by grade, and its facilities and staffing from the BEIS. All of these are now public for every school through Project BUKAS.
What does EDCOM II say about school planning and monitoring?
EDCOM II says performance frameworks carry too many indicators: 88 in the BEDP, with only 8 on learning. It finds that the OPCR for principals is not standardized and that data systems “are not effective for tracking progress against targets”. It supports the Q-BEDP’s smaller, learning-focused set of indicators.
Download the data
The cleaned, harmonized DepEd files behind this series are free to download in CSV and Parquet, with a codebook and checksums, under the terms of use set out in the release. Download Cleaned DepEd School Data, SY 2017-18 to 2025-26 documents every file and column. The files themselves are at data.nash.com.ph, starting with the README, the SY 2023-24 school master file (CSV, 8.0 MB) and the nine-year enrollment panel (Parquet, 17.2 MB).
Guides for aspiring school heads
- DepEd Data for Aspiring School Heads: Where to Start
- NASH Practice Questions With Answers: 50 Items on the PPSSH
- How to Read DepEd Data: A Guide for Aspiring School Heads
- EDCOM II Final Report: Guide for Aspiring School Heads
- National Education Plan 2026-2035: Guide for School Heads
- NASH Study Guide: DepEd Memorandum 069, s. 2025 and PPSSH
- PPSSH Domain 2: Managing School Operations With DepEd Data
- PPSSH Domain 3: Teaching and Learning With DepEd Data
- PPSSH Domain 4: Developing Self and Others With DepEd Data
- PPSSH Domain 5: Building Connections With DepEd Data
- Supreme Court Cases on School Heads: A Guide for Principals
- On the app: the NASH guide, the PPSSH guide, the principal shortage and the full data report, Philippine basic education in numbers
The data reports
- DepEd Enrollment Trends SY 2017-2018 to SY 2025-2026
- Enrollment by school year: SY 2017-18, SY 2018-19, SY 2019-20, SY 2020-21, SY 2021-22, SY 2022-23, SY 2023-24, SY 2024-25, SY 2025-26
- DepEd Learner Data SY 2023-2024: IP, ALIVE and School Size
- DepEd Teachers and School Personnel Data, SY 2023-2024
- DepEd Classroom and School Building Data, SY 2023-2024
- DepEd WASH Data SY 2023-2024: Toilets, Water, Electricity
- DepEd ICT Data SY 2023-2024: Computers and Internet
- NAT Grade 6 Results SY 2023-2024: DepEd Division Scores
- ELLNA Grade 3 Results SY 2023-2024: DepEd Division Scores
- CRLA Results SY 2025-2026: Reading Levels in Grades 1 to 3
- DepEd School Inputs vs Test Results: Multigrade and Internet
- DepEd Open Data Quality: Errors, Blanks and Coverage Limits
- Download Cleaned DepEd School Data, SY 2017-18 to 2025-26
Written by Mark Anthony Llego for NASH Reviewer. Sources: DepEd Order No. 024, s. 2020 and the PPSSH booklet; DepEd Memorandum No. 069, s. 2025; EDCOM II Final Report, January 2026; DepEd public datasets. Charts may be reused only with written permission from support@nash.com.ph.