In DepEd’s SY 2025-2026 Comprehensive Rapid Literacy Assessment (CRLA) file, only 15.7% of the 647,681 Grade 1 to 3 learners screened read at grade level, and 30.3% are at the lowest level. The results are broken down by grade, language, region and division.
The CRLA is DepEd’s teacher-administered reading screen for the early grades. It places each learner at one of five levels: low emerging, high emerging, developing, transitioning, or at grade level. Grade 1 learners are screened in the mother tongue, Grade 2 learners in the mother tongue and Filipino, and Grade 3 learners in the mother tongue, Filipino and English. DepEd has released school-level counts for SY 2025-2026 for a selected set of 6,121 public schools in five regions and 44 divisions. These are the same divisions as in the National Achievement Test (NAT) and Early Language, Literacy and Numeracy Assessment (ELLNA) files.
Unlike the two mean-score files, the CRLA file gives counts of learners at each level, so proportions can be computed with real confidence intervals. The sections below read the file by grade and language, by region, by the school’s declared language of instruction, and by division. A later section explains why the CRLA does not agree with the Grade 3 ELLNA in the same schools. The companion report, Philippine basic education in numbers, holds the method notes.
Key findings
- 15.7% of 647,681 Grade 1 to 3 test-takers read at grade level, and 30.3% are at the lowest level, “low emerging”.
- Grade 1 is where the gap is largest: 5.3% at grade level in the mother tongue and 55.0% low emerging. By Grade 3 the share at grade level is 24.6% in the mother tongue, 22.7% in Filipino and 23.3% in English, and low emerging falls to 13% to 16%.
- Region III has the highest share at grade level (18.4%) and Region VIII the lowest (12.7%). Region IX has the most low-emerging readers (34.2%).
- By language of instruction, Kapampangan (19.4%) and Tagalog (17.3%) schools are highest and Waray schools lowest (12.0%).
- Division shares run from 7.7% in Tacloban City to 24.1% in Science City of Muñoz. 13 divisions sit significantly below the pooled share and 6 above.
- The CRLA does not agree with the ELLNA. At school level, the CRLA share at grade level correlates at only 0.06 with the SY 2023-2024 ELLNA mean. Divisions at the top of the ELLNA and NAT (Ilocos Norte, Calbayog City) are near the bottom on the CRLA.
What the DepEd CRLA file contains
The CRLA file has one row per school. Each row gives the region, the division, the declared language of instruction, the number of test-takers, and the counts and shares at each of the five levels for the school as a whole. It also gives counts at each level for six grade-and-language blocks: Grade 1 mother tongue, Grade 2 mother tongue and Filipino, and Grade 3 mother tongue, Filipino and English. 6,090 of the schools match DepEd’s SY 2023-2024 school list. The other 31 opened in SY 2024-2025 and are joined to the SY 2025-2026 enrollment file instead.
Two features of the file matter for reading it. First, the school-level summary is not a simple sum of the grade blocks. It equals the sum of the three mother-tongue blocks in 5,357 schools and something else in the other 764, and DepEd has not documented how it was derived. The grade-and-language blocks are therefore the safer unit, and the school-level shares are used only as DepEd published them. Second, CRLA test-takers exceed Grade 1 to 3 enrollment in 2,129 schools, because the screen is given at a different point in the year from the enrollment count.
CRLA reading levels by grade and language
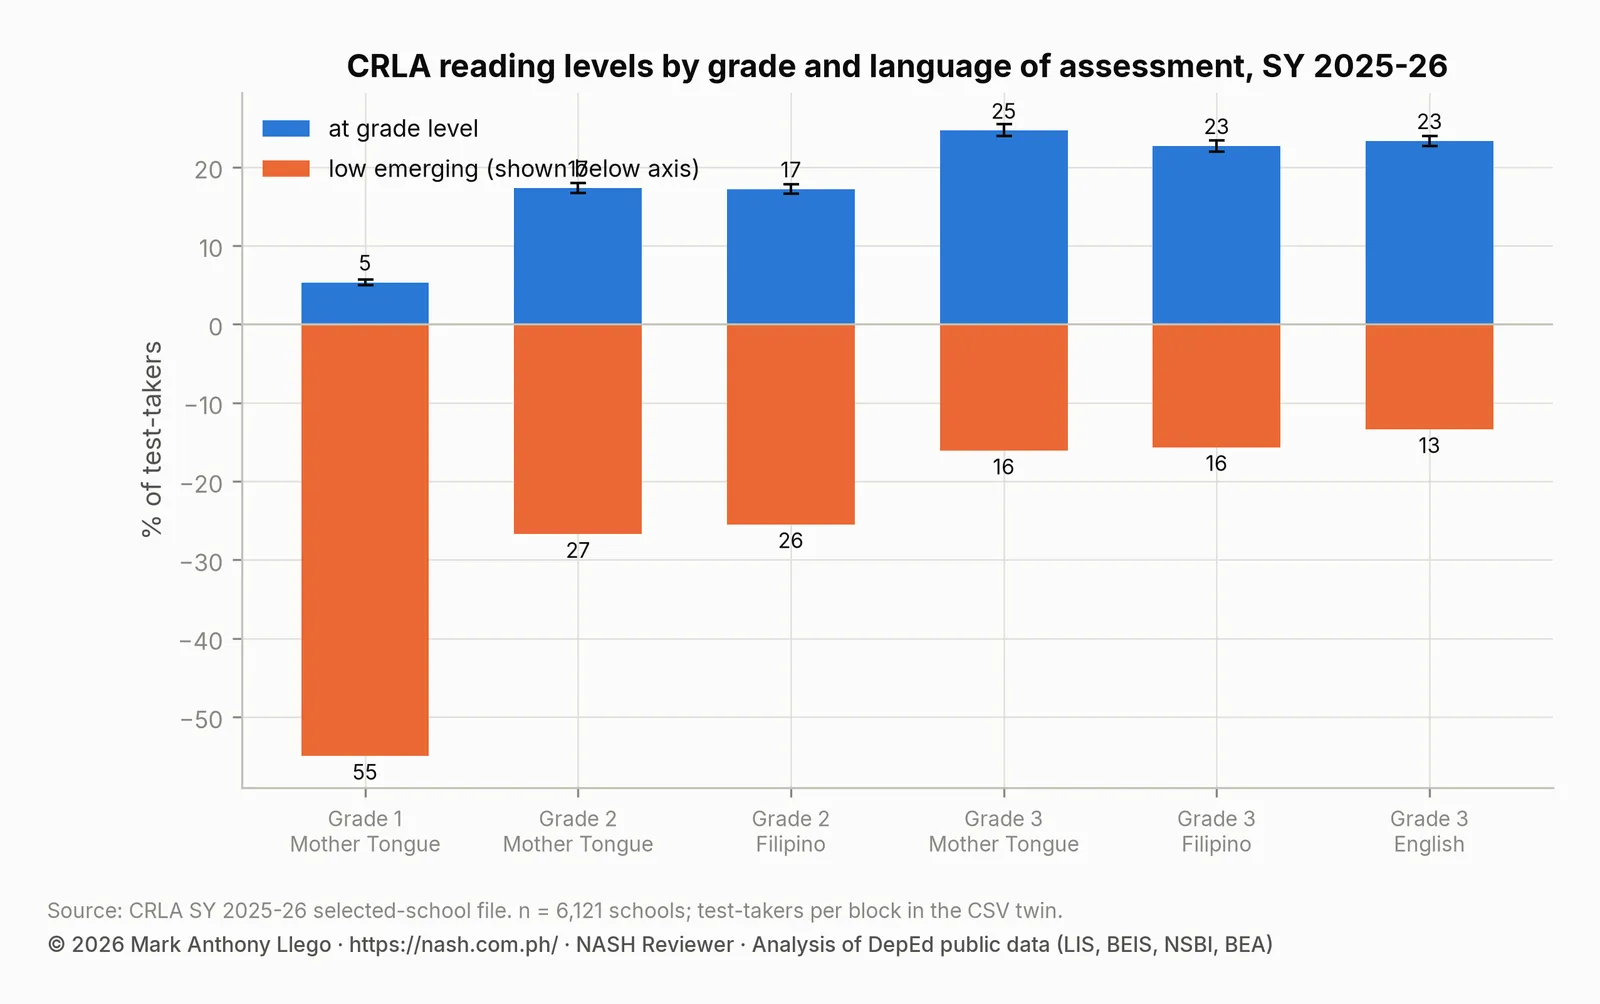
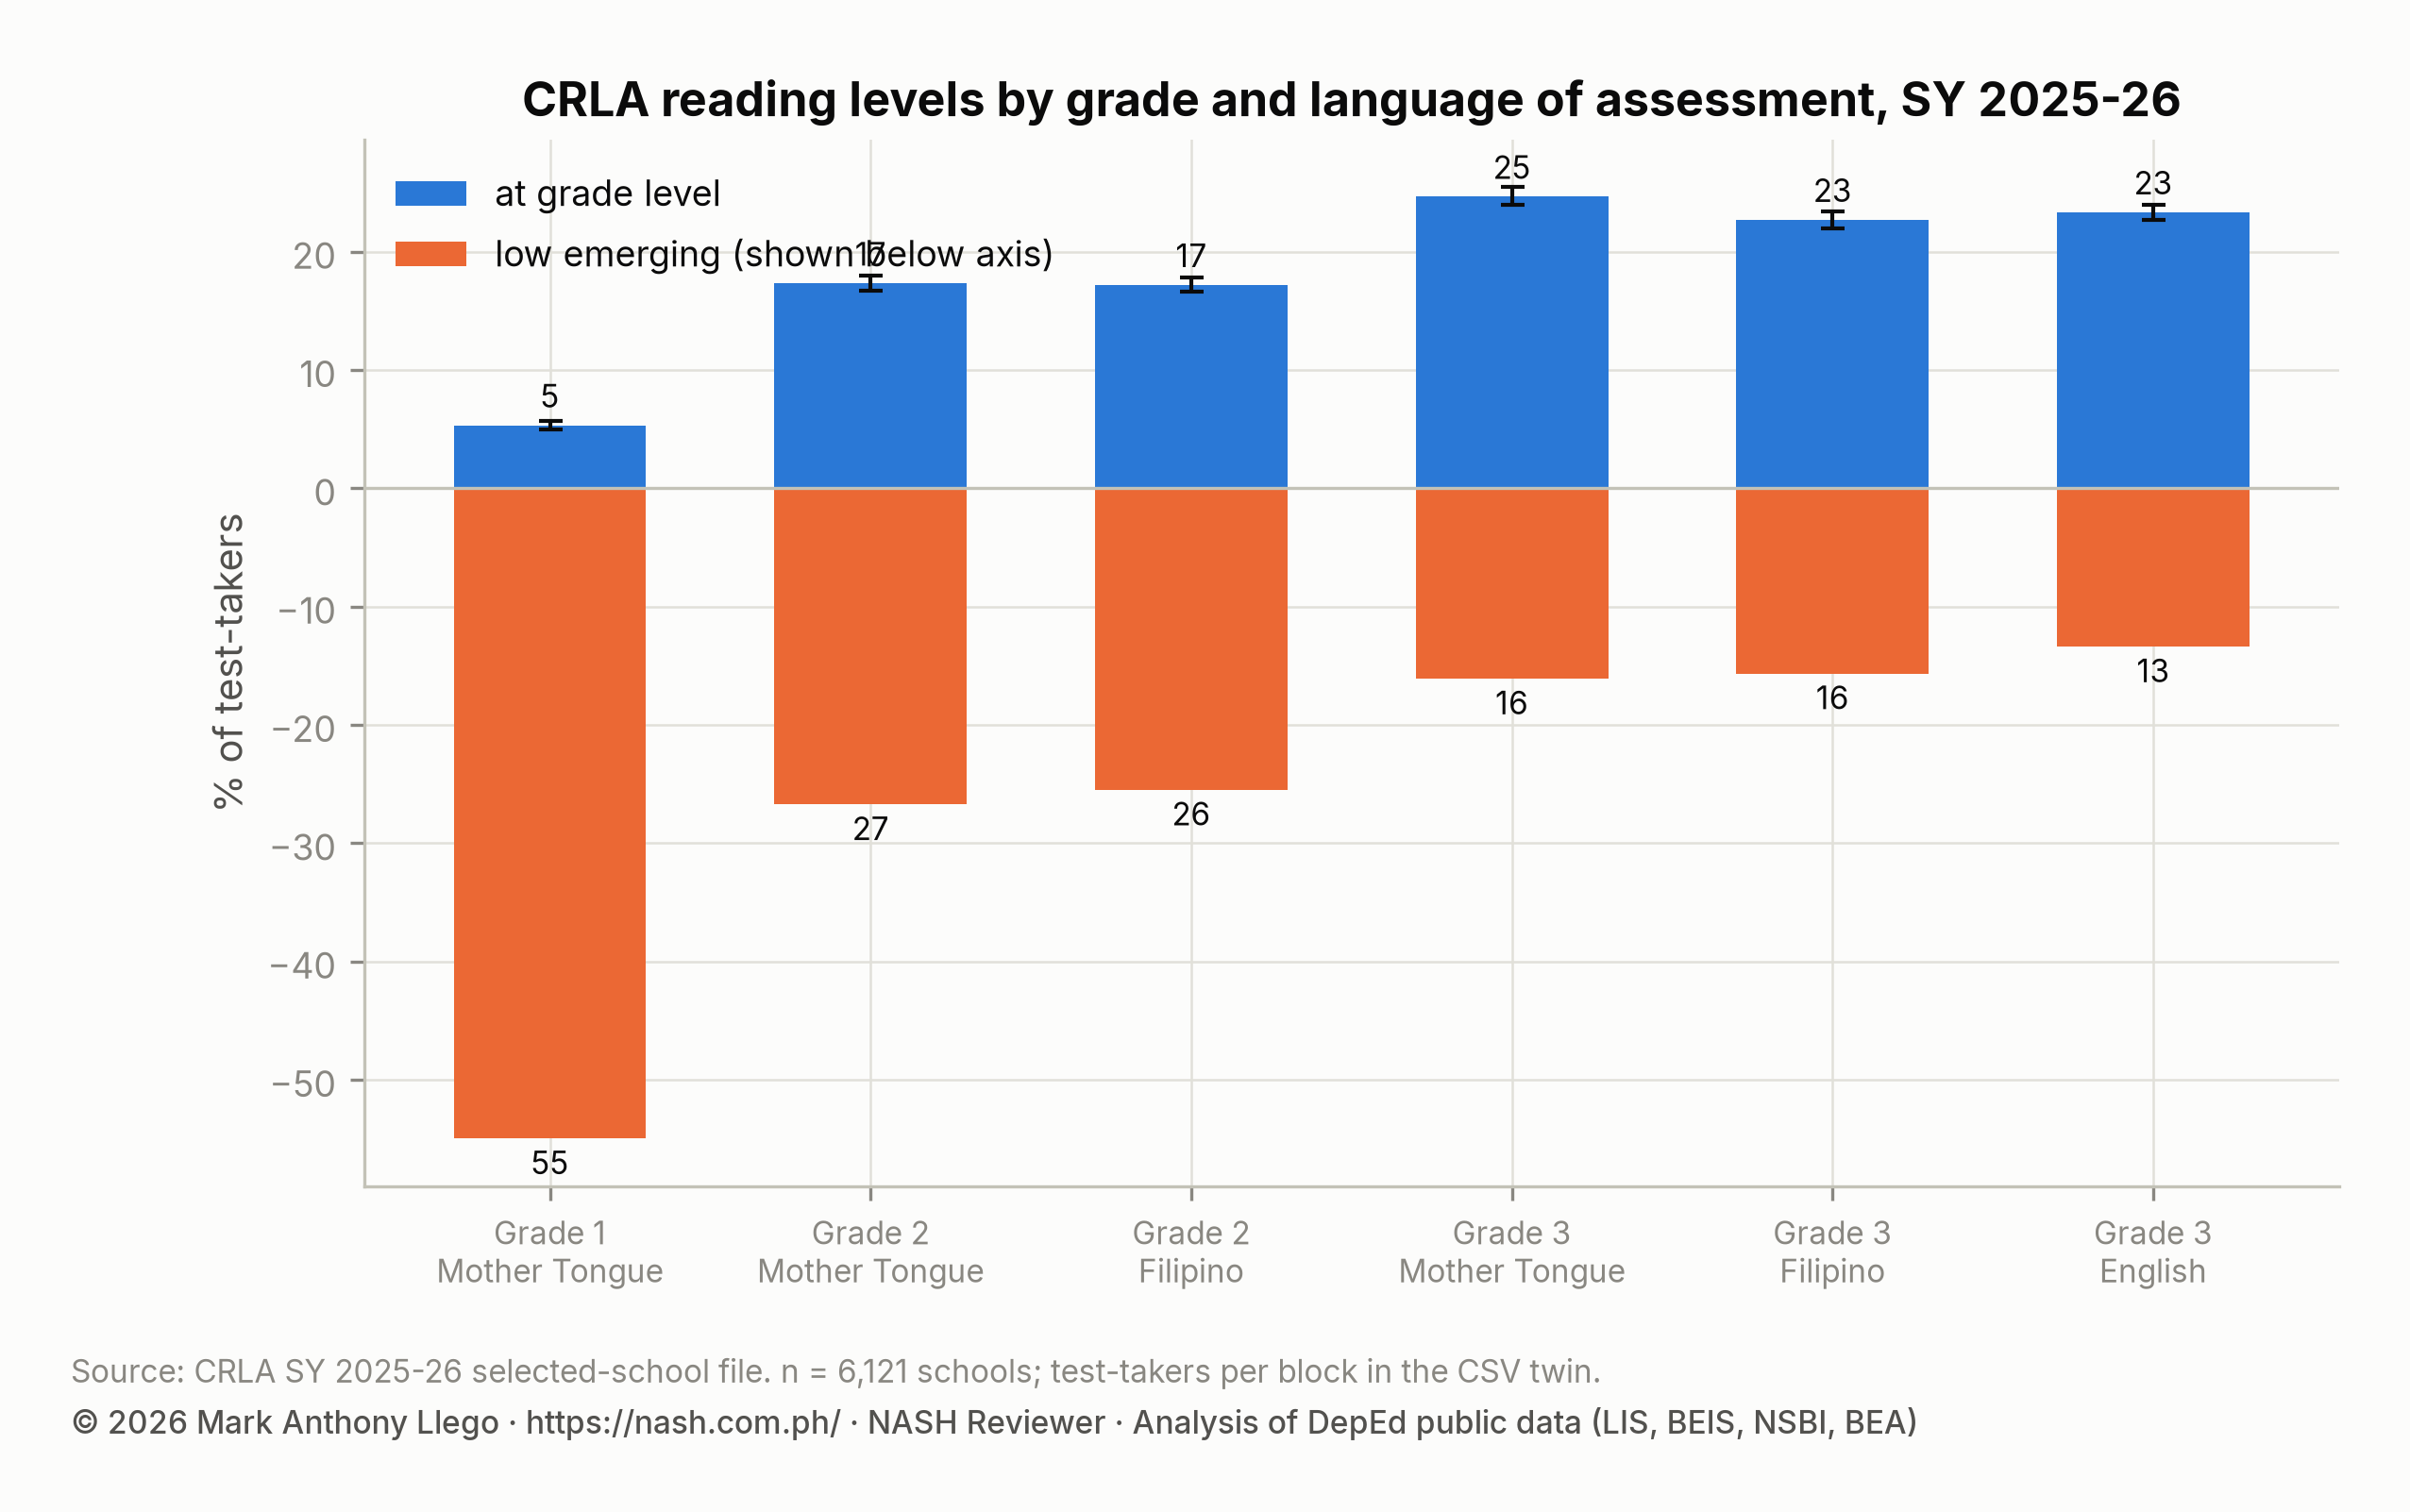
Pooling all assessed schools, the share at grade level rises with each grade and the share at low emerging falls, in every language. In Grade 1 mother tongue, 5.3% of learners read at grade level (95% interval 5.0% to 5.7%). Another 55.0% are low emerging (54.2% to 55.9%). In Grade 2, 17.3% are at grade level in the mother tongue and 17.2% in Filipino, with 27% and 26% low emerging. In Grade 3, 24.6% are at grade level in the mother tongue and 22.7% in Filipino. In English, 23.3% are at grade level (22.7% to 24.0%). Low emerging falls to 16%, 16% and 13% in those three Grade 3 blocks.
| Grade and language | Schools | Test-takers | At grade level (95% CI) | Low emerging (95% CI) |
|---|---|---|---|---|
| Grade 1, Mother Tongue | 6,090 | 199,903 | 5.3 (5.0–5.7)% | 55.0 (54.2–55.9)% |
| Grade 2, Mother Tongue | 6,060 | 221,487 | 17.3 (16.7–17.9)% | 26.7 (26.1–27.4)% |
| Grade 2, Filipino | 6,096 | 220,074 | 17.2 (16.6–17.8)% | 25.5 (24.9–26.1)% |
| Grade 3, Mother Tongue | 5,920 | 227,945 | 24.6 (23.9–25.4)% | 16.1 (15.6–16.6)% |
| Grade 3, Filipino | 6,056 | 232,270 | 22.7 (22.0–23.4)% | 15.7 (15.2–16.1)% |
| Grade 3, English | 5,918 | 227,704 | 23.3 (22.7–24.0)% | 13.4 (12.9–13.9)% |
Two readings follow. The first concerns timing. It is expected that a Grade 1 learner is not yet reading in the first months of school, so the 55% low emerging figure partly reflects when in the year the screen is given. The second matters more for a school head. By the end of Key Stage 1, three learners in four are still not reading at grade level in any of the three languages. One in six is still at the lowest level.
CRLA results by region
Region III has the highest share of learners at grade level, 18.4% (95% interval 17.7% to 19.2%). Region IX (15.0%), Region I (14.2%) and CAR (13.8%) follow. Region VIII is lowest at 12.7% (12.1% to 13.3%). The order for low emerging is different: Region IX has the most (34.2%), then Region I (31.6%), Region VIII (31.2%), Region III (28.8%) and CAR (27.6%). The intervals resample schools within each region 2,000 times, so they reflect school-to-school variation as well as learner counts. Wilson intervals on the learner counts alone are narrower and are in the data file.
| Region | Schools | Test-takers | At grade level (95% CI) | Low emerging (95% CI) | Rank by at-grade share (95% interval) |
|---|---|---|---|---|---|
| CAR | 772 | 45,478 | 13.8 (12.8–14.8)% | 27.6 (26.1–29.0)% | 4 (2–5) |
| Region I | 1,131 | 112,796 | 14.2 (13.5–15.0)% | 31.6 (30.7–32.5)% | 3 (2–4) |
| Region III | 1,384 | 272,607 | 18.4 (17.7–19.2)% | 28.8 (28.0–29.7)% | 1 (1–1) |
| Region IX | 810 | 70,091 | 15.0 (13.9–16.0)% | 34.2 (32.8–35.5)% | 2 (2–4) |
| Region VIII | 2,024 | 146,709 | 12.7 (12.1–13.3)% | 31.2 (30.3–32.2)% | 5 (4–5) |
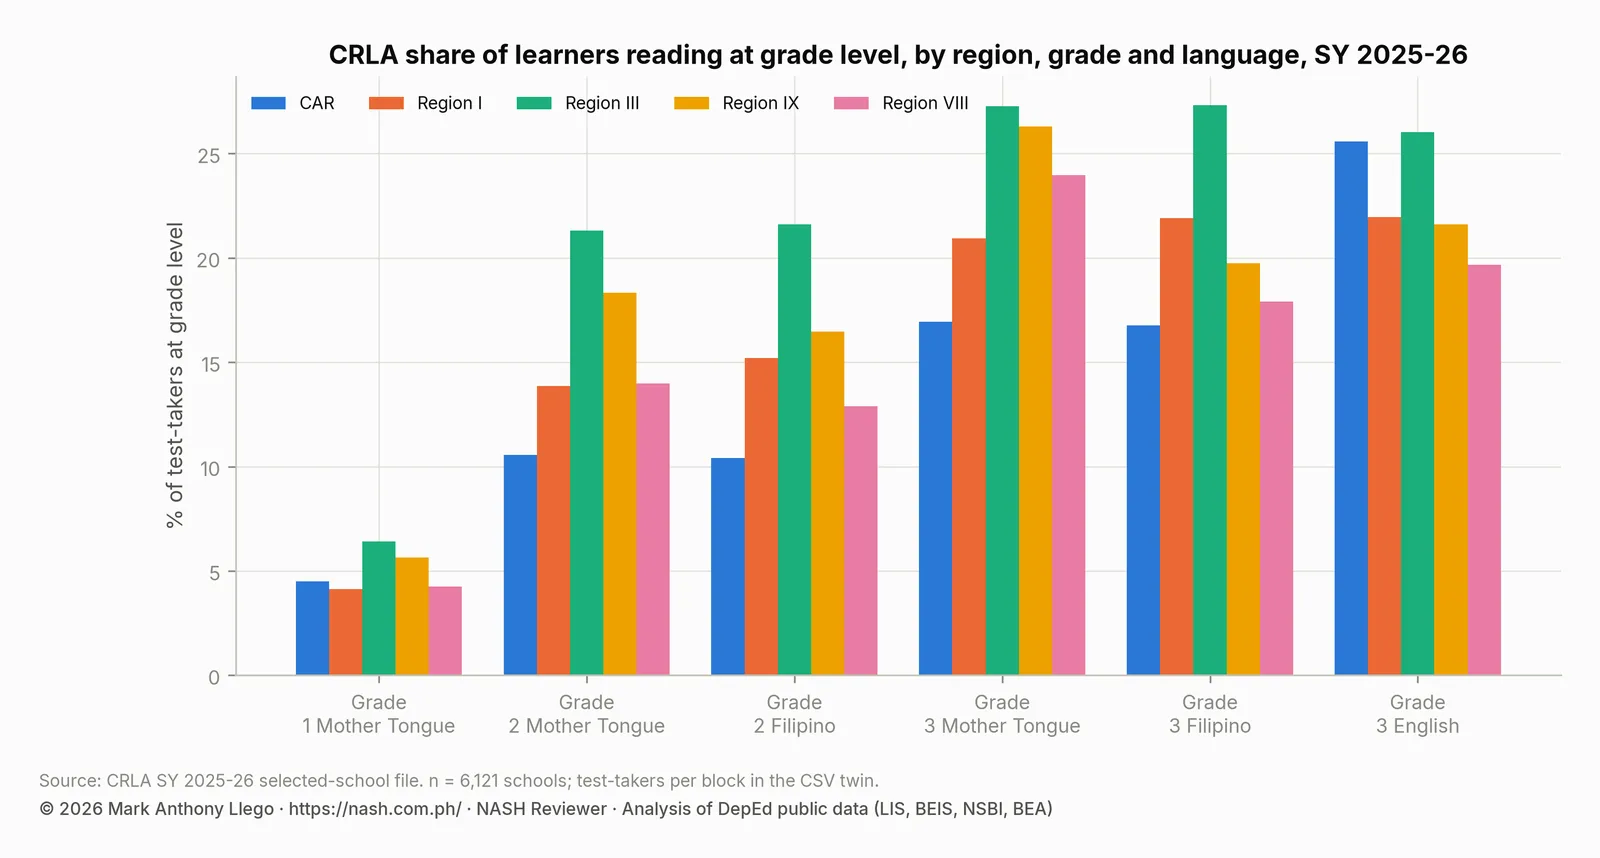
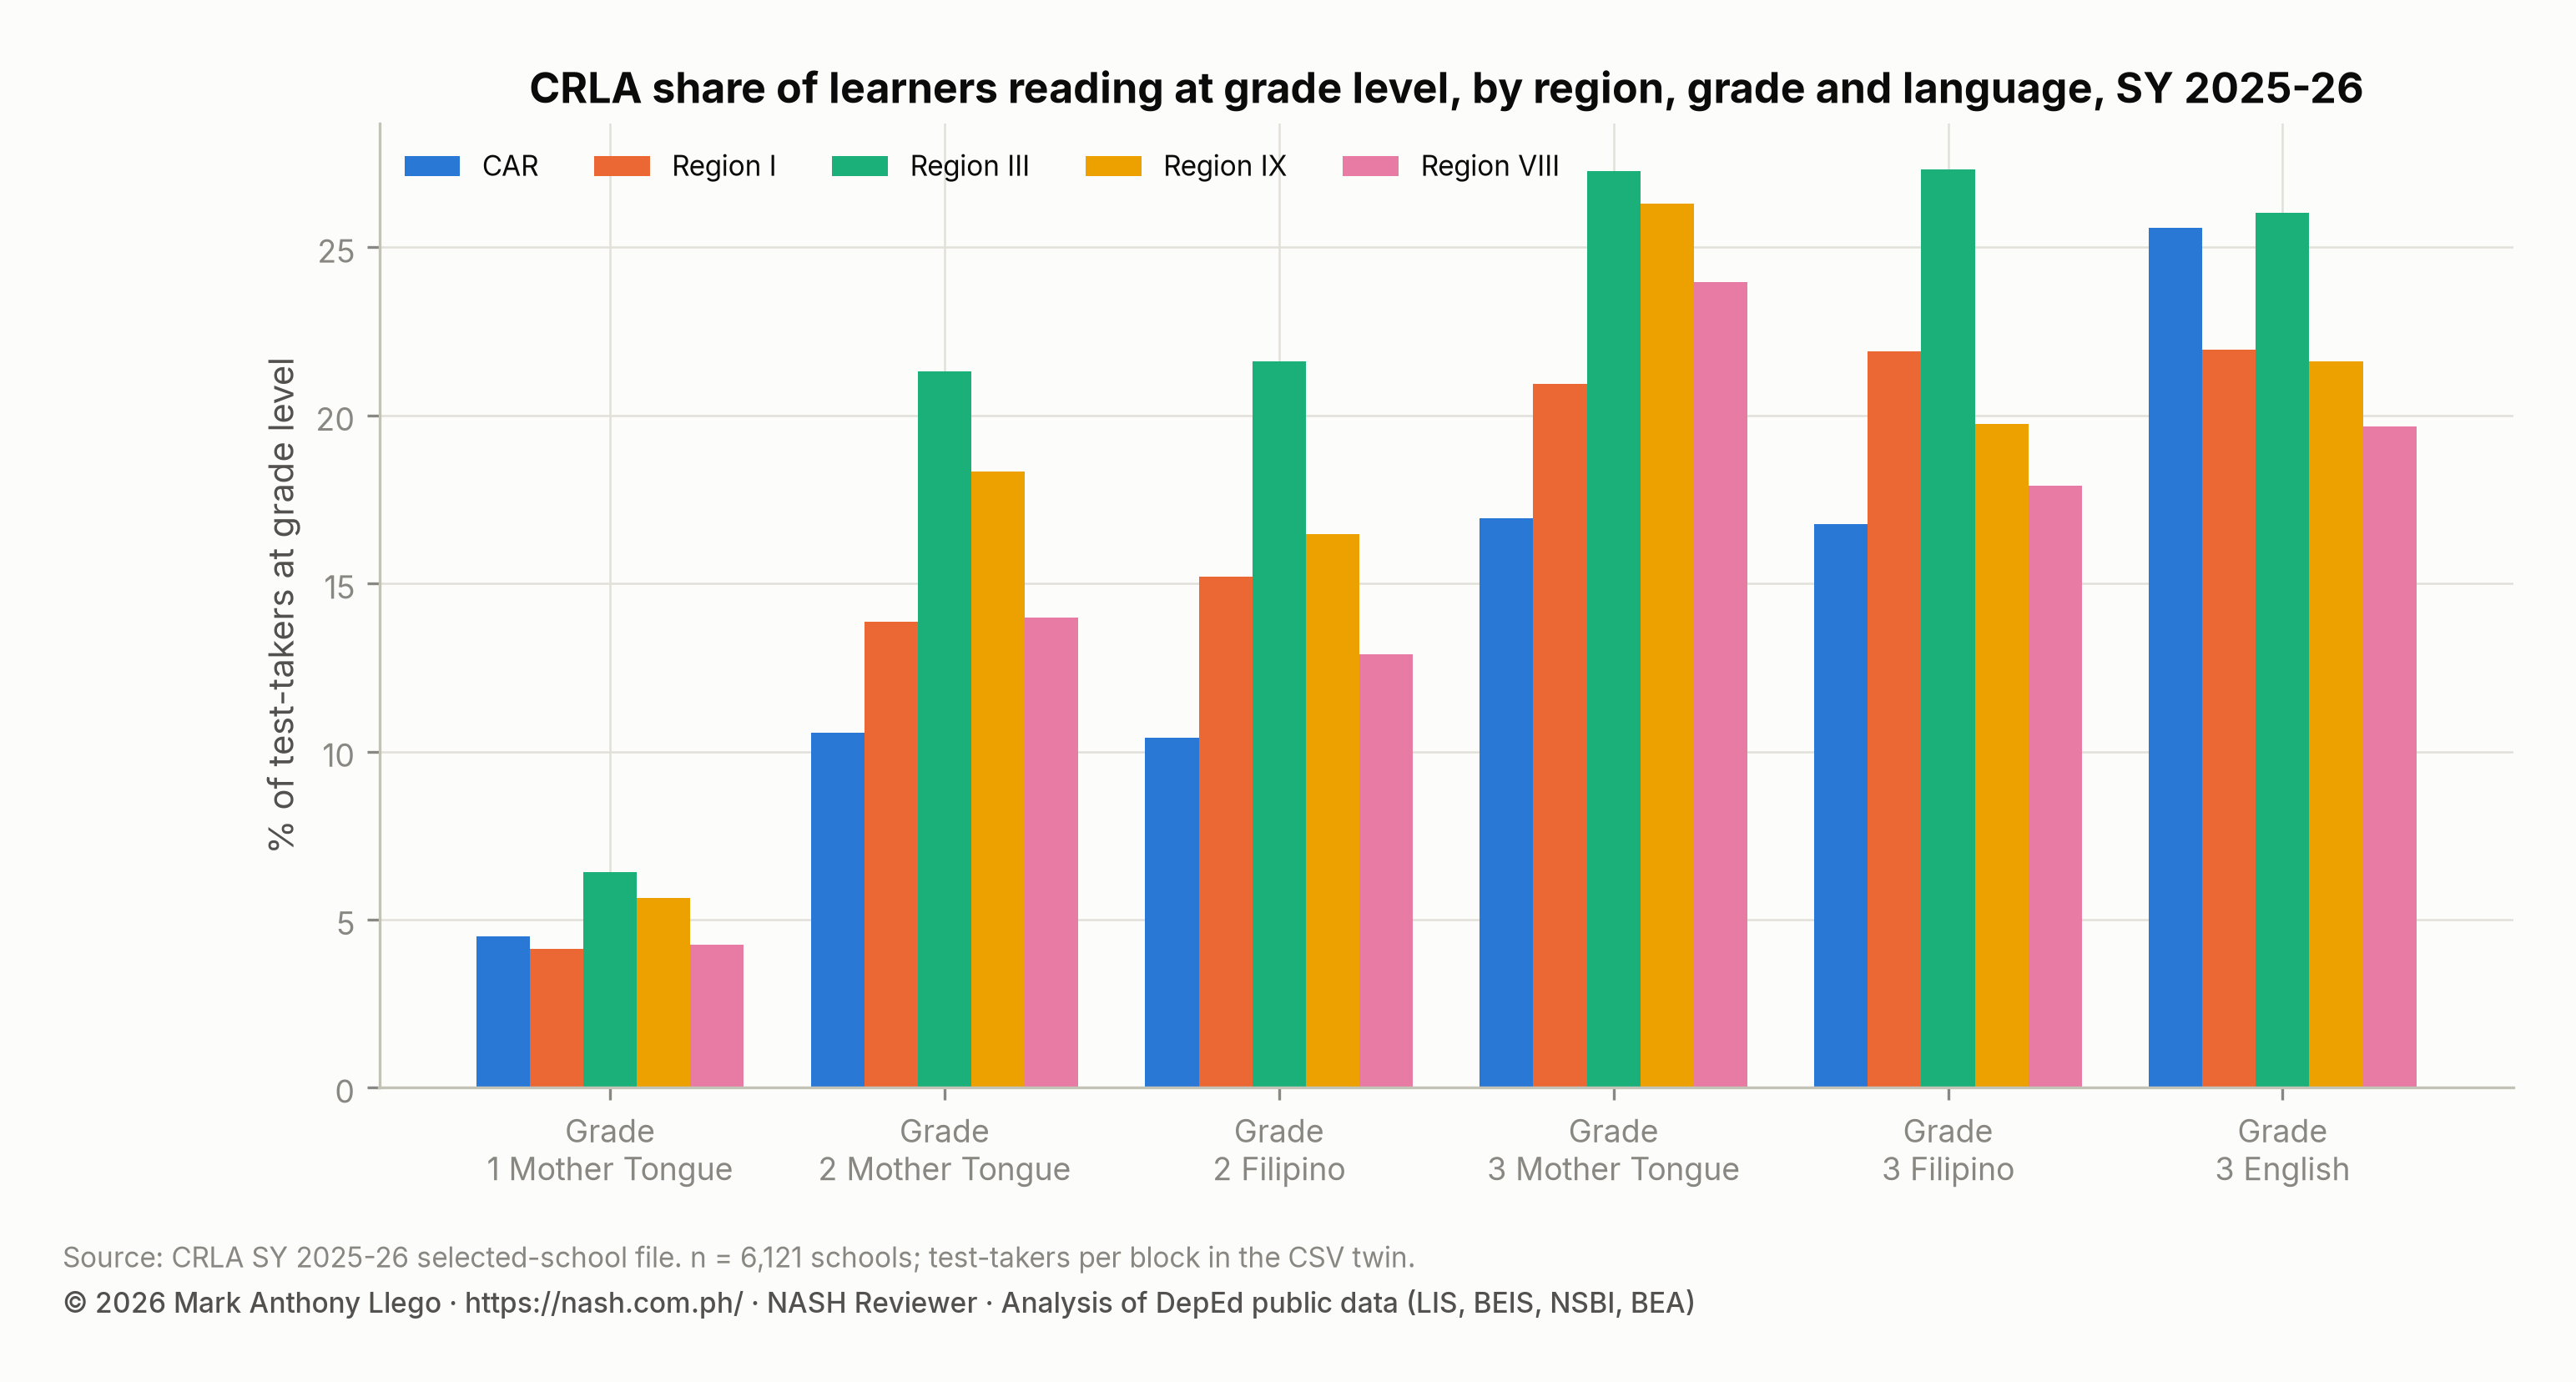
By grade and language, the regional order holds. Grade 1 mother tongue is 4% to 6% at grade level in every region. Region III leads every Grade 2 and Grade 3 block, with 27.3% in Grade 3 mother tongue and Filipino. Region IX’s Grade 1 learners are the most likely to be low emerging (62.2%). Yet its Grade 3 mother-tongue share at grade level (26.3%) is second only to Region III’s. CAR is unusual: its learners read better in English (25.6% at grade level in Grade 3) than in the mother tongue (16.9%).
| Grade and language | CAR: at grade / low emerging | Region I: at grade / low emerging | Region III: at grade / low emerging | Region IX: at grade / low emerging | Region VIII: at grade / low emerging |
|---|---|---|---|---|---|
| Grade 1 Mother Tongue | 4.5% / 51.8% | 4.1% / 53.2% | 6.4% / 54.0% | 5.6% / 62.2% | 4.3% / 55.8% |
| Grade 2 Mother Tongue | 10.6% / 26.6% | 13.9% / 28.9% | 21.3% / 24.7% | 18.3% / 29.1% | 14.0% / 28.1% |
| Grade 2 Filipino | 10.4% / 24.6% | 15.2% / 27.5% | 21.6% / 24.1% | 16.5% / 27.4% | 12.9% / 26.0% |
| Grade 3 Mother Tongue | 16.9% / 13.3% | 20.9% / 18.8% | 27.3% / 14.5% | 26.3% / 18.0% | 24.0% / 17.2% |
| Grade 3 Filipino | 16.8% / 13.3% | 21.9% / 18.3% | 27.3% / 14.5% | 19.7% / 17.4% | 17.9% / 15.8% |
| Grade 3 English | 25.6% / 8.8% | 21.9% / 16.8% | 26.0% / 10.9% | 21.6% / 16.4% | 19.7% / 15.2% |
CRLA results by language of instruction
Among languages with at least 50 assessed schools, Kapampangan schools have the highest share at grade level, 19.4% (17.0% to 22.3%). Tagalog (17.3%), Sinugbuanong Binisaya (14.8%), Pangasinan (14.6%) and Ilokano (14.0%) follow. Waray schools are lowest at 12.0% (11.2% to 12.8%). This is almost the reverse of the ELLNA, where Waray schools scored highest and Kapampangan and Pangasinan schools lowest. That reversal is a first sign that the two instruments measure different things or are administered differently.
| Language of instruction | Schools | Test-takers | At grade level (95% CI) |
|---|---|---|---|
| Kapampangan | 83 | 14,335 | 19.4 (17.0–22.3)% |
| Tagalog | 2,135 | 336,387 | 17.3 (16.7–18.0)% |
| Sinugbuanong Binisaya/Cebuano | 1,352 | 112,527 | 14.8 (14.0–15.6)% |
| Pangasinan/Pangasinense | 157 | 25,511 | 14.6 (13.0–16.0)% |
| Ilokano/Iloko | 940 | 57,298 | 14.0 (13.1–14.8)% |
| Waray | 1,435 | 99,875 | 12.0 (11.2–12.8)% |
CRLA results by division
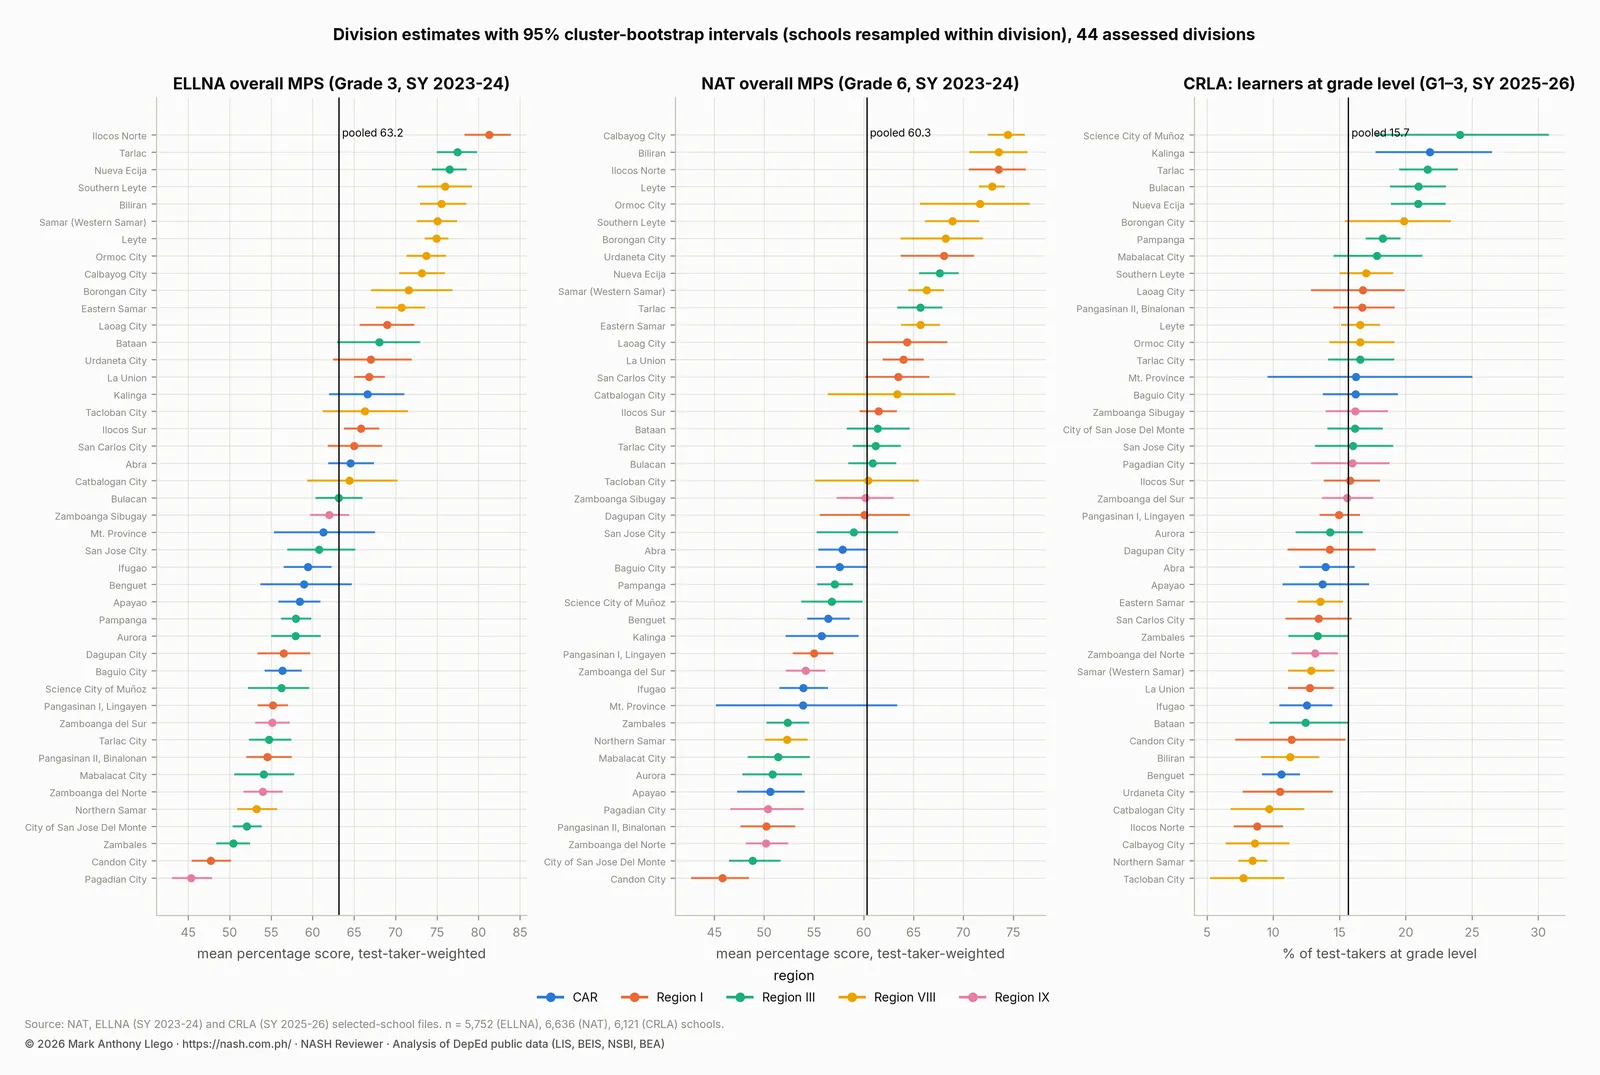
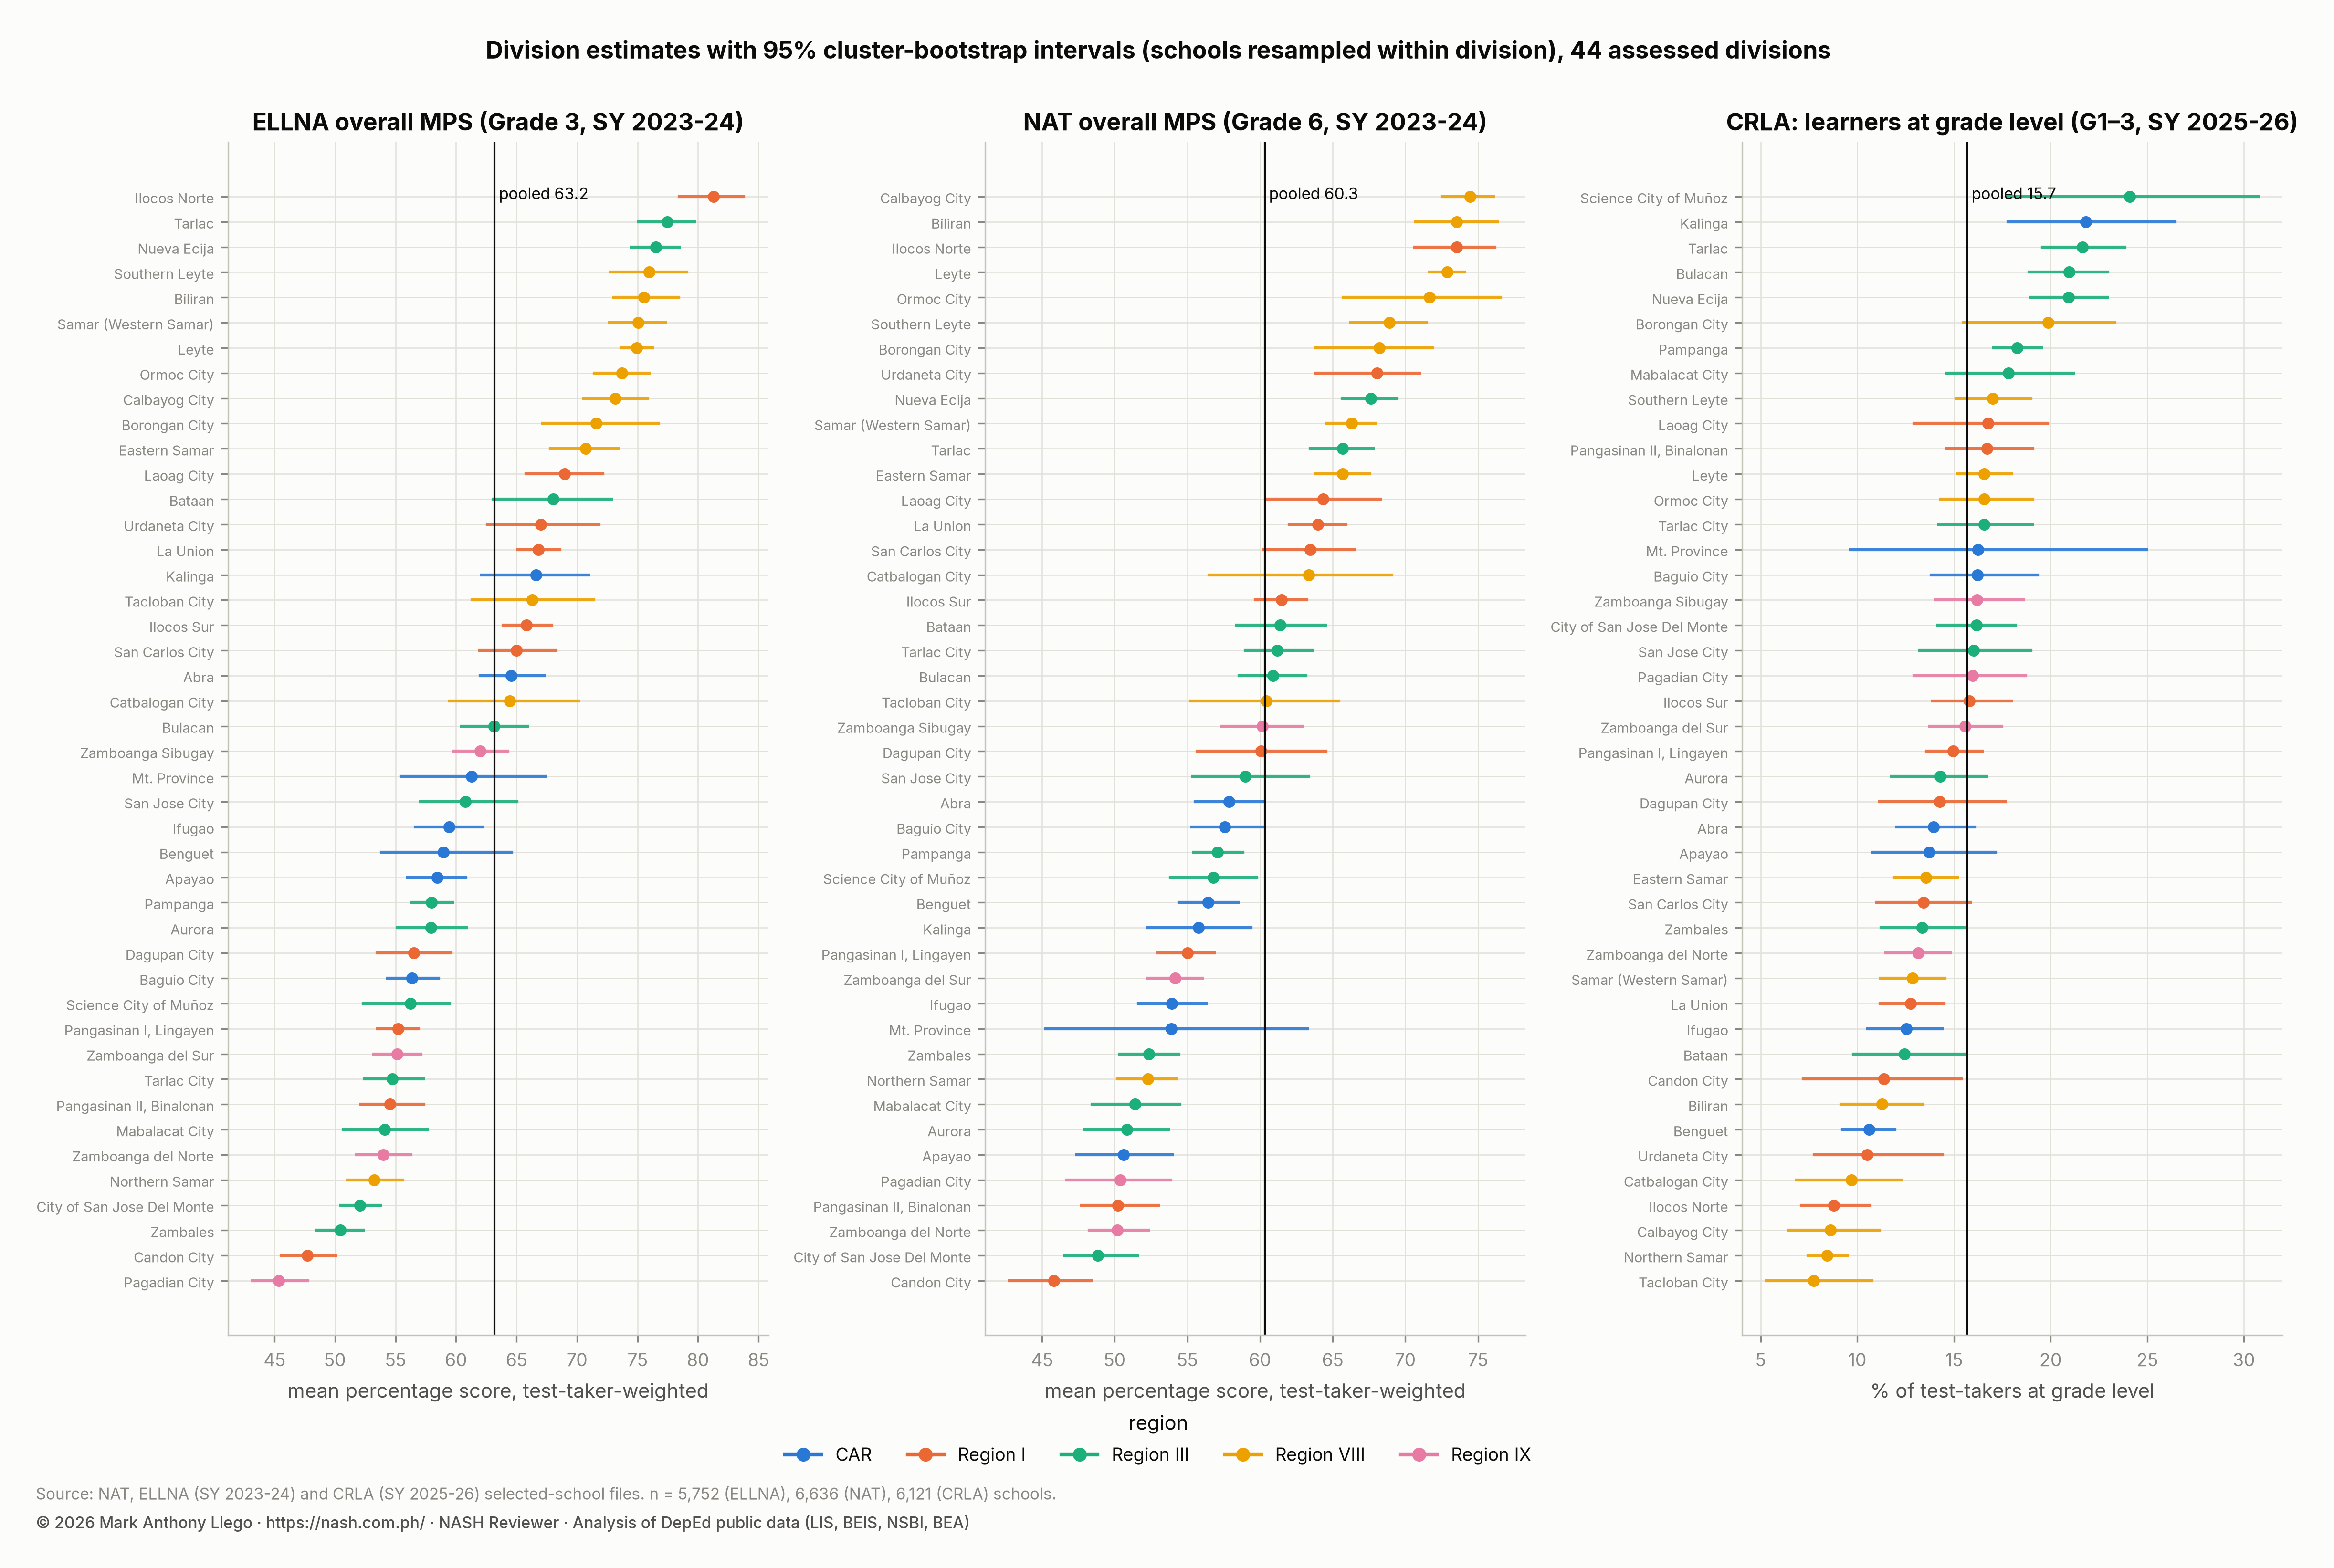
Science City of Muñoz leads at 24.1% (interval 17.7% to 30.7%). Kalinga (21.8%), Tarlac (21.7%), Bulacan (20.9%) and Nueva Ecija (20.9%) complete the top five. Tacloban City is lowest at 7.7% (5.3% to 10.7%). Northern Samar (8.4%), Calbayog City (8.6%), Ilocos Norte (8.8%), Catbalogan City (9.7%) and Urdaneta City (10.5%) are the next five from the bottom. Each division is compared with the pooled share of 15.7%, with Benjamini–Hochberg adjustment for the 44 comparisons. On that test, 13 divisions are significantly below the pooled share and 6 are above it. Between-division differences account for only 11% of the variance in school shares, against 36% for the ELLNA. The CRLA therefore varies more from school to school and less from division to division than the other two assessments.
| Division (region) | Schools | Test-takers | At grade level (95% CI) | Rank (95% interval) | Difference from pooled mean | Significant (BH 5%) |
|---|---|---|---|---|---|---|
| Science City of Muñoz (Region III) | 34 | 3,830 | 24.1 (17.7–30.7)% | 1 (1–9) | +8.4% | yes |
| Kalinga (CAR) | 58 | 2,058 | 21.8 (17.8–26.4)% | 2 (1–9) | +6.1% | yes |
| Tarlac (Region III) | 221 | 30,677 | 21.7 (19.6–23.8)% | 3 (1–6) | +6.0% | yes |
| Bulacan (Region III) | 176 | 56,000 | 20.9 (18.9–22.9)% | 4 (1–7) | +5.3% | yes |
| Nueva Ecija (Region III) | 254 | 30,639 | 20.9 (18.9–22.9)% | 5 (1–7) | +5.3% | yes |
| Borongan City (Region VIII) | 51 | 3,769 | 19.9 (15.5–23.3)% | 6 (1–20) | +4.2% | no |
| Pampanga (Region III) | 219 | 41,231 | 18.3 (17.0–19.5)% | 7 (6–13) | +2.6% | yes |
| Mabalacat City (Region III) | 40 | 13,352 | 17.8 (14.6–21.2)% | 8 (4–24) | +2.1% | no |
| Southern Leyte (Region VIII) | 136 | 6,367 | 17.0 (15.1–19.0)% | 9 (7–22) | +1.3% | no |
| Laoag City (Region I) | 34 | 3,780 | 16.7 (12.9–19.8)% | 10 (6–31) | +1.1% | no |
| Pangasinan II, Binalonan (Region I) | 186 | 17,726 | 16.7 (14.6–19.1)% | 11 (7–24) | +1.0% | no |
| Leyte (Region VIII) | 548 | 34,983 | 16.6 (15.2–18.0)% | 12 (8–22) | +0.9% | no |
| Ormoc City (Region VIII) | 81 | 12,088 | 16.6 (14.3–19.1)% | 13 (7–25) | +0.9% | no |
| Tarlac City (Region III) | 87 | 18,649 | 16.6 (14.2–19.1)% | 14 (7–25) | +0.9% | no |
| Mt. Province (CAR) | 14 | 505 | 16.2 (9.6–25.0)% | 15 (1–39) | +0.6% | no |
| Baguio City (CAR) | 43 | 12,041 | 16.2 (13.8–19.3)% | 16 (6–27) | +0.5% | no |
| Zamboanga Sibugay (Region IX) | 166 | 14,017 | 16.2 (14.0–18.6)% | 17 (7–27) | +0.5% | no |
| City of San Jose Del Monte (Region III) | 38 | 31,772 | 16.2 (14.2–18.2)% | 18 (8–25) | +0.5% | no |
| San Jose City (Region III) | 50 | 7,556 | 16.0 (13.2–19.0)% | 19 (7–29) | +0.3% | no |
| Pagadian City (Region IX) | 62 | 11,514 | 16.0 (12.9–18.7)% | 20 (7–31) | +0.3% | no |
| Ilocos Sur (Region I) | 195 | 9,527 | 15.8 (13.9–18.0)% | 21 (9–27) | +0.1% | no |
| Zamboanga del Sur (Region IX) | 292 | 21,797 | 15.6 (13.7–17.5)% | 22 (10–28) | -0.1% | no |
| Pangasinan I, Lingayen (Region I) | 261 | 32,688 | 14.9 (13.6–16.5)% | 23 (14–28) | -0.7% | no |
| Aurora (Region III) | 77 | 6,044 | 14.3 (11.8–16.7)% | 24 (13–35) | -1.4% | no |
| Dagupan City (Region I) | 34 | 8,251 | 14.3 (11.1–17.6)% | 25 (10–37) | -1.4% | no |
| Abra (CAR) | 195 | 7,752 | 13.9 (12.0–16.1)% | 26 (16–35) | -1.7% | no |
| Apayao (CAR) | 72 | 3,296 | 13.7 (10.8–17.2)% | 27 (11–38) | -2.0% | no |
| Eastern Samar (Region VIII) | 189 | 10,073 | 13.5 (11.9–15.2)% | 28 (21–35) | -2.1% | yes |
| San Carlos City (Region I) | 60 | 10,062 | 13.4 (11.0–15.8)% | 29 (18–37) | -2.3% | no |
| Zambales (Region III) | 117 | 17,779 | 13.3 (11.2–15.6)% | 30 (18–37) | -2.3% | no |
| Zamboanga del Norte (Region IX) | 290 | 22,763 | 13.1 (11.5–14.8)% | 31 (23–36) | -2.5% | yes |
| Samar (Western Samar) (Region VIII) | 335 | 15,184 | 12.9 (11.2–14.5)% | 32 (24–37) | -2.8% | yes |
| La Union (Region I) | 175 | 15,980 | 12.8 (11.2–14.5)% | 33 (24–37) | -2.9% | yes |
| Ifugao (CAR) | 171 | 7,940 | 12.5 (10.5–14.4)% | 34 (24–38) | -3.1% | yes |
| Bataan (Region III) | 71 | 15,078 | 12.4 (9.8–15.6)% | 35 (20–40) | -3.2% | no |
| Candon City (Region I) | 28 | 2,058 | 11.4 (7.2–15.4)% | 36 (20–44) | -4.3% | no |
| Biliran (Region VIII) | 87 | 8,133 | 11.3 (9.2–13.4)% | 37 (29–41) | -4.4% | yes |
| Benguet (CAR) | 219 | 11,886 | 10.6 (9.2–11.9)% | 38 (34–41) | -5.1% | yes |
| Urdaneta City (Region I) | 46 | 6,685 | 10.5 (7.8–14.4)% | 39 (24–43) | -5.2% | yes |
| Catbalogan City (Region VIII) | 50 | 6,139 | 9.7 (6.9–12.3)% | 40 (33–44) | -6.0% | yes |
| Ilocos Norte (Region I) | 112 | 6,039 | 8.8 (7.1–10.7)% | 41 (38–44) | -6.9% | yes |
| Calbayog City (Region VIII) | 157 | 11,539 | 8.6 (6.5–11.1)% | 42 (37–44) | -7.1% | yes |
| Northern Samar (Region VIII) | 343 | 26,931 | 8.4 (7.5–9.5)% | 43 (40–44) | -7.3% | yes |
| Tacloban City (Region VIII) | 47 | 11,503 | 7.7 (5.3–10.7)% | 44 (38–44) | -7.9% | yes |
Why the CRLA disagrees with the ELLNA and NAT
Ilocos Norte is first on the ELLNA, third on the NAT and 41st of 44 on the CRLA. Calbayog City is first on the NAT and 42nd on the CRLA. Northern Samar is near the bottom on all three. At school level, the CRLA share at grade level correlates at 0.06 (Spearman, 5,721 schools) with the ELLNA mean from SY 2023-2024. The ELLNA and NAT means correlate at 0.62 in the same schools.
Three explanations are consistent with the files, and they cannot be separated. First, the CRLA is a different instrument: a teacher-administered rapid screen of reading fluency and comprehension, not a multiple-choice test of language and numeracy. Second, it was given two school years later to different cohorts. Third, its school-level summary is undocumented and may be compiled differently across divisions. The disagreement rules out treating the three as interchangeable measures of “school quality”. A division with strong Grade 3 and Grade 6 scores and weak early-reading screens needs a different response from one that is weak on all three.
What this means for school heads
- The gap begins in Grade 1 reading. One learner in twenty reads at grade level in the mother tongue in Grade 1, and one in six is still at the lowest level in Grade 3. Every Philippine Professional Standards for School Heads (PPSSH) strand on curriculum, teaching and learner outcomes starts here.
- Use the CRLA for what it is. It is a classroom screen that tells a teacher which learners need which intervention. It is not a ranking instrument, and the file’s school-level summary should not be used as one.
- Expect school-to-school variation inside a division. Eighty-nine percent of the variation in CRLA shares is between schools in the same division. The comparison that matters is with neighboring schools, not the division mean.
- Watch the pupil-teacher ratio in the early grades. In the input models, a higher ratio is associated with fewer early readers at grade level. The difference is about four percentage points between a school at 15 and one at 45 learners per teacher. The CRLA is the one outcome in those models where the ratio is associated with the result.
How these numbers were made
- Source: DepEd’s CRLA SY 2025-26 selected-school file (Bureau of Education Assessment), joined to the SY 2023-24 school list (6,090 matched) and the SY 2025-26 enrollment file (6,113 matched).
- Shares are pooled learner counts: learners at a level divided by test-takers in the group. 95% intervals resample schools within each group 2,000 times; Wilson intervals on learner counts are also saved with the tables.
- Grade-and-language blocks use the file’s six blocks; school-level shares use DepEd’s published summary.
- Divisions are compared with the pooled share with Benjamini–Hochberg adjustment across 44 divisions; rank intervals come from the bootstrap draws.
- The school-level correlation with ELLNA uses the 5,721 schools in both files.
Limits
The file covers 44 of 63 divisions in five regions and about half of the public schools inside them, selected by an unpublished rule. DepEd has not documented how the school-level summary was derived, and it disagrees with the grade blocks in 764 schools. The released technical notes cover the ELLNA and NAT only and do not describe the CRLA’s reading-level cut-offs. Results describe SY 2025-2026 learners in the assessed schools and cannot be compared with earlier CRLA rounds.
Frequently asked questions
What share of Grade 1 to 3 learners read at grade level on the CRLA in SY 2025-2026?
15.7% of the 647,681 learners screened in the assessed schools in SY 2025-2026 read at grade level, and 30.3% were at the lowest level, low emerging. In Grade 1 mother tongue, 5.3% were at grade level and 55.0% low emerging.
Which DepEd region has the best CRLA early-reading results?
Region III has the best results, with 18.4% of Grade 1 to 3 learners at grade level (95% interval 17.7% to 19.2%). Region VIII had the lowest share at 12.7%. Region IX had the most learners at the lowest level, 34.2%.
Why do CRLA and ELLNA results differ for the same schools?
The two are different instruments, given two years apart to different cohorts, and the CRLA’s school-level summary is undocumented. At school level the two correlate at only 0.06, so neither should be read as a substitute for the other.
Download the data
The cleaned, harmonized DepEd files behind this series are free to download in CSV and Parquet, with a codebook and checksums, under the terms of use set out in the release. Download Cleaned DepEd School Data, SY 2017-18 to 2025-26 documents every file and column. The files themselves are at data.nash.com.ph, starting with the README, the SY 2023-24 school master file (CSV, 8.0 MB) and the nine-year enrollment panel (Parquet, 17.2 MB).
More in this series
- The EDCOM II CRLA series: CRLA End-of-Year Results SY 2025-26, CRLA Start vs End of SY 2025-26 in the Same Schools and How to Read a School’s CRLA Results Fairly
- DepEd Enrollment Trends SY 2017-2018 to SY 2025-2026
- Enrollment by school year: SY 2017-18, SY 2018-19, SY 2019-20, SY 2020-21, SY 2021-22, SY 2022-23, SY 2023-24, SY 2024-25, SY 2025-26
- DepEd Learner Data SY 2023-2024: IP, ALIVE and School Size
- DepEd Teachers and School Personnel Data, SY 2023-2024
- DepEd Classroom and School Building Data, SY 2023-2024
- DepEd WASH Data SY 2023-2024: Toilets, Water, Electricity
- DepEd ICT Data SY 2023-2024: Computers and Internet
- NAT Grade 6 Results SY 2023-2024: DepEd Division Scores
- ELLNA Grade 3 Results SY 2023-2024: DepEd Division Scores
- DepEd School Inputs vs Test Results: Multigrade and Internet
- DepEd Open Data Quality: Errors, Blanks and Coverage Limits
- Download Cleaned DepEd School Data, SY 2017-18 to 2025-26
- The full report: Philippine basic education in numbers
Guides for aspiring school heads
- DepEd Data for Aspiring School Heads: Where to Start
- NASH Practice Questions With Answers: 50 Items on the PPSSH
- How to Read DepEd Data: A Guide for Aspiring School Heads
- EDCOM II Final Report: Guide for Aspiring School Heads
- National Education Plan 2026-2035: Guide for School Heads
- NASH Study Guide: DepEd Memorandum 069, s. 2025 and PPSSH
- PPSSH Domain 1: Leading Strategically With DepEd Data
- PPSSH Domain 2: Managing School Operations With DepEd Data
- PPSSH Domain 3: Teaching and Learning With DepEd Data
- PPSSH Domain 4: Developing Self and Others With DepEd Data
- PPSSH Domain 5: Building Connections With DepEd Data
Analysis and charts by Mark Anthony Llego for NASH Reviewer. Data: Department of Education public datasets. Charts may be reused only with written permission from support@nash.com.ph.