DepEd’s SY 2017-2018 enrollment file, a school-by-school count from the Learner Information System (LIS), lists 61,563 schools and 26,311,949 learners. SY 2017-2018 is the earliest school year with a published file of this kind, so every trend in this series is measured from it. The year is worth reading on its own before any comparison, because several features of it still shape the files that followed.
Three features stand out. Grade 1 was smaller than every grade above it up to Grade 8. Private schools held nearly half of senior high school, which was only in its second year. More than 61,000 schools reported enrollment, three quarters of them elementary schools with no other level, and one in eight with 50 learners or fewer.
Classes opened on June 5, 2017. The file still calls the Bangsamoro region ARMM; it is called BARMM here. Regions are counted on their SY 2025-2026 boundaries, so Sulu’s 478 schools sit under Region IX, Cotabato City’s 86 under BARMM, and the 21 Negros divisions under the Negros Island Region.
Key findings
- The file counts 26,311,949 learners in 61,563 schools. Elementary held 15.75 million learners, junior high 7.83 million and senior high 2.73 million.
- Grade 1 was the smallest grade from kindergarten to Grade 8. It held 1,927,095 learners, against 2,268,455 in kindergarten and 2,485,840 in Grade 6, the largest grade.
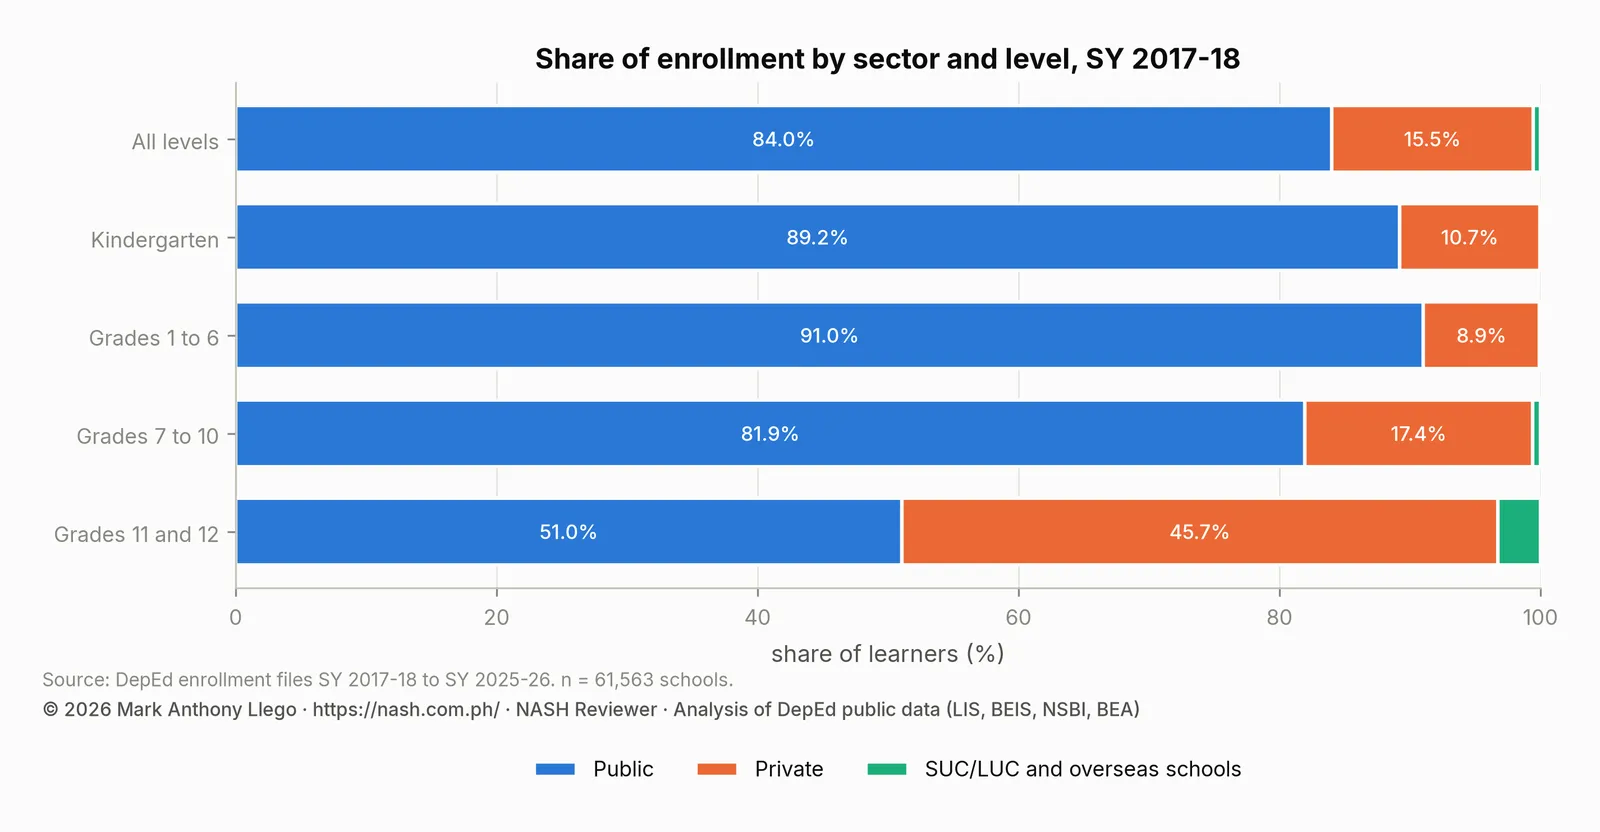
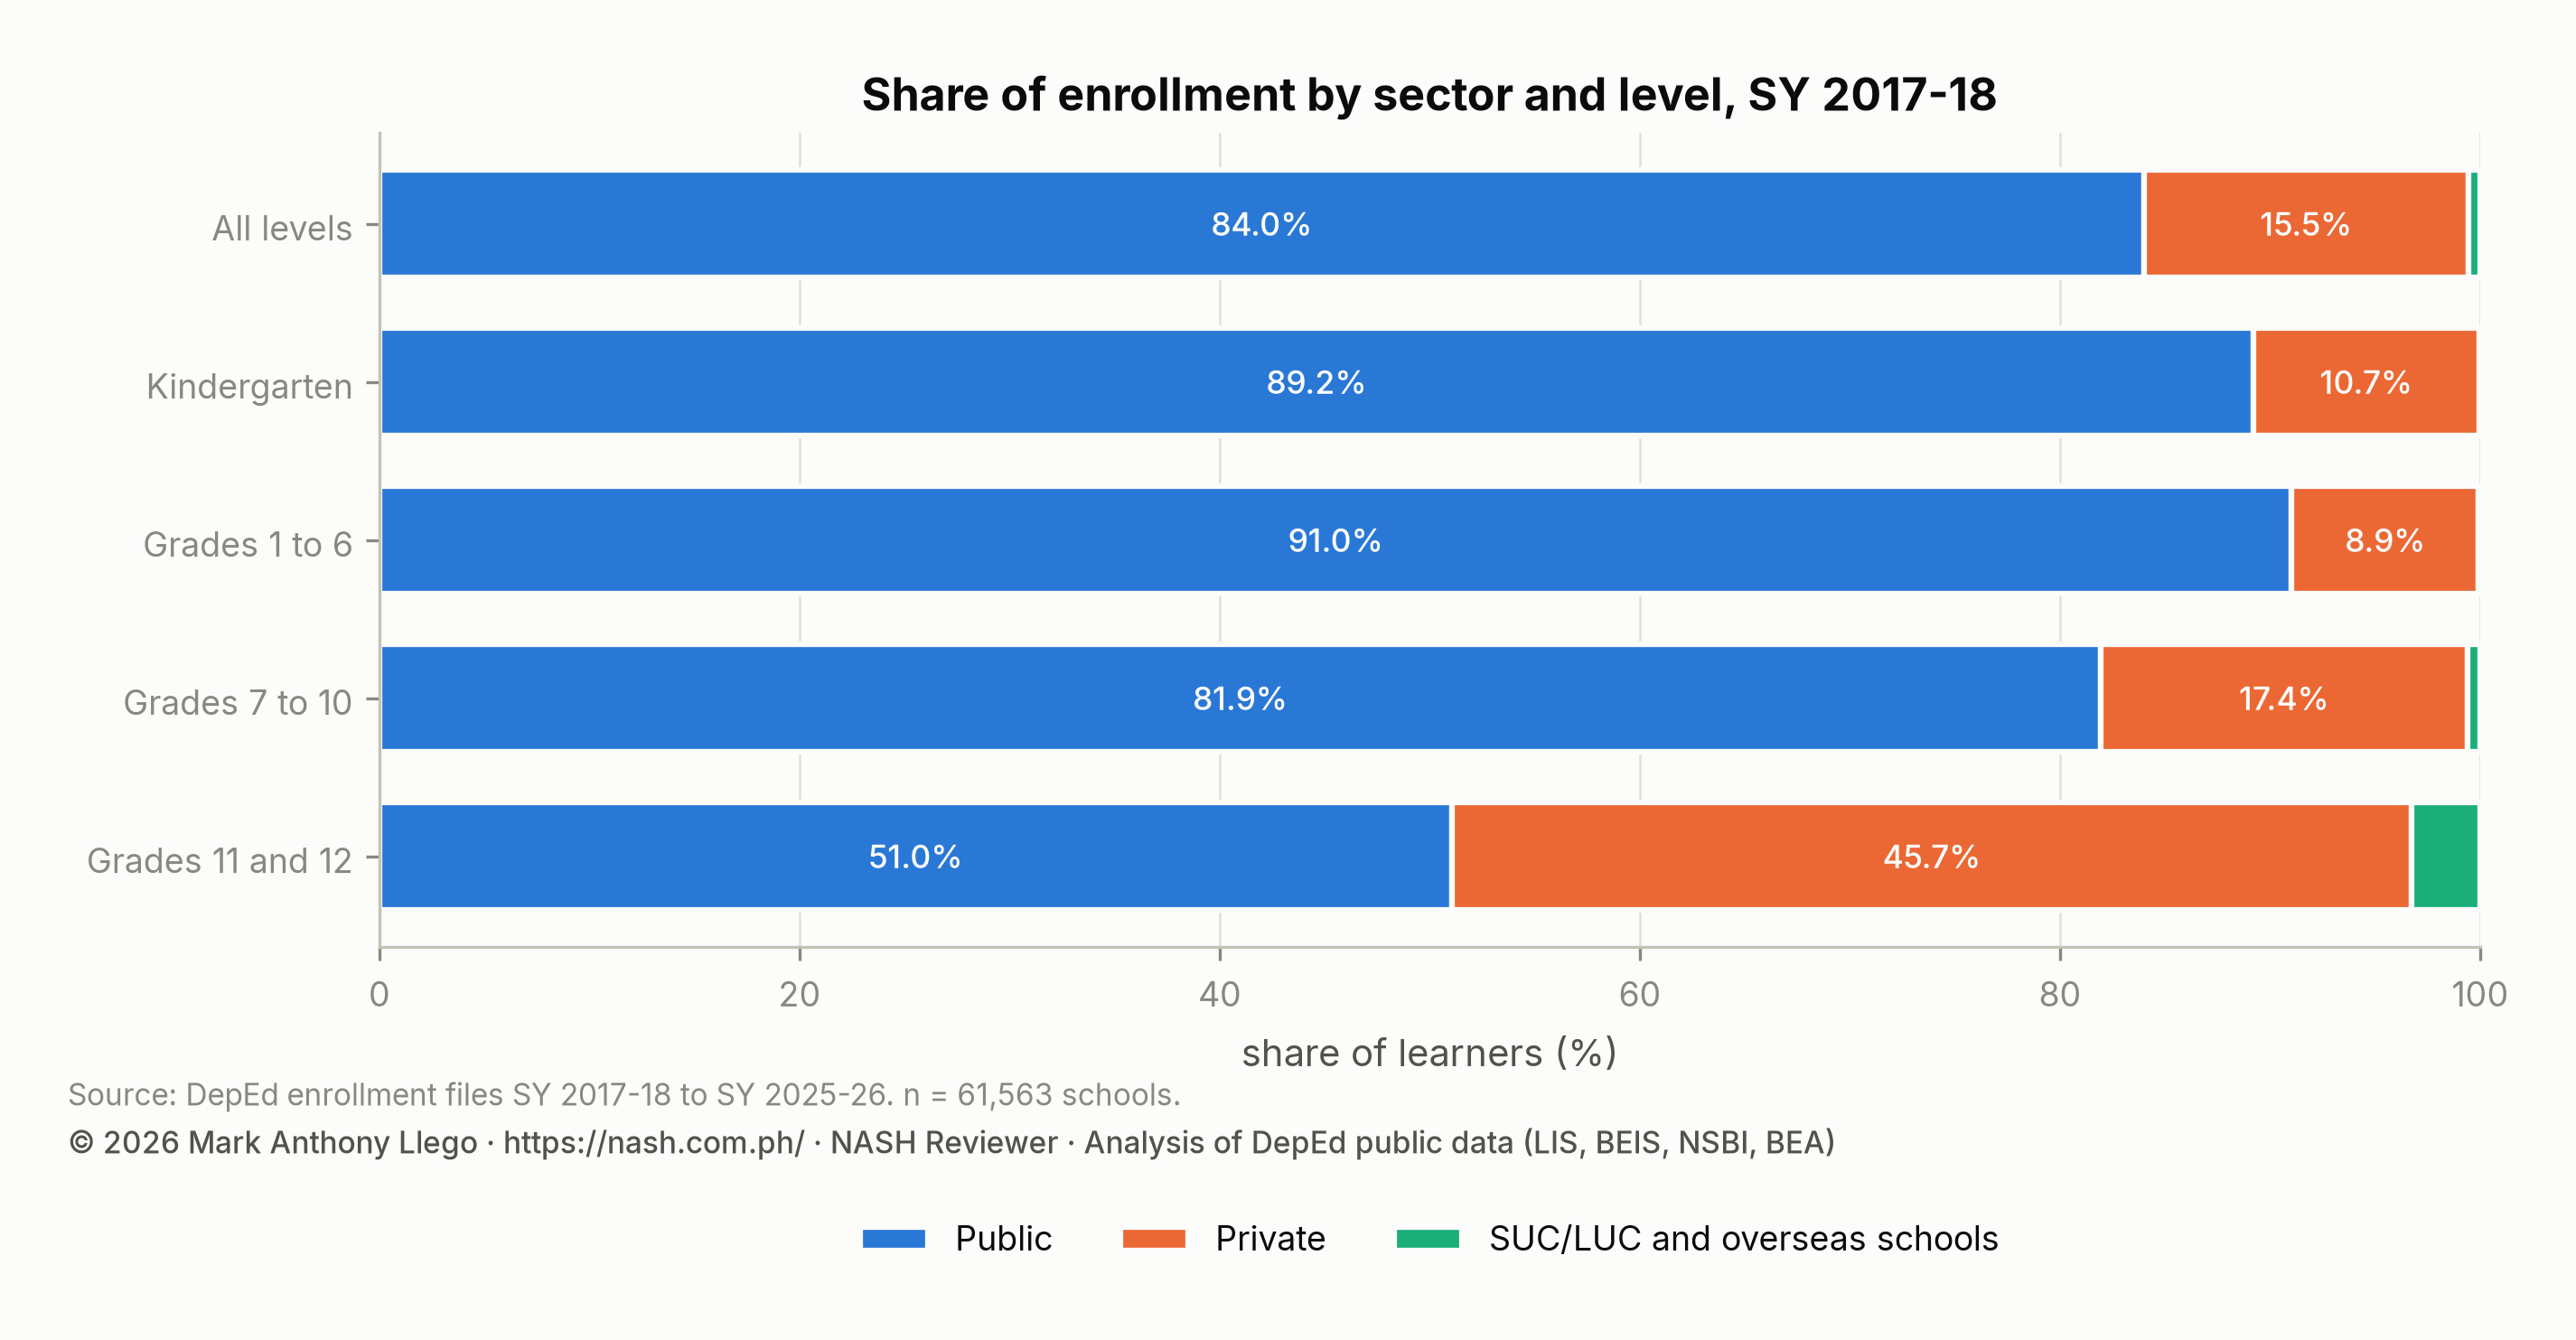
- Private schools held 45.7% of senior high learners. Their share of all learners was 15.5%, and no later file shows a private share of senior high this high.
- Three quarters of schools offered elementary only. These 45,490 schools held 54.8% of learners, and 7,383 schools of all kinds had 50 learners or fewer.
- Region IV-A was the largest region with 3.69 million learners. NCR had 2.87 million and Region III 2.84 million; CAR was the smallest with 436,484.
Enrollment by level and sex in SY 2017-2018
| Item | SY 2017-18 |
|---|---|
| Schools in the file | 61,563 |
| Schools reporting enrollment | 61,563 |
| Total enrollment | 26,311,949 |
| Kindergarten | 2,268,455 |
| Grades 1 to 6 | 13,418,841 |
| Elementary non-graded | 64,779 |
| Elementary (K to 6 and non-graded) | 15,752,075 |
| Junior high school (Grades 7 to 10 and non-graded) | 7,826,414 |
| Senior high school (Grades 11 and 12) | 2,733,460 |
| Female learners | 12,928,531 |
| Male learners | 13,383,418 |
| Female share of learners | 49.1% |
Elementary held 15.75 million learners, including 2.27 million in kindergarten and 64,779 non-graded learners. Junior high held 7.83 million and senior high 2.73 million. Girls were 49.1% of all learners, and their share rises with the level. They were 47.9% of elementary, 50.3% of junior high and 52.9% of senior high learners. The pattern shows boys leaving school earlier than girls, and every later file shows it too. Senior high’s female majority was at its widest in this first full year.
Among the nine school years in this series, SY 2017-2018 ranks seventh by total enrollment, because the system grew for five more years before it began to shrink. The kindergarten class, however, was the second largest of the nine, behind only SY 2018-2019. The children in that kindergarten class reached Grade 8 in SY 2025-2026 at about 91% of their kindergarten number.
| School year | Schools | Total enrollment | Year-on-year | Kindergarten | Elementary (K–6) | Junior high | Senior high | Female share |
|---|---|---|---|---|---|---|---|---|
| SY 2017-18 | 61,563 | 26,311,949 | 2,268,455 | 15,752,075 | 7,826,414 | 2,733,460 | 49.1% | |
| SY 2018-19 | 61,916 | 27,018,509 | +2.7% | 2,409,782 | 15,675,041 | 8,320,627 | 3,022,841 | 49.2% |
| SY 2019-20 | 61,923 | 27,030,391 | +0.0% | 2,044,745 | 15,332,706 | 8,503,650 | 3,194,035 | 49.1% |
| SY 2020-21 | 60,957 | 26,227,022 | -3.0% | 2,055,635 | 14,650,804 | 8,339,391 | 3,236,827 | 49.2% |
| SY 2021-22 | 60,429 | 27,560,661 | +5.1% | 2,181,189 | 14,977,991 | 8,757,957 | 3,824,713 | 49.1% |
| SY 2022-23 | 60,137 | 27,794,282 | +0.8% | 2,149,891 | 15,188,435 | 8,426,203 | 4,179,644 | 48.7% |
| SY 2023-24 | 60,167 | 27,081,292 | -2.6% | 2,047,356 | 15,201,951 | 7,749,265 | 4,130,076 | 48.8% |
| SY 2024-25 | 60,129 | 26,400,182 | -2.5% | 1,827,258 | 14,748,764 | 7,665,606 | 3,985,812 | 49.0% |
| SY 2025-26 | 60,204 | 25,935,863 | -1.8% | 1,993,117 | 14,348,159 | 7,758,408 | 3,829,296 | 49.1% |
Enrollment by grade level: a small Grade 1 class
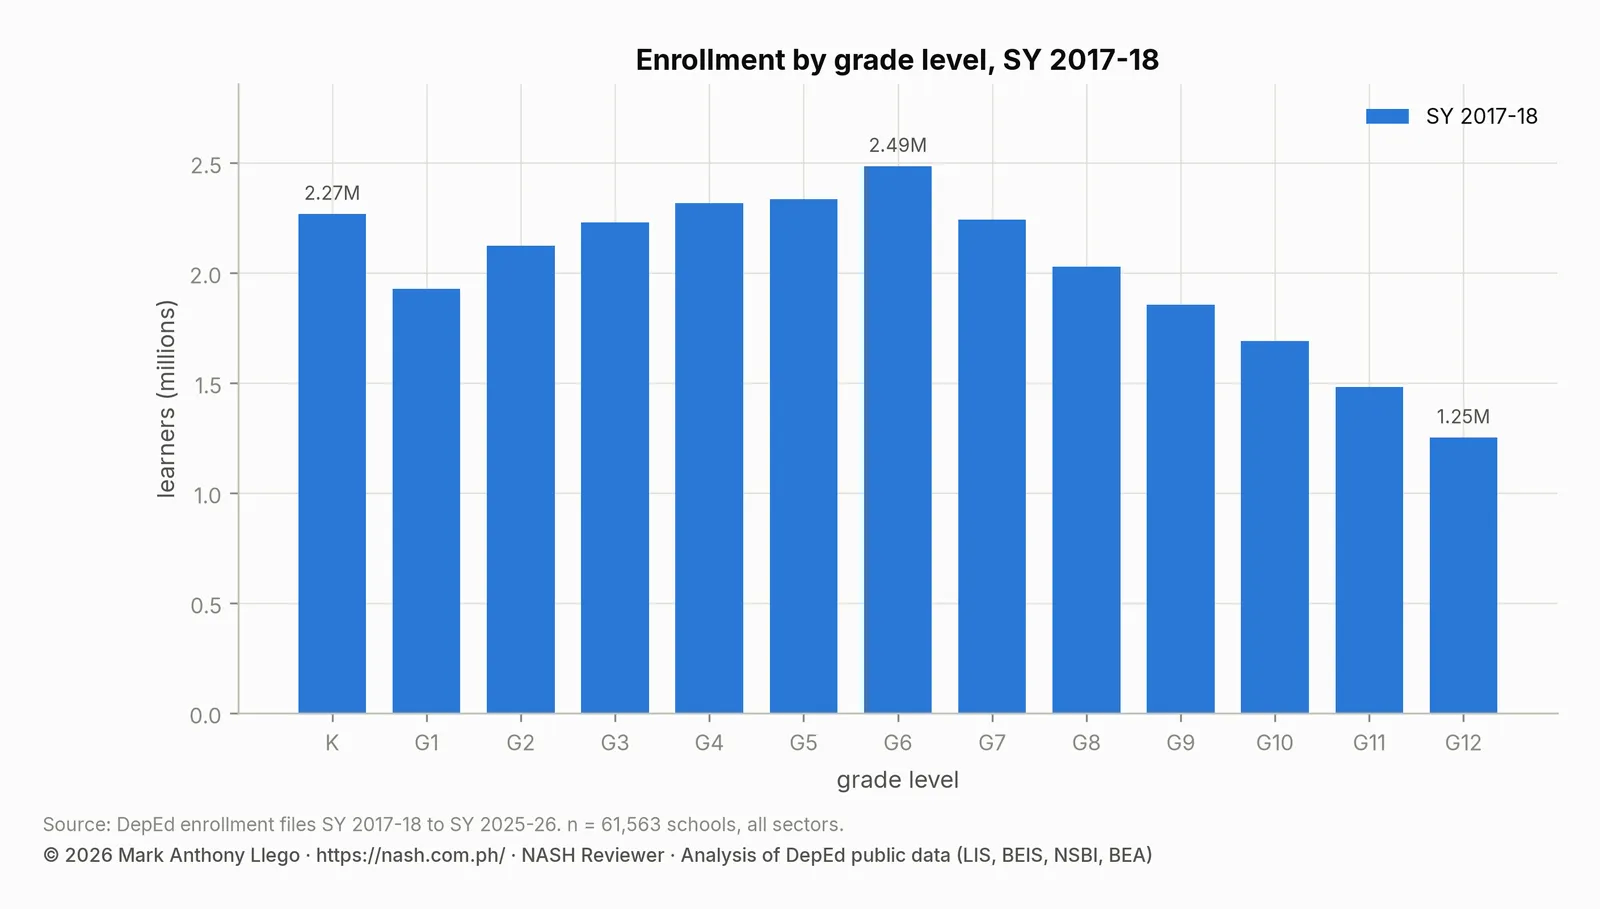
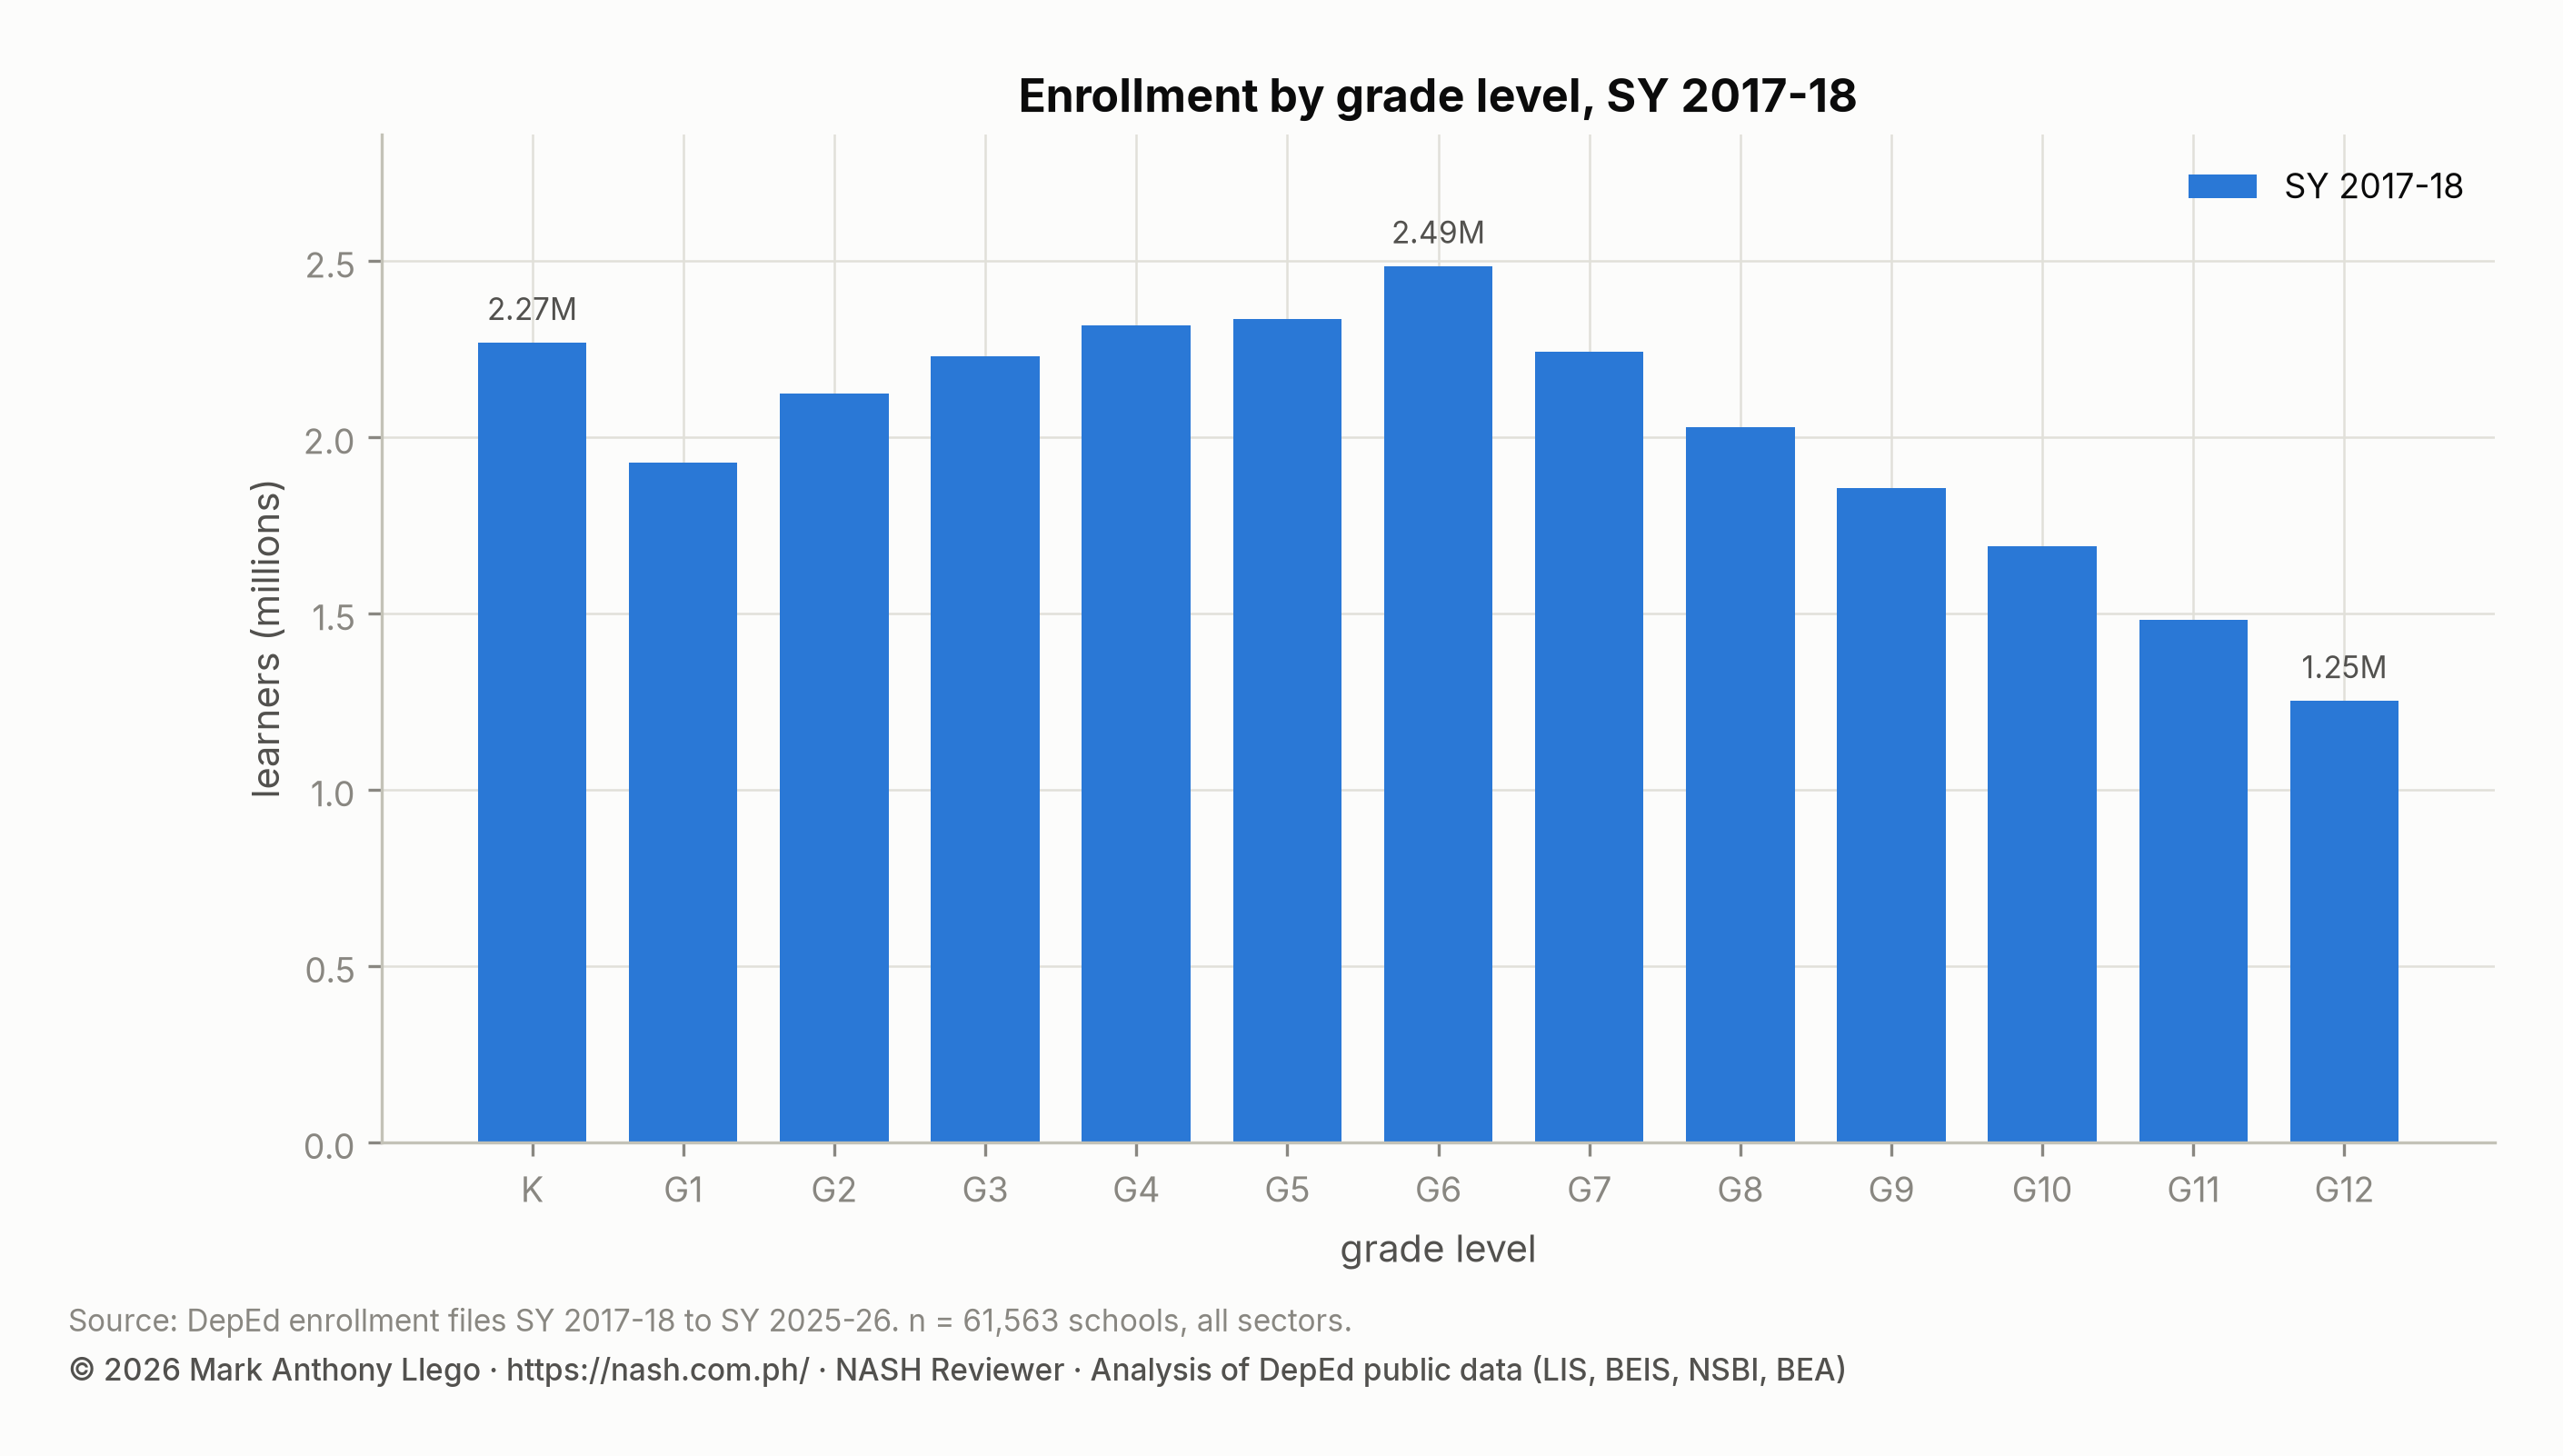
One expects each grade to be a little smaller than the grade below it. The SY 2017-2018 profile did not follow that pattern. Grade 6 was the largest grade in the system with 2,485,840 learners. Grade 1 had 1,927,095, fewer than kindergarten (2,268,455) and fewer than Grade 2 (2,124,824). Every grade up to Grade 8 (2,029,625) was larger than Grade 1. Only Grade 9 and the grades above it had fewer learners than Grade 1.
| Grade | Learners | Share of total |
|---|---|---|
| Kindergarten | 2,268,455 | 8.6% |
| Grade 1 | 1,927,095 | 7.3% |
| Grade 2 | 2,124,824 | 8.1% |
| Grade 3 | 2,229,432 | 8.5% |
| Grade 4 | 2,316,663 | 8.8% |
| Grade 5 | 2,334,987 | 8.9% |
| Grade 6 | 2,485,840 | 9.4% |
| Grade 7 | 2,243,708 | 8.5% |
| Grade 8 | 2,029,625 | 7.7% |
| Grade 9 | 1,855,356 | 7.1% |
| Grade 10 | 1,692,262 | 6.4% |
| Grade 11 | 1,481,103 | 5.6% |
| Grade 12 | 1,252,357 | 4.8% |
The small Grade 1 class is a cohort, not a one-year accident, and the later reports in this series follow it. It had 1.94 million learners in Grade 2 the next year and 1.92 million in Grade 3. It had 1.85 million in Grade 4 in the pandemic year and 1.67 million in Grade 9 by SY 2025-2026. For six years, the lower grades of a typical elementary school needed fewer sections than the grades above them. Junior high schools then saw the same dip from SY 2023-2024.
The files do not record why the SY 2016-2017 kindergarten intake that fed this class was small. The usual explanation is the tighter kindergarten age cut-off introduced in 2016. The data are consistent with that explanation but cannot confirm it.
Grade 12 held 1,252,357 learners, 85% of the Grade 11 count. SY 2017-2018 was the first school year with both senior high grades filled, and the first K to 12 cohort graduated at its end.
Public and private school enrollment by level
| Sector | Schools | Learners | Share of learners | Kindergarten | Elementary (K to 6) | Junior high | Senior high |
|---|---|---|---|---|---|---|---|
| Public | 46,815 | 22,096,820 | 84.0% | 2,023,322 | 14,289,445 | 6,412,233 | 1,395,142 |
| Private | 14,430 | 4,065,515 | 15.5% | 243,818 | 1,450,827 | 1,365,684 | 1,249,004 |
| SUC/LUC laboratory schools | 318 | 149,614 | 0.6% | 1,315 | 11,803 | 48,497 | 89,314 |
| Philippine Schools Overseas | 0 | 0 | 0.0% | 0 | 0 | 0 | 0 |
Public schools, 46,815 of them, held 84.0% of learners. Private schools, 14,430 of them, held 15.5%. The 318 laboratory schools of state and local universities and colleges (SUC/LUC in the tables) held 149,614 learners, of whom 89,314 were in senior high. The Philippine Schools Overseas do not appear until the next year’s file.
The private share varies by level more than by anything else. Private schools had 10.7% of kindergarten learners and 8.9% of Grades 1 to 6. Their share was 17.4% in Grades 7 to 10 and 45.7% in Grades 11 and 12. Senior high was in its second year, and public schools were still adding capacity for Grades 11 and 12. As a result, 1,249,004 of the 2,733,460 senior high learners were in private schools. No later file shows a private share of senior high this high. By SY 2025-2026 it had fallen to about a third.
Senior high school strands in SY 2017-2018
| Track or strand | Learners | Share of senior high |
|---|---|---|
| TVL | 1,025,907 | 37.5% |
| GAS | 571,129 | 20.9% |
| STEM | 399,360 | 14.6% |
| ABM | 391,436 | 14.3% |
| HUMSS | 320,577 | 11.7% |
| Arts and Design | 10,574 | 0.4% |
| Maritime | 10,090 | 0.4% |
| Sports | 4,387 | 0.2% |
In its first year with both grades filled, senior high enrolled 2,733,460 learners. The Technical-Vocational-Livelihood (TVL) track was the largest single choice, with 1,025,907 learners or 37.5% of senior high. The four academic strands together held 61.6%. The General Academic Strand (GAS) had 571,129 learners (20.9%), Science, Technology, Engineering and Mathematics (STEM) 399,360 (14.6%), Accountancy, Business and Management (ABM) 391,436 (14.3%) and Humanities and Social Sciences (HUMSS) 320,577 (11.7%). Arts and Design, Maritime and Sports had 25,051 learners between them, under 1% of senior high.
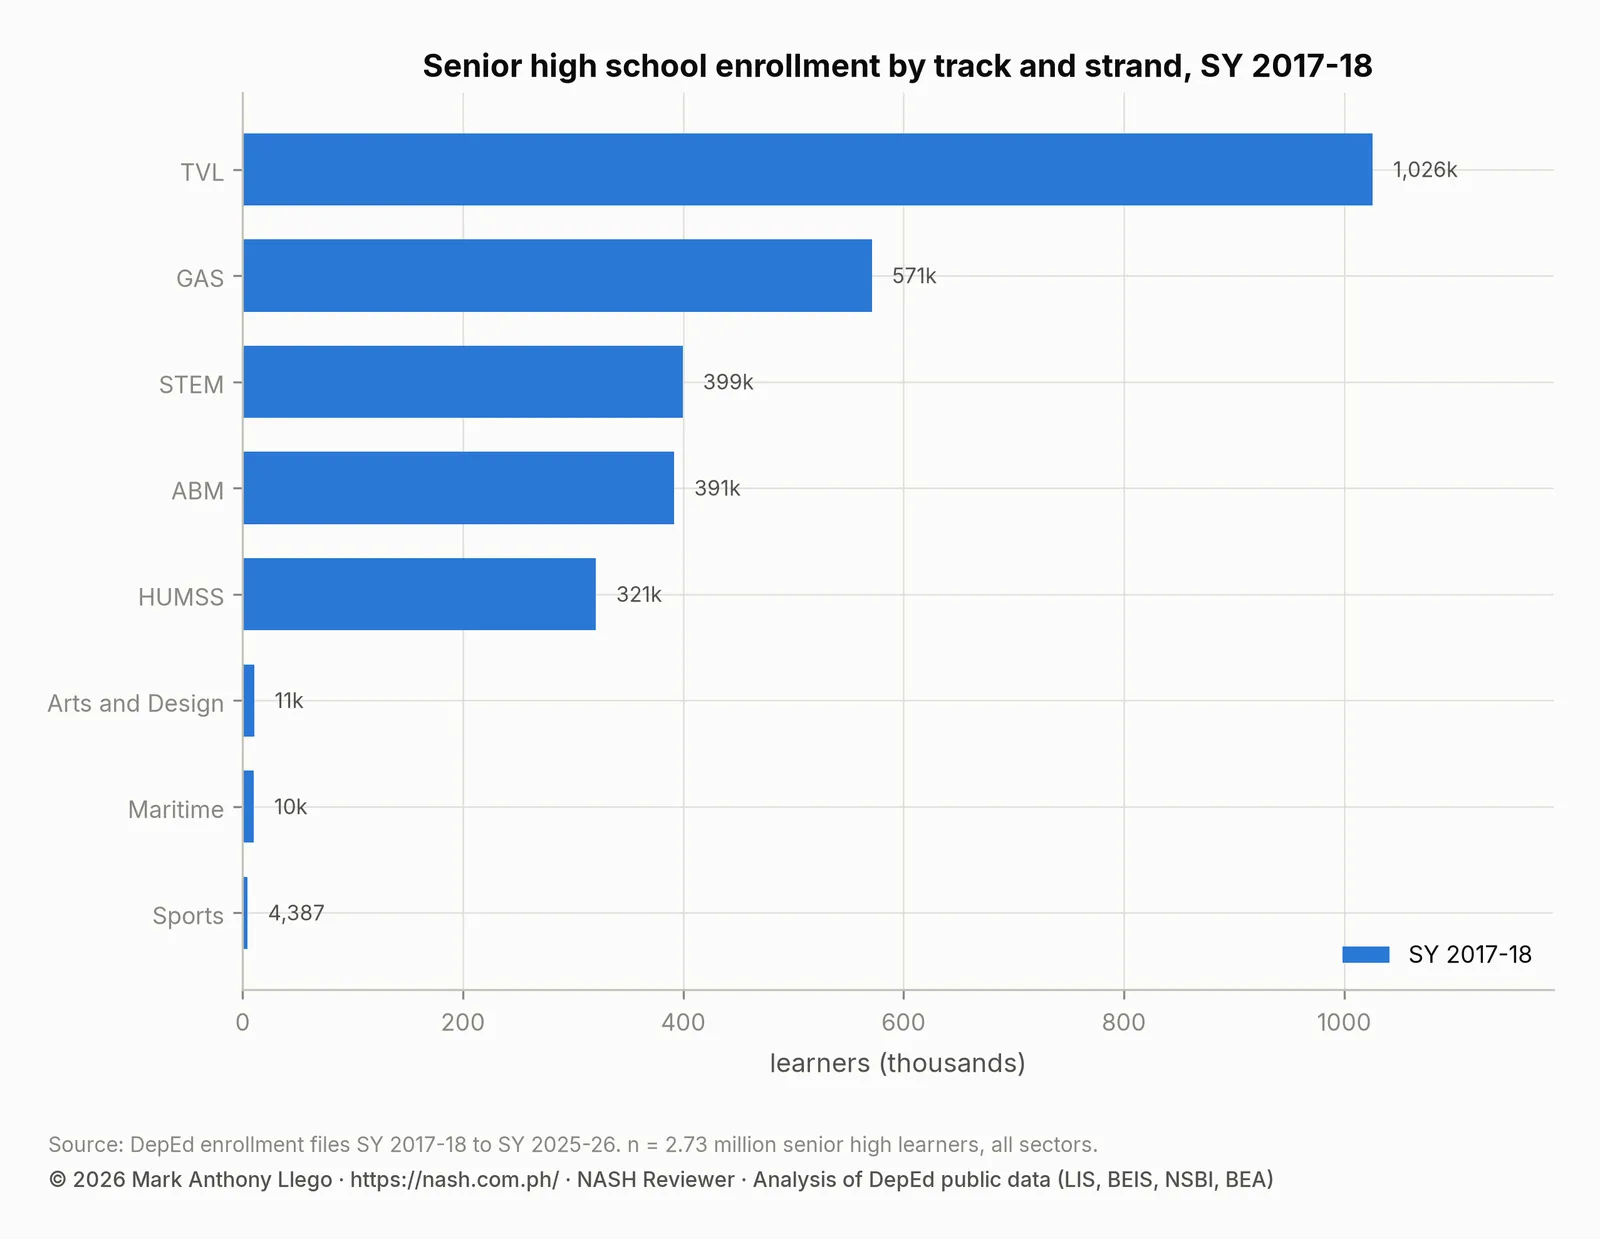
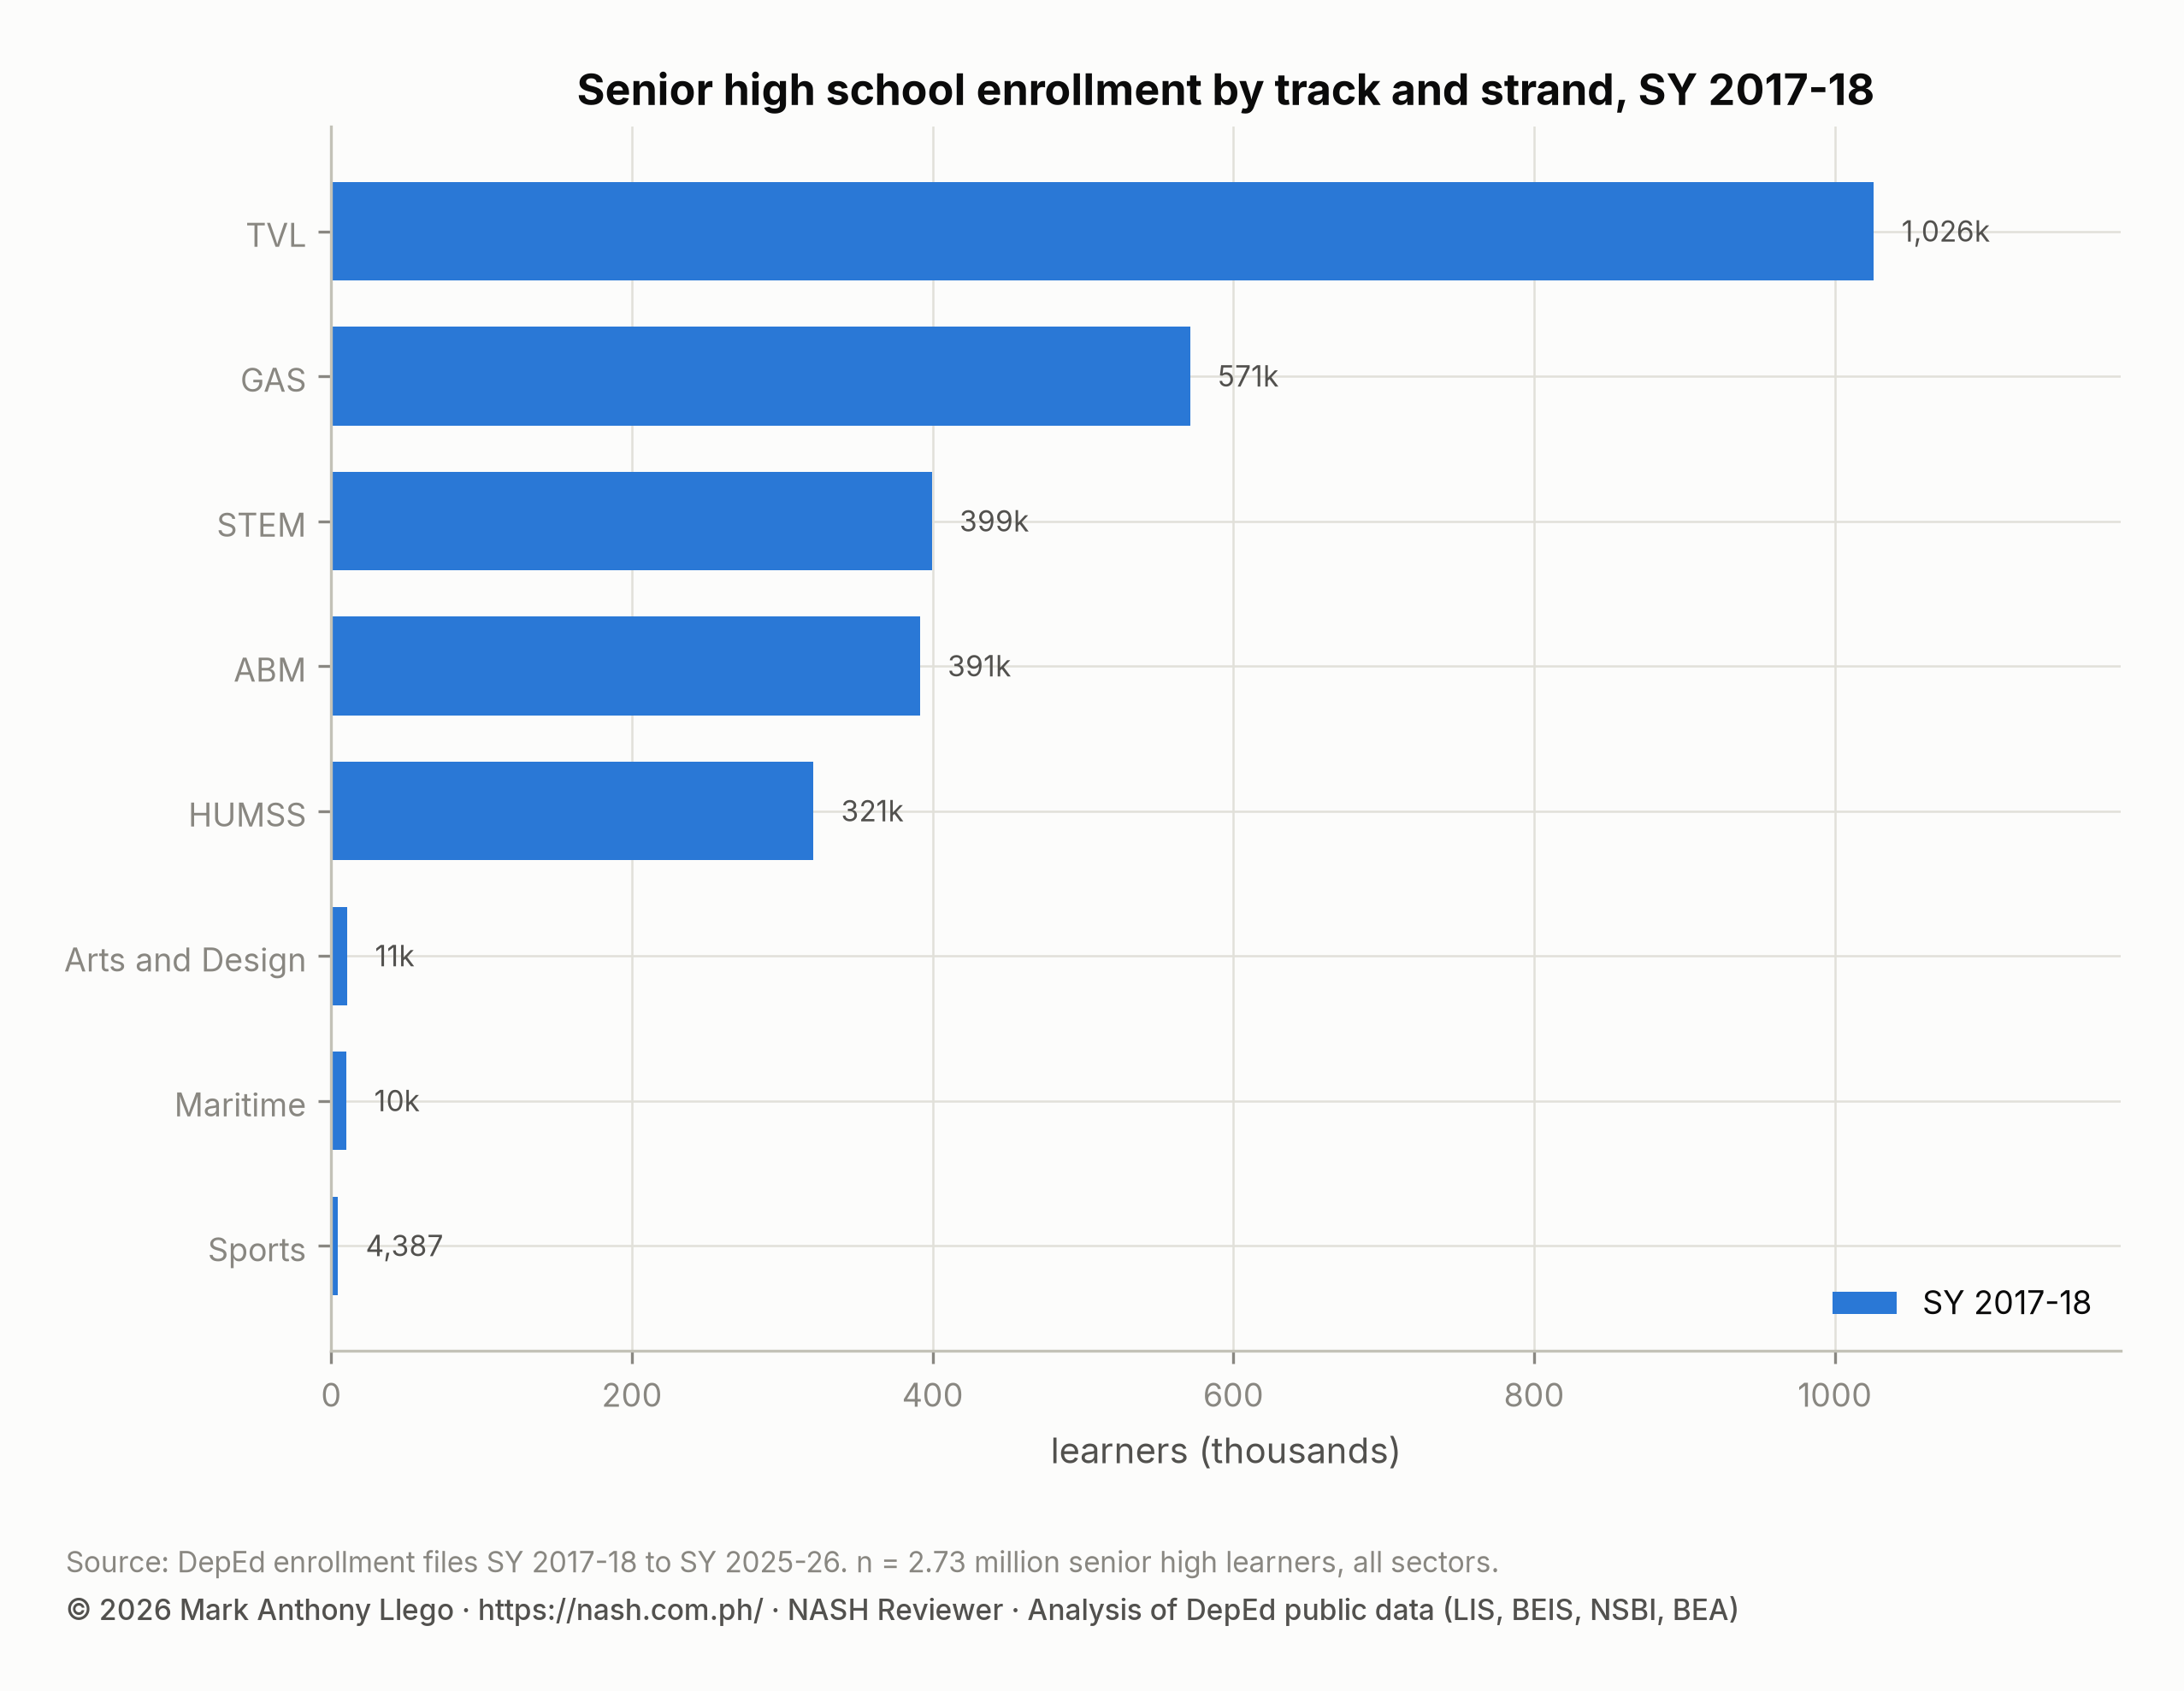
The later reports in this series measure from this baseline, and two parts of it did not last. HUMSS, the smallest academic strand in SY 2017-2018, grew 47.8% the next year and passed both STEM and ABM, as the SY 2018-2019 report shows. GAS, second only to TVL, grew 1.2% that year and fell 7.4% the year after. The strands also differed by sex. Girls were 52.9% of senior high learners but 70.8% of ABM learners. Boys were a slight majority in STEM, where girls were 46.3%, and in TVL, where girls were 45.6%. The senior high strands by sex report follows those shares to SY 2025-2026.
Enrollment by region and division in SY 2017-2018
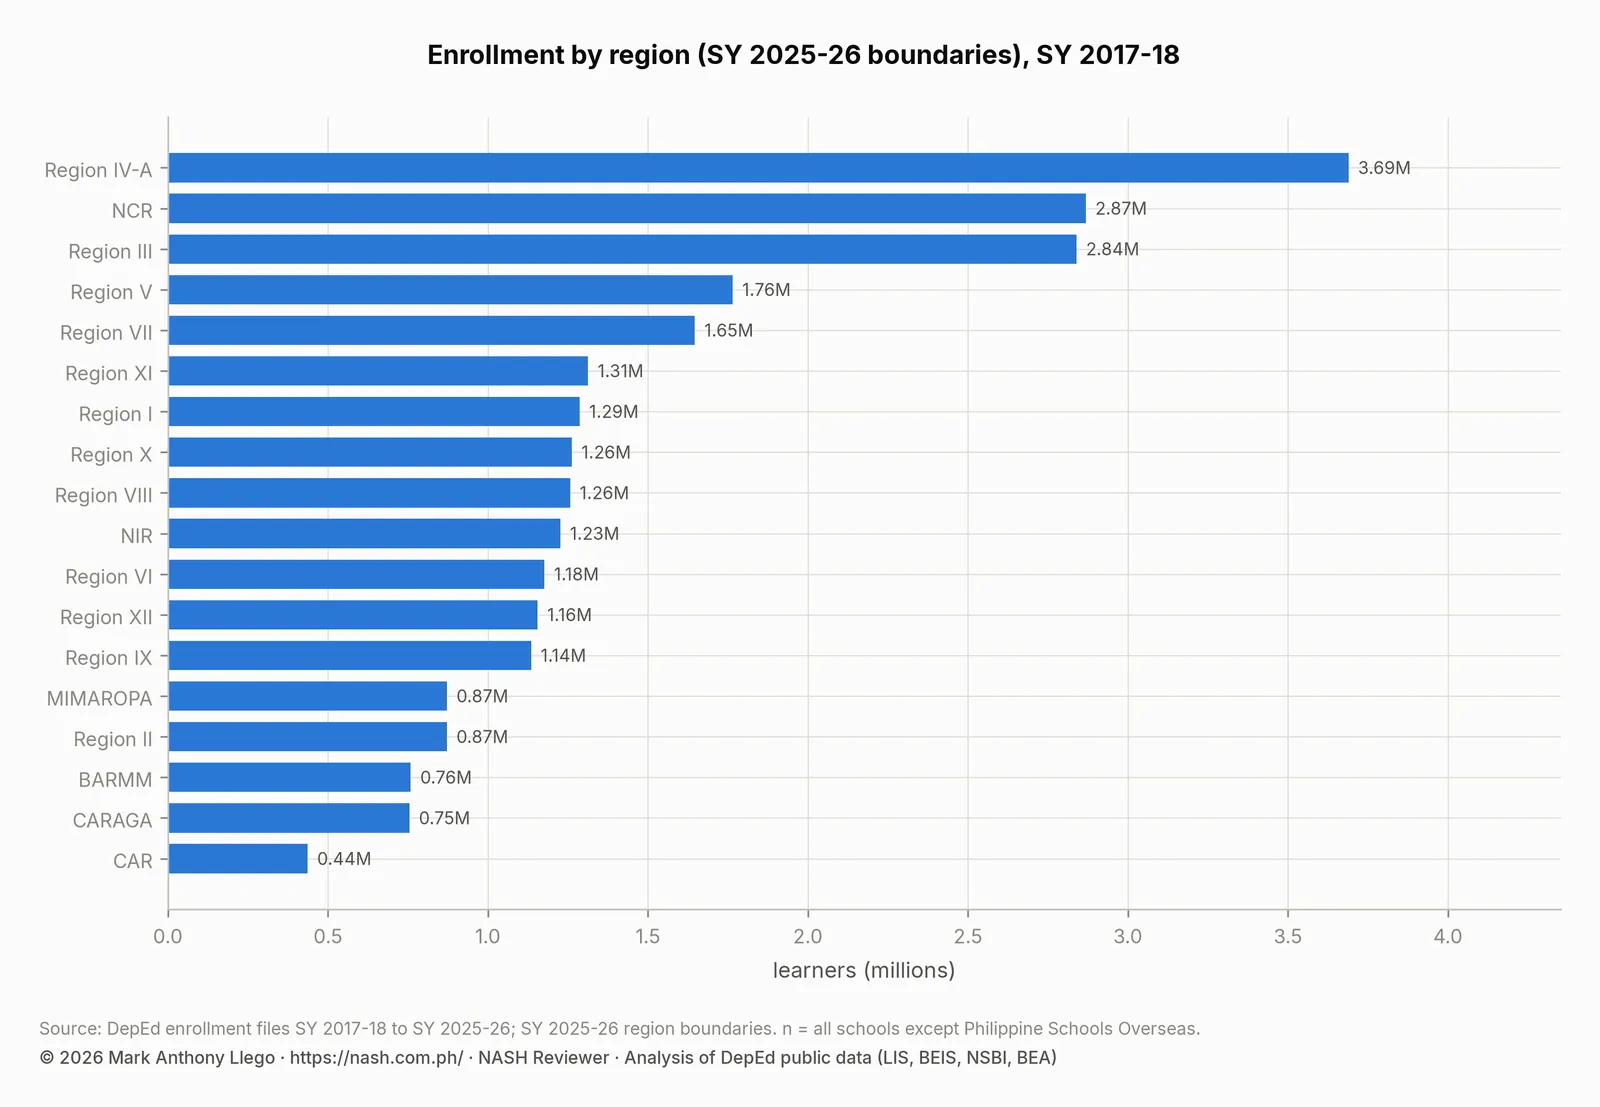
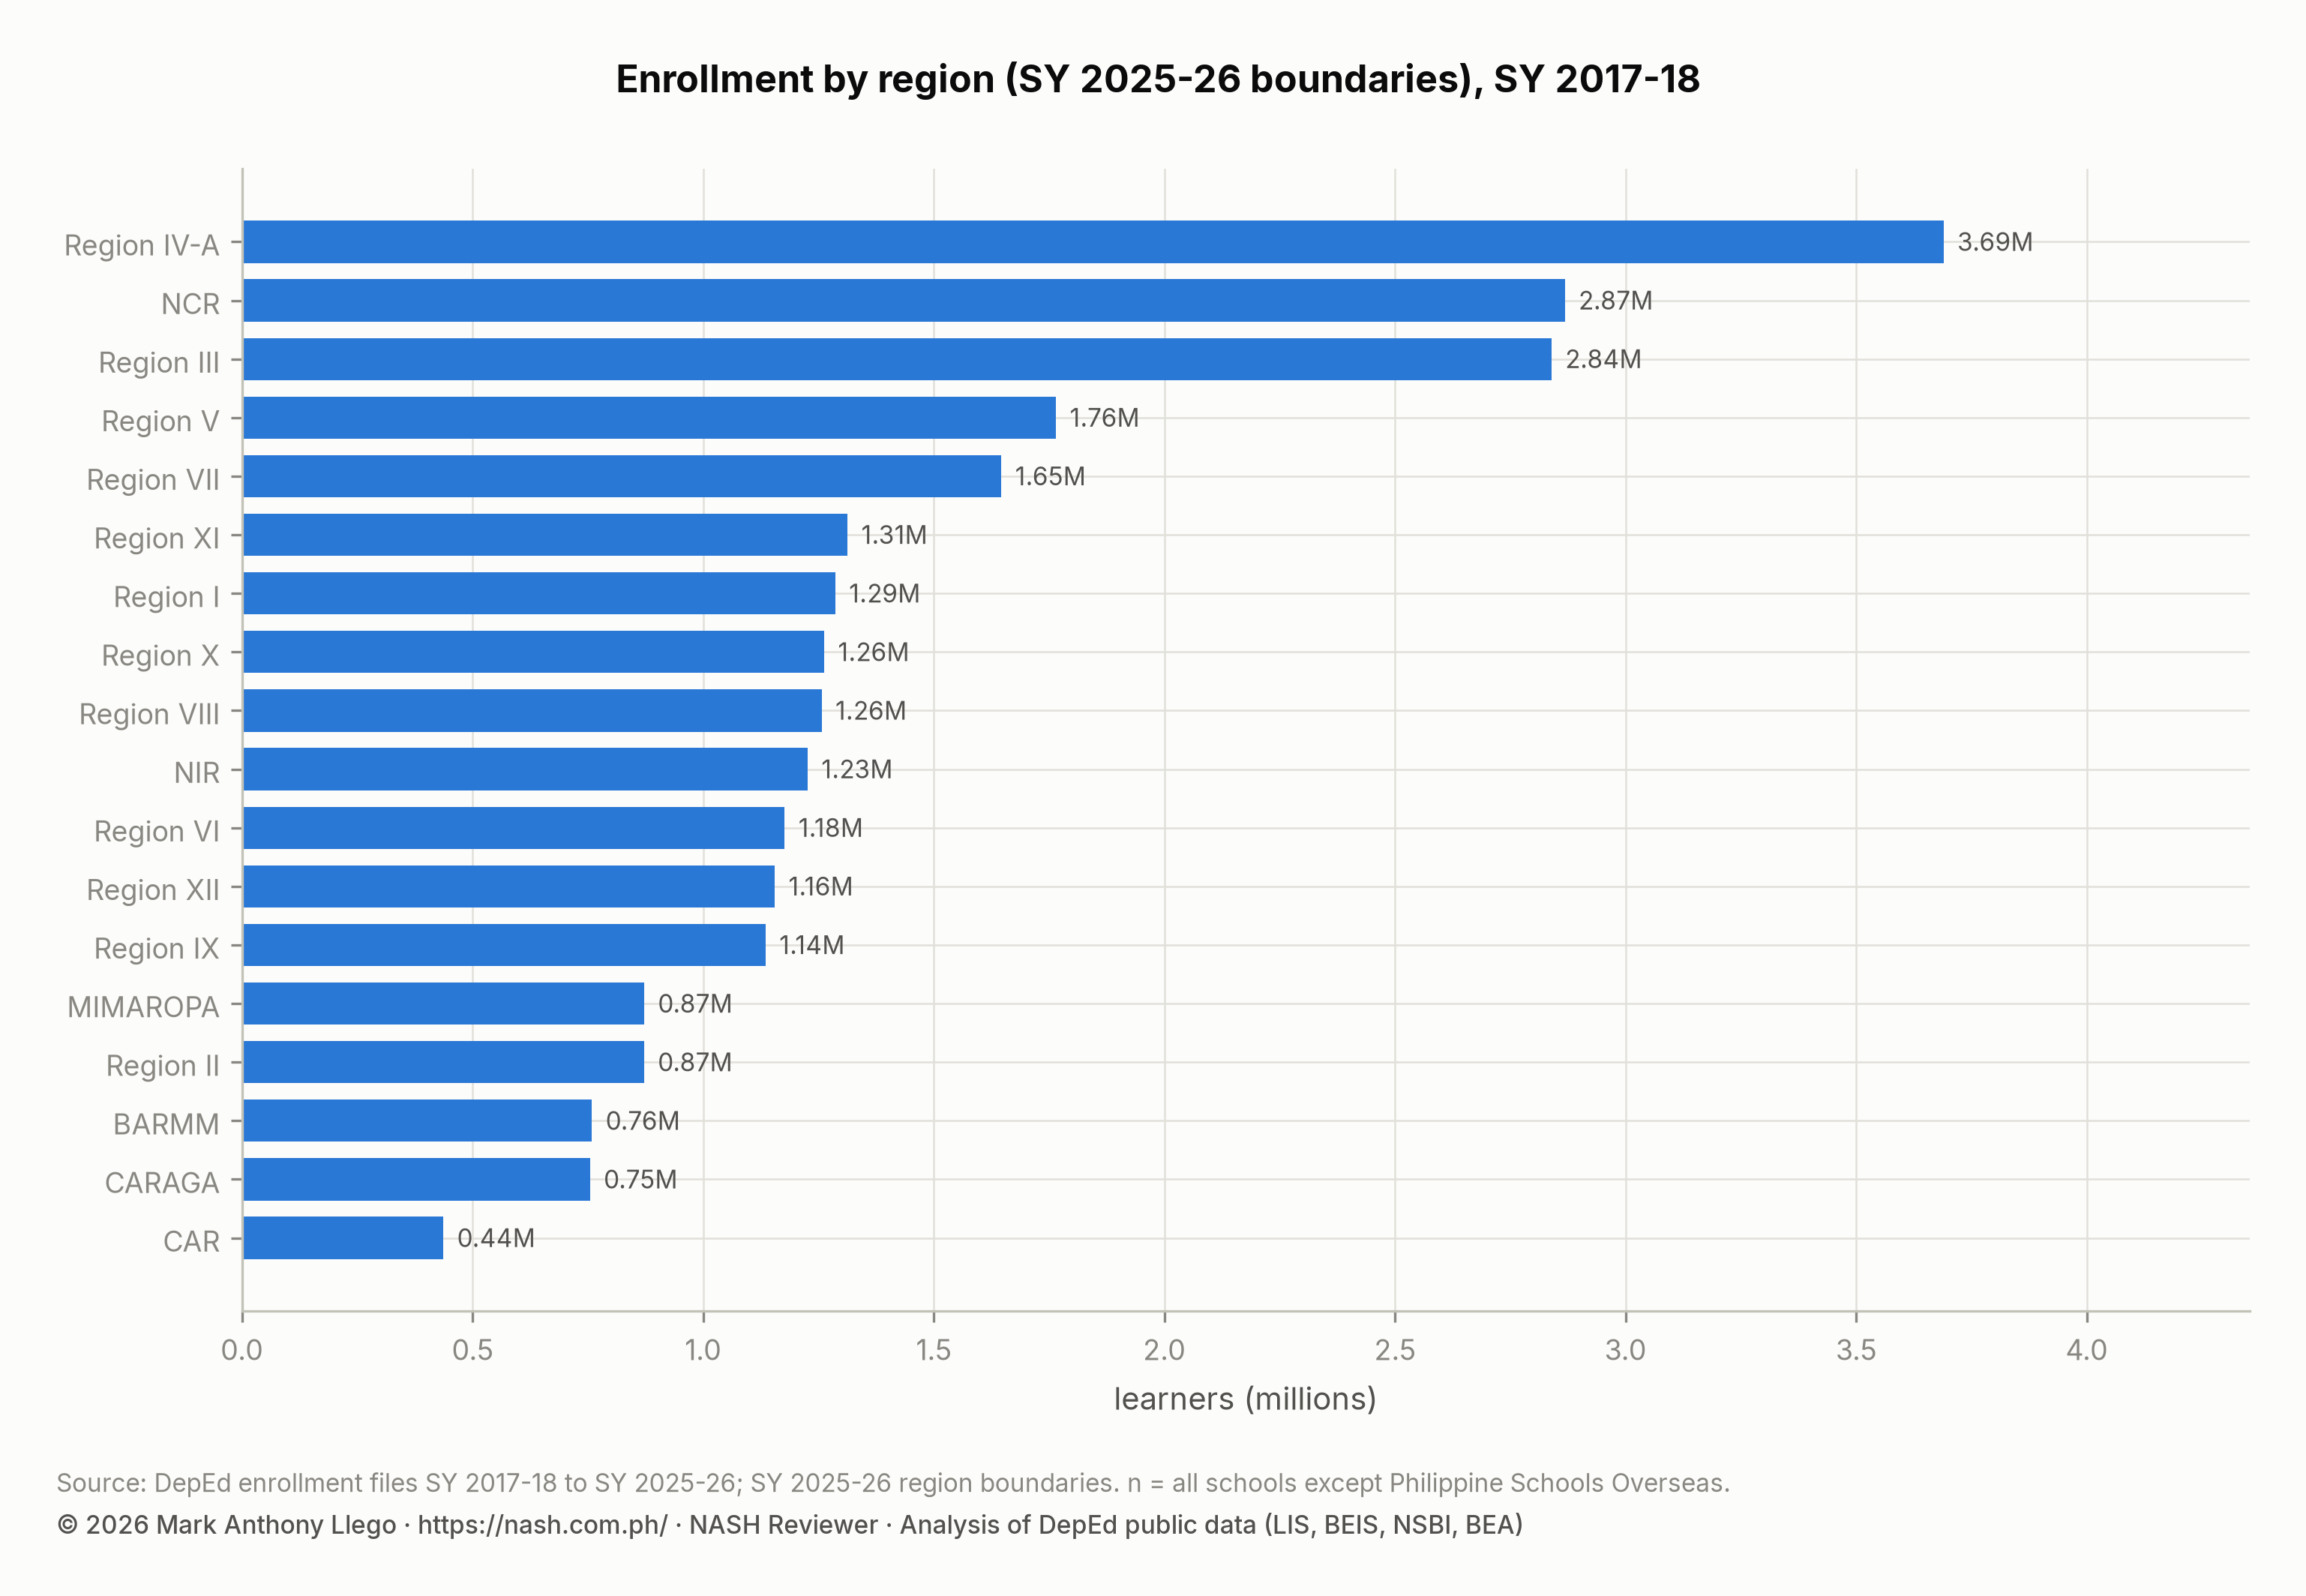
Region IV-A was the largest region with 3.69 million learners, 14.0% of the total. NCR was second with 2.87 million, ahead of Region III with 2.84 million. By SY 2025-2026 the two had swapped places, because NCR lost learners every year from SY 2019-2020. The three largest regions held 35.7% of all learners. CAR was the smallest with 436,484.
| Region (SY 2025-26 boundaries) | Schools | Learners | Share of learners | Private share | Senior high share | Female share |
|---|---|---|---|---|---|---|
| Region IV-A | 6,564 | 3,689,236 | 14.0% | 22.7% | 10.9% | 49.0% |
| NCR | 3,225 | 2,868,073 | 10.9% | 28.1% | 12.9% | 49.4% |
| Region III | 5,400 | 2,839,168 | 10.8% | 18.7% | 11.1% | 48.9% |
| Region V | 4,444 | 1,764,865 | 6.7% | 8.6% | 9.8% | 48.9% |
| Region VII | 3,587 | 1,646,395 | 6.3% | 16.1% | 10.7% | 49.0% |
| Region XI | 2,706 | 1,312,861 | 5.0% | 13.9% | 8.9% | 49.2% |
| Region I | 3,467 | 1,286,348 | 4.9% | 13.1% | 11.9% | 48.5% |
| Region X | 3,112 | 1,262,319 | 4.8% | 13.0% | 9.3% | 49.3% |
| Region VIII | 4,480 | 1,256,668 | 4.8% | 6.7% | 10.1% | 48.9% |
| NIR | 2,743 | 1,226,368 | 4.7% | 10.6% | 10.0% | 49.2% |
| Region VI | 3,530 | 1,176,643 | 4.5% | 10.7% | 11.2% | 48.5% |
| Region XII | 2,635 | 1,155,084 | 4.4% | 10.9% | 9.0% | 49.3% |
| Region IX | 3,318 | 1,135,114 | 4.3% | 7.8% | 8.0% | 49.7% |
| MIMAROPA | 2,598 | 871,849 | 3.3% | 8.3% | 9.6% | 48.9% |
| Region II | 2,949 | 871,626 | 3.3% | 12.1% | 10.5% | 49.1% |
| BARMM | 2,329 | 758,518 | 2.9% | 9.4% | 5.6% | 52.0% |
| CARAGA | 2,359 | 754,330 | 2.9% | 9.0% | 9.5% | 48.8% |
| CAR | 2,117 | 436,484 | 1.7% | 20.0% | 11.3% | 49.3% |
Two regional patterns were already set. NCR had the highest private share, 28.1%, followed by Region IV-A at 22.7% and CAR at 20.0%. Region VIII had the lowest at 6.7%. BARMM had the highest female share, 52.0%, against 48.5% in Region I and Region VI, and the gap persists in every later year. BARMM also had the smallest senior high share of any region, 5.6% of its learners, against 12.9% in NCR.
The ten largest divisions held 18.9% of all learners. Quezon City led with 638,857 learners. Cebu followed with 581,098 learners across 1,346 schools, then Bulacan, Rizal and Camarines Sur.
| Rank | Division | Region | Schools | Learners | Share of all learners |
|---|---|---|---|---|---|
| 1 | Quezon City | NCR | 826 | 638,857 | 2.4% |
| 2 | Cebu | Region VII | 1,346 | 581,098 | 2.2% |
| 3 | Bulacan | Region III | 919 | 568,834 | 2.2% |
| 4 | Rizal | Region IV-A | 803 | 524,303 | 2.0% |
| 5 | Camarines Sur | Region V | 1,236 | 491,725 | 1.9% |
| 6 | Cavite | Region IV-A | 766 | 488,243 | 1.9% |
| 7 | Quezon | Region IV-A | 1,149 | 482,450 | 1.8% |
| 8 | Iloilo | Region VI | 1,415 | 480,402 | 1.8% |
| 9 | Batangas | Region IV-A | 995 | 445,658 | 1.7% |
| 10 | Davao City | Region XI | 641 | 428,124 | 1.6% |
School size and levels offered in SY 2017-2018
| Learners per school | Schools | Share of schools | Learners | Share of learners | Public schools | Share of public schools | Private schools | Share of private schools |
|---|---|---|---|---|---|---|---|---|
| 1–50 | 7,383 | 12.0% | 182,433 | 0.7% | 2,619 | 5.6% | 4,726 | 32.8% |
| 51–100 | 7,418 | 12.0% | 561,426 | 2.1% | 5,009 | 10.7% | 2,380 | 16.5% |
| 101–200 | 14,673 | 23.8% | 2,181,779 | 8.3% | 12,043 | 25.7% | 2,578 | 17.9% |
| 201–500 | 18,817 | 30.6% | 5,964,821 | 22.7% | 16,091 | 34.4% | 2,635 | 18.3% |
| 501–1,000 | 7,421 | 12.1% | 5,116,160 | 19.4% | 6,123 | 13.1% | 1,225 | 8.5% |
| 1,001–2,000 | 3,786 | 6.1% | 5,218,060 | 19.8% | 3,146 | 6.7% | 609 | 4.2% |
| over 2,000 | 2,065 | 3.4% | 7,087,270 | 26.9% | 1,784 | 3.8% | 277 | 1.9% |
The median public school had 239 learners and the median private school 104. The file has 7,383 schools with 50 learners or fewer, and 4,726 of them were private. That is 32.8% of all private schools, against 5.6% of public schools. At the other end, 2,065 schools had more than 2,000 learners. They held 26.9% of all learners, and 1,784 of them were public. The 399 schools in the file with zero learners count as schools but add nothing to the totals.
By level offered, 45,490 schools (73.9%) were elementary-only and held 54.8% of learners. Another 6,907 schools offered junior and senior high together and held 26.0% of learners. A further 3,050 offered all three levels, and 1,351 offered senior high only, most of them private.
| Levels offered | Schools | Share of schools | Learners | Share of learners |
|---|---|---|---|---|
| Elementary only | 45,490 | 73.9% | 14,418,816 | 54.8% |
| Junior and senior high | 6,907 | 11.2% | 6,837,840 | 26.0% |
| All levels (elementary, junior and senior high) | 3,050 | 5.0% | 2,580,783 | 9.8% |
| Elementary and junior high | 2,588 | 4.2% | 730,700 | 2.8% |
| Junior high only | 2,158 | 3.5% | 1,259,938 | 4.8% |
| Senior high only | 1,351 | 2.2% | 476,894 | 1.8% |
| Elementary and senior high | 19 | 0.0% | 6,978 | 0.0% |
Schools absent from the SY 2018-2019 file
Because this is the first file, it cannot show which schools were new in SY 2017-2018. It can show which schools were gone a year later. In total, 420 private schools in this file are absent from the SY 2018-2019 file, and they carried 15,267 learners in their last year. Another 283 public schools, carrying 74,806 learners, are also absent. The public exits are large because most of them are changes of school ID and mergers rather than closures. The nine-year enrollment trends report traces how schools enter and leave the files over nine years.
| Sector | Schools in the file | Schools absent from SY 2018-19 | Their learners in this year |
|---|---|---|---|
| Public | 46,815 | 283 | 74,806 |
| Private | 14,430 | 420 | 15,267 |
| SUC/LUC laboratory schools | 318 | 21 | 2,936 |
| Philippine Schools Overseas | 0 | 0 | 0 |
How to read the SY 2017-2018 enrollment file
- Totals are sums over every school in DepEd’s SY 2017-2018 enrollment file. The file has one row per school, with enrollment by grade and sex and, for Grades 11 and 12, by track and strand. DepEd’s own published totals can differ slightly where DepEd applied later corrections.
- This file reports 5,463 non-graded junior high learners, but the SY 2018-2019 file does not report any. The junior high totals of the two years are therefore not strictly comparable.
- Regions follow the SY 2025-2026 boundaries throughout. Division names are not unique nationally, so a division is identified by its region and name together.
- Enrollment is a beginning-of-year count from the Learner Information System. It shows neither dropouts during the year nor completers, and the files carry no population denominators.
Frequently asked questions
How many learners were enrolled in Philippine schools in SY 2017-2018?
DepEd’s file counts 26,311,949 learners in 61,563 schools of all sectors. Of these, 15,752,075 were in elementary including kindergarten, 7,826,414 in junior high school and 2,733,460 in senior high school.
Why was the Grade 1 class so small in SY 2017-2018?
Grade 1 held 1,927,095 learners, fewer than any grade up to Grade 8. The file cannot say why. It can show that the cohort stayed small as it moved up through later files, which the SY 2018-2019 and later reports in this series show.
Download the data
The cleaned, harmonized DepEd files behind this series are free to download in CSV and Parquet, with a codebook and checksums, under the terms of use set out in the release. Download Cleaned DepEd School Data, SY 2017-18 to 2025-26 documents every file and column. The files themselves are at data.nash.com.ph, starting with the README, the SY 2023-24 school master file (CSV, 8.0 MB) and the nine-year enrollment panel (Parquet, 17.2 MB).
More in this series
- Next year: DepEd Enrollment SY 2018-2019: Growth to 27.0 Million
- The nine-year overview: DepEd Enrollment Trends SY 2017-2018 to SY 2025-2026
- All nine annual reports: SY 2017-18, SY 2018-19, SY 2019-20, SY 2020-21, SY 2021-22, SY 2022-23, SY 2023-24, SY 2024-25, SY 2025-26
- DepEd Data for Aspiring School Heads: Where to Start
- For aspiring school heads: How to Read DepEd Data and the full report, Philippine basic education in numbers
Analysis and charts by Mark Anthony Llego for NASH Reviewer. Data: Department of Education enrollment dataset for SY 2017-18 (Learner Information System). Charts may be reused only with written permission from support@nash.com.ph.