In DepEd’s nine enrollment files from SY 2017-2018 to SY 2025-2026, girls rose from 46.3% of Science, Technology, Engineering and Mathematics (STEM) learners in SY 2017-2018 to 54.4% in SY 2025-2026. Over the same years, the Technical-Vocational-Livelihood (TVL) track went from 45.6% female to 39.3% female.
Every DepEd enrollment file counts senior high learners by strand and by sex, but the published trend series, including this blog’s own, add the sexes together. Taken apart, the nine files show a change that the totals hide.
In SY 2017-2018, STEM and TVL were two tracks with a modest male majority. Girls then moved into STEM in large numbers, and boys moved into TVL and into Humanities and Social Sciences (HUMSS). HUMSS went from being the most female of the academic strands after Accountancy, Business and Management (ABM) to one near parity.
Below are the strand choices of girls and boys over the nine years, where they differ by region and sector, and what changed.
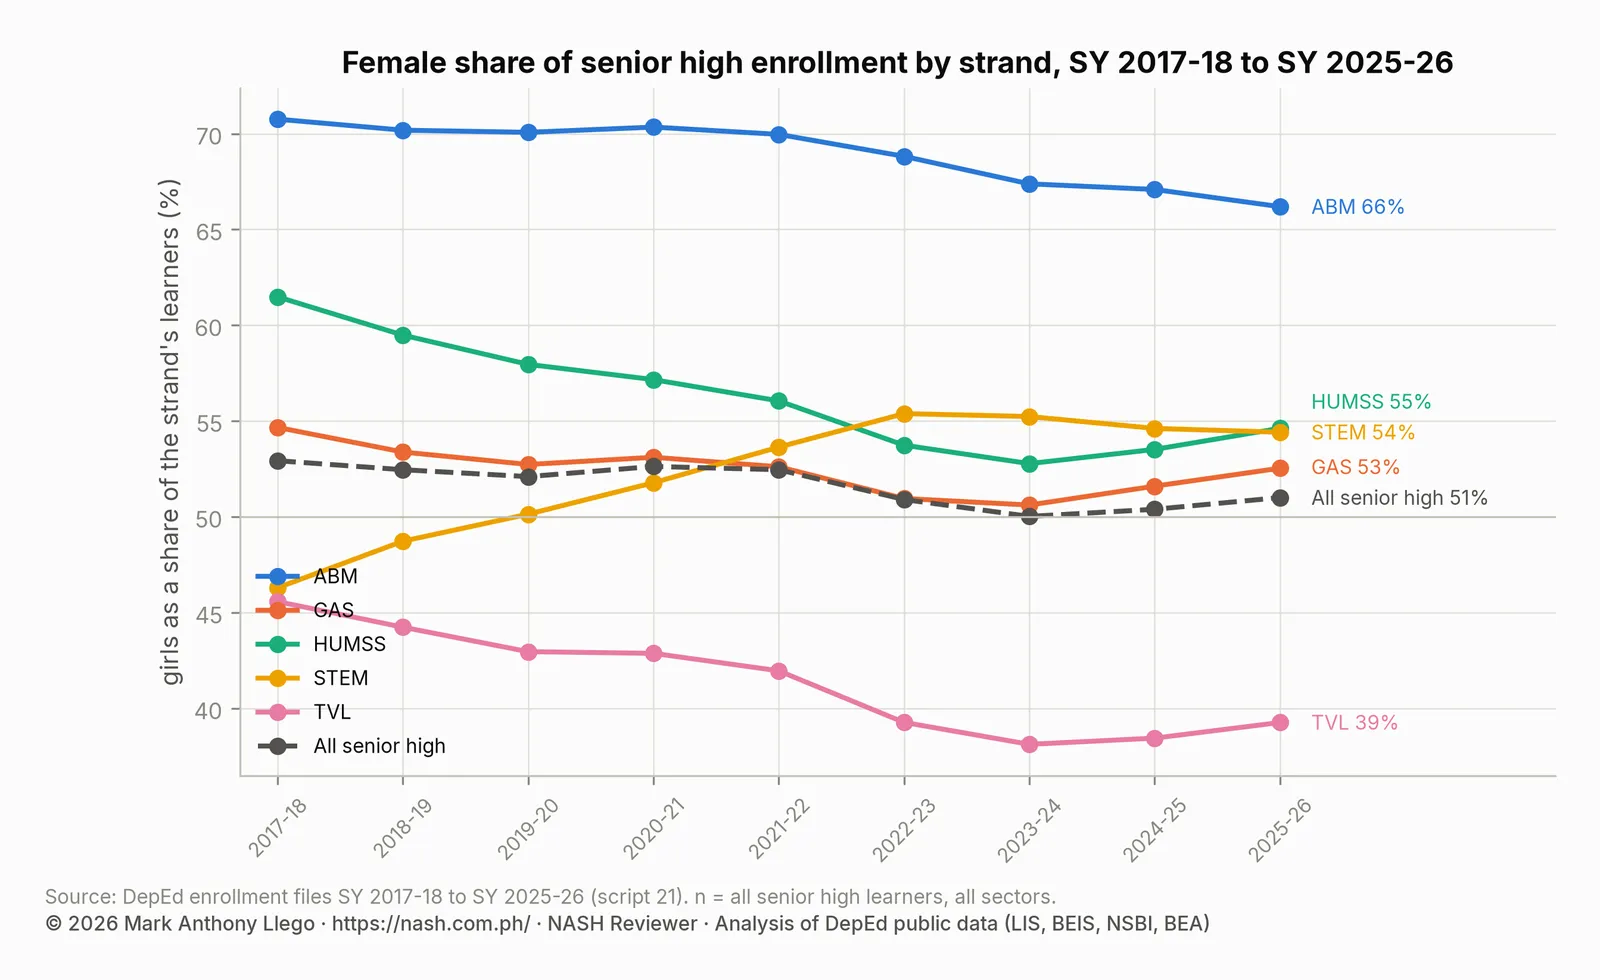
Female share of each senior high strand over nine years
| School year | ABM | GAS | HUMSS | STEM | TVL | All senior high |
|---|---|---|---|---|---|---|
| SY 2017-18 | 70.8% | 54.7% | 61.5% | 46.3% | 45.6% | 52.9% |
| SY 2018-19 | 70.2% | 53.4% | 59.5% | 48.7% | 44.2% | 52.5% |
| SY 2019-20 | 70.1% | 52.7% | 58.0% | 50.1% | 43.0% | 52.1% |
| SY 2020-21 | 70.3% | 53.1% | 57.2% | 51.8% | 42.9% | 52.6% |
| SY 2021-22 | 70.0% | 52.6% | 56.1% | 53.6% | 42.0% | 52.5% |
| SY 2022-23 | 68.8% | 51.0% | 53.7% | 55.4% | 39.3% | 50.9% |
| SY 2023-24 | 67.4% | 50.6% | 52.8% | 55.2% | 38.1% | 50.0% |
| SY 2024-25 | 67.1% | 51.6% | 53.5% | 54.6% | 38.4% | 50.4% |
| SY 2025-26 | 66.2% | 52.5% | 54.6% | 54.4% | 39.3% | 51.0% |
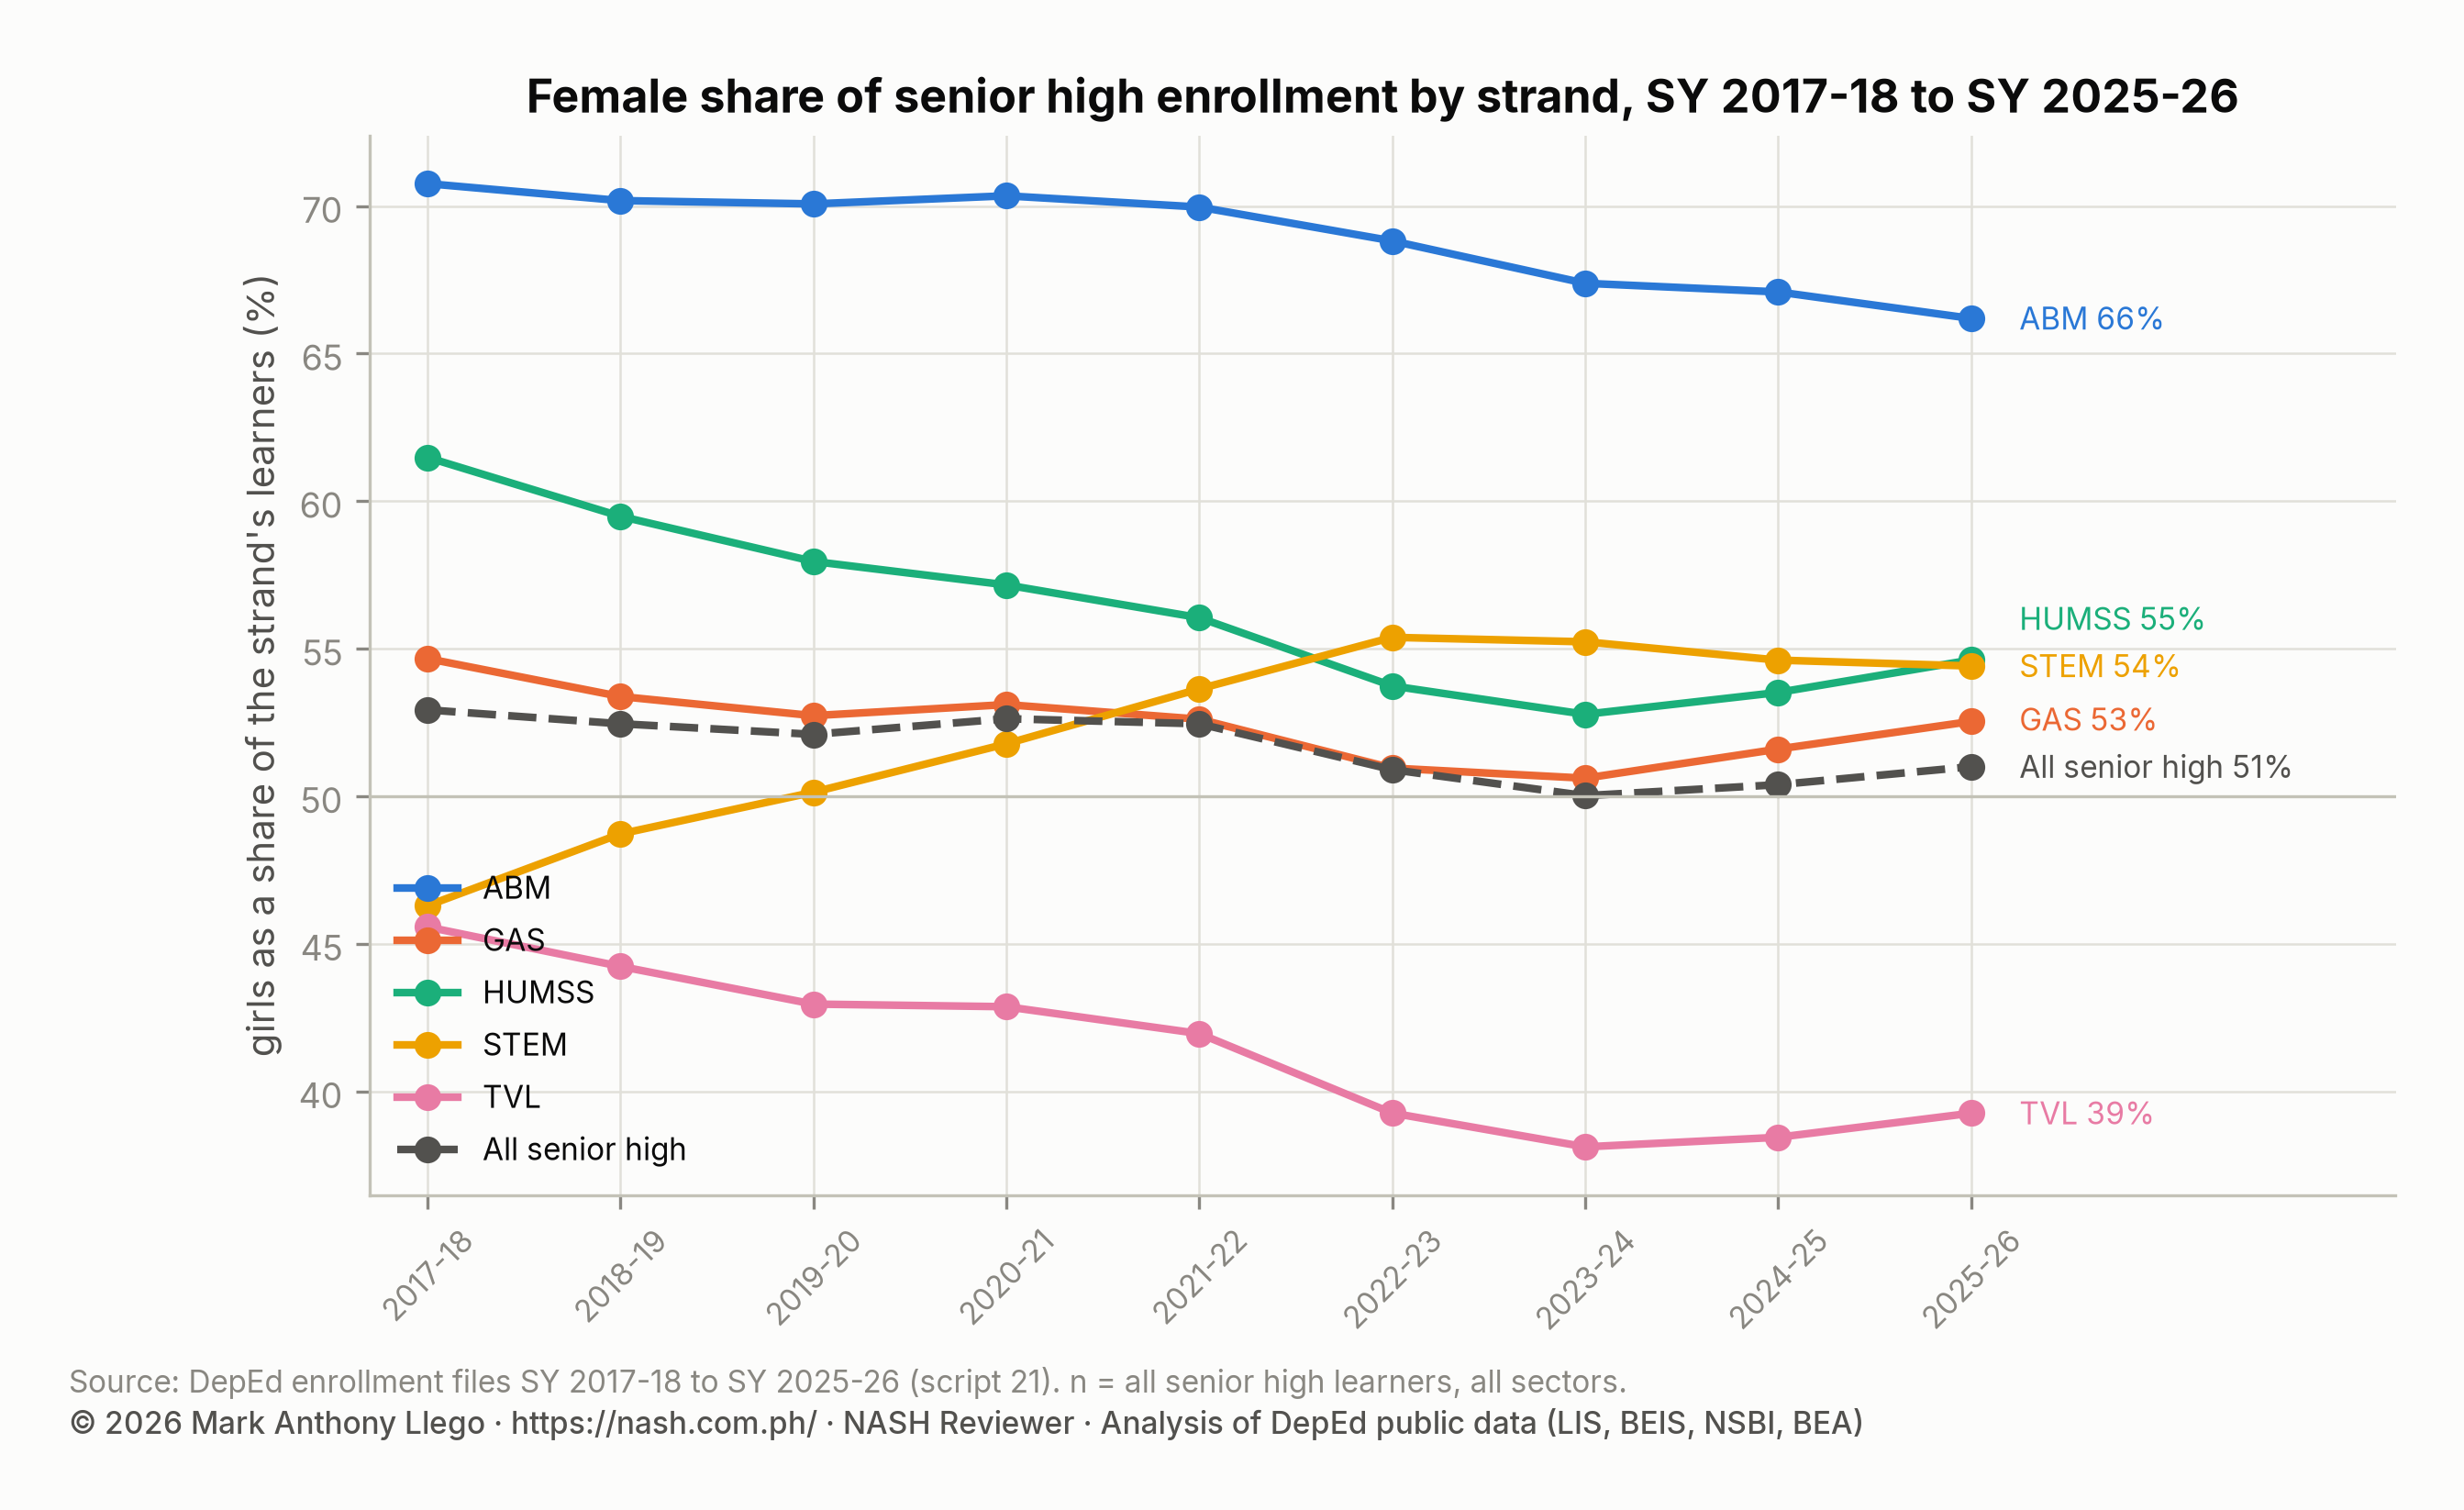
Three strands changed. STEM’s female share rose every year from SY 2017-2018 to SY 2022-2023, crossing 50% in SY 2019-2020 and peaking at 55.4%. It has stayed near 54% to 55% since.
HUMSS’s female share fell from 61.5% to 52.8% over the same period as boys arrived, then recovered slightly to 54.6%. TVL’s female share fell from 45.6% to 38.1% in SY 2023-2024 and was 39.3% in SY 2025-2026.
ABM stayed the most female strand throughout, moving from 70.8% to 66.2%, and the General Academic Strand (GAS) stayed close to the senior high average. Senior high as a whole went from 52.9% female to 51.0%. The enrollment trends report traces that change to the first senior high cohorts, which were more female than later ones.
| Strand | Girls SY 2017-18 | Girls SY 2025-26 | Change | Boys SY 2017-18 | Boys SY 2025-26 | Change | Female share SY 2017-18 | Female share SY 2025-26 |
|---|---|---|---|---|---|---|---|---|
| ABM | 276,980 | 241,999 | -12.6% | 114,456 | 123,598 | 8.0% | 70.8% | 66.2% |
| GAS | 312,224 | 222,486 | -28.7% | 258,905 | 200,993 | -22.4% | 54.7% | 52.5% |
| HUMSS | 197,107 | 550,329 | 179.2% | 123,470 | 457,226 | 270.3% | 61.5% | 54.6% |
| STEM | 184,873 | 382,222 | 106.7% | 214,487 | 320,188 | 49.3% | 46.3% | 54.4% |
| TVL | 467,548 | 406,138 | -13.1% | 558,359 | 628,291 | 12.5% | 45.6% | 39.3% |
The changes in share come from very different growth rates. Girls in STEM more than doubled (+106.7%) while boys in STEM grew 49.3%. Boys in HUMSS nearly quadrupled (+270.3%) while girls in HUMSS grew 179.2%. Girls in TVL fell 13.1% while boys in TVL rose 12.5%.
Girls left GAS (−28.7%) faster than boys did (−22.4%). Girls also left ABM (−12.6%) while boys entered it (+8.0%).
Share of girls and boys in each strand
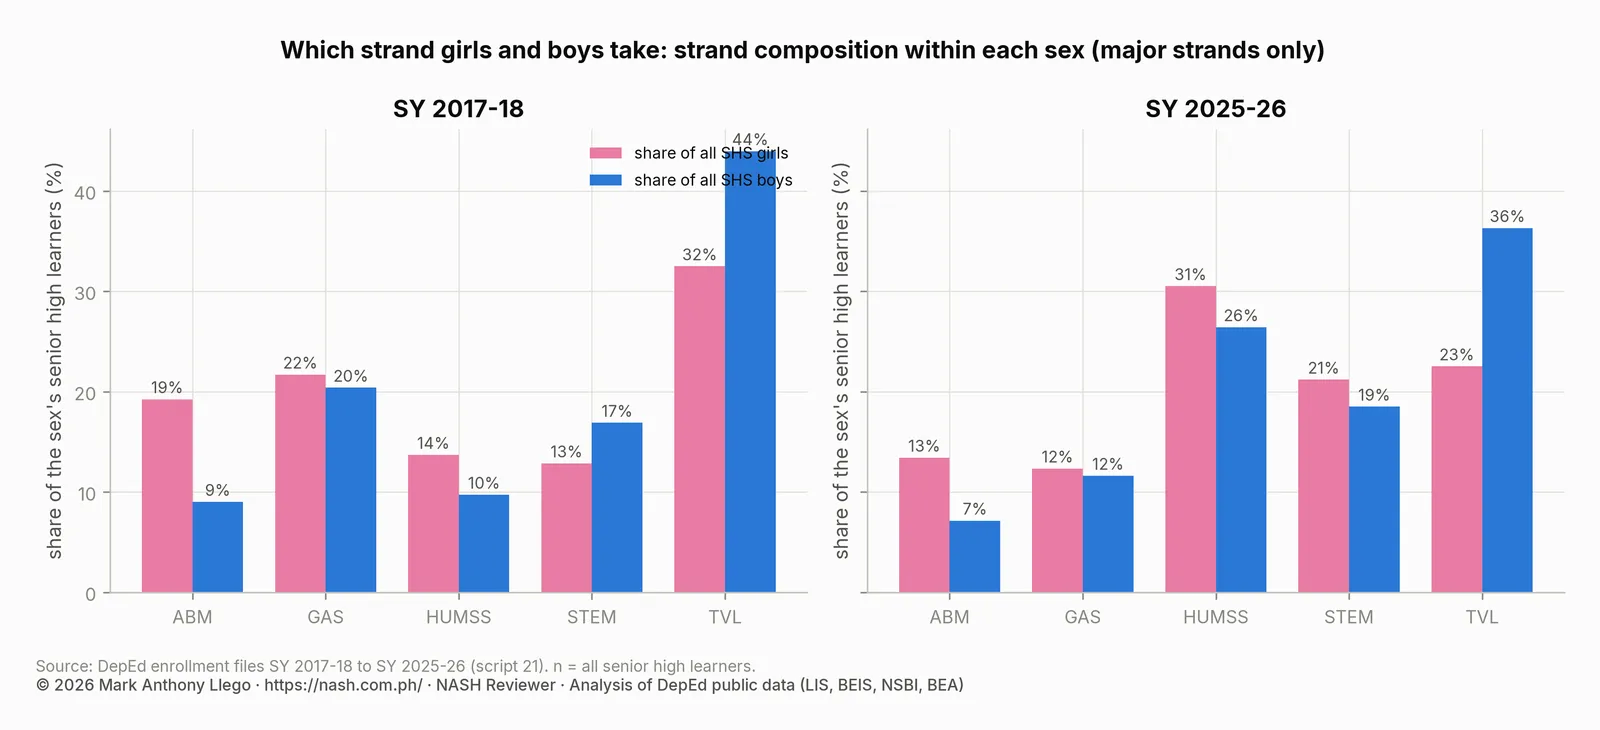
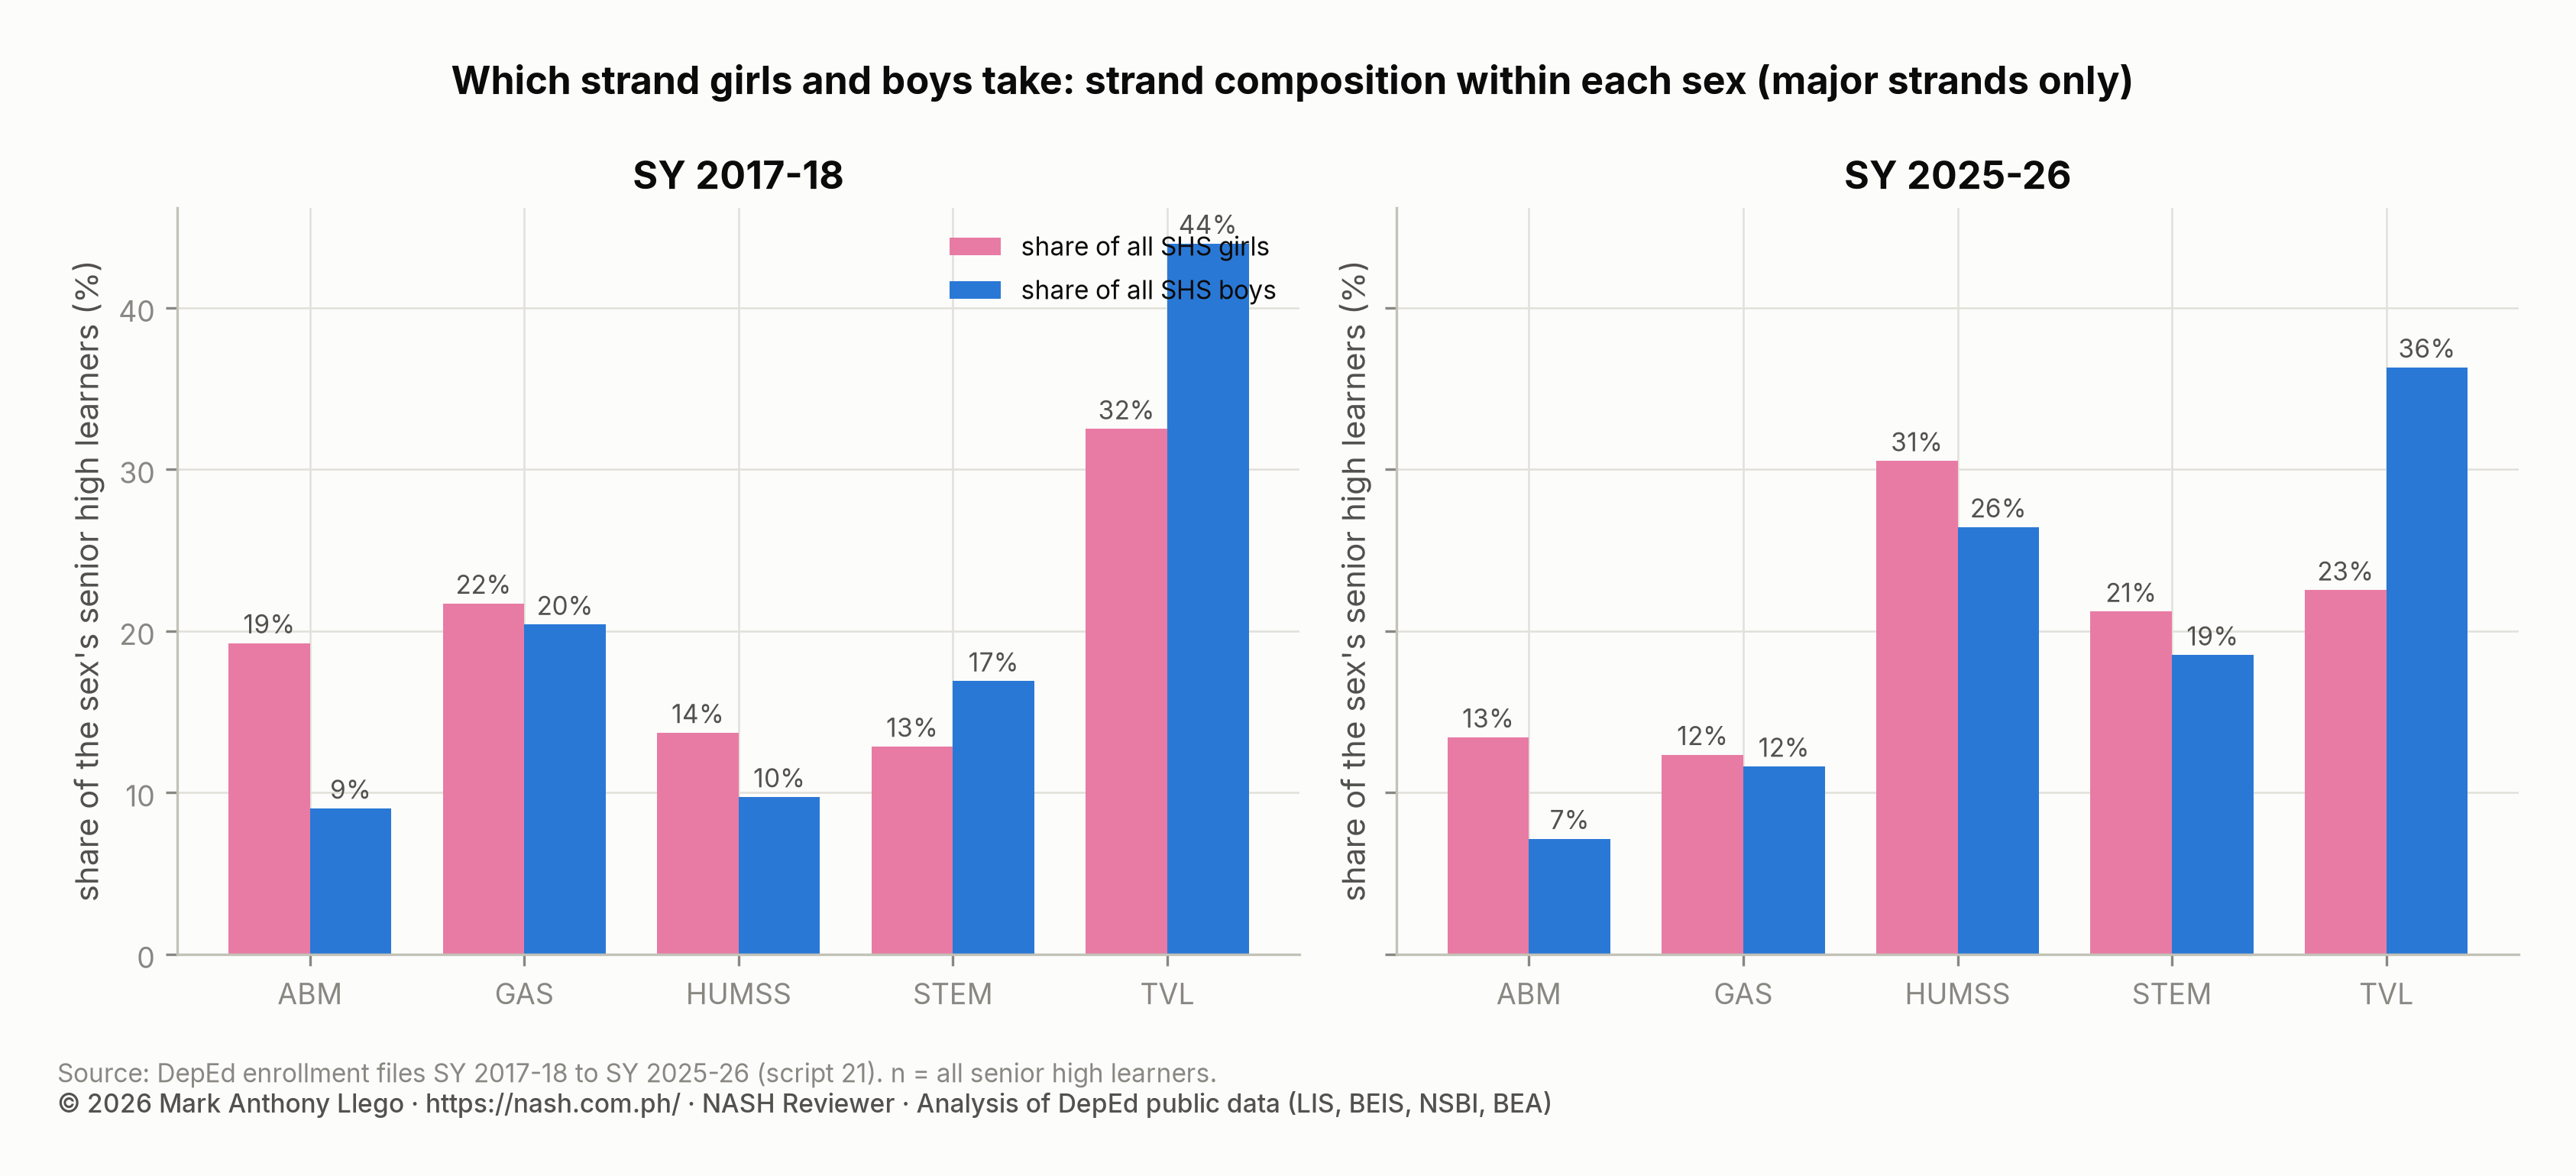
Another way to see the change is to ask what share of all girls in senior high, and of all boys, is in each strand.
| Track or strand | Girls | Boys | Learners | Female share | Share of all girls in SHS | Share of all boys in SHS |
|---|---|---|---|---|---|---|
| TVL | 467,548 | 558,359 | 1,025,907 | 45.6% | 32.3% | 43.4% |
| GAS | 312,224 | 258,905 | 571,129 | 54.7% | 21.6% | 20.1% |
| STEM | 184,873 | 214,487 | 399,360 | 46.3% | 12.8% | 16.7% |
| ABM | 276,980 | 114,456 | 391,436 | 70.8% | 19.1% | 8.9% |
| HUMSS | 197,107 | 123,470 | 320,577 | 61.5% | 13.6% | 9.6% |
| Arts and Design | 6,095 | 4,479 | 10,574 | 57.6% | 0.4% | 0.3% |
| Maritime | 446 | 9,644 | 10,090 | 4.4% | 0.0% | 0.7% |
| Sports | 1,539 | 2,848 | 4,387 | 35.1% | 0.1% | 0.2% |
In SY 2017-2018, TVL was the most common choice for both sexes: 32.3% of girls and 43.4% of boys. GAS was second for both. STEM took 12.8% of girls and 16.7% of boys, so boys were more likely than girls to be in STEM. ABM took 19.1% of girls and HUMSS 13.6%.
| Track or strand | Girls | Boys | Learners | Female share | Share of all girls in SHS | Share of all boys in SHS |
|---|---|---|---|---|---|---|
| TVL | 406,138 | 628,291 | 1,034,429 | 39.3% | 20.8% | 33.5% |
| HUMSS | 550,329 | 457,226 | 1,007,555 | 54.6% | 28.2% | 24.4% |
| STEM | 382,222 | 320,188 | 702,410 | 54.4% | 19.6% | 17.1% |
| GAS | 222,486 | 200,993 | 423,479 | 52.5% | 11.4% | 10.7% |
| ABM | 241,999 | 123,598 | 365,597 | 66.2% | 12.4% | 6.6% |
| Strengthened SHS: Academic | 105,357 | 78,765 | 184,122 | 57.2% | 5.4% | 4.2% |
| Strengthened SHS: TechPro | 32,523 | 52,185 | 84,708 | 38.4% | 1.7% | 2.8% |
| Arts and Design | 10,043 | 7,374 | 17,417 | 57.7% | 0.5% | 0.4% |
| Sports | 1,530 | 4,088 | 5,618 | 27.2% | 0.1% | 0.2% |
| Maritime | 305 | 3,476 | 3,781 | 8.1% | 0.0% | 0.2% |
| Unique strands | 129 | 51 | 180 | 71.7% | 0.0% | 0.0% |
In SY 2025-2026, the ranking for girls is HUMSS (28.2%), TVL, STEM, ABM and GAS. For boys it is TVL (33.5%), HUMSS, STEM, GAS and ABM.
A girl in senior high is now more likely to be in STEM than a boy is, 19.6% against 17.1%, the reverse of the SY 2017-2018 position. She is also far less likely to be in TVL than a boy, 20.8% against 33.5%. In SY 2017-2018 the gap was 11 points rather than 13, and both shares were higher.
The two new Strengthened Senior High School tracks, piloted in SY 2025-2026, repeat the pattern of the strands they will replace. The Academic track is 57.2% female and the TechPro track 38.4% female. Among the small strands, Arts and Design is 57.7% female, Sports 27.2% and Maritime 8.1%.
Strands by sex in public and private schools and by grade
| Strand | Public learners | Public female share | Private learners | Private female share |
|---|---|---|---|---|
| ABM | 182,066 | 67.2% | 181,782 | 65.2% |
| GAS | 325,195 | 53.7% | 94,940 | 48.2% |
| HUMSS | 629,640 | 55.0% | 375,131 | 53.9% |
| STEM | 251,400 | 57.8% | 441,303 | 52.4% |
| TVL | 804,228 | 39.1% | 228,492 | 39.9% |
Two facts about sector stand out. First, most STEM learners are in private schools: 441,303 against 251,400 in public schools. Private schools hold 63% of STEM enrollment while holding 36.6% of senior high. Second, STEM’s female majority is larger in public schools (57.8%) than in private ones (52.4%).
Public TVL, at 804,228 learners, is the largest single sector-strand block in senior high. It is 39.1% female, almost identical to private TVL’s 39.9%. GAS is the only major strand in which private schools are majority male (48.2% female).
| Strand | Grade 11 learners | Grade 11 female share | Grade 12 learners | Grade 12 female share |
|---|---|---|---|---|
| ABM | 161,403 | 64.6% | 204,194 | 67.4% |
| GAS | 199,484 | 52.8% | 223,995 | 52.3% |
| HUMSS | 473,755 | 55.0% | 533,800 | 54.3% |
| STEM | 314,548 | 54.2% | 387,862 | 54.6% |
| TVL | 488,299 | 39.6% | 546,130 | 39.0% |
Between Grade 11 and Grade 12 the female shares barely move, with one exception. ABM is 64.6% female in Grade 11 and 67.4% in Grade 12. Two years of data cannot say whether boys leave ABM between the grades or the two cohorts differ.
Female share of STEM and TVL by region
| Region | STEM female share | TVL female share | HUMSS female share | ABM female share | GAS female share | Girls in STEM (share of the region’s SHS girls) | Boys in STEM (share of the region’s SHS boys) | Boys in TVL (share of the region’s SHS boys) | Girls in TVL (share of the region’s SHS girls) |
|---|---|---|---|---|---|---|---|---|---|
| Region IX | 61.6% | 42.1% | 61.4% | 66.7% | 58.4% | 16.7% | 11.8% | 50.3% | 32.4% |
| BARMM | 61.3% | 49.1% | 55.2% | 57.3% | 57.5% | 11.6% | 9.1% | 17.1% | 13.4% |
| CAR | 60.4% | 38.3% | 50.9% | 62.6% | 50.2% | 27.2% | 18.6% | 27.7% | 16.4% |
| Region XII | 59.8% | 38.2% | 58.5% | 67.4% | 57.7% | 14.5% | 10.6% | 43.8% | 25.1% |
| CARAGA | 59.3% | 40.1% | 57.2% | 67.4% | 54.2% | 14.0% | 10.0% | 41.2% | 26.4% |
| MIMAROPA | 59.1% | 41.7% | 52.3% | 67.1% | 54.4% | 13.8% | 10.2% | 32.6% | 21.8% |
| Region II | 58.3% | 38.8% | 50.0% | 69.5% | 48.7% | 22.8% | 16.9% | 25.8% | 15.8% |
| Region XI | 58.2% | 40.9% | 59.2% | 67.6% | 56.1% | 13.9% | 10.6% | 45.0% | 29.2% |
| NIR | 58.0% | 40.0% | 55.6% | 71.1% | 54.0% | 14.2% | 10.8% | 37.0% | 23.6% |
| Region VI | 57.9% | 36.7% | 56.0% | 68.9% | 49.3% | 17.4% | 12.5% | 39.9% | 23.6% |
| Region I | 57.2% | 39.2% | 50.8% | 70.1% | 47.0% | 22.3% | 16.7% | 34.5% | 22.3% |
| Region V | 57.0% | 39.7% | 59.1% | 69.7% | 54.3% | 12.8% | 10.4% | 36.2% | 22.2% |
| Region X | 56.9% | 36.3% | 58.3% | 67.3% | 53.4% | 17.3% | 14.1% | 33.1% | 17.5% |
| Region VIII | 56.8% | 39.6% | 55.5% | 69.1% | 53.6% | 13.4% | 10.6% | 38.7% | 24.3% |
| Region VII | 53.2% | 36.5% | 57.2% | 66.6% | 49.2% | 20.8% | 18.0% | 38.7% | 22.5% |
| Region III | 52.6% | 39.4% | 53.6% | 65.8% | 47.3% | 22.0% | 20.4% | 28.2% | 17.9% |
| Region IV-A | 51.0% | 38.6% | 51.2% | 66.3% | 46.9% | 25.7% | 25.0% | 28.2% | 17.5% |
| NCR | 50.4% | 39.3% | 54.5% | 62.4% | 47.7% | 25.2% | 25.6% | 26.4% | 16.6% |
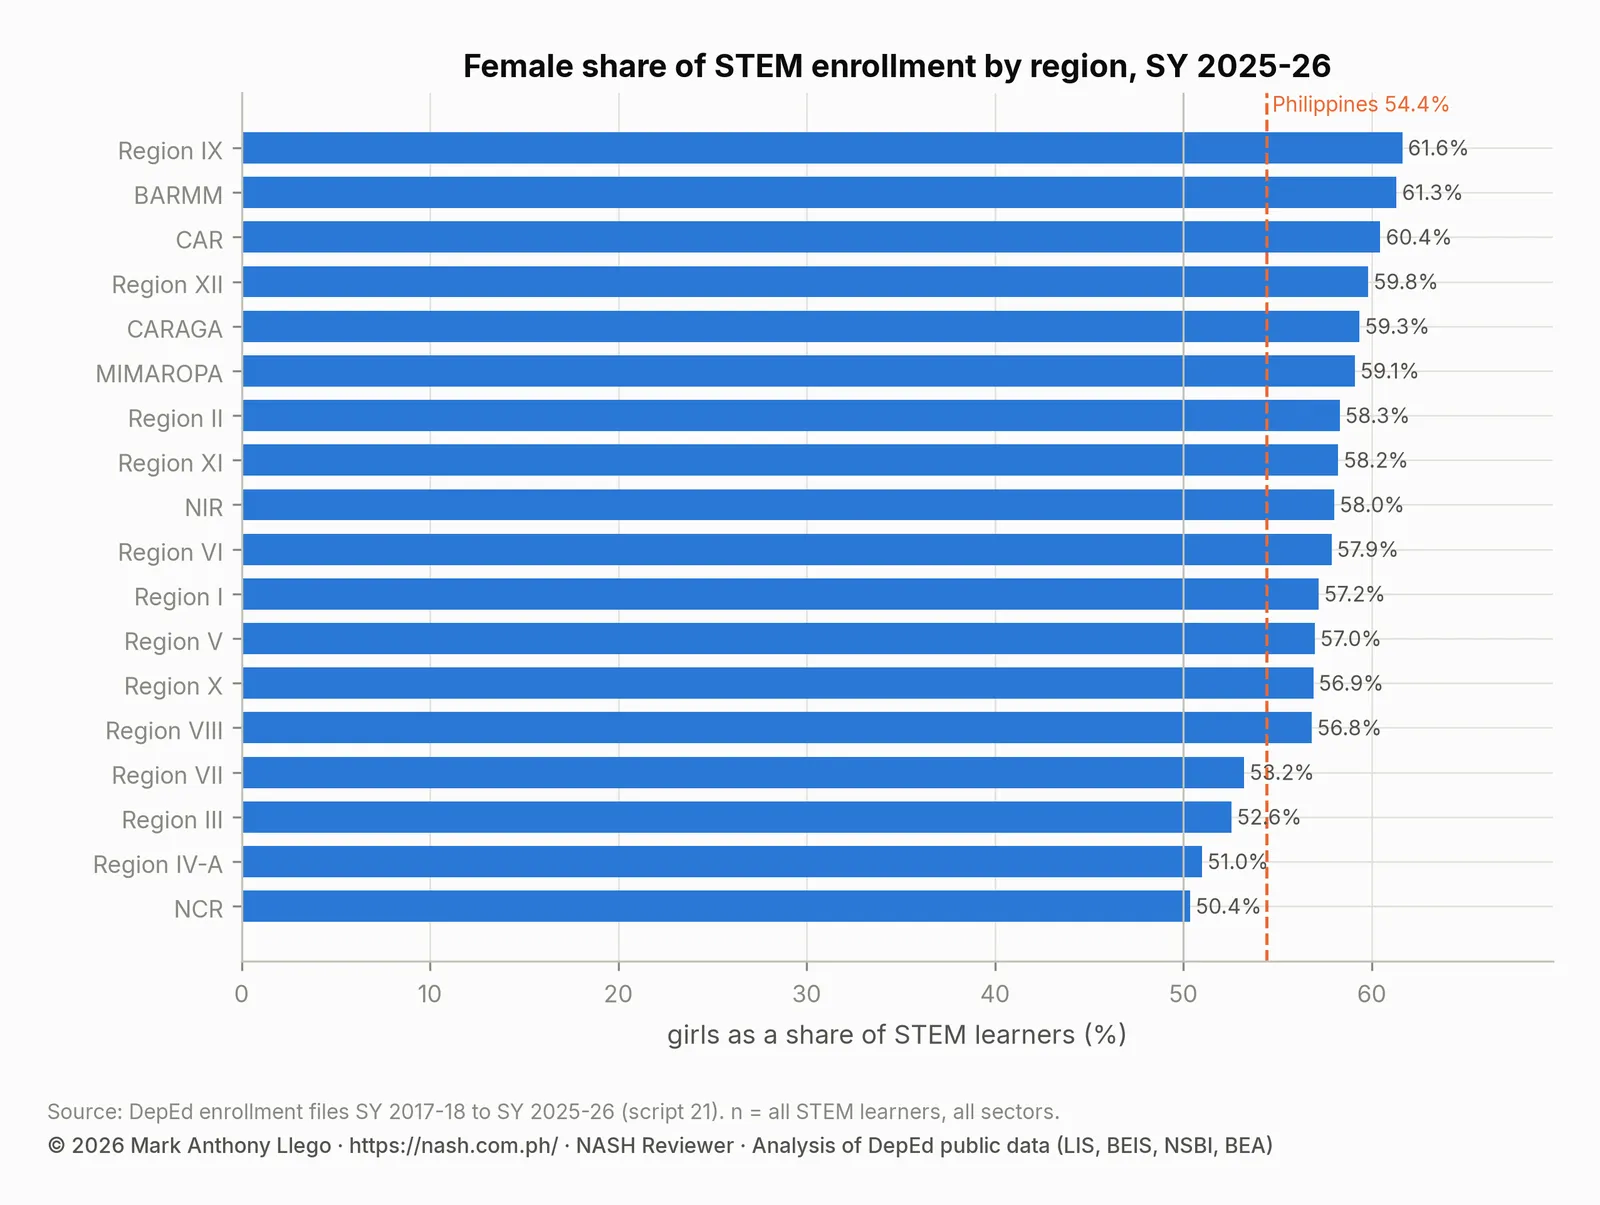
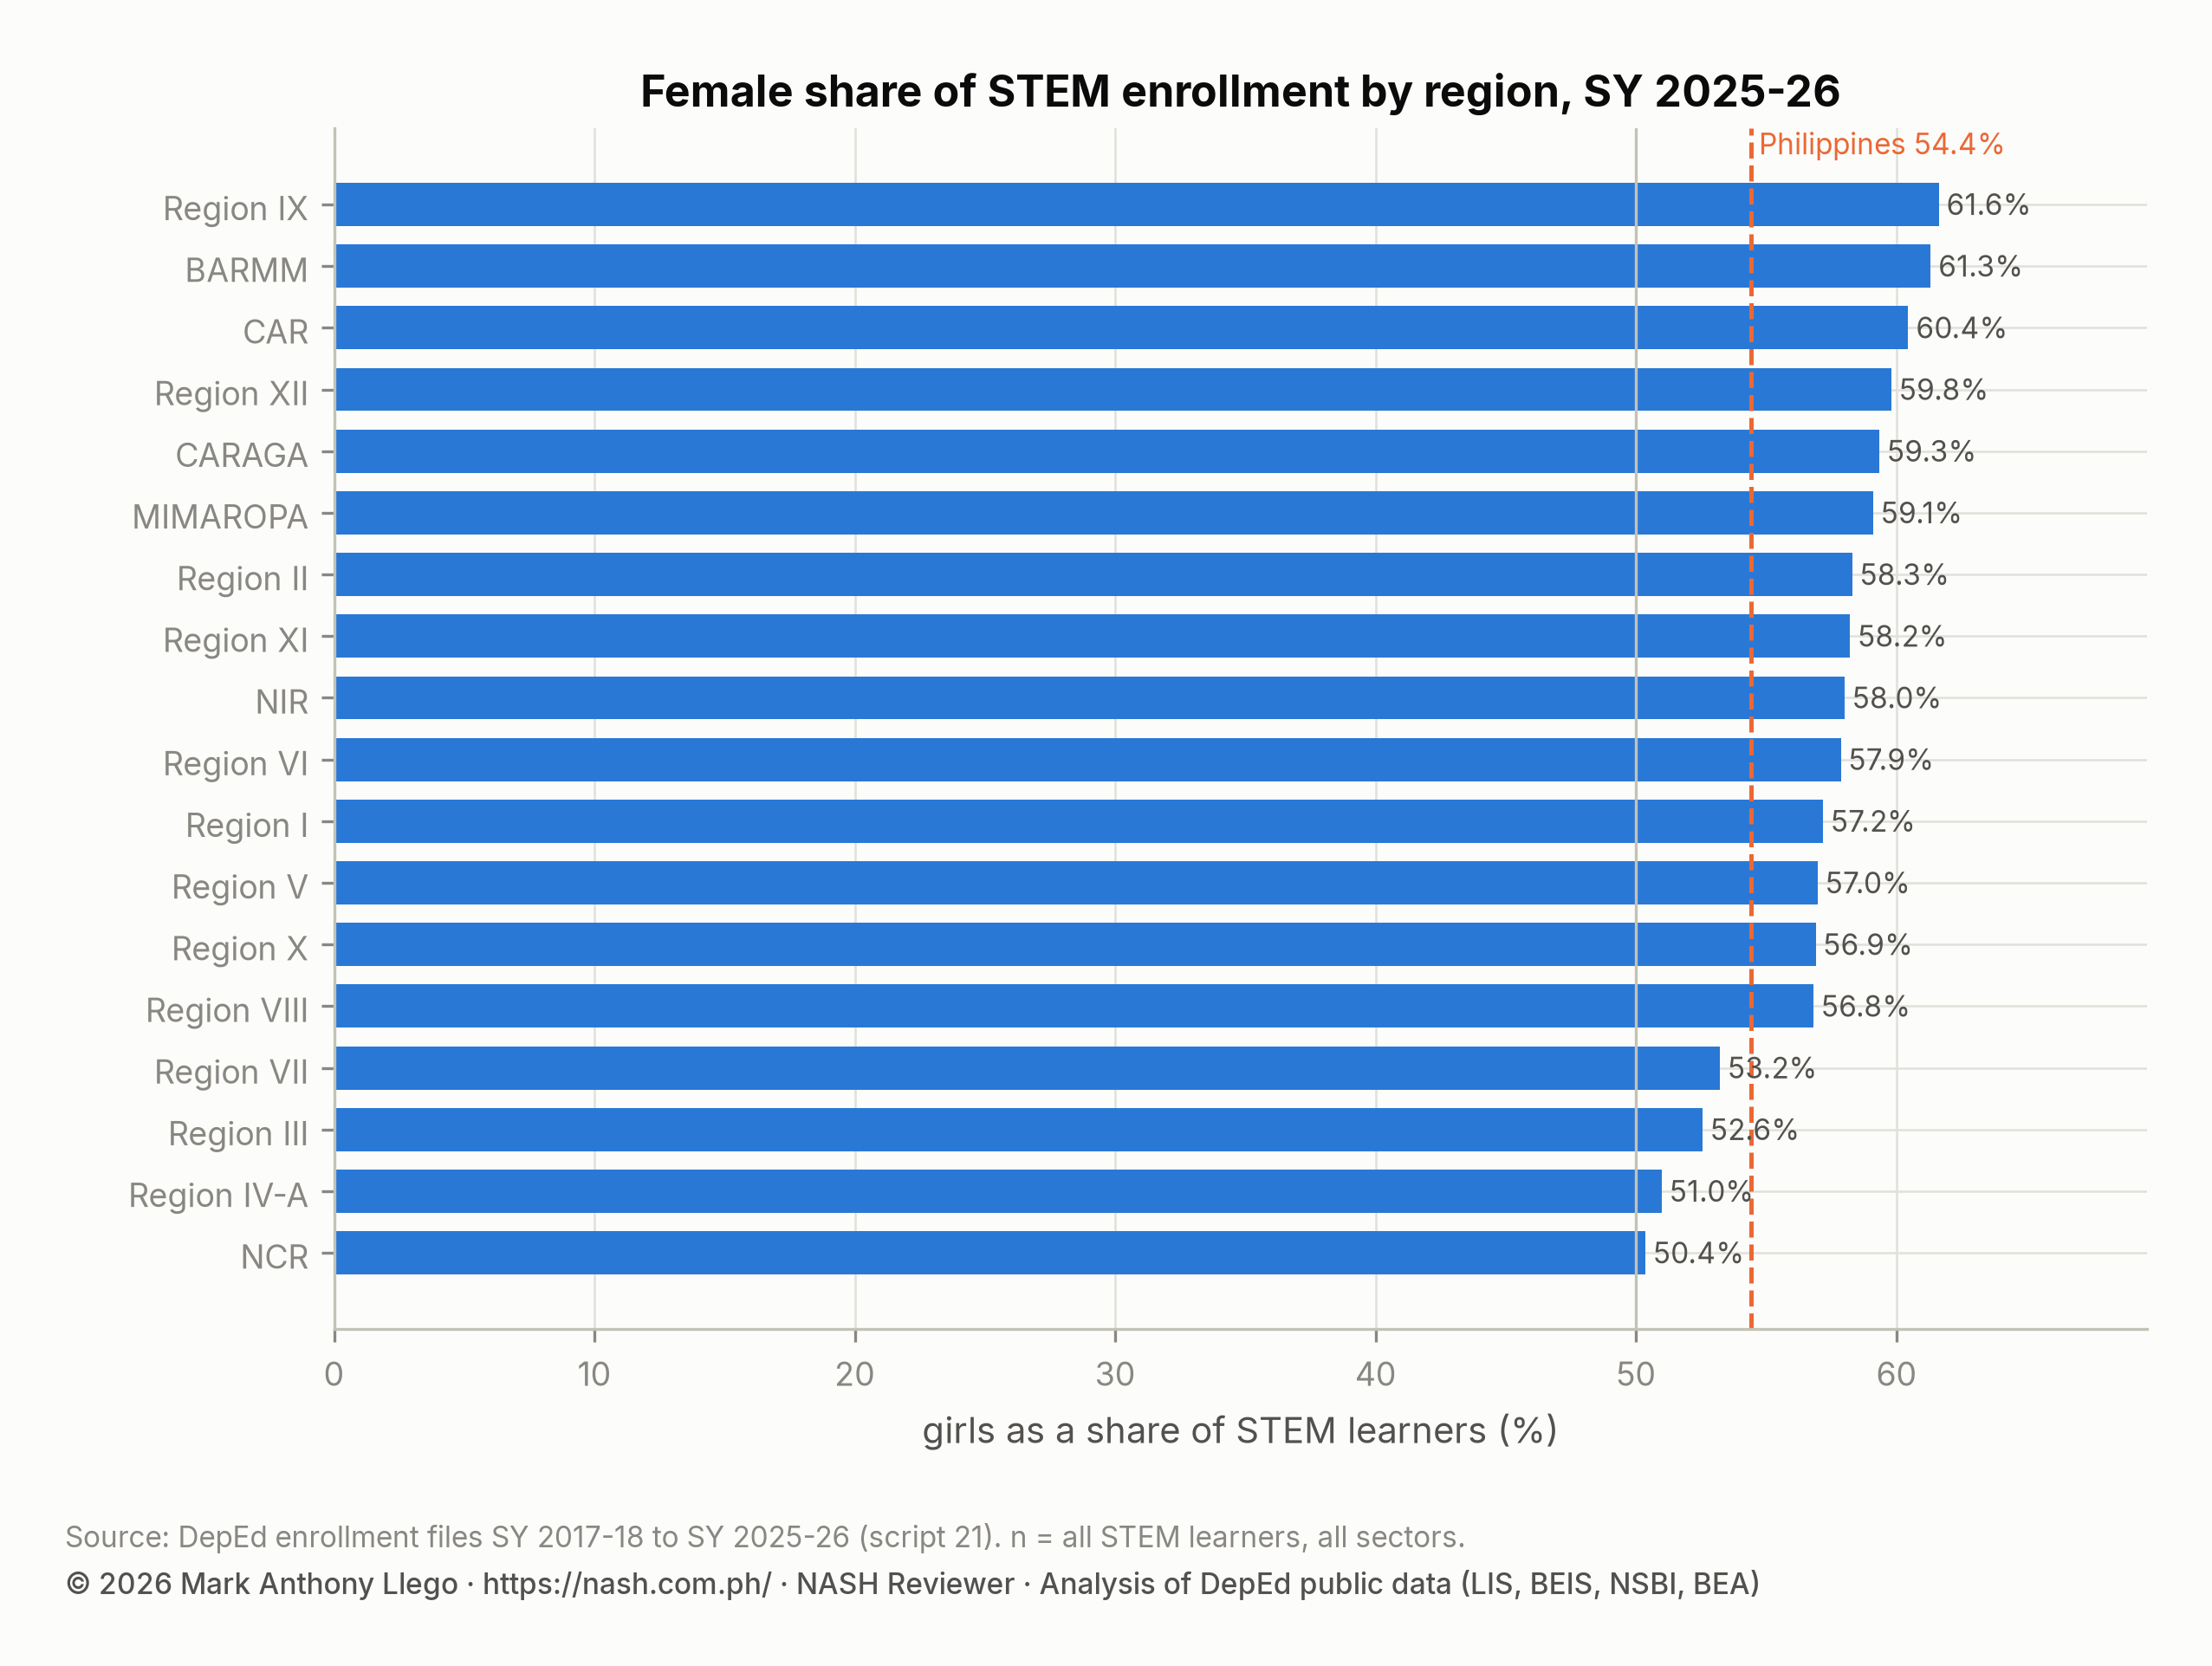
The female majority in STEM is strongest far from the capital. Girls are 61.6% of STEM learners in Region IX, 61.3% in BARMM and 60.4% in CAR. They are only 50.4% in NCR, 51.0% in Region IV-A and 52.6% in Region III. STEM is largest in the capital region and its neighbors, where private STEM schools are most numerous, and there boys and girls take it in equal numbers.
The regions also differ in how large a part of senior high STEM is. More than a quarter of senior high girls are in STEM in CAR (27.2%), Region IV-A (25.7%) and NCR (25.2%). Only about one in nine are in BARMM (11.6%) and Region V (12.8%).
Boys in TVL range from 50.3% of all senior high boys in Region IX and 45.0% in Region XI to 17.1% in BARMM. ABM’s female share is above 62% in every region, and above 70% in NIR and Region I.
What changed, and what the file cannot say
The file records which strand each learner is enrolled in; it does not record why. Four things changed over the period that bear on the pattern.
First, the earliest senior high cohorts chose strands from an offer that was still being built. TVL and GAS, the most widely offered, took the largest shares of both sexes. As STEM and HUMSS sections opened, both sexes moved toward them, and girls moved toward STEM faster.
Second, the pandemic years cut TVL, whose specializations need workshops and immersion, by 8.2% in SY 2020-2021, and the girls who left it did not return in the same numbers. Third, private STEM enrollment grew, and private STEM is closer to parity. Fourth, learners moved away from GAS, which was 21.6% of girls in SY 2017-2018 and 11.4% in SY 2025-2026. That shift moved learners who had not chosen a specialization into strands that had one, HUMSS most of all.
The file has one sex column per learner, recorded as male or female, and the strand labels are DepEd’s. The SY 2025-2026 figures for the five established strands exclude the 268,830 learners in the Strengthened SHS tracks. Their shares are therefore smaller than they would otherwise be, but the female shares within each strand are unaffected.
What this means for school heads
For a senior high school head, the strand mix decides sections, teacher specializations and workshop space, and it has a sex dimension that the totals hide. A school whose TVL sections are two-thirds male and whose ABM sections are two-thirds female is typical, not unusual. A school whose STEM intake is majority female is now the national norm.
Strand 3.7 of the Philippine Professional Standards for School Heads (PPSSH) asks school heads to integrate career awareness into learning experiences. Strand 5.3 asks for gender sensitivity as an inclusive practice.
The data suggest that the question is no longer why girls avoid STEM, because they no longer do. The questions are why boys avoid ABM and why girls have left TVL. Another is whether the TechPro track of the Strengthened curriculum, 38.4% female in its pilot year, will repeat TVL’s pattern. Senior High School and Jobs covers what EDCOM II found about where SHS graduates go and how the Tech-Pro track is aligned with TESDA.
Frequently asked questions
Are there more girls or boys in STEM in Philippine senior high school?
More girls. In SY 2025-2026, 382,222 girls and 320,188 boys were enrolled in STEM, a female share of 54.4%. In SY 2017-2018 it was 46.3%, with boys in the majority.
Which senior high strand is most male and which is most female?
Among the major strands, TVL is the most male (39.3% female) and ABM the most female (66.2%). Among all strands, Maritime is 8.1% female and the unique strands 71.7% female.
Which region has the highest female share of STEM learners?
Region IX has the highest female share of STEM learners, 61.6%, followed by BARMM (61.3%) and CAR (60.4%). NCR has the lowest, 50.4%.
Download the data
The cleaned, harmonized DepEd files behind this series are free to download in CSV and Parquet, with a codebook and checksums, under the terms of use set out in the release. Download Cleaned DepEd School Data, SY 2017-18 to 2025-26 documents every file and column. The files themselves are at data.nash.com.ph, starting with the README, the SY 2023-24 school master file (CSV, 8.0 MB) and the nine-year enrollment panel (Parquet, 17.2 MB).
More in this series
- DepEd Enrollment Trends SY 2017-2018 to SY 2025-2026
- DepEd Enrollment SY 2025-2026: Below the 2017 Level
- DepEd Enrollment SY 2017-2018: 26.3 Million Learners
- DepEd Learner Data SY 2023-2024: IP, ALIVE and School Size
- DepEd Data for Aspiring School Heads: Where to Start
- For aspiring school heads: PPSSH Domain 3 Through the Data and the full report, Philippine basic education in numbers
Analysis and charts by Mark Anthony Llego for NASH Reviewer. Data: Department of Education enrollment datasets SY 2017-18 to SY 2025-26 (Learner Information System). Charts may be reused only with written permission from support@nash.com.ph.