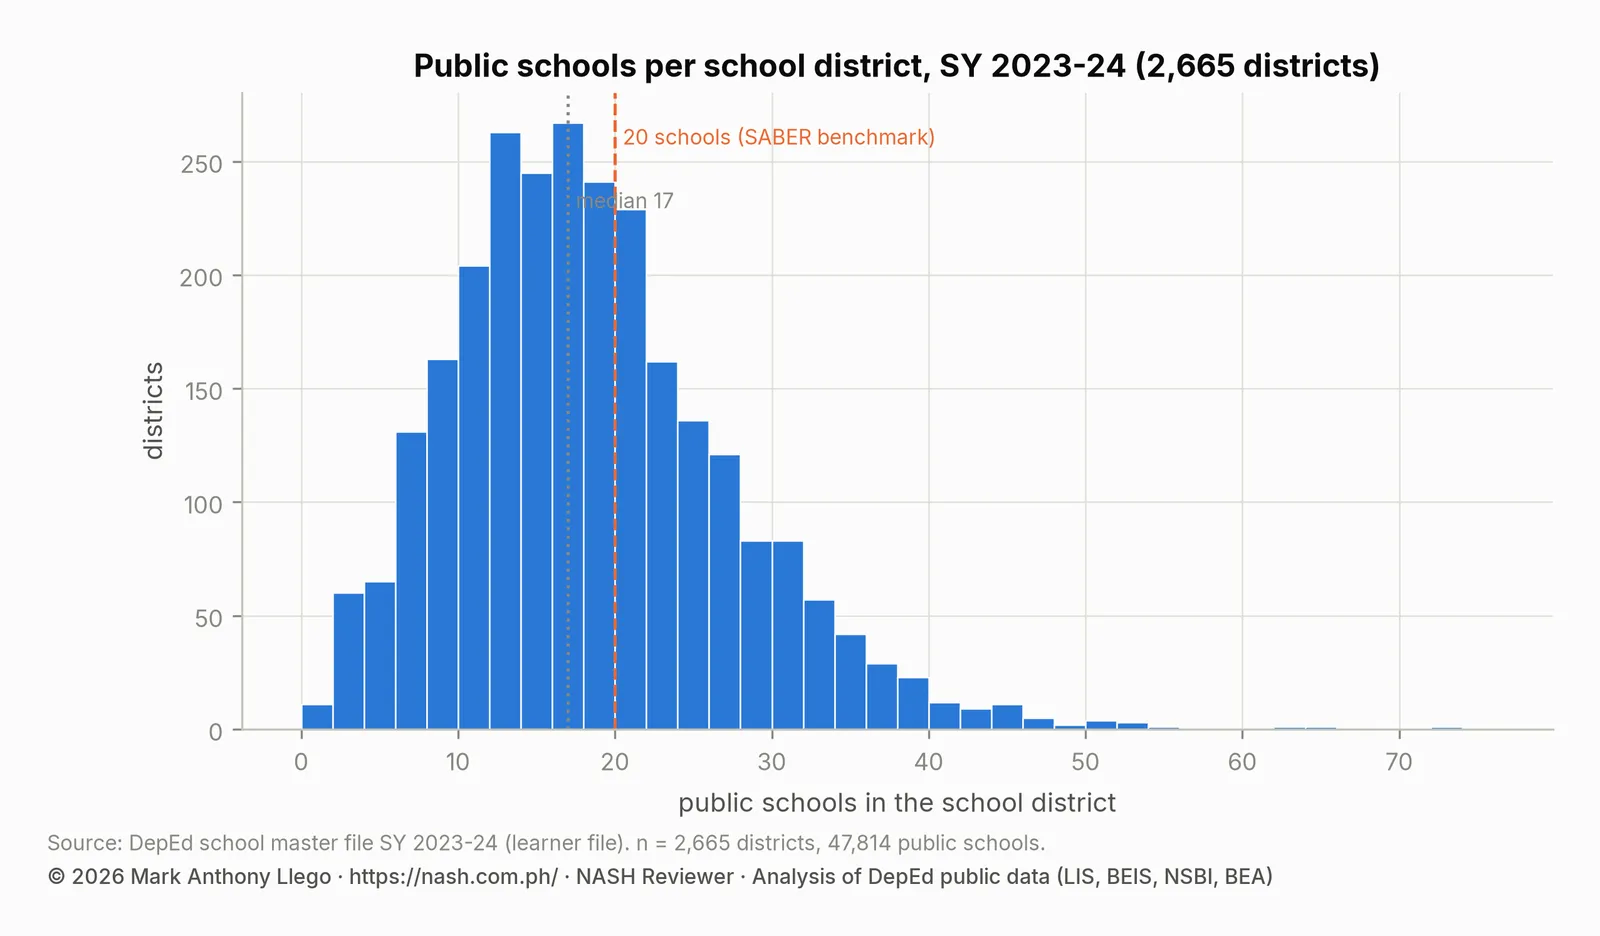
DepEd’s SY 2023-2024 school data show how many public schools each school district and its Public Schools District Supervisor oversee. The 47,814 public schools with learners sit in 2,665 school districts and 228 divisions, a median of 17 schools per district. A third of districts hold more than 20 schools, and those districts contain half of all public schools. Division offices carry from 13 public schools to 1,275.
The school district stands between a public school and its division office. Its Public Schools District Supervisor is the official who visits, monitors and coaches the school heads in a cluster of schools. DepEd’s school files record the district of every public school.
The Final Report of the Second Congressional Commission on Education (EDCOM II) argues in its Priority Area 27 that division offices are staffed on an identical template whatever their size. It cites the World Bank’s SABER (Systems Approach for Better Education Results) benchmark of no more than 20 schools per supervisor.
Key findings
- The median school district has 17 public schools, and a third of districts have more than 20. Those 891 districts hold 51.9% of public schools.
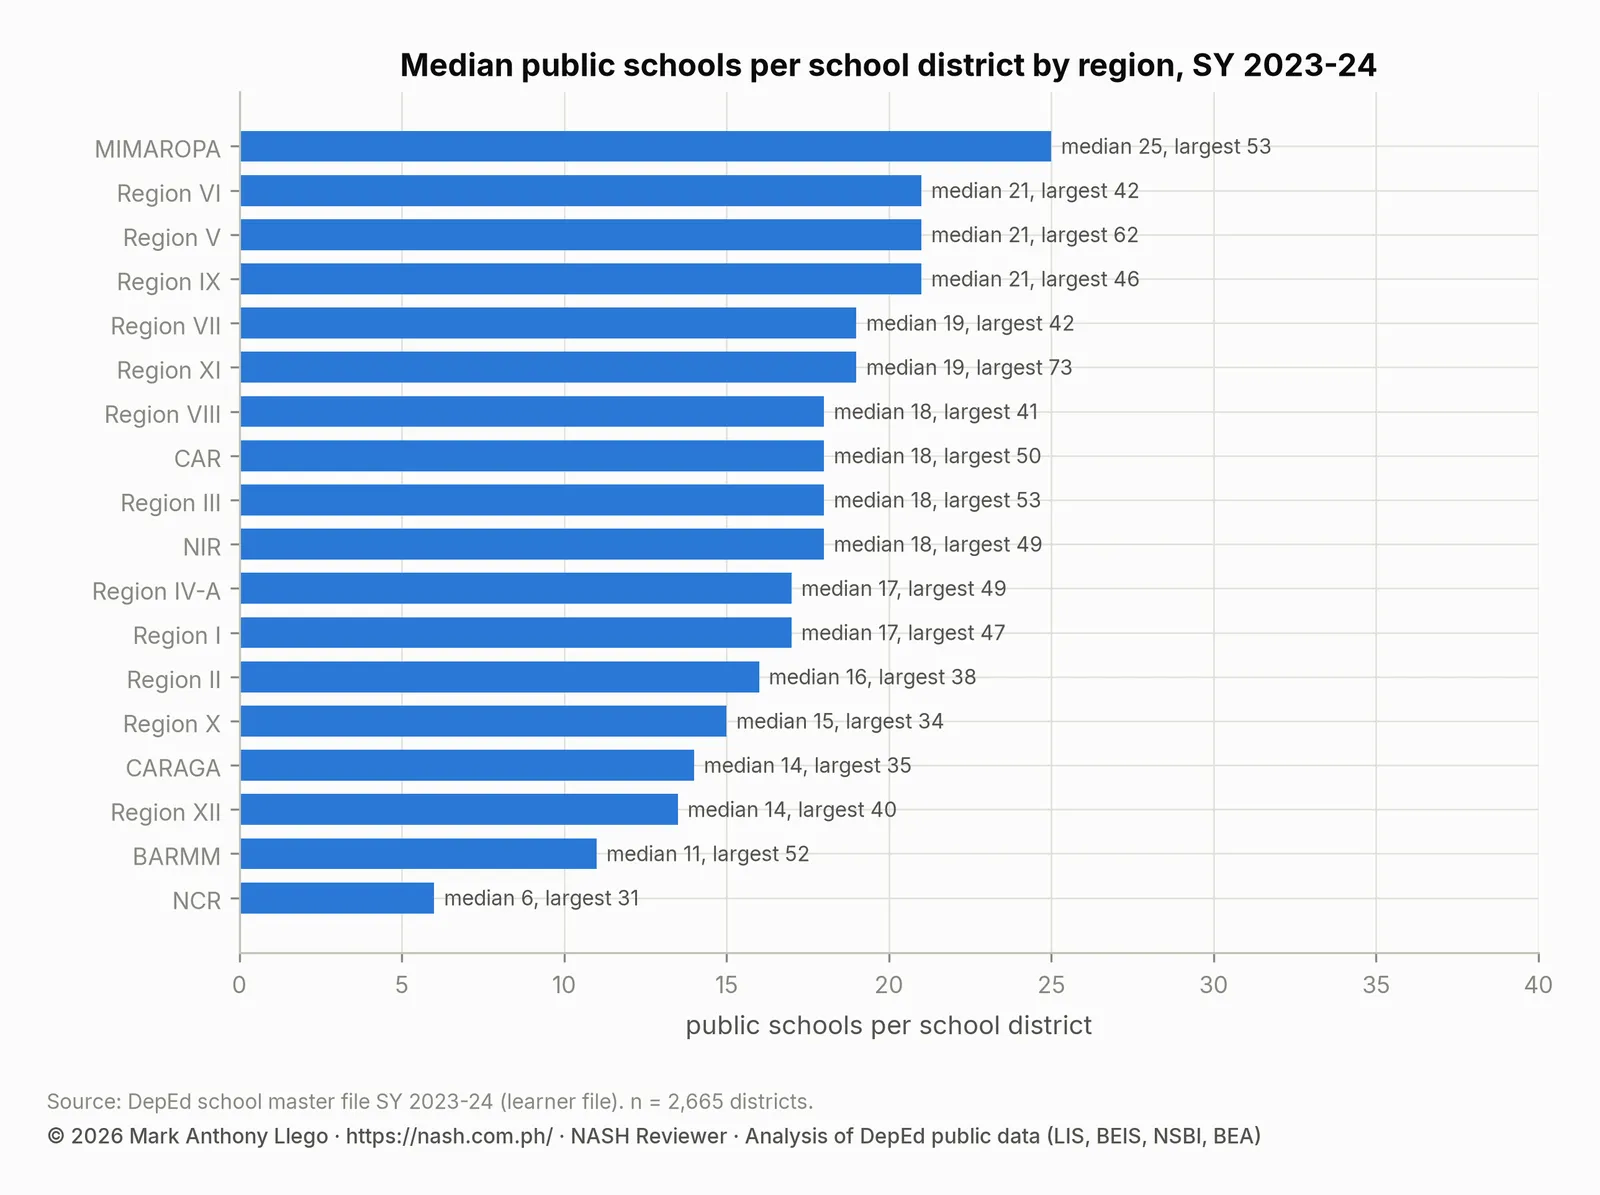
- MIMAROPA has the largest districts and NCR the smallest. MIMAROPA’s median is 25 schools per district, and 70.5% of its districts exceed 20. NCR’s median is six.
- The largest district, Marilog in Davao City, has 73 schools. The twenty largest districts are rural and dispersed.
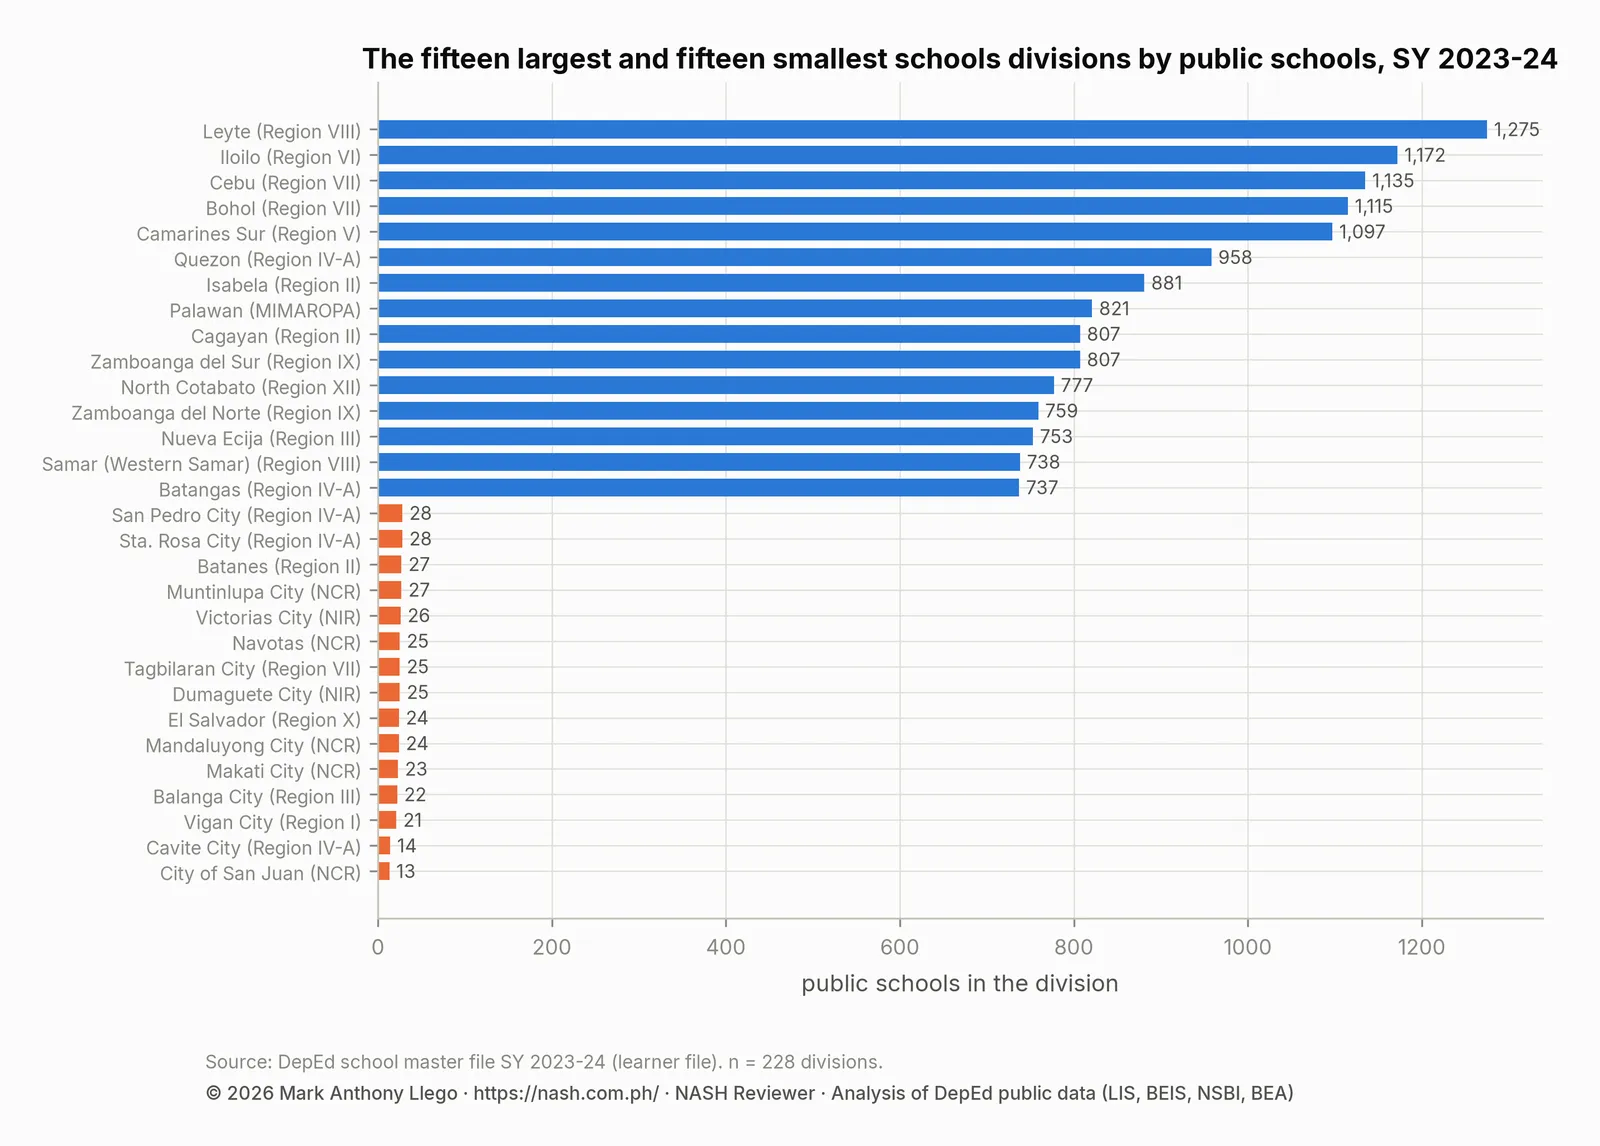
- Divisions range from 13 public schools (City of San Juan) to 1,275 (Leyte). The 32 divisions with more than 500 schools hold 48.9% of all public schools.
Public schools per school district
| Schools in the district | Districts | Share of districts | Schools | Share of schools | Learners | Share of learners |
|---|---|---|---|---|---|---|
| 1–5 | 136 | 5.1% | 461 | 1.0% | 785,680 | 3.4% |
| 6–10 | 394 | 14.8% | 3,253 | 6.8% | 2,728,221 | 11.7% |
| 11–15 | 612 | 23.0% | 7,981 | 16.7% | 4,630,071 | 19.9% |
| 16–20 | 632 | 23.7% | 11,322 | 23.7% | 5,525,825 | 23.8% |
| 21–30 | 647 | 24.3% | 15,924 | 33.3% | 6,230,260 | 26.8% |
| 31–40 | 199 | 7.5% | 6,772 | 14.2% | 2,629,533 | 11.3% |
| over 40 | 45 | 1.7% | 2,101 | 4.4% | 695,837 | 3.0% |
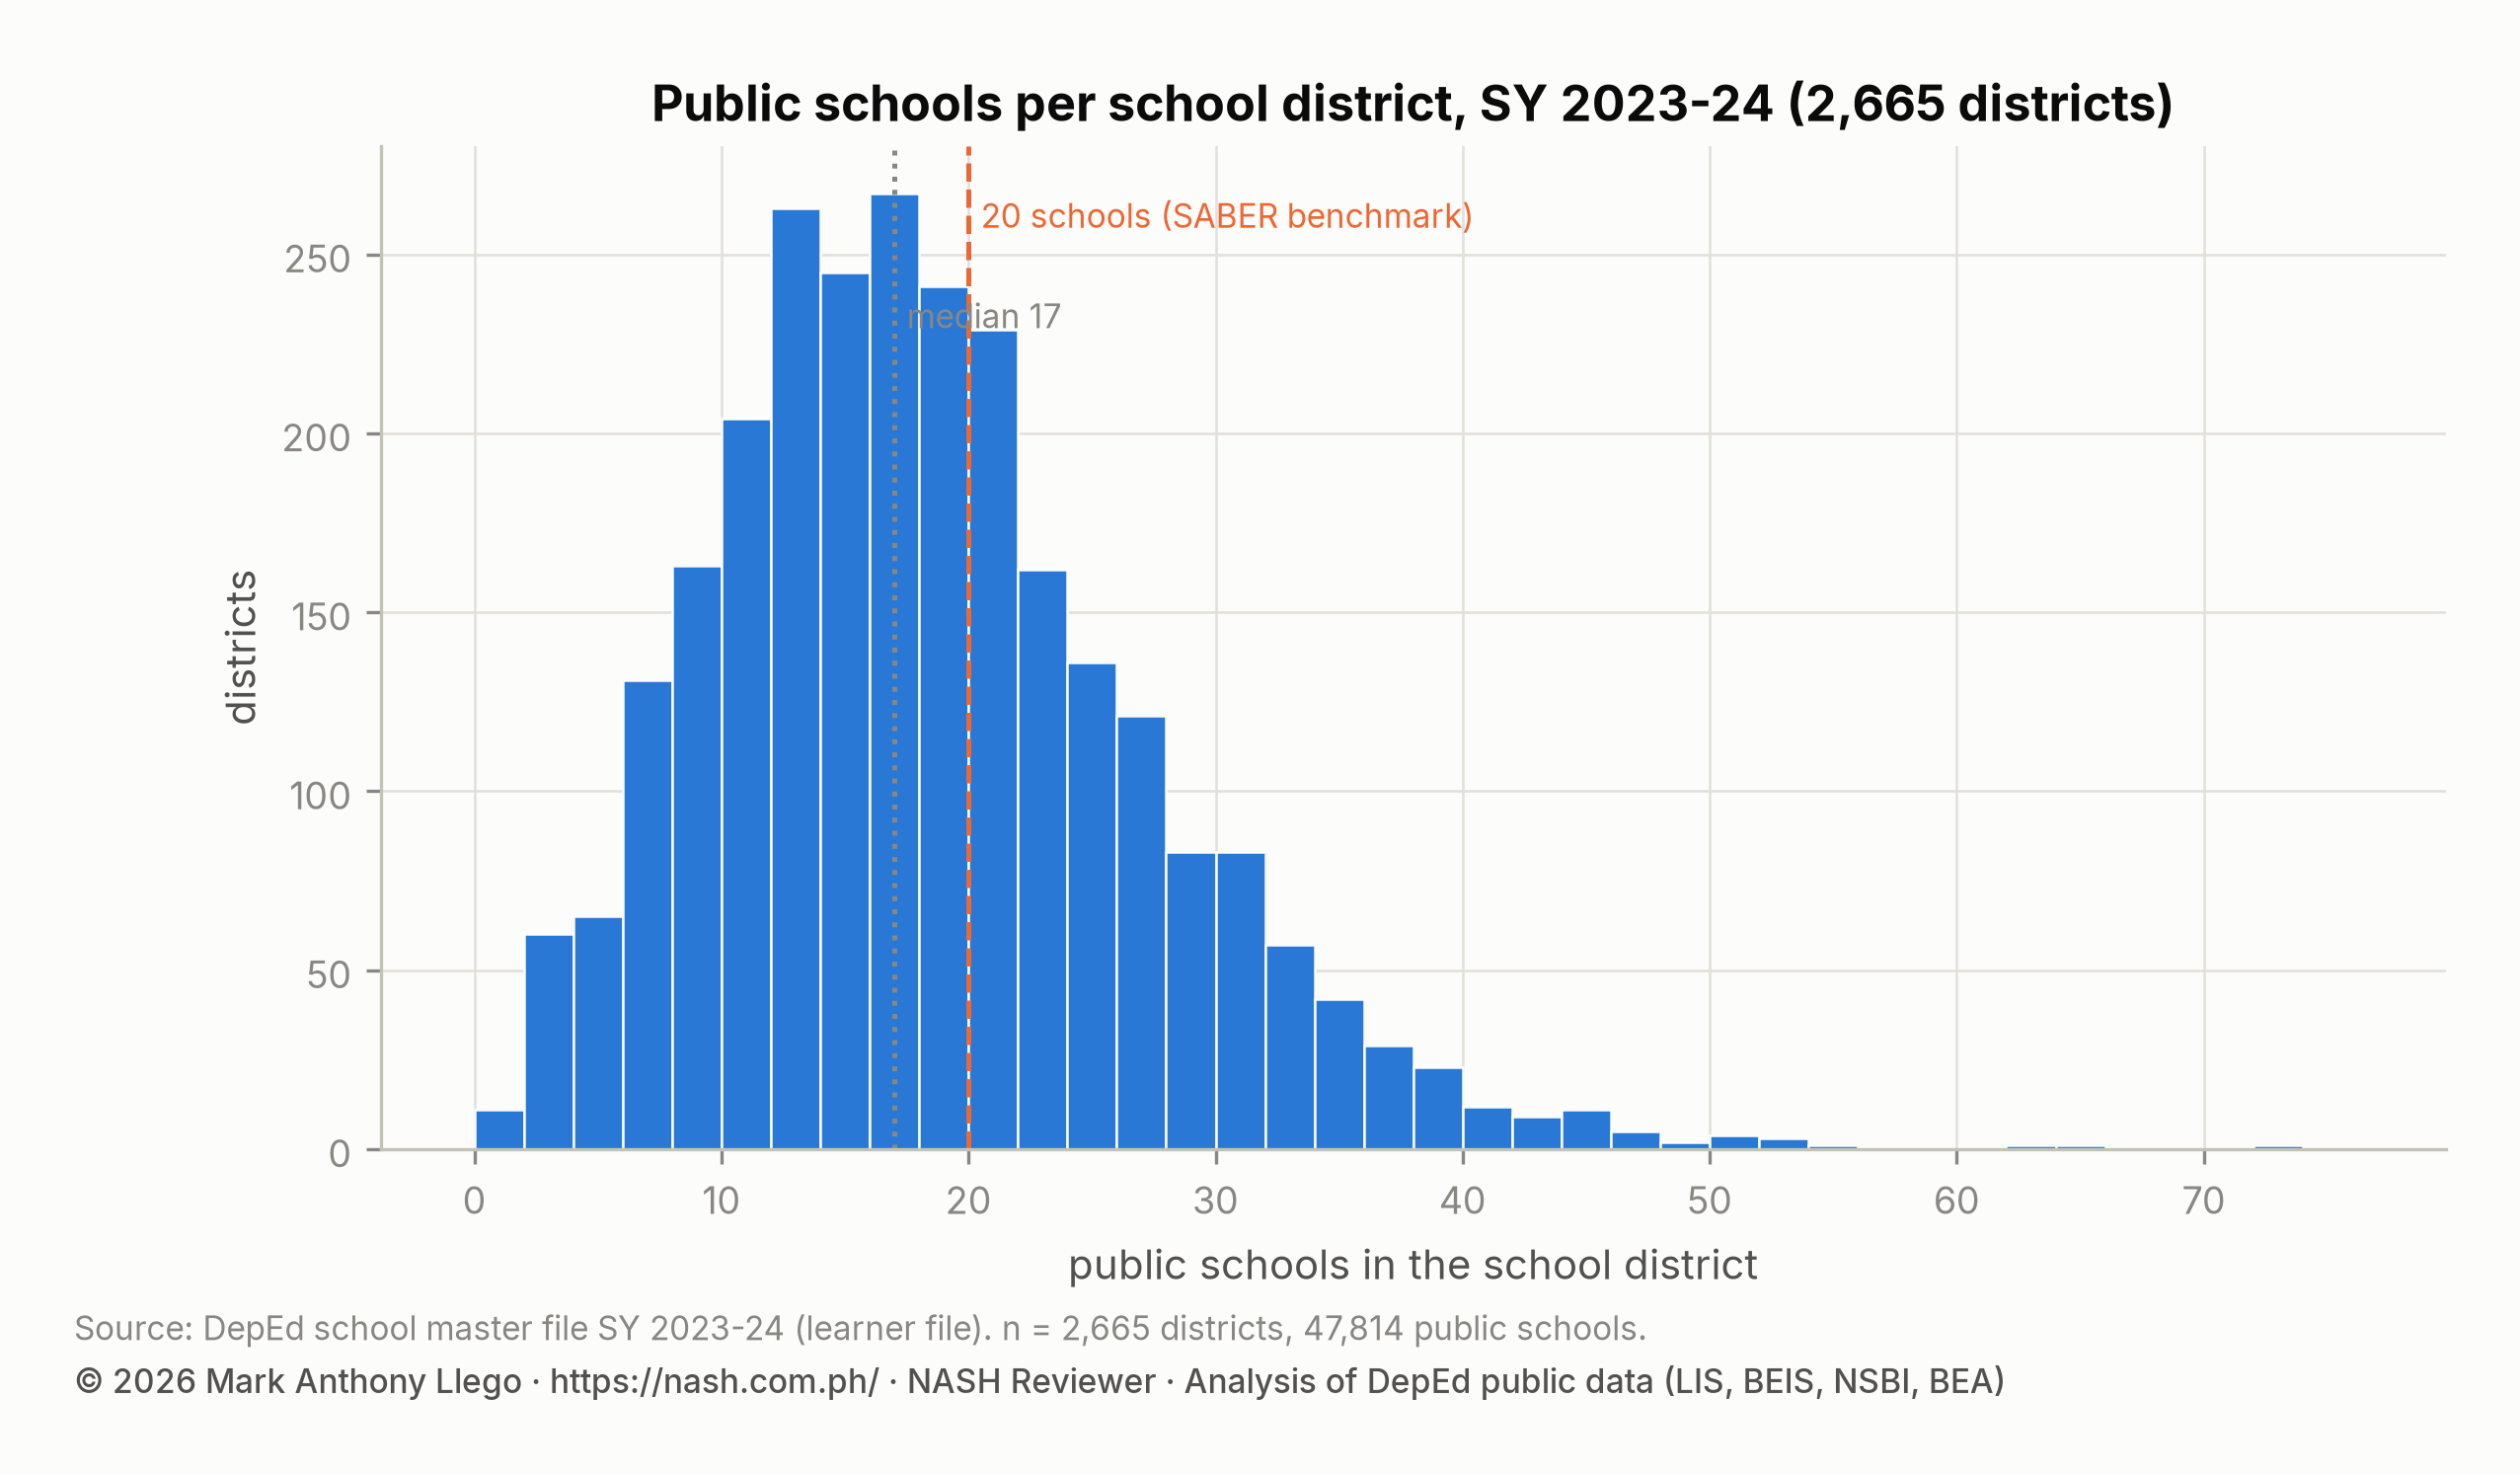
The median school district has 17 public schools, and the mean is 17.9. One district in ten has seven or fewer schools, and one in ten has 30 or more. The largest, Marilog in Davao City, has 73. Measured against the 20-school benchmark, 891 districts (33.4%) are over it. Because large districts hold more schools, 51.9% of public schools, with 41.1% of public learners, are in a district with more than 20 schools. 244 districts (9.2%) hold more than 30 schools, and 45 hold more than 40.
The relationship between schools and learners is the opposite of what a learner-based staffing formula would assume. The 136 districts with five schools or fewer hold 1.0% of schools but 3.4% of learners, because they are city districts of large schools. The 45 districts with more than 40 schools hold 4.4% of schools and 3.0% of learners. A supervisor’s workload is the schools to reach, not the learners to count.
| School district | Division | Region | Public schools | Learners | Learners per school |
|---|---|---|---|---|---|
| Marilog | Davao City | Region XI | 73 | 14,473 | 198 |
| Laak | Davao De Oro | Region XI | 64 | 20,112 | 314 |
| Caramoan | Camarines Sur | Region V | 62 | 15,303 | 247 |
| Kapalong East | Davao del Norte | Region XI | 54 | 15,978 | 296 |
| Cuyapo | Nueva Ecija | Region III | 53 | 14,648 | 276 |
| Bulalacao | Oriental Mindoro | MIMAROPA | 53 | 13,912 | 262 |
| Panglima Sugala (Balimbingan) | Tawi-Tawi | BARMM | 52 | 19,011 | 366 |
| Abra De Ilog-Paluan | Occidental Mindoro | MIMAROPA | 51 | 13,203 | 259 |
| Moncayo | Davao De Oro | Region XI | 50 | 23,591 | 472 |
| Rizal | Palawan | MIMAROPA | 50 | 15,744 | 315 |
| Buguias | Benguet | CAR | 50 | 10,371 | 207 |
| Tagkawayan | Quezon | Region IV-A | 49 | 15,173 | 310 |
| Bayawan East | Bayawan City | NIR | 49 | 23,360 | 477 |
| Bolinao | Pangasinan I, Lingayen | Region I | 47 | 22,469 | 478 |
| Pili | Camarines Sur | Region V | 47 | 26,684 | 568 |
| Calabanga | Camarines Sur | Region V | 46 | 23,076 | 502 |
| Luuk (Kalinggalan Calauang) | Sulu | Region IX | 46 | 13,874 | 302 |
| Guihulngan North | Guihulngan City | NIR | 46 | 11,816 | 257 |
| Paracelis | Mt. Province | CAR | 45 | 7,699 | 171 |
| Balabac | Palawan | MIMAROPA | 45 | 13,068 | 290 |
The twenty largest districts are rural and dispersed. Marilog’s 73 schools average 198 learners each. Paracelis in Mountain Province has 45 schools and 7,699 learners, or 171 per school, and Buguias in Benguet has 50 schools averaging 207. Ten of the twenty are in Davao, Bicol and MIMAROPA provinces. The list also includes Panglima Sugala in Tawi-Tawi, Luuk in Sulu, and Balabac and Rizal in Palawan, districts where schools are reached by boat as often as by road. Supervising 50 schools of 200 learners spread across islands or mountains is a different job from supervising 50 schools in a city.
Schools per district by region
| Region | Districts | Public schools | Schools per district (median) | Schools per district (mean) | Largest district | Districts with more than 20 schools | Learners per district (median) |
|---|---|---|---|---|---|---|---|
| MIMAROPA | 95 | 2,382 | 25 | 25.1 | 53 | 70.5% | 8,174 |
| Region VI | 131 | 2,835 | 21 | 21.6 | 42 | 51.1% | 6,984 |
| Region V | 175 | 3,862 | 21 | 22.1 | 62 | 55.4% | 8,235 |
| Region IX | 133 | 2,993 | 21 | 22.5 | 46 | 51.1% | 7,042 |
| Region VII | 151 | 2,810 | 19 | 18.6 | 42 | 38.4% | 8,039 |
| Region XI | 101 | 2,218 | 19 | 22 | 73 | 41.6% | 10,567 |
| Region VIII | 219 | 4,179 | 18 | 19.1 | 41 | 39.3% | 4,830 |
| CAR | 96 | 1,844 | 18 | 19.2 | 50 | 40.6% | 2,652 |
| Region III | 191 | 3,729 | 18 | 19.5 | 53 | 39.8% | 11,110 |
| NIR | 114 | 2,231 | 18 | 19.6 | 49 | 37.7% | 9,344 |
| Region IV-A | 204 | 3,564 | 17 | 17.5 | 49 | 30.9% | 11,838 |
| Region I | 153 | 2,861 | 17 | 18.7 | 47 | 31.4% | 6,150 |
| Region II | 147 | 2,539 | 16 | 17.3 | 38 | 27.2% | 5,209 |
| Region X | 166 | 2,531 | 15 | 15.2 | 34 | 19.9% | 5,914 |
| CARAGA | 140 | 2,099 | 14 | 15 | 35 | 15.0% | 4,610 |
| Region XII | 150 | 2,155 | 14 | 14.4 | 40 | 18.0% | 6,146 |
| BARMM | 188 | 2,155 | 11 | 11.5 | 52 | 8.0% | 3,428 |
| NCR | 111 | 827 | 6 | 7.5 | 31 | 0.9% | 12,212 |
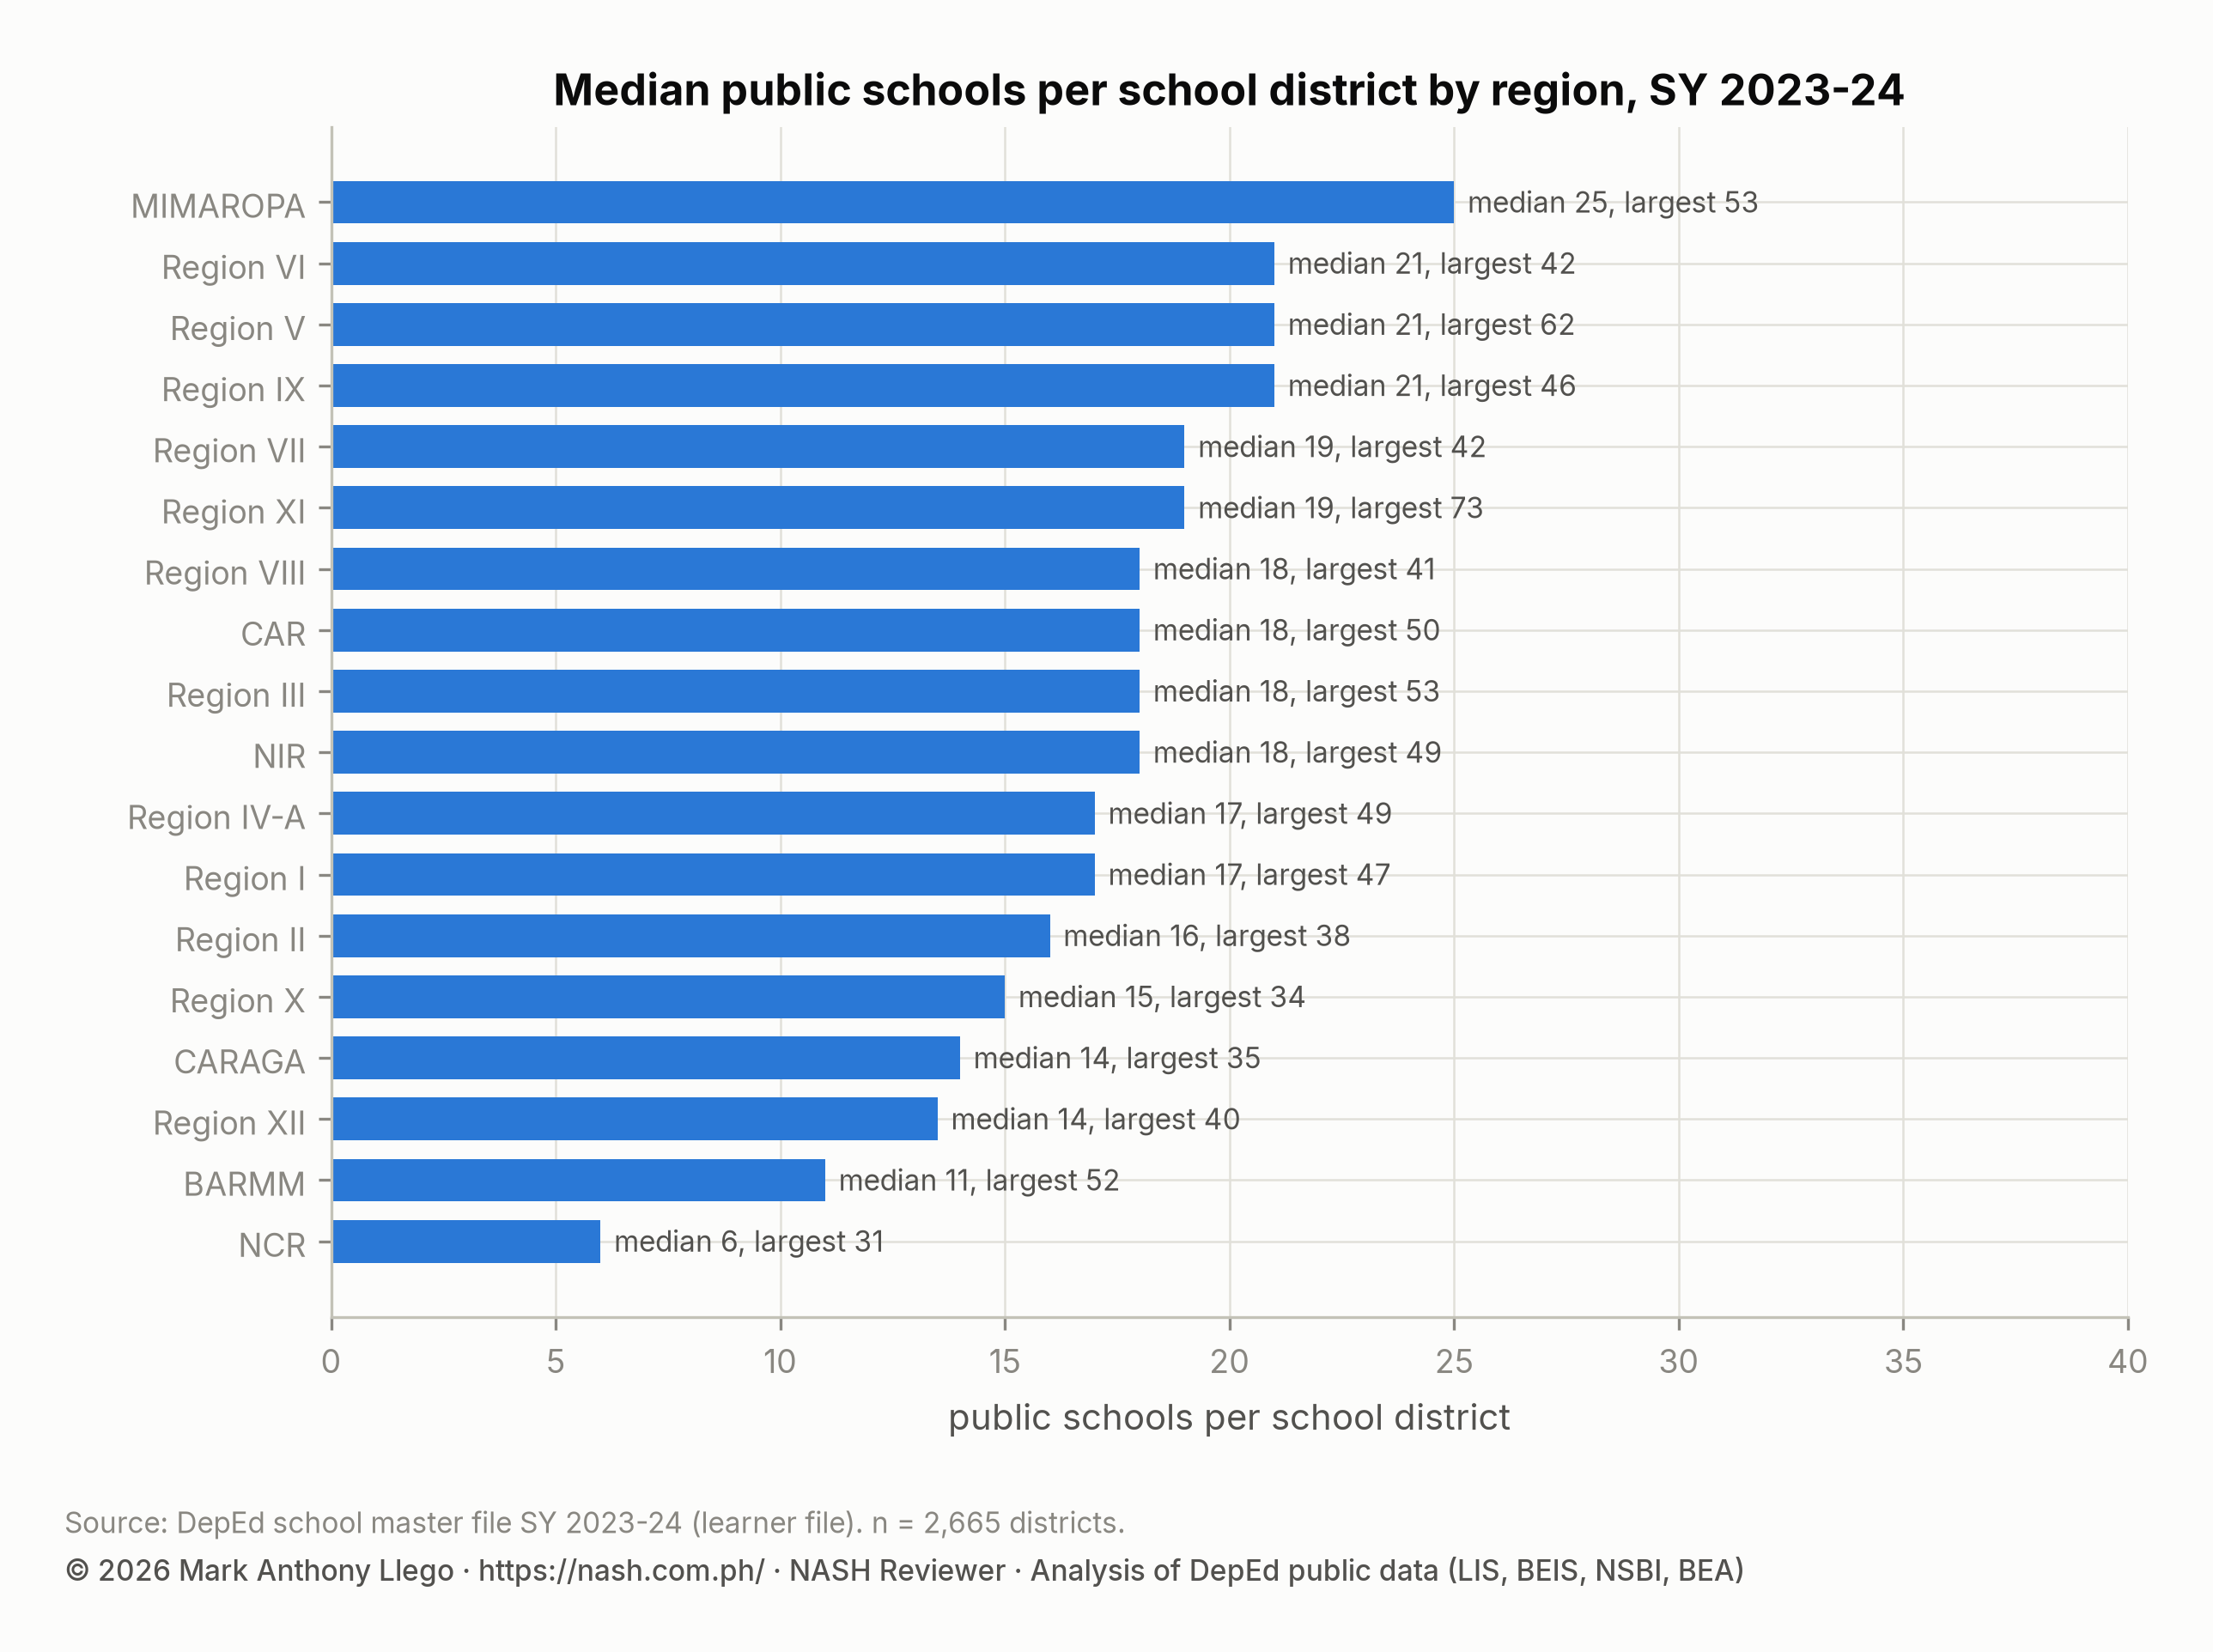
MIMAROPA’s districts are the largest, with a median of 25 schools, and 70.5% of them exceed 20. Region VI, Region V and Region IX have a median of 21, with more than half of their districts over the benchmark. At the other end, NCR’s districts have a median of six schools, and fewer than 1% exceed 20. Those six schools, however, hold a median of 12,212 learners, the most of any region. BARMM’s districts are small in both schools and learners, with a median of 11 schools and 3,428 learners. This reflects a region of small schools, which in SY 2023-2024 had the smallest median school size in the country.
Region VIII is a special case. It has 219 districts, the most of any region, with a median of 18 schools but a median of only 4,830 learners, because its schools are small. CAR’s 96 districts have the smallest median learner count, 2,652, across a median of 18 schools.
Public schools per division: the largest and the smallest
| Division | Region | Public schools | Learners | School districts | Schools per district | Learners per school |
|---|---|---|---|---|---|---|
| Leyte | Region VIII | 1,275 | 361,536 | 60 | 21.2 | 284 |
| Iloilo | Region VI | 1,172 | 452,809 | 52 | 22.5 | 386 |
| Cebu | Region VII | 1,135 | 566,292 | 55 | 20.6 | 499 |
| Bohol | Region VII | 1,115 | 284,471 | 52 | 21.4 | 255 |
| Camarines Sur | Region V | 1,097 | 449,266 | 38 | 28.9 | 410 |
| Quezon | Region IV-A | 958 | 443,054 | 43 | 22.3 | 462 |
| Isabela | Region II | 881 | 269,911 | 43 | 20.5 | 306 |
| Palawan | MIMAROPA | 821 | 257,926 | 35 | 23.5 | 314 |
| Cagayan | Region II | 807 | 240,902 | 49 | 16.5 | 299 |
| Zamboanga del Sur | Region IX | 807 | 198,886 | 32 | 25.2 | 246 |
| North Cotabato | Region XII | 777 | 285,500 | 51 | 15.2 | 367 |
| Zamboanga del Norte | Region IX | 759 | 220,095 | 35 | 21.7 | 290 |
| Nueva Ecija | Region III | 753 | 335,026 | 30 | 25.1 | 445 |
| Samar (Western Samar) | Region VIII | 738 | 136,718 | 29 | 25.4 | 185 |
| Batangas | Region IV-A | 737 | 363,448 | 34 | 21.7 | 493 |
The 228 divisions in the file have a median of 78 public schools, but the range is very wide. The 32 divisions with more than 500 public schools hold 48.9% of all public schools, and 62 divisions have fewer than 50. Leyte has 1,275 public schools in 60 districts, Iloilo 1,172 in 52 and Cebu 1,135 in 55. Bohol has 1,115 in 52 districts. Camarines Sur has 1,097 in 38 districts, which gives it the heaviest district load among the large divisions, 28.9 schools per district. The Final Report’s own figures, 1,363 schools for Leyte and 74 for Isabela City, count private schools as well. The public counts here are 1,275 and 64.
| Division | Region | Public schools | Learners | School districts | Schools per district | Learners per school |
|---|---|---|---|---|---|---|
| City of San Juan | NCR | 13 | 11,870 | 2 | 6.5 | 913 |
| Cavite City | Region IV-A | 14 | 19,706 | 3 | 4.7 | 1,408 |
| Vigan City | Region I | 21 | 14,633 | 3 | 7 | 697 |
| Balanga City | Region III | 22 | 25,871 | 2 | 11 | 1,176 |
| Makati City | NCR | 23 | 31,931 | 5 | 4.6 | 1,388 |
| Mandaluyong City | NCR | 24 | 54,834 | 2 | 12 | 2,285 |
| El Salvador | Region X | 24 | 13,176 | 2 | 12 | 549 |
| Dumaguete City | NIR | 25 | 25,727 | 3 | 8.3 | 1,029 |
| Tagbilaran City | Region VII | 25 | 21,114 | 1 | 25 | 845 |
| Navotas | NCR | 25 | 49,015 | 2 | 12.5 | 1,961 |
| Victorias City | NIR | 26 | 23,412 | 2 | 13 | 900 |
| Muntinlupa City | NCR | 27 | 86,503 | 2 | 13.5 | 3,204 |
| Batanes | Region II | 27 | 4,050 | 5 | 5.4 | 150 |
| Sta. Rosa City | Region IV-A | 28 | 66,619 | 3 | 9.3 | 2,379 |
| San Pedro City | Region IV-A | 28 | 53,973 | 1 | 28 | 1,928 |
The smallest divisions are cities. The City of San Juan has 13 public schools and 11,870 learners, and Cavite City has 14 schools. Makati City, after the transfer of its ten barangays to Taguig, has 23 schools and 31,931 learners. Several small divisions are small only in schools. Muntinlupa’s 27 public schools average 3,204 learners each, Sta. Rosa’s 28 average 2,379 and Navotas’s 25 average 1,961. Batanes has 27 schools and 4,050 learners. The ratio between the largest and smallest division is 98 to 1 in schools and 140 to 1 in learners.
Manila is an unusual case. It has 105 public schools in 39 districts, fewer than three schools per district, the remains of a district structure built when the city was denser. Quezon City has 159 schools in 20 districts and 441,283 learners, more than Leyte’s 361,536 in a twelfth as many schools.
The full table of all 228 divisions, with schools, learners, districts and the two ratios, is below.
| Division | Region | Public schools | Learners | School districts | Schools per district | Learners per school |
|---|---|---|---|---|---|---|
| Leyte | Region VIII | 1,275 | 361,536 | 60 | 21.2 | 284 |
| Iloilo | Region VI | 1,172 | 452,809 | 52 | 22.5 | 386 |
| Cebu | Region VII | 1,135 | 566,292 | 55 | 20.6 | 499 |
| Bohol | Region VII | 1,115 | 284,471 | 52 | 21.4 | 255 |
| Camarines Sur | Region V | 1,097 | 449,266 | 38 | 28.9 | 410 |
| Quezon | Region IV-A | 958 | 443,054 | 43 | 22.3 | 462 |
| Isabela | Region II | 881 | 269,911 | 43 | 20.5 | 306 |
| Palawan | MIMAROPA | 821 | 257,926 | 35 | 23.5 | 314 |
| Cagayan | Region II | 807 | 240,902 | 49 | 16.5 | 299 |
| Zamboanga del Sur | Region IX | 807 | 198,886 | 32 | 25.2 | 246 |
| North Cotabato | Region XII | 777 | 285,500 | 51 | 15.2 | 367 |
| Zamboanga del Norte | Region IX | 759 | 220,095 | 35 | 21.7 | 290 |
| Nueva Ecija | Region III | 753 | 335,026 | 30 | 25.1 | 445 |
| Samar (Western Samar) | Region VIII | 738 | 136,718 | 29 | 25.4 | 185 |
| Batangas | Region IV-A | 737 | 363,448 | 34 | 21.7 | 493 |
| Masbate | Region V | 700 | 225,060 | 32 | 21.9 | 322 |
| Pangasinan I, Lingayen | Region I | 661 | 312,422 | 31 | 21.3 | 473 |
| Bukidnon | Region X | 651 | 286,937 | 30 | 21.7 | 441 |
| Northern Samar | Region VIII | 607 | 170,264 | 36 | 16.9 | 281 |
| Negros Occidental | NIR | 576 | 302,300 | 31 | 18.6 | 525 |
| Pampanga | Region III | 565 | 338,501 | 33 | 17.1 | 599 |
| Pangasinan II, Binalonan | Region I | 559 | 244,455 | 32 | 17.5 | 437 |
| Albay | Region V | 555 | 223,687 | 25 | 22.2 | 403 |
| Oriental Mindoro | MIMAROPA | 540 | 180,202 | 18 | 30 | 334 |
| Bulacan | Region III | 540 | 489,966 | 25 | 21.6 | 907 |
| Antique | Region VI | 537 | 143,331 | 22 | 24.4 | 267 |
| Sorsogon | Region V | 531 | 176,244 | 20 | 26.6 | 332 |
| Agusan del Sur | CARAGA | 517 | 164,907 | 30 | 17.2 | 319 |
| Negros Oriental | NIR | 515 | 180,143 | 19 | 27.1 | 350 |
| Zamboanga Sibugay | Region IX | 507 | 167,561 | 16 | 31.7 | 330 |
| Ilocos Sur | Region I | 506 | 107,693 | 23 | 22 | 213 |
| Tarlac | Region III | 505 | 248,917 | 28 | 18 | 493 |
| Capiz | Region VI | 471 | 140,299 | 18 | 26.2 | 298 |
| Eastern Samar | Region VIII | 466 | 101,888 | 27 | 17.3 | 219 |
| Surigao del Sur | CARAGA | 452 | 124,678 | 24 | 18.8 | 276 |
| Sulu | Region IX | 447 | 144,392 | 20 | 22.4 | 323 |
| Davao City | Region XI | 435 | 381,042 | 20 | 21.8 | 876 |
| Benguet | CAR | 428 | 87,491 | 14 | 30.6 | 204 |
| Misamis Oriental | Region X | 422 | 191,509 | 23 | 18.3 | 454 |
| Davao De Oro | Region XI | 419 | 191,086 | 13 | 32.2 | 456 |
| Lanao del Sur - I | BARMM | 415 | 123,753 | 37 | 11.2 | 298 |
| Sultan Kudarat | Region XII | 403 | 162,322 | 28 | 14.4 | 403 |
| Lanao del Sur - II | BARMM | 392 | 103,731 | 35 | 11.2 | 265 |
| La Union | Region I | 386 | 135,650 | 22 | 17.5 | 351 |
| Lanao del Norte | Region X | 383 | 142,909 | 25 | 15.3 | 373 |
| South Cotabato | Region XII | 382 | 197,740 | 18 | 21.2 | 518 |
| Nueva Vizcaya | Region II | 382 | 110,731 | 23 | 16.6 | 290 |
| Aklan | Region VI | 379 | 128,626 | 19 | 19.9 | 339 |
| Ilocos Norte | Region I | 364 | 83,838 | 20 | 18.2 | 230 |
| Occidental Mindoro | MIMAROPA | 363 | 139,721 | 14 | 25.9 | 385 |
| Laguna | Region IV-A | 344 | 220,429 | 20 | 17.2 | 641 |
| Southern Leyte | Region VIII | 343 | 74,909 | 20 | 17.1 | 218 |
| Misamis Occidental | Region X | 337 | 68,613 | 17 | 19.8 | 204 |
| Maguindanao I | BARMM | 334 | 142,355 | 28 | 11.9 | 426 |
| Cavite | Region IV-A | 333 | 410,143 | 21 | 15.9 | 1,232 |
| Davao Oriental | Region XI | 331 | 112,555 | 16 | 20.7 | 340 |
| Sarangani | Region XII | 326 | 147,895 | 22 | 14.8 | 454 |
| Camarines Norte | Region V | 319 | 160,279 | 14 | 22.8 | 502 |
| Abra | CAR | 317 | 49,177 | 28 | 11.3 | 155 |
| Zambales | Region III | 315 | 145,719 | 15 | 21 | 463 |
| Maguindanao II | BARMM | 313 | 125,417 | 21 | 14.9 | 401 |
| Rizal | Region IV-A | 303 | 468,426 | 19 | 15.9 | 1,546 |
| Romblon | MIMAROPA | 270 | 78,338 | 13 | 20.8 | 290 |
| Catanduanes | Region V | 268 | 74,636 | 20 | 13.4 | 278 |
| Mt. Province | CAR | 267 | 34,620 | 12 | 22.2 | 130 |
| Ifugao | CAR | 266 | 42,532 | 12 | 22.2 | 160 |
| Tawi-Tawi | BARMM | 263 | 78,063 | 18 | 14.6 | 297 |
| Davao del Norte | Region XI | 263 | 122,908 | 10 | 26.3 | 467 |
| Davao del Sur | Region XI | 261 | 108,560 | 14 | 18.6 | 416 |
| Marinduque | MIMAROPA | 229 | 57,539 | 9 | 25.4 | 251 |
| Zamboanga City | Region IX | 217 | 241,967 | 12 | 18.1 | 1,115 |
| Davao Occidental | Region XI | 214 | 78,286 | 13 | 16.5 | 366 |
| Bataan | Region III | 214 | 161,873 | 12 | 17.8 | 756 |
| Agusan del Norte | CARAGA | 207 | 74,995 | 17 | 12.2 | 362 |
| Surigao del Norte | CARAGA | 202 | 65,416 | 13 | 15.5 | 324 |
| Apayao | CAR | 201 | 28,204 | 8 | 25.1 | 140 |
| Kalinga | CAR | 194 | 24,270 | 9 | 21.6 | 125 |
| Quirino | Region II | 187 | 47,705 | 8 | 23.4 | 255 |
| Basilan | BARMM | 177 | 55,448 | 10 | 17.7 | 313 |
| Aurora | Region III | 176 | 54,923 | 8 | 22 | 312 |
| Calbayog City | Region VIII | 174 | 48,581 | 10 | 17.4 | 279 |
| Quezon City | NCR | 159 | 441,283 | 20 | 8 | 2,775 |
| Siargao | CARAGA | 145 | 32,884 | 12 | 12.1 | 227 |
| Dinagat Island | CARAGA | 144 | 29,094 | 8 | 18 | 202 |
| Biliran | Region VIII | 143 | 49,041 | 9 | 15.9 | 343 |
| Butuan City | CARAGA | 139 | 91,708 | 13 | 10.7 | 660 |
| Guimaras | Region VI | 115 | 42,251 | 8 | 14.4 | 367 |
| Cagayan de Oro City | Region X | 115 | 142,584 | 10 | 11.5 | 1,240 |
| Iligan City | Region X | 112 | 82,417 | 13 | 8.6 | 736 |
| Special Geographic Area Division | BARMM | 111 | 39,115 | 17 | 6.5 | 352 |
| Batangas City | Region IV-A | 109 | 64,064 | 7 | 15.6 | 588 |
| Cebu City | Region VII | 107 | 182,742 | 16 | 6.7 | 1,708 |
| Manila | NCR | 105 | 264,082 | 39 | 2.7 | 2,515 |
| General Santos City | Region XII | 105 | 157,636 | 15 | 7 | 1,501 |
| Guihulngan City | NIR | 103 | 35,422 | 3 | 34.3 | 344 |
| Tabuk City | CAR | 103 | 28,473 | 10 | 10.3 | 276 |
| Puerto Princesa City | MIMAROPA | 101 | 71,019 | 3 | 33.7 | 703 |
| Bayawan City | NIR | 100 | 41,998 | 3 | 33.3 | 420 |
| Ormoc City | Region VIII | 98 | 55,220 | 6 | 16.3 | 563 |
| City of Ilagan | Region II | 98 | 34,895 | 6 | 16.3 | 356 |
| Tarlac City | Region III | 98 | 67,689 | 9 | 10.9 | 691 |
| Gingoog City | Region X | 97 | 35,580 | 10 | 9.7 | 367 |
| Tanjay City | NIR | 95 | 26,468 | 4 | 23.8 | 279 |
| Kabankalan City | NIR | 91 | 51,990 | 5 | 18.2 | 571 |
| Caloocan City | NCR | 89 | 271,479 | 7 | 12.7 | 3,050 |
| Surigao City | CARAGA | 87 | 32,540 | 8 | 10.9 | 374 |
| Lipa City | Region IV-A | 85 | 78,528 | 4 | 21.2 | 924 |
| Malaybalay City | Region X | 85 | 54,593 | 10 | 8.5 | 642 |
| Sorsogon City | Region V | 83 | 46,861 | 4 | 20.8 | 565 |
| Pagadian City | Region IX | 82 | 45,198 | 5 | 16.4 | 551 |
| Baybay City | Region VIII | 82 | 26,344 | 4 | 20.5 | 321 |
| Cauayan City | Region II | 80 | 34,504 | 5 | 16 | 431 |
| San Pablo City | Region IV-A | 80 | 60,679 | 7 | 11.4 | 758 |
| Siquijor | NIR | 78 | 20,690 | 5 | 15.6 | 265 |
| Maasin City | Region VIII | 77 | 15,601 | 4 | 19.2 | 203 |
| Kidapawan City | Region XII | 76 | 42,470 | 5 | 15.2 | 559 |
| San Carlos City | Region I | 76 | 46,314 | 4 | 19 | 609 |
| Island Garden City of Samal | Region XI | 75 | 29,592 | 3 | 25 | 395 |
| Mati City | Region XI | 72 | 39,561 | 3 | 24 | 549 |
| Calamba City | Region IV-A | 72 | 105,061 | 3 | 24 | 1,459 |
| Lapu-Lapu City | Region VII | 71 | 104,886 | 4 | 17.8 | 1,477 |
| Bayugan City | CARAGA | 70 | 27,519 | 5 | 14 | 393 |
| Valenzuela City | NCR | 70 | 131,253 | 4 | 17.5 | 1,875 |
| Bacolod City | NIR | 70 | 117,540 | 7 | 10 | 1,679 |
| Bislig City | CARAGA | 70 | 21,012 | 4 | 17.5 | 300 |
| Cadiz City | NIR | 69 | 41,302 | 4 | 17.2 | 599 |
| Baguio City | CAR | 68 | 63,437 | 3 | 22.7 | 933 |
| Antipolo City | Region IV-A | 67 | 182,005 | 7 | 9.6 | 2,716 |
| Ligao City | Region V | 67 | 34,358 | 3 | 22.3 | 513 |
| Iloilo City | Region VI | 66 | 79,280 | 7 | 9.4 | 1,201 |
| Sagay City | NIR | 66 | 39,468 | 3 | 22 | 598 |
| Camiguin | Region X | 66 | 23,010 | 4 | 16.5 | 349 |
| Cabanatuan City | Region III | 65 | 58,772 | 4 | 16.2 | 904 |
| San Carlos City | NIR | 65 | 31,056 | 5 | 13 | 478 |
| Valencia City | Region X | 65 | 51,623 | 7 | 9.3 | 794 |
| Tangub City | Region X | 65 | 17,731 | 4 | 16.2 | 273 |
| Urdaneta City | Region I | 64 | 32,363 | 2 | 32 | 506 |
| Isabela City | Region IX | 64 | 32,737 | 4 | 16 | 512 |
| Toledo City | Region VII | 62 | 52,927 | 4 | 15.5 | 854 |
| Taguig City and Pateros | NCR | 62 | 200,291 | 7 | 8.9 | 3,230 |
| Panabo City | Region XI | 62 | 49,251 | 3 | 20.7 | 794 |
| Dapitan City | Region IX | 61 | 21,465 | 5 | 12.2 | 352 |
| Danao City | Region VII | 61 | 35,973 | 4 | 15.2 | 590 |
| Tacloban City | Region VIII | 60 | 55,672 | 6 | 10 | 928 |
| Tanauan City | Region IV-A | 59 | 40,189 | 10 | 5.9 | 681 |
| San Jose City | Region III | 59 | 32,991 | 2 | 29.5 | 559 |
| Calapan City | MIMAROPA | 58 | 32,650 | 3 | 19.3 | 563 |
| Ozamis City | Region X | 58 | 32,228 | 5 | 11.6 | 556 |
| City of San Jose Del Monte | Region III | 58 | 130,809 | 2 | 29 | 2,255 |
| Catbalogan City | Region VIII | 58 | 27,944 | 5 | 11.6 | 482 |
| Borongan City | Region VIII | 58 | 18,098 | 3 | 19.3 | 312 |
| Malolos City | Region III | 57 | 44,508 | 2 | 28.5 | 781 |
| Bais City | NIR | 57 | 20,632 | 2 | 28.5 | 362 |
| Legaspi City | Region V | 56 | 44,637 | 4 | 14 | 797 |
| Lamitan City | BARMM | 55 | 22,737 | 5 | 11 | 413 |
| Koronadal City | Region XII | 55 | 45,128 | 6 | 9.2 | 821 |
| Mabalacat City | Region III | 55 | 51,991 | 3 | 18.3 | 945 |
| City of Naga, Cebu | Region VII | 55 | 31,494 | 3 | 18.3 | 573 |
| Lucena City | Region IV-A | 54 | 55,079 | 4 | 13.5 | 1,020 |
| Himamaylan City | NIR | 54 | 29,010 | 2 | 27 | 537 |
| Angeles City | Region III | 53 | 91,235 | 4 | 13.2 | 1,721 |
| Marawi City | BARMM | 51 | 24,641 | 9 | 5.7 | 483 |
| Oroquieta City | Region X | 51 | 16,302 | 6 | 8.5 | 320 |
| Iriga City | Region V | 50 | 25,589 | 3 | 16.7 | 512 |
| Tabaco City | Region V | 50 | 40,687 | 4 | 12.5 | 814 |
| Roxas City | Region VI | 50 | 32,424 | 3 | 16.7 | 648 |
| Carcar City | Region VII | 49 | 34,767 | 2 | 24.5 | 710 |
| Dipolog City | Region IX | 49 | 33,959 | 4 | 12.2 | 693 |
| Sipalay City | NIR | 48 | 21,152 | 2 | 24 | 441 |
| Mandaue City | Region VII | 48 | 67,334 | 4 | 12 | 1,403 |
| Digos City | Region XI | 47 | 42,184 | 3 | 15.7 | 898 |
| Bago City | NIR | 47 | 37,654 | 4 | 11.8 | 801 |
| Alaminos City | Region I | 46 | 23,029 | 3 | 15.3 | 501 |
| San Fernando City | Region III | 46 | 65,885 | 3 | 15.3 | 1,432 |
| Passi City | Region VI | 45 | 21,694 | 2 | 22.5 | 482 |
| Dasmarinas City | Region IV-A | 44 | 124,135 | 2 | 22 | 2,821 |
| Pasig City | NCR | 44 | 147,118 | 5 | 8.8 | 3,344 |
| Cotabato City | BARMM | 44 | 53,762 | 8 | 5.5 | 1,222 |
| Talisay City | Region VII | 44 | 54,750 | 3 | 14.7 | 1,244 |
| Masbate City | Region V | 44 | 29,610 | 4 | 11 | 673 |
| Bacoor City | Region IV-A | 43 | 87,734 | 2 | 21.5 | 2,040 |
| Paranaque City | NCR | 43 | 103,566 | 3 | 14.3 | 2,409 |
| Malabon City | NCR | 42 | 70,597 | 5 | 8.4 | 1,681 |
| Naga City | Region V | 42 | 50,415 | 4 | 10.5 | 1,200 |
| Escalante City | NIR | 41 | 25,882 | 2 | 20.5 | 631 |
| Santiago City | Region II | 41 | 32,034 | 4 | 10.2 | 781 |
| Gapan City | Region III | 41 | 29,527 | 2 | 20.5 | 720 |
| Binan City | Region IV-A | 40 | 63,316 | 1 | 40 | 1,583 |
| Olongapo City | Region III | 40 | 48,459 | 4 | 10 | 1,211 |
| Tagum City | Region XI | 39 | 63,753 | 3 | 13 | 1,635 |
| Laoag City | Region I | 39 | 21,603 | 3 | 13 | 554 |
| Dagupan City | Region I | 39 | 36,656 | 4 | 9.8 | 940 |
| Silay City | NIR | 39 | 29,543 | 4 | 9.8 | 758 |
| Las Piñas City | NCR | 39 | 94,633 | 2 | 19.5 | 2,426 |
| Bogo City | Region VII | 38 | 19,712 | 3 | 12.7 | 519 |
| Tuguegarao City | Region II | 36 | 34,610 | 4 | 9 | 961 |
| General Trias City | Region IV-A | 36 | 82,309 | 2 | 18 | 2,286 |
| Science City of Muñoz | Region III | 36 | 19,497 | 1 | 36 | 542 |
| Canlaon City | NIR | 36 | 14,542 | 1 | 36 | 404 |
| Cabadbaran City | CARAGA | 35 | 19,273 | 4 | 8.8 | 551 |
| Imus City | Region IV-A | 35 | 80,364 | 2 | 17.5 | 2,296 |
| Tayabas City | Region IV-A | 35 | 22,469 | 2 | 17.5 | 642 |
| Candon City | Region I | 34 | 12,563 | 2 | 17 | 370 |
| San Fernando City | Region I | 33 | 20,816 | 2 | 16.5 | 631 |
| Marikina City | NCR | 33 | 78,016 | 2 | 16.5 | 2,364 |
| Batac City | Region I | 33 | 9,127 | 2 | 16.5 | 277 |
| Sto. Tomas City | Region IV-A | 31 | 35,722 | 2 | 15.5 | 1,152 |
| Meycauayan City | Region III | 31 | 36,451 | 2 | 15.5 | 1,176 |
| Tandag City | CARAGA | 31 | 16,470 | 2 | 15.5 | 531 |
| Tacurong City | Region XII | 31 | 23,414 | 5 | 6.2 | 755 |
| La Carlota City | NIR | 30 | 18,402 | 3 | 10 | 613 |
| Pasay City | NCR | 29 | 65,514 | 4 | 7.2 | 2,259 |
| Cabuyao City | Region IV-A | 29 | 60,750 | 5 | 5.8 | 2,095 |
| San Pedro City | Region IV-A | 28 | 53,973 | 1 | 28 | 1,928 |
| Sta. Rosa City | Region IV-A | 28 | 66,619 | 3 | 9.3 | 2,379 |
| Batanes | Region II | 27 | 4,050 | 5 | 5.4 | 150 |
| Muntinlupa City | NCR | 27 | 86,503 | 2 | 13.5 | 3,204 |
| Victorias City | NIR | 26 | 23,412 | 2 | 13 | 900 |
| Navotas | NCR | 25 | 49,015 | 2 | 12.5 | 1,961 |
| Dumaguete City | NIR | 25 | 25,727 | 3 | 8.3 | 1,029 |
| Tagbilaran City | Region VII | 25 | 21,114 | 1 | 25 | 845 |
| Mandaluyong City | NCR | 24 | 54,834 | 2 | 12 | 2,285 |
| El Salvador | Region X | 24 | 13,176 | 2 | 12 | 549 |
| Makati City | NCR | 23 | 31,931 | 5 | 4.6 | 1,388 |
| Balanga City | Region III | 22 | 25,871 | 2 | 11 | 1,176 |
| Vigan City | Region I | 21 | 14,633 | 3 | 7 | 697 |
| Cavite City | Region IV-A | 14 | 19,706 | 3 | 4.7 | 1,408 |
| City of San Juan | NCR | 13 | 11,870 | 2 | 6.5 | 913 |
What the file cannot say
- The district is recorded as a label on each school. The file does not say how many supervisor positions a district has, whether a position is filled, or whether some labels are clusters rather than districts. The personnel file counts positions in schools, not in district or division offices.
- Private schools are excluded here. District supervisors have some responsibilities toward private schools in their area, which would add to the loads shown.
- The 20-school benchmark is a general guide for effective monitoring, not a DepEd standard. Terrain, distance and school size change what any number of schools means in practice.
What this means for school heads
Your district supervisor is the first official above you in DepEd’s line of supervision. That person signs off on your plans, observes your school and is expected to coach you. In half of the country’s public schools, that person has more than 20 schools to cover, and in the districts of Mindanao’s and MIMAROPA’s provinces, 40 or more. A school head in such a district should expect fewer visits and should bring the district the evidence it cannot gather itself. That evidence is the School Improvement Plan and the monitoring data that the Philippine Professional Standards for School Heads (PPSSH) asks for under strand 1.7. It is also the working relationship with “authorities, colleagues, parents and other stakeholders” that strand 5.1 describes.
The National Education Plan’s Recommendation 6.2.1 asks for more division offices in large jurisdictions. Its Recommendation 6.1.2.d asks for training of district supervisors by the National Educators Academy of the Philippines (NEAP). The Final Report’s call for staffing differentiated by workload is the policy response to the table above. The EDCOM II guide for aspiring school heads covers the governance chapter these come from.
Frequently asked questions
How many schools does a DepEd district supervisor oversee?
A median of 17 public schools in SY 2023-2024, across 2,665 school districts. A third of districts have more than 20 schools, and those districts hold 51.9% of public schools. 45 districts have more than 40.
Which DepEd schools division has the most public schools?
Leyte has the most, with 1,275 public schools in 60 districts. Iloilo (1,172), Cebu (1,135), Bohol (1,115) and Camarines Sur (1,097) follow. The City of San Juan has the fewest, 13.
Which DepEd region has the largest school districts?
MIMAROPA has the largest, with a median of 25 public schools per district and 70.5% of districts above 20. NCR has the smallest, a median of six schools, but the most learners per district.
Download the data
The cleaned, harmonized DepEd files behind this series are free to download in CSV and Parquet, with a codebook and checksums, under the terms of use set out in the release. Download Cleaned DepEd School Data, SY 2017-18 to 2025-26 documents every file and column. The files themselves are at data.nash.com.ph, starting with the README, the SY 2023-24 school master file (CSV, 8.0 MB) and the nine-year enrollment panel (Parquet, 17.2 MB).
More in this series
- DepEd Teachers and School Personnel Data, SY 2023-2024
- DepEd Learner Data SY 2023-2024: IP, ALIVE and School Size
- EDCOM II Final Report: Guide for Aspiring School Heads
- National Education Plan 2026-2035: Guide for School Heads
- DepEd Data for Aspiring School Heads: Where to Start
- For aspiring school heads: PPSSH Domain 1 Through the Data and the full report, Philippine basic education in numbers
Analysis and charts by Mark Anthony Llego for NASH Reviewer. Data: Department of Education learner and personnel datasets SY 2023-24 (public datasets). Charts may be reused only with written permission from support@nash.com.ph.