DepEd’s SY 2023-2024 school personnel dataset shows how many teachers public schools have, at what ranks, who pays for them, and which schools have a principal or head teacher position. It covers the 47,814 public schools with learners. Nationally, 909,348 teachers served 23.2 million learners, or 25.5 learners per teacher.
For every public school, the dataset lists nationally funded teacher positions by plantilla title, from Teacher I to Master Teacher IV, plus SPED and Special Science teachers. It also lists principal and head teacher positions, other teaching-related and non-teaching staff, and locally funded teachers by funding source.
Two numbers matter most for aspiring school heads. 28.5% of public schools have no principal or head teacher position in the file. The pupil-teacher ratio a school head is held to is also the regional aggregate, not the median school’s. The companion report, Philippine basic education in numbers, holds the method notes.
Key findings
- 909,348 teachers served 23.2 million public-school learners: 25.5 learners per teacher by DepEd’s definition (total learners over total teachers). The median school has 22.7. The ratio ranges from 19.4 in CAR to 30.0 in BARMM.
- Public schools have 881,433 nationally funded teacher and master teacher positions. 91% of elementary positions and 92% of junior high positions are Teacher I to III. Master teachers are 7.6% of nationally funded teachers, from 2.6% in BARMM to 9.5% in Region VIII.
- Senior high school has a different rank structure. 60.8% of its positions are Teacher II, because the 2016 rollout created them at that rank.
- Locally funded teachers are 2.0% of the teaching force nationally but 12.6% in BARMM, where local governments fill the gap.
- 13,605 public schools (28.5%) have no principal or head teacher position. The share of schools with one runs from 36.9% in BARMM to 91.5% in NCR.
Pupil-teacher ratio in public schools by region
DepEd’s technical notes define the teacher-learner ratio as total enrollment divided by the total number of teachers, with annex schools counted under their mother school. Computed that way across the 47,674 public schools with at least one teacher, the national ratio is 25.5. The median school’s own ratio is lower, at 22.7. The difference arises because the large urban schools that hold most learners are the crowded ones: half of all public school learners attend the 11% of schools with more than 1,000 learners.
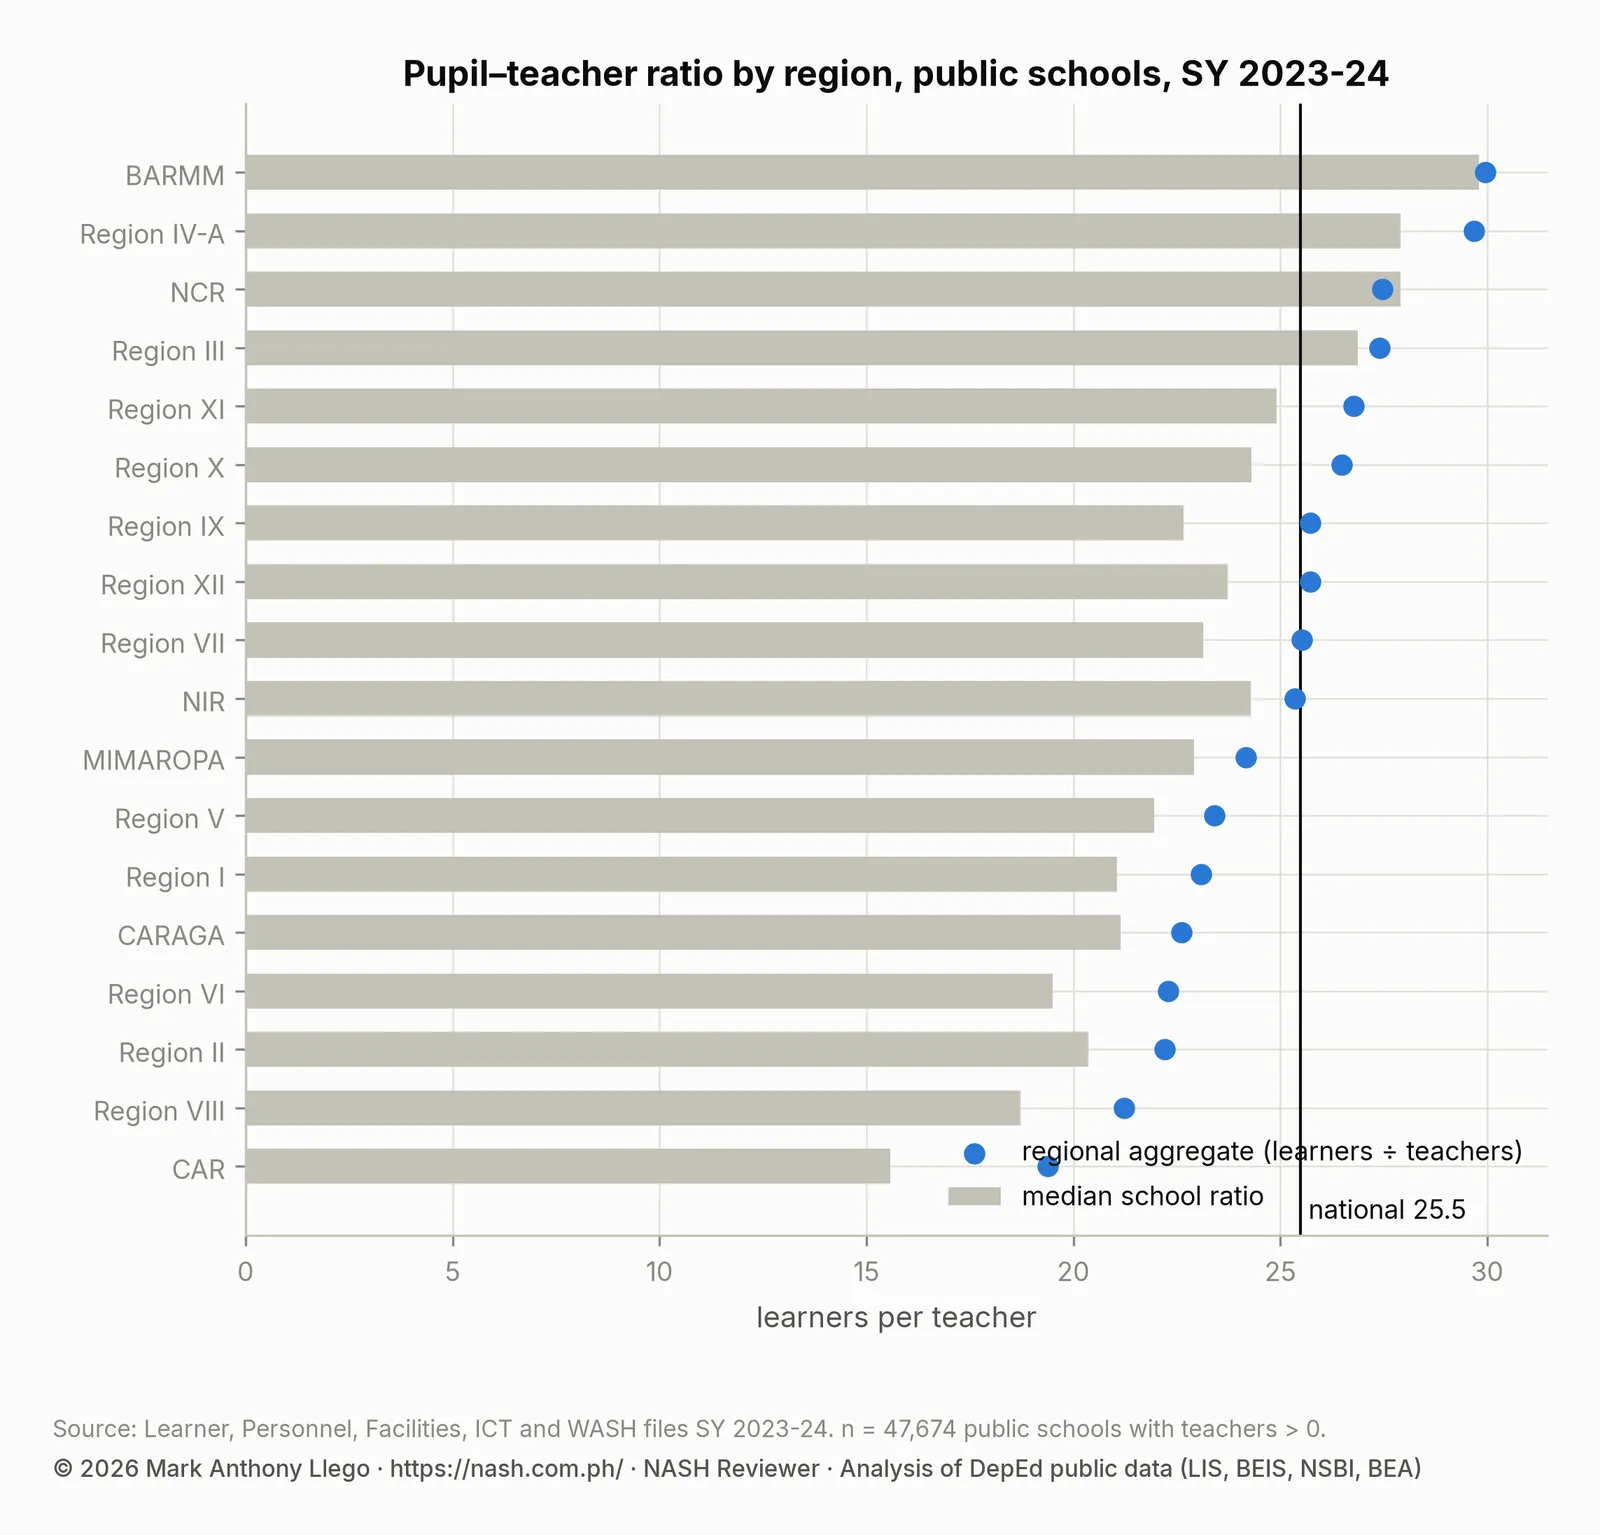
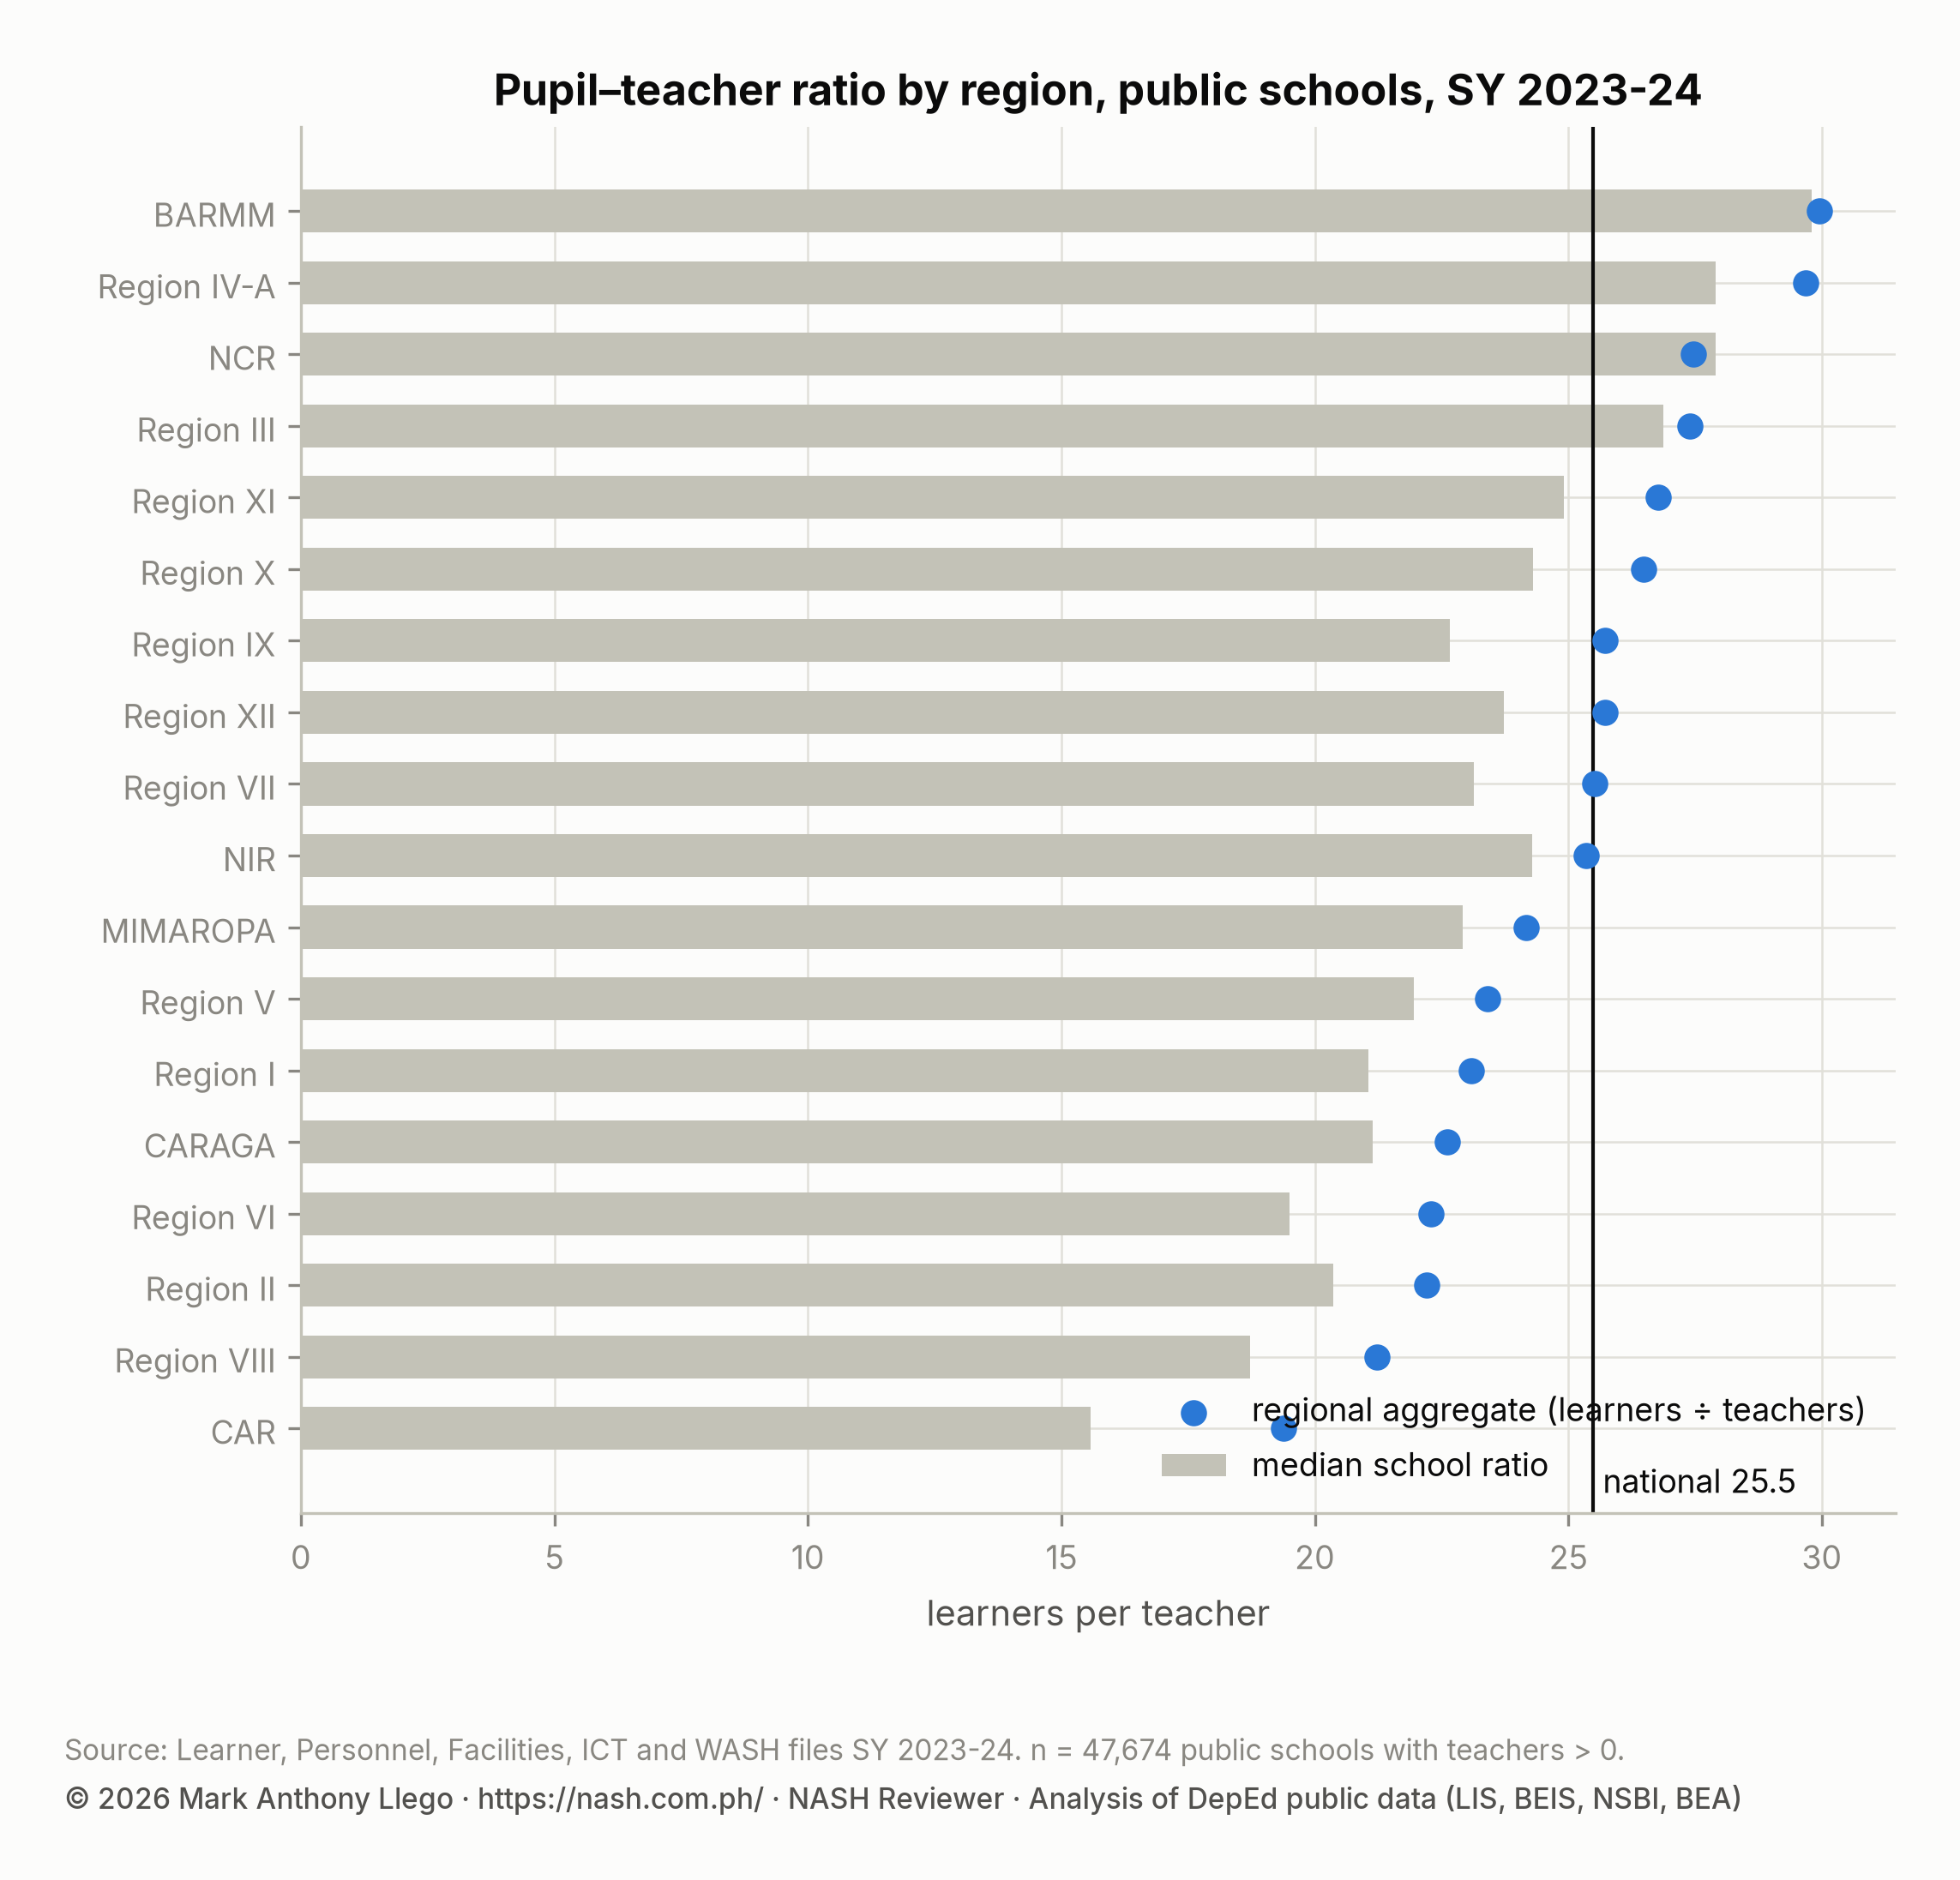
BARMM (30.0), Region IV-A (29.7), NCR (27.5) and Region III (27.4) are above the national figure. CAR (19.4), Region VIII (21.2), Region II (22.2) and Region VI (22.3) are the best staffed. The gap between a region’s aggregate and its median school is widest in NCR and Region IV-A, where a few very large schools raise the aggregate.
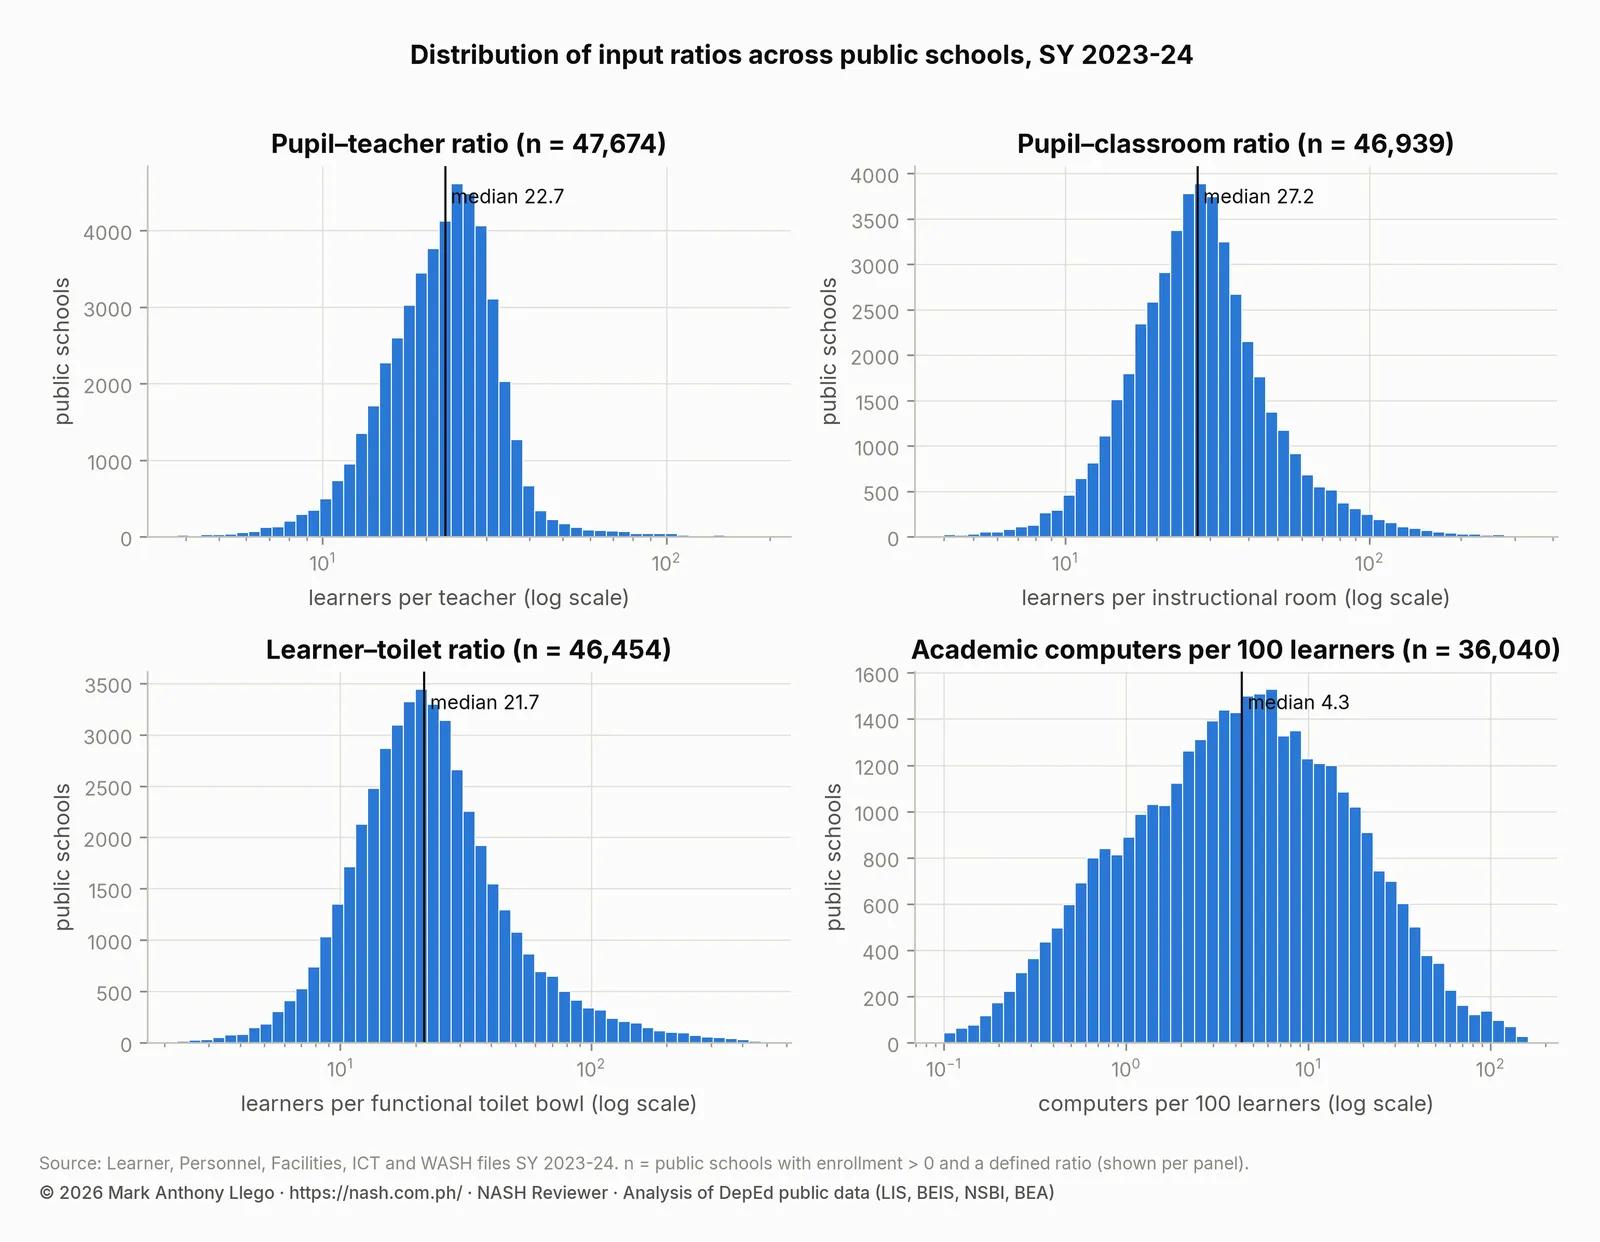
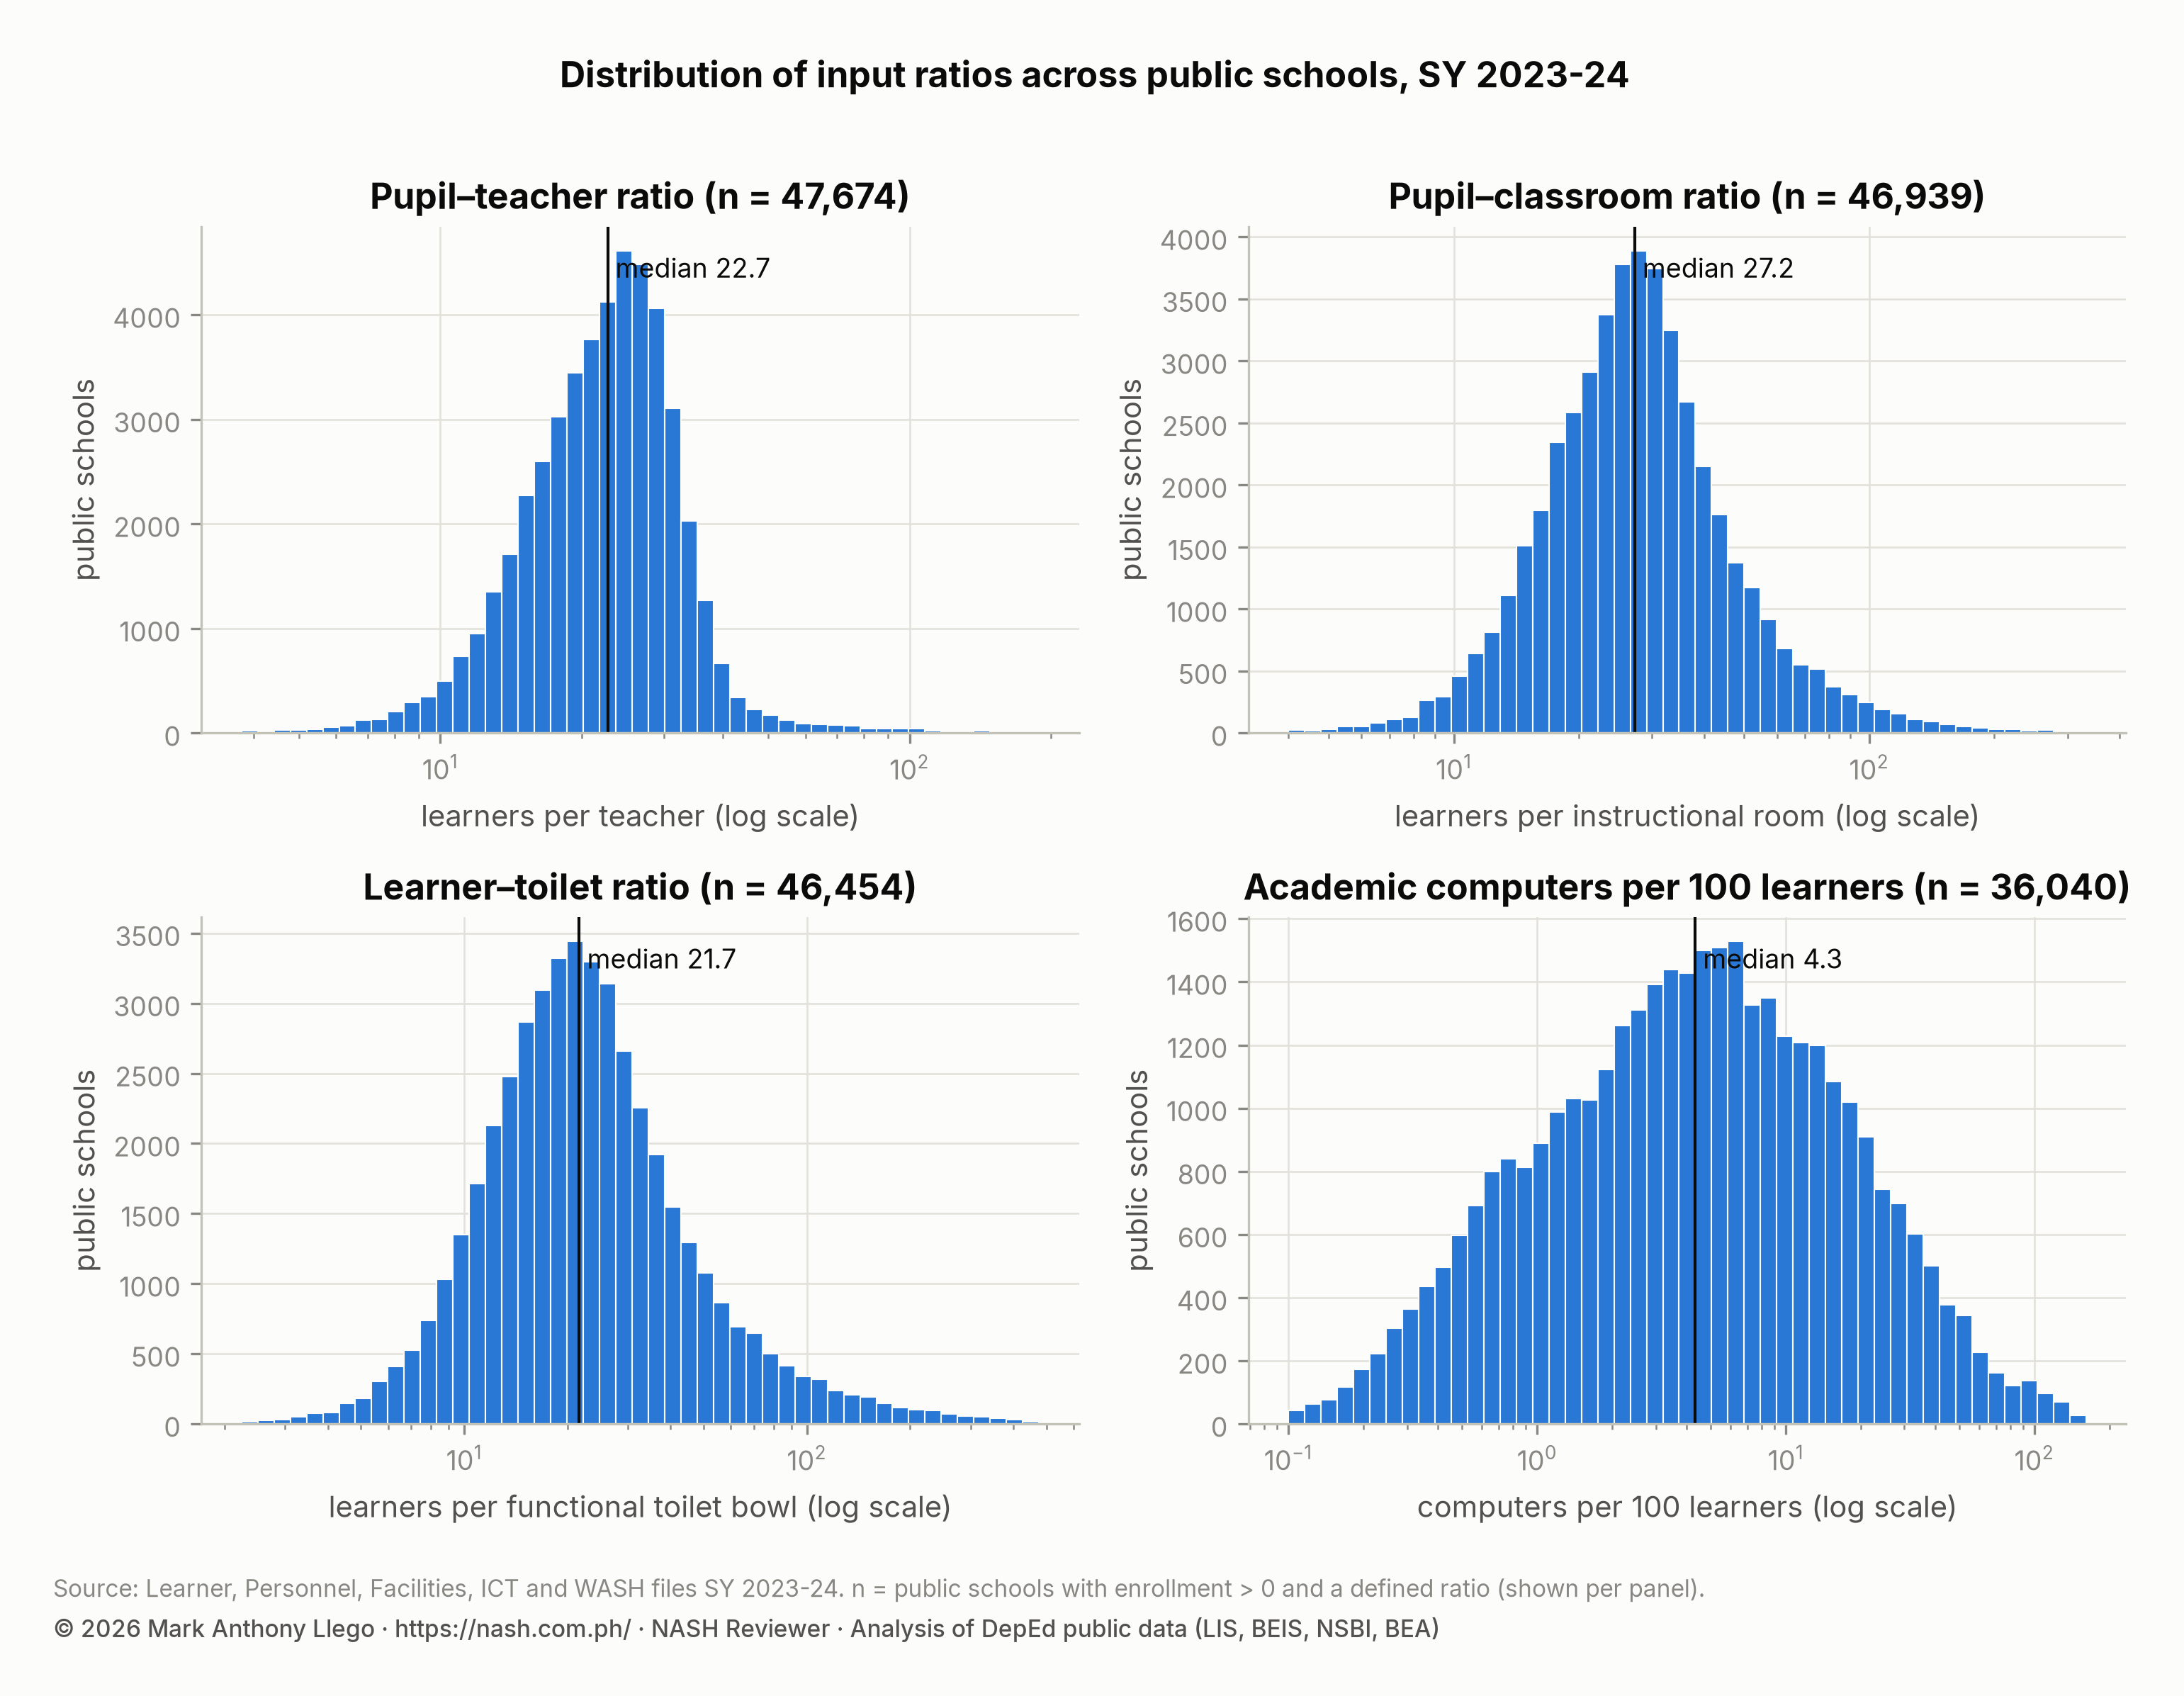
Across schools, the ratio is roughly symmetric on a log scale. 5% of schools have fewer than 11.3 learners per teacher, and 5% have more than 37.6. 139 public schools report learners but no teachers at all; their ratio is undefined, so they are excluded. Another 7 report more teachers than learners. The DepEd open data quality audit flags both groups as data errors.
| Region | Public schools | Learners | Learners per teacher | Median school | Learners per classroom | Learners per toilet bowl | Computers per 100 learners | ES learners with internet |
|---|---|---|---|---|---|---|---|---|
| BARMM | 2,155 | 769,022 | 30 | 29.8 | 46.4 | 50.5 | 3.1 | 80% |
| Region IV-A | 3,564 | 3,188,202 | 29.7 | 27.9 | 45.1 | 33.7 | 6.9 | 96% |
| NCR | 827 | 2,101,985 | 27.5 | 27.9 | 55.1 | 47.6 | 9.3 | 97% |
| Region III | 3,729 | 2,478,610 | 27.4 | 26.9 | 36 | 27.7 | 6.3 | 98% |
| Region XI | 2,218 | 1,218,778 | 26.8 | 24.9 | 36.3 | 29.5 | 6.8 | 85% |
| Region X | 2,531 | 1,159,212 | 26.5 | 24.3 | 36.2 | 25.5 | 5.5 | 83% |
| Region IX | 2,993 | 1,106,260 | 25.7 | 22.7 | 34 | 30.3 | 5.6 | 73% |
| Region XII | 2,155 | 1,062,105 | 25.7 | 23.7 | 36.7 | 25.8 | 5.9 | 83% |
| Region VII | 2,810 | 1,456,462 | 25.5 | 23.1 | 36.5 | 32 | 5.2 | 91% |
| NIR | 2,231 | 1,134,333 | 25.4 | 24.3 | 32.4 | 26.8 | 5.7 | 83% |
| MIMAROPA | 2,382 | 817,395 | 24.2 | 22.9 | 30.8 | 22.3 | 8 | 74% |
| Region V | 3,862 | 1,581,329 | 23.4 | 21.9 | 31.2 | 24.6 | 4.4 | 74% |
| Region I | 2,861 | 1,101,162 | 23.1 | 21.1 | 28 | 20 | 10.4 | 96% |
| CARAGA | 2,099 | 700,496 | 22.6 | 21.1 | 30.6 | 22.9 | 10.1 | 89% |
| Region VI | 2,835 | 1,040,714 | 22.3 | 19.5 | 27.3 | 20.4 | 5.1 | 84% |
| Region II | 2,539 | 809,342 | 22.2 | 20.4 | 27.5 | 19.2 | 6.6 | 94% |
| Region VIII | 4,179 | 1,141,816 | 21.2 | 18.7 | 26.9 | 22.1 | 6 | 80% |
| CAR | 1,844 | 358,204 | 19.4 | 15.6 | 24.1 | 20 | 11.5 | 81% |
Teacher ranks from Teacher I to Master Teacher IV
Of the 881,433 nationally funded teacher and master teacher positions, elementary schools hold 508,775, junior high 291,229 and senior high 81,429. Most positions are at the lowest ranks, and very few are at the highest.
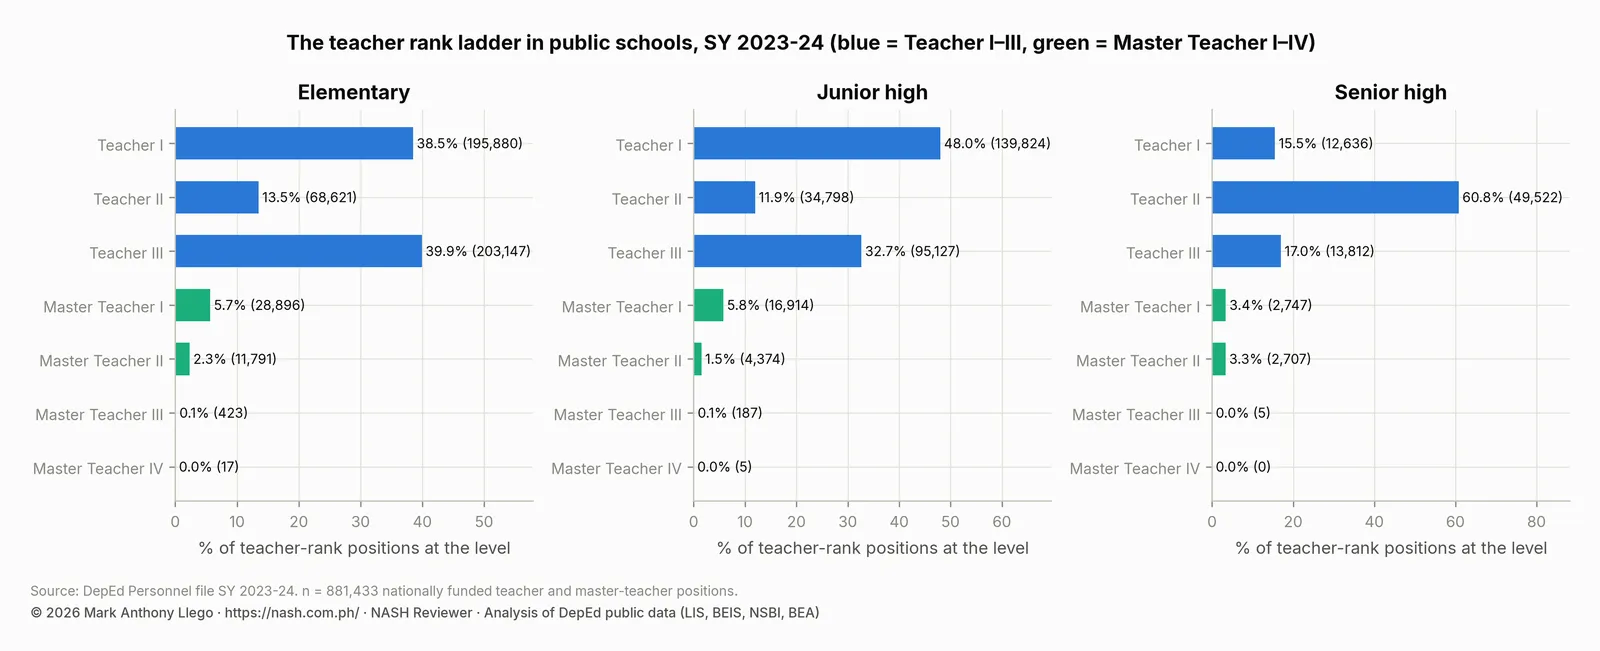
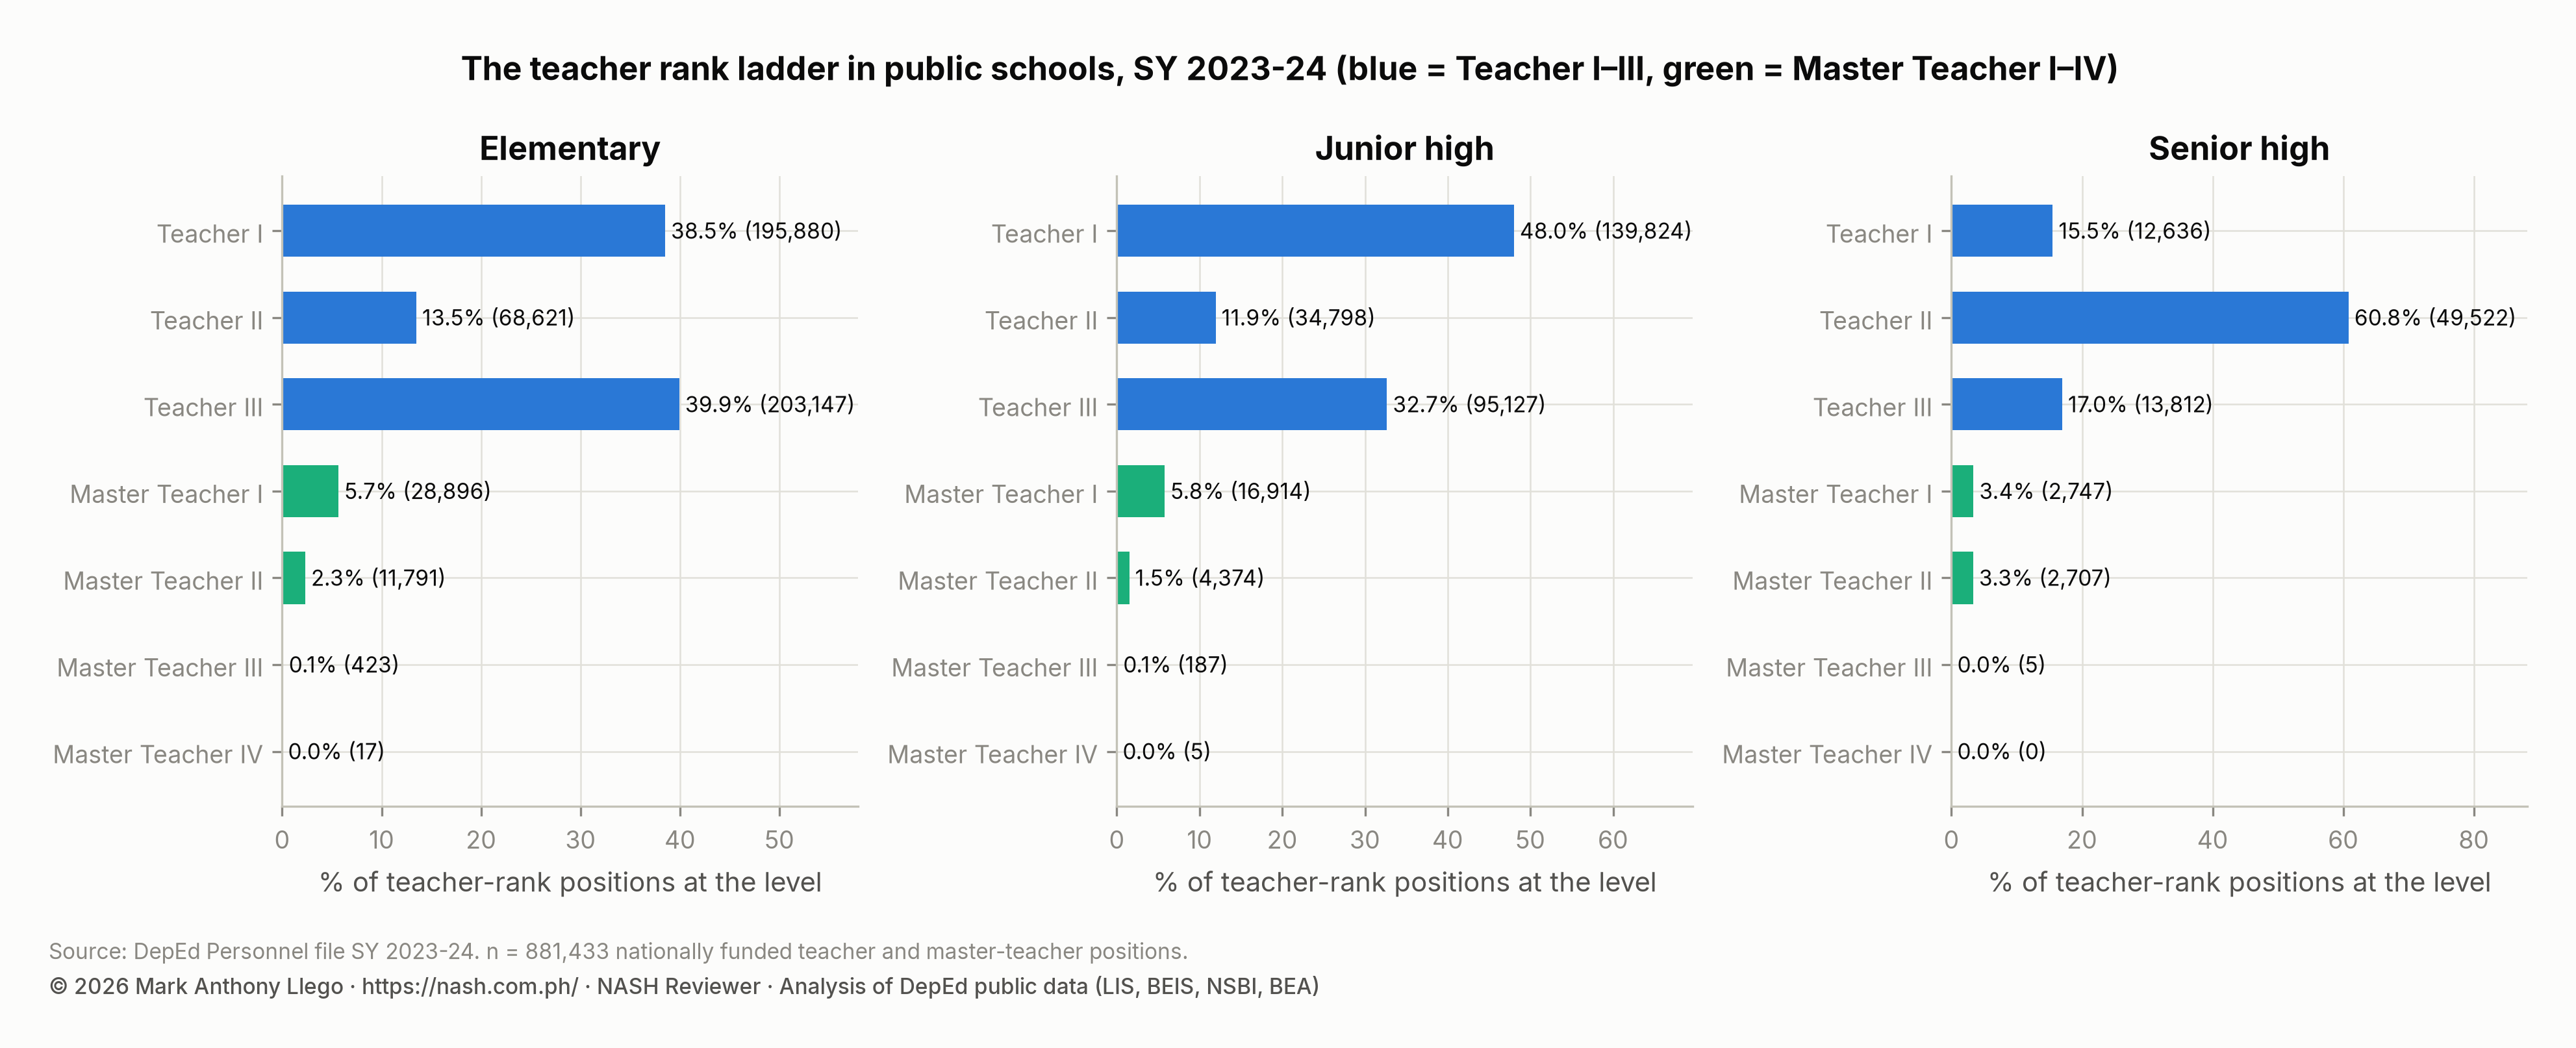
In elementary schools, Teacher I (38.5%) and Teacher III (39.9%) are the two large groups, with Teacher II (13.5%) between them. Master Teacher I is 5.7% and Master Teacher II is 2.3%. Master Teacher III and IV together hold 440 positions in elementary schools.
Junior high school has more positions at the entry rank: 48.0% are Teacher I. Senior high school is different again. 60.8% of its positions are Teacher II, because the Grade 11 and 12 positions created at the 2016 rollout were set at that rank. It has 5,459 master teachers, 6.7% of its teacher-rank positions, and no Master Teacher IV.
| Position | Elementary | Junior high | Senior high |
|---|---|---|---|
| Teacher I | 195,880 (38.5%) | 139,824 (48.0%) | 12,636 (15.5%) |
| Teacher II | 68,621 (13.5%) | 34,798 (11.9%) | 49,522 (60.8%) |
| Teacher III | 203,147 (39.9%) | 95,127 (32.7%) | 13,812 (17.0%) |
| Master Teacher I | 28,896 (5.7%) | 16,914 (5.8%) | 2,747 (3.4%) |
| Master Teacher II | 11,791 (2.3%) | 4,374 (1.5%) | 2,707 (3.3%) |
| Master Teacher III | 423 (0.1%) | 187 (0.1%) | 5 (0.0%) |
| Master Teacher IV | 17 (0.0%) | 5 (0.0%) | 0 (0.0%) |
Other position groups are small. SPED and SNED teachers are 1% of elementary positions (4,932) and 0.2% of junior high positions (491). Special Science teachers are 4.5% of senior high positions (3,819) and 0.1% of junior high positions.
| Level | Position group | Positions | Share within level |
|---|---|---|---|
| ES | Teacher | 467,648 | 91.0% |
| ES | Master Teacher | 41,127 | 8.0% |
| ES | SPED/Sned Teacher | 4,932 | 1.0% |
| JHS | Teacher | 269,749 | 92.4% |
| JHS | Master Teacher | 21,480 | 7.4% |
| JHS | SPED Teacher | 491 | 0.2% |
| JHS | Special Science Teacher | 325 | 0.1% |
| JHS | Instructor | 20 | 0.0% |
| SHS | Teacher | 75,970 | 89.1% |
| SHS | Master Teacher | 5,459 | 6.4% |
| SHS | Special Science Teacher | 3,819 | 4.5% |
Master teachers and locally funded teachers by region
Master teachers hold the positions meant to lead instruction. They are 7.6% of nationally funded teachers nationally. Region VIII (9.5%), NCR (9.4%), Region XI (8.9%), Region I (8.8%) and CAR (8.6%) have the highest shares. BARMM (2.6%) has a third of the national rate.
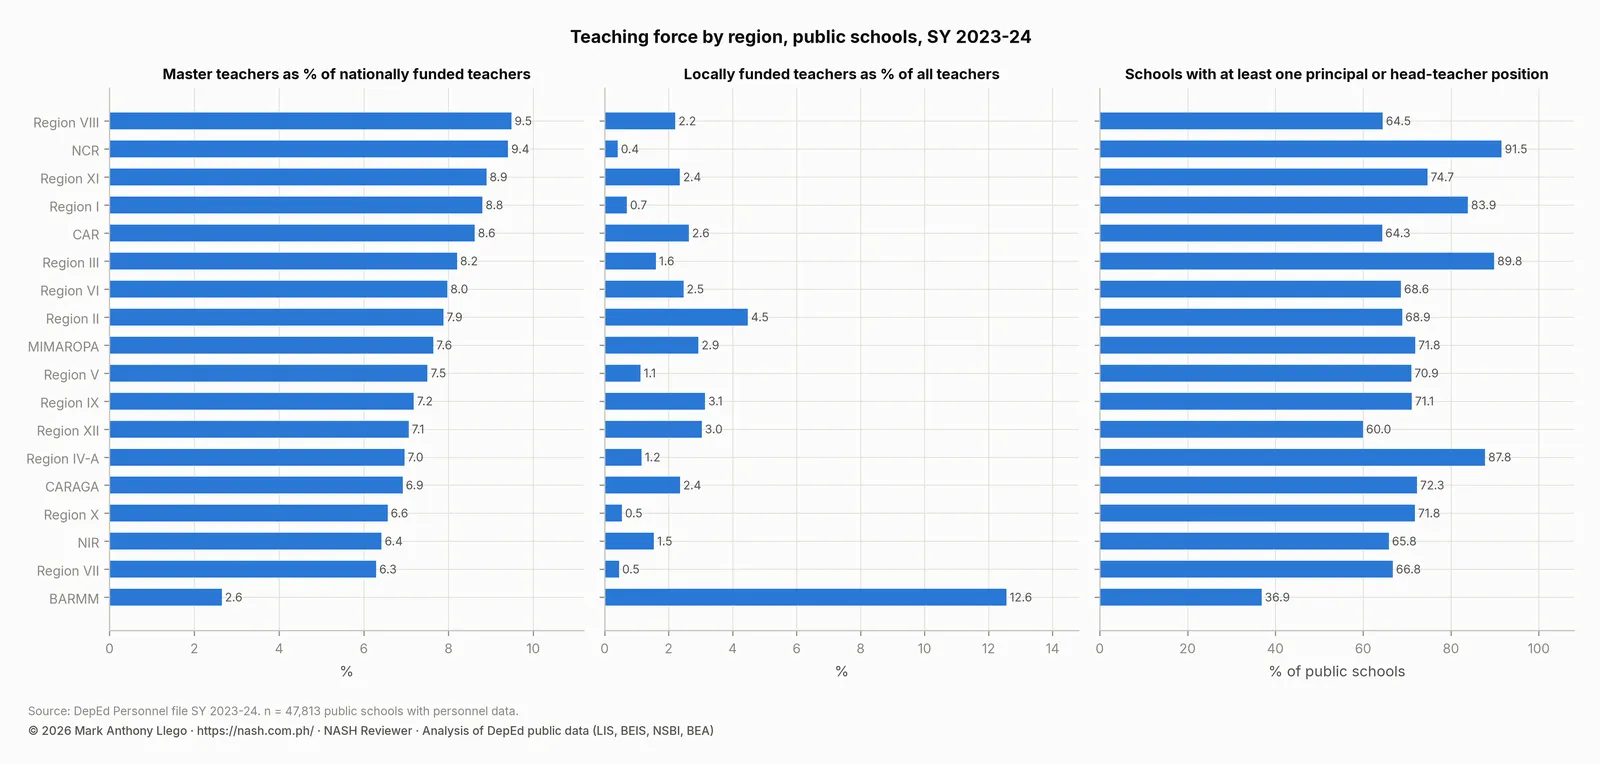
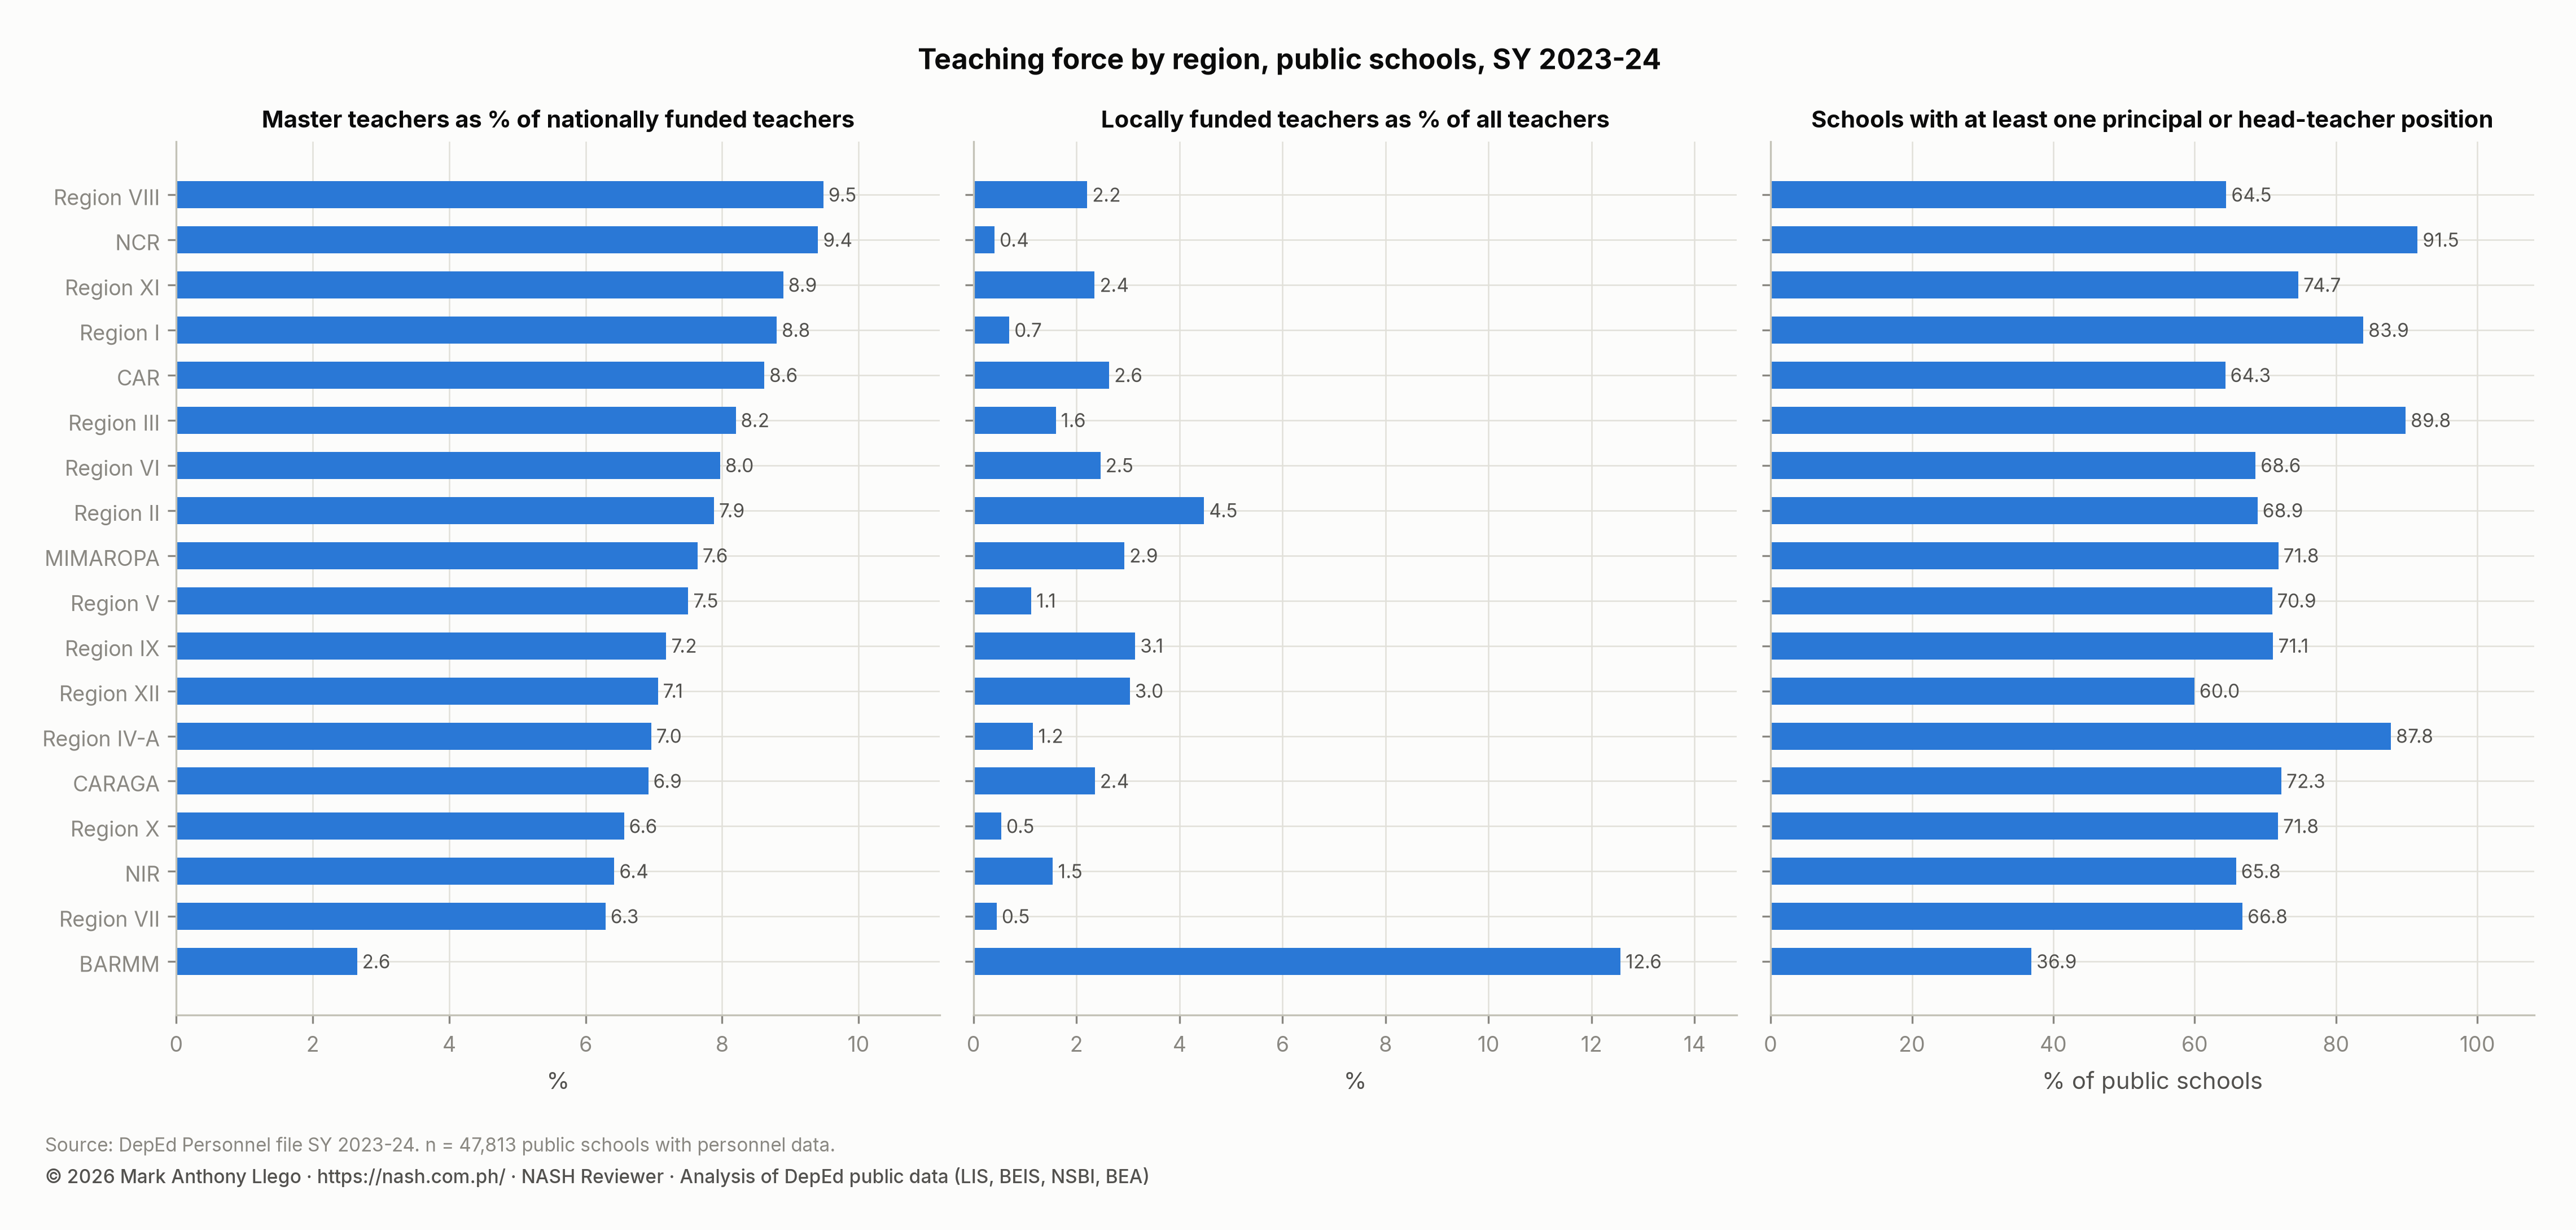
Locally funded teachers are paid from provincial or municipal Special Education Funds (SEF), local government budgets or other sources. They are 2.0% of the teaching force. BARMM is the exception at 12.6%, followed by Region II (4.5%), Region IX (3.1%) and Region XII (3.0%). NCR (0.4%) and Region VII (0.5%) have almost none. Where national positions are short, local governments pay for teachers.
| Region | Teachers | Learners per teacher | Median teachers per school | Master teachers (% of national positions) | Locally funded teachers (% of all) | Schools with a principal or head-teacher position | Schools without one |
|---|---|---|---|---|---|---|---|
| BARMM | 25,599 | 30 | 9 | 2.6% | 12.6% | 36.9% | 1,360 |
| CAR | 18,447 | 19.4 | 7 | 8.6% | 2.6% | 64.3% | 658 |
| CARAGA | 30,897 | 22.6 | 8 | 6.9% | 2.4% | 72.3% | 582 |
| MIMAROPA | 33,752 | 24.2 | 8 | 7.6% | 2.9% | 71.8% | 671 |
| NCR | 76,233 | 27.5 | 71 | 9.4% | 0.4% | 91.5% | 70 |
| NIR | 44,612 | 25.4 | 11 | 6.4% | 1.5% | 65.8% | 762 |
| Region I | 47,692 | 23.1 | 10 | 8.8% | 0.7% | 83.9% | 462 |
| Region II | 36,451 | 22.2 | 8 | 7.9% | 4.5% | 68.9% | 790 |
| Region III | 90,361 | 27.4 | 14 | 8.2% | 1.6% | 89.8% | 379 |
| Region IV-A | 107,120 | 29.7 | 15 | 7.0% | 1.2% | 87.8% | 436 |
| Region IX | 42,968 | 25.7 | 8 | 7.2% | 3.1% | 71.1% | 865 |
| Region V | 67,562 | 23.4 | 10 | 7.5% | 1.1% | 70.9% | 1,122 |
| Region VI | 46,662 | 22.3 | 9 | 8.0% | 2.5% | 68.6% | 890 |
| Region VII | 56,793 | 25.5 | 10 | 6.3% | 0.5% | 66.8% | 934 |
| Region VIII | 53,754 | 21.2 | 7 | 9.5% | 2.2% | 64.5% | 1,485 |
| Region X | 43,727 | 26.5 | 9 | 6.6% | 0.5% | 71.8% | 714 |
| Region XI | 45,472 | 26.8 | 11 | 8.9% | 2.4% | 74.7% | 562 |
| Region XII | 41,246 | 25.7 | 11 | 7.1% | 3.0% | 60.0% | 863 |
| Philippines (public) | 909,348 | 25.5 | 9 | 7.6% | 2.0% | 71.5% | 13,605 |
Public schools without a principal or head teacher position
The personnel file lists principal (I to IV), assistant principal and head teacher (I to VI) positions for each school. One public school with learners has no personnel record, so its positions are unknown. Of the other 47,813, 34,208 (71.5%) have at least one. 13,605 (28.5%) have none, which means a teacher-in-charge or an officer-in-charge runs the school. This count differs from the EDCOM II finding that 48% of public schools have no principal item, because it counts head teacher positions too. It is the share of schools with no formal school leadership item of any kind.
The share of schools with a position is lowest in BARMM (36.9%), Region XII (60.0%), CAR (64.3%), Region VIII (64.5%) and NIR (65.8%). BARMM has 1,360 schools without a position and Region VIII 1,485. The share is highest in NCR (91.5%), Region III (89.8%) and Region IV-A (87.8%). Small schools are the ones without a position: the median school without a head position is far smaller than the median school with one.
For anyone preparing for the National Assessment for School Heads (NASH), these are the schools that will need principals. Every new principal position needs someone who has passed the NASH. The principal shortage article on the NASH Reviewer app shows the positions planned through 2028.
What this means for school heads
- The ratio a school is judged by is the aggregate one. Division planners compute learners over teachers for the whole school. A 1,200-learner school at 30 learners per teacher will not look like the median school at 22.7.
- Master teachers are scarce where support is most needed. BARMM has 2.6%, and Master Teacher III and IV positions are almost absent everywhere, so instructional leadership falls on the school head.
- Senior high school faculties are mostly at one rank. A senior high school head leads a faculty that is mostly Teacher II, with few master teachers to delegate to.
- Local funding can add teachers. In BARMM, 12.6% of teachers are locally paid, and in Region II, 4.5%. A school head who works with the local government can add enough teachers for whole classrooms.
How these numbers were made
- Source: DepEd’s School Personnel dataset for SY 2023-2024 (BEIS), joined to the learner file on school ID; public schools only (the file holds rows for every school but data for public schools).
- Teachers = 36 nationally funded teacher position columns (Teacher I–III, Master Teacher I–IV, SPED/SNED, Special Science, Instructor, for elementary, junior high and senior high) + 16 locally funded teacher columns (kindergarten, elementary, junior high, senior high; by funding source). Head teachers and principals are not counted as teachers.
- Pupil-teacher ratio = total enrollment ÷ teachers, for schools with enrollment and teachers above zero; regional and national ratios are sums over sums.
- Annex schools are counted on their own, not under their mother schools, because DepEd publishes no mapping between them; leaving annexes out changes no regional figure by more than 0.1.
- School-head positions = principal I–IV, assistant principal and head teacher I–VI columns summed per school.
Limits
The personnel file counts filled positions reported in the Basic Education Information System (BEIS). DepEd’s technical notes say these differ from the plantilla in the DBM’s PSIPOP. 17 elementary, 595 junior high and 213 senior high public schools that offer the level report no nationally funded teachers at that level; they are treated as missing, never as zero. Teacher quality, qualifications, experience and workload are not in the file.
Frequently asked questions
What is the pupil-teacher ratio in DepEd public schools?
Public schools had 25.5 learners per teacher in SY 2023-2024, computed as DepEd does (all learners ÷ all teachers). The median school’s ratio is 22.7. BARMM is highest at 30.0 and CAR lowest at 19.4.
How many master teachers does DepEd have?
Public schools report 68,066 nationally funded master teacher positions, 7.6% of all nationally funded teaching positions (teacher ranks plus SPED, Special Science and instructor positions). Master Teacher III and IV positions number 637 in the whole country.
How many DepEd public schools have no principal?
13,605 public schools, or 28.5%, had no principal, assistant principal or head teacher position in SY 2023-2024. In BARMM, only 36.9% of schools had one.
Download the data
The cleaned, harmonized DepEd files behind this series are free to download in CSV and Parquet, with a codebook and checksums, under the terms of use set out in the release. Download Cleaned DepEd School Data, SY 2017-18 to 2025-26 documents every file and column. The files themselves are at data.nash.com.ph, starting with the README, the SY 2023-24 school master file (CSV, 8.0 MB) and the nine-year enrollment panel (Parquet, 17.2 MB).
More in this series
- DepEd Enrollment Trends SY 2017-2018 to SY 2025-2026
- Enrollment by school year: SY 2017-18, SY 2018-19, SY 2019-20, SY 2020-21, SY 2021-22, SY 2022-23, SY 2023-24, SY 2024-25, SY 2025-26
- DepEd Learner Data SY 2023-2024: IP, ALIVE and School Size
- DepEd Classroom and School Building Data, SY 2023-2024
- DepEd WASH Data SY 2023-2024: Toilets, Water, Electricity
- DepEd ICT Data SY 2023-2024: Computers and Internet
- NAT Grade 6 Results SY 2023-2024: DepEd Division Scores
- ELLNA Grade 3 Results SY 2023-2024: DepEd Division Scores
- CRLA Results SY 2025-2026: Reading Levels in Grades 1 to 3
- DepEd School Inputs vs Test Results: Multigrade and Internet
- DepEd Open Data Quality: Errors, Blanks and Coverage Limits
- Download Cleaned DepEd School Data, SY 2017-18 to 2025-26
- The full report: Philippine basic education in numbers
Guides for aspiring school heads
- DepEd Data for Aspiring School Heads: Where to Start
- NASH Practice Questions With Answers: 50 Items on the PPSSH
- How to Read DepEd Data: A Guide for Aspiring School Heads
- EDCOM II Final Report: Guide for Aspiring School Heads
- National Education Plan 2026-2035: Guide for School Heads
- NASH Study Guide: DepEd Memorandum 069, s. 2025 and PPSSH
- PPSSH Domain 1: Leading Strategically With DepEd Data
- PPSSH Domain 2: Managing School Operations With DepEd Data
- PPSSH Domain 3: Teaching and Learning With DepEd Data
- PPSSH Domain 4: Developing Self and Others With DepEd Data
- PPSSH Domain 5: Building Connections With DepEd Data
Analysis and charts by Mark Anthony Llego for NASH Reviewer. Data: Department of Education public datasets. Charts may be reused only with written permission from support@nash.com.ph.