Domain 4 of the Philippine Professional Standards for School Heads (PPSSH), Developing Self and Others, has eight strands. For teachers preparing for the National Assessment for School Heads (NASH, formerly the NQESH), each one at Career Stage 1 can be read with the Department of Education’s (DepEd) public personnel data, which show that master teachers are only 7.6% of nationally funded teaching positions.
Domain 4 is where the NASH begins. In the PPSSH booklet, adopted by DepEd Order No. 024, s. 2020, the first strand’s Career Stage 1 indicator is to “conduct self-assessment of personal and professional development needs using the Philippine Professional Standards for School Heads”. DepEd Memorandum No. 069, s. 2025 describes the NASH as “a developmental assessment tool to evaluate readiness and identify areas for improvement” and returns an Individual Development Report to each taker. In the PPSSH’s own terms, the assessment is an instrument for indicator 4.1.1.
The rest of the domain is about the people you will lead: their performance management, their development, their welfare and their recognition. Below, each strand’s Career Stage 1 indicator is paired with three sources. The first is the personnel data for public schools. The second is the findings of the Second Congressional Commission on Education (EDCOM II) Final Report on teacher workload, career progression and performance management. The third is the supply of future school leaders that the National Education Plan 2035 depends on.
Key findings
- Most faculties have few senior ranks. Of 881,433 nationally funded teacher positions, 91% of elementary and 92% of junior-high positions are Teacher I to III. Master teachers are 7.6% overall and 2.6% in BARMM. In senior high school, 60.8% of positions are Teacher II.
- Leadership development is a national target. EDCOM II sets a target of 33% of principals meeting school-based management competencies by 2028, about 5,036 a year, “pending the establishment of DepEd’s Principals Academy”. It asks the National Educators Academy of the Philippines (NEAP) to expand professional learning communities under that academy.
- Performance management is being revised. EDCOM II finds that the Results-based Performance Management System for teachers, aligned with the Philippine Professional Standards for Teachers (RPMS-PPST), rates them on 37 indicators over three years. It finds that the Office Performance Commitment and Review (OPCR) for principals “lacks standardization across the system”, and that both reward promotion rates. It schedules a revised RPMS and Office Performance Commitment and Review Form (OPCRF) for 2027 to 2035.
- Head teachers are the main source of future principals. Public schools report 26,068 head-teacher positions against 20,968 principal positions, and 27.7% of schools are led by head teachers only. The 22,124 principal items planned for 2026 to 2028 will be filled largely from this group, and every first appointment requires a pass in a DepEd school head assessment, now the NASH (earlier NQESH and Principal’s Test passers also qualify).
- Welfare law changed in 2025. Republic Act No. 12288 made the Expanded Career Progression system law. EDCOM II asks for the master’s degree requirement at Master Teacher I to be moved to a later step, and for structured mental-health support in place of helplines.
The eight strands of Domain 4 at Career Stage 1
| Strand | Career Stage 1 indicator |
|---|---|
| 4.1 Personal and professional development | 4.1.1 Conduct self-assessment of personal and professional development needs using the Philippine Professional Standards for School Heads. |
| 4.2 Professional reflection and learning | 4.2.1 Demonstrate understanding of how professional reflection and learning can be used in improving practice. |
| 4.3 Professional networks | 4.3.1 Seek opportunities to improve one’s practice as a school leader through professional networks. |
| 4.4 Performance management | 4.4.1 Demonstrate knowledge and understanding of the implementation of the performance management system in improving school personnel and office performance. |
| 4.5 Professional development of school personnel | 4.5.1 Demonstrate knowledge and understanding of professional development in enhancing strengths and in addressing performance gaps among school personnel. |
| 4.6 Leadership development in individuals and teams | 4.6.1 Identify strengths, capabilities and potentials of individuals and teams in performing leadership roles and responsibilities. |
| 4.7 General welfare of human resources | 4.7.1 Display knowledge of laws, policies, guidelines and issuances on the rights, privileges and benefits of school personnel to promote their general welfare. |
| 4.8 Rewards and recognition mechanism | 4.8.1 Reward and recognize learners, school personnel and other stakeholders for exemplary performance and/or support. |
Three of the eight (4.1.1, 4.3.1 and 4.8.1) ask the aspiring school head to do something, not only to know something. The domain expects practice before appointment.
4.1 Personal and professional development
The NASH is self-assessment by instrument. DepEd’s FY 2025 results use a standard score of 65 on a 1 to 100 scale, overall and in each of the five domains. A taker who reaches 65 overall and in at least four domains meets the PPSSH standards in four domains. One who reaches it in at least three domains meets them in three and enters a Targeted Development Program within three months of appointment. The rest are With Developmental Areas. The Individual Development Report tells you which group you are in. Indicator 4.1.1 is what you do with that report.
EDCOM II gives the system-level version of the same strand. Recommendation 6.1.2.c targets 33% of principals meeting school-based management competencies by 2028, “pending the establishment of DepEd’s Principals Academy”. That is about 15,110 of 22,320 serving principals, in yearly steps of about 5,036. The target rises to 100% by 2035.
The Year Two Report had traced low NQESH pass rates to “a gap in training for aspiring candidates that aligns with the PPSSH”. The pass rates were 2.22% in 2016, about 0.7% in 2018, 36% in 2021 and 26% in 2023. A self-assessment against the 34 strands, done before the examination rather than after, is the preparation the Commission describes.
How DepEd’s standards for school heads developed from the 2010 NCBS-SH to the PPSSH is traced in From NCBS-SH to PPSSH: DepEd Standards for School Heads.
4.2 Professional reflection and learning
Indicator 4.2.1 asks you to understand how reflection improves practice. The memorandum’s own prescription is in its paragraph 13: coaching and mentoring with “experienced and proficient school principals”, so that candidates see “how the competencies outlined in the PPSSH are demonstrated in practice”. The PPSSH’s career stages describe the path. Career Stage 2 school heads “reflect on their practices for improvement”. Career Stage 3 school heads “continuously reflect on and take steps to address their developmental needs and those of other school personnel and learners”. Career Stage 4 school heads model “critically evaluating practice and setting clearly defined targets”.
Reflection with data is a specific skill. A school head who treats a National Achievement Test (NAT) mean from six learners as a final judgment is reflecting on the wrong thing. So is one who treats a Comprehensive Rapid Literacy Assessment (CRLA) screen as a ranking.
4.3 Professional networks
Indicator 4.3.1 asks you to seek improvement through networks. EDCOM II’s recommendation 6.1.2.d asks NEAP to “expand Professional Learning Communities under its developing Principal Academy to enhance leadership capacity and foster collaboration and knowledge-sharing among school heads”. It also asks NEAP to expand competency-based training for Schools Division Superintendents, Public Schools District Supervisors and Regional Directors. Recommendation 8, for an Instructional Leadership Framework, would define how those levels coordinate.
The data suggest who the network should include. Between-division differences explain 36% of the variance in Early Language, Literacy, and Numeracy Assessment (ELLNA) school means and about a quarter of NAT variance. The schools most comparable to yours are therefore the ones in your own division. The analysis of school inputs and learning outcomes advises benchmarking “within the division”, because “a regional or national comparison tells you less than the school next door”. A network of school heads in the same division, sharing CRLA profiles and what changed them, is the professional learning community the report has in mind.
4.4 Performance management
Indicator 4.4.1 asks for knowledge of the performance management system. For teachers, the system is the Results-Based Performance Management System (RPMS) with the Individual Performance Commitment and Review Form (IPCRF). For school heads, it is the OPCRF. Both sit under the four-phase Strategic Performance Management System. DepEd Memorandum No. 8, s. 2023 distributed all 37 PPST indicators over the three school years 2022 to 2025. DepEd Order No. 2, s. 2015 lets Schools Division Offices contextualize principals’ objectives and indicators.
EDCOM II’s Priority Area 25 finds that this system “demonstrably fails to translate performance data into learning improvements”. It has too many objectives, treats “everything” as important, and uses means of verification in place of instructional quality. For principals, the OPCR has no standard tools or rubrics, “in contrast to the highly structured RPMS-PPST for teachers”.
Priority Area 7 adds the incentive problem. Promotion, completion and dropout rates are headline metrics in IPCRFs and OPCRFs, and “principals, in turn, feel pressure to maintain high promotion rates, and some explicitly discourage or prohibit failing learners even when non mastery is evident”. The remedy is scheduled. The RPMS and OPCRF are to be revised so that they reward “effective remediation and truthful reporting instead of near perfect promotion statistics”. Implementation of the revised instruments is planned for 2027 to 2035, with an OPCRF for principals that prioritizes classroom observation, teacher coaching and curriculum implementation.
An aspiring school head who knows the system at Career Stage 1 knows both the forms as they are and the direction of their revision. The school-level data that will matter under a learning-focused OPCRF are the ones with enough learners to be reliable: end-of-year CRLA and Rapid Mathematics Assessment (RMA) profiles, attendance, and classroom observation records.
For the school head’s own performance commitments, see OPCRF for DepEd School Heads in 2026: What Applies Now.
4.5 Professional development of school personnel
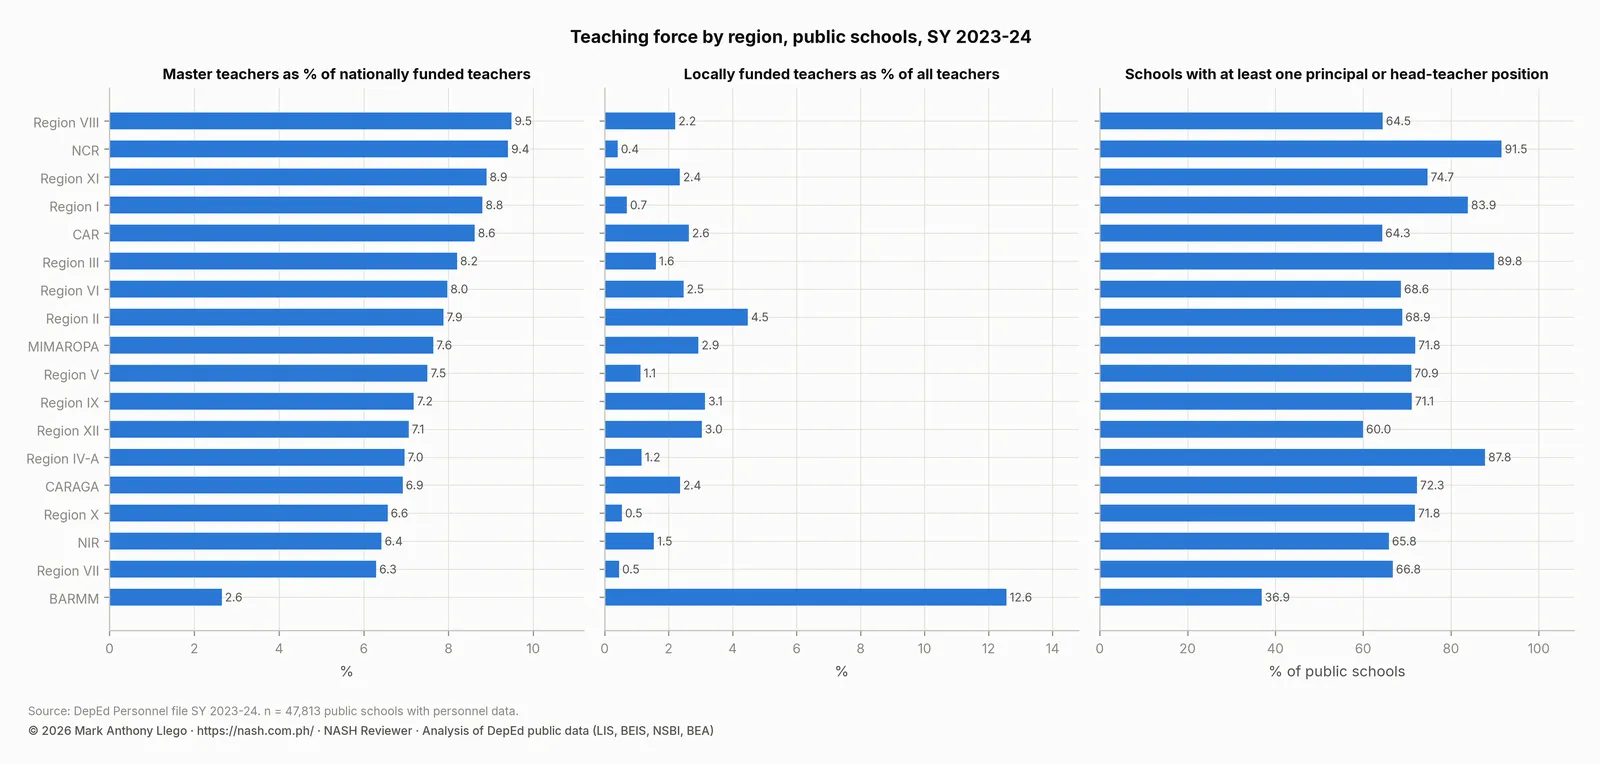
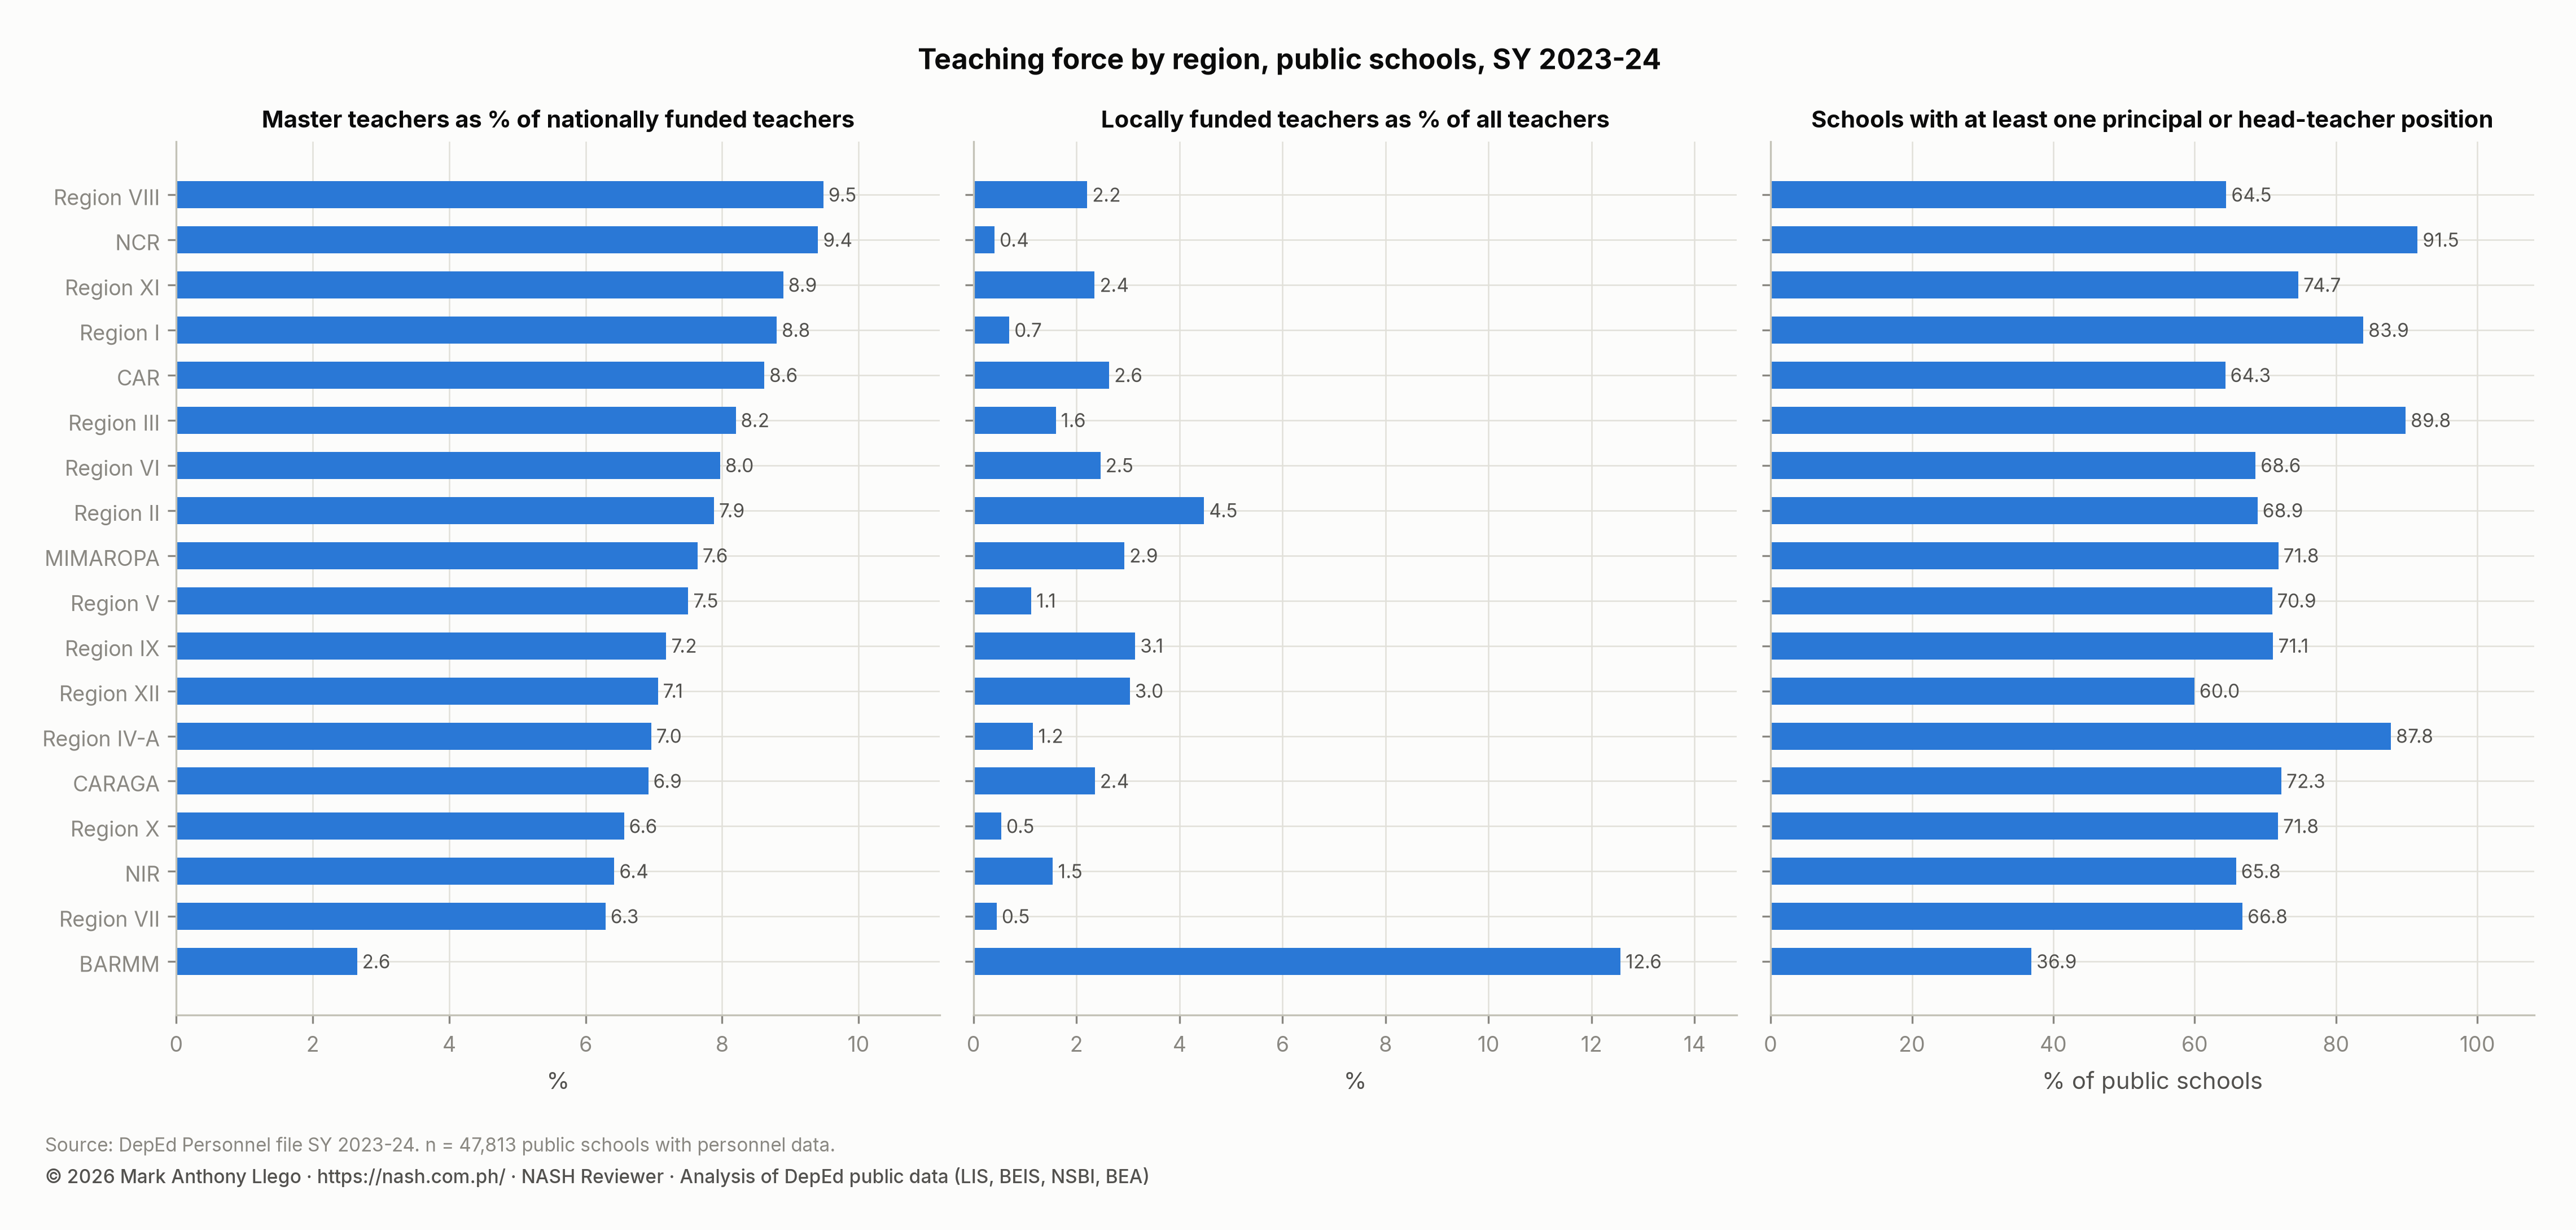
Indicator 4.5.1 is about “enhancing strengths and addressing performance gaps”. The personnel file shows the strengths available.
| Region | Teachers | Learners per teacher | Median teachers per school | Master teachers (% of national positions) | Locally funded teachers (% of all) | Schools with a principal or head-teacher position | Schools without one |
|---|---|---|---|---|---|---|---|
| BARMM | 25,599 | 30 | 9 | 2.6% | 12.6% | 36.9% | 1,360 |
| CAR | 18,447 | 19.4 | 7 | 8.6% | 2.6% | 64.3% | 658 |
| CARAGA | 30,897 | 22.6 | 8 | 6.9% | 2.4% | 72.3% | 582 |
| MIMAROPA | 33,752 | 24.2 | 8 | 7.6% | 2.9% | 71.8% | 671 |
| NCR | 76,233 | 27.5 | 71 | 9.4% | 0.4% | 91.5% | 70 |
| NIR | 44,612 | 25.4 | 11 | 6.4% | 1.5% | 65.8% | 762 |
| Region I | 47,692 | 23.1 | 10 | 8.8% | 0.7% | 83.9% | 462 |
| Region II | 36,451 | 22.2 | 8 | 7.9% | 4.5% | 68.9% | 790 |
| Region III | 90,361 | 27.4 | 14 | 8.2% | 1.6% | 89.8% | 379 |
| Region IV-A | 107,120 | 29.7 | 15 | 7.0% | 1.2% | 87.8% | 436 |
| Region IX | 42,968 | 25.7 | 8 | 7.2% | 3.1% | 71.1% | 865 |
| Region V | 67,562 | 23.4 | 10 | 7.5% | 1.1% | 70.9% | 1,122 |
| Region VI | 46,662 | 22.3 | 9 | 8.0% | 2.5% | 68.6% | 890 |
| Region VII | 56,793 | 25.5 | 10 | 6.3% | 0.5% | 66.8% | 934 |
| Region VIII | 53,754 | 21.2 | 7 | 9.5% | 2.2% | 64.5% | 1,485 |
| Region X | 43,727 | 26.5 | 9 | 6.6% | 0.5% | 71.8% | 714 |
| Region XI | 45,472 | 26.8 | 11 | 8.9% | 2.4% | 74.7% | 562 |
| Region XII | 41,246 | 25.7 | 11 | 7.1% | 3.0% | 60.0% | 863 |
| Philippines (public) | 909,348 | 25.5 | 9 | 7.6% | 2.0% | 71.5% | 13,605 |
Master teachers number 68,066, or 7.6% of nationally funded teaching positions, from 2.6% in BARMM to 9.5% in Region VIII. Master Teacher III and IV positions are rare everywhere. In senior high school there are 5,459 master teachers for a faculty that is 60.8% Teacher II, because the 2016 rollout created positions at that rank. A school with no master teacher, which is the common case in BARMM and in small elementary schools, has no one to delegate technical assistance to. There, the school head is the instructional coach.
EDCOM II’s development recommendations are institutional. The first is a centralized HRIS integrated with the PDIS to profile “teacher competencies, training needs, and career progression”, drawing on e-SF7, RPMS outputs, training-needs analyses and continuing professional development (CPD) records. The second is a NEAP “standards-based framework for program design, delivery, and evaluation”, with in-service training (INSET) “responsive to subject-specific, grade-level, and developmental needs, with particular emphasis on early-grade literacy and numeracy”. The third is action by the Commission on Higher Education (CHED), the Professional Regulation Commission (PRC) and the Teacher Education Council (TEC) against diploma mills. The same recommendation has DepEd and TEC “considering the quality of HEIs and their graduate programs for career progression purposes”.
The report also records that teachers in the Academic Recovery and Accessible Learning (ARAL) Program asked for “consistent training on teaching reading”. That is the professional-development gap the CRLA profile, with 5.3% of Grade 1 learners at grade level, makes urgent.
4.6 Leadership development in individuals and teams
Indicator 4.6.1 asks you to identify leadership potential. The personnel file shows how much of that potential already serves in a leadership position without a principal’s title.
| Position | Elementary | Junior high | Senior high | Total |
|---|---|---|---|---|
| School Principal I | 9,231 | 2,049 | 159 | 11,439 |
| School Principal II | 3,991 | 1,091 | 237 | 5,319 |
| School Principal III | 1,617 | 683 | 49 | 2,349 |
| School Principal IV | 993 | 817 | 51 | 1,861 |
| Assistant Principal I | 0 | 35 | 52 | 87 |
| Assistant Principal II | 0 | 135 | 637 | 772 |
| Assistant Principal III | 0 | 12 | 10 | 22 |
| Head Teacher I | 4,911 | 3,437 | 277 | 8,625 |
| Head Teacher II | 1,697 | 1,166 | 142 | 3,005 |
| Head Teacher III | 5,989 | 5,521 | 370 | 11,880 |
| Head Teacher IV | 246 | 603 | 20 | 869 |
| Head Teacher V | 50 | 284 | 27 | 361 |
| Head Teacher VI | 16 | 1,244 | 68 | 1,328 |
Public schools with learners report 20,968 School Principal positions, 881 assistant principal positions and 26,068 head-teacher positions. Of the head-teacher positions, 11,880 are Head Teacher III. Classified by highest position, 43.4% of schools have a principal, 27.7% are led by head teachers only, and 28.5% report no school-leadership position. The last group is run by a teacher-in-charge or officer-in-charge. Elementary-only schools, 37,005 of 47,813, are the least likely to have a principal (39.5%). Secondary-only schools are the most likely (57.4%).
| Level offered | School Principal | Assistant principal only | Head teacher only | No head position | Schools | Learners |
|---|---|---|---|---|---|---|
| Elementary and secondary | 54.3% | 0.4% | 28.4% | 17.0% | 2,335 | 1,401,614 |
| Elementary only | 39.5% | 0.0% | 30.4% | 30.1% | 37,005 | 13,158,482 |
| Secondary only | 57.4% | 2.3% | 15.9% | 24.4% | 8,473 | 8,665,029 |
| Philippines (public) | 43.4% | 0.4% | 27.7% | 28.5% | 47,813 | 23,225,125 |
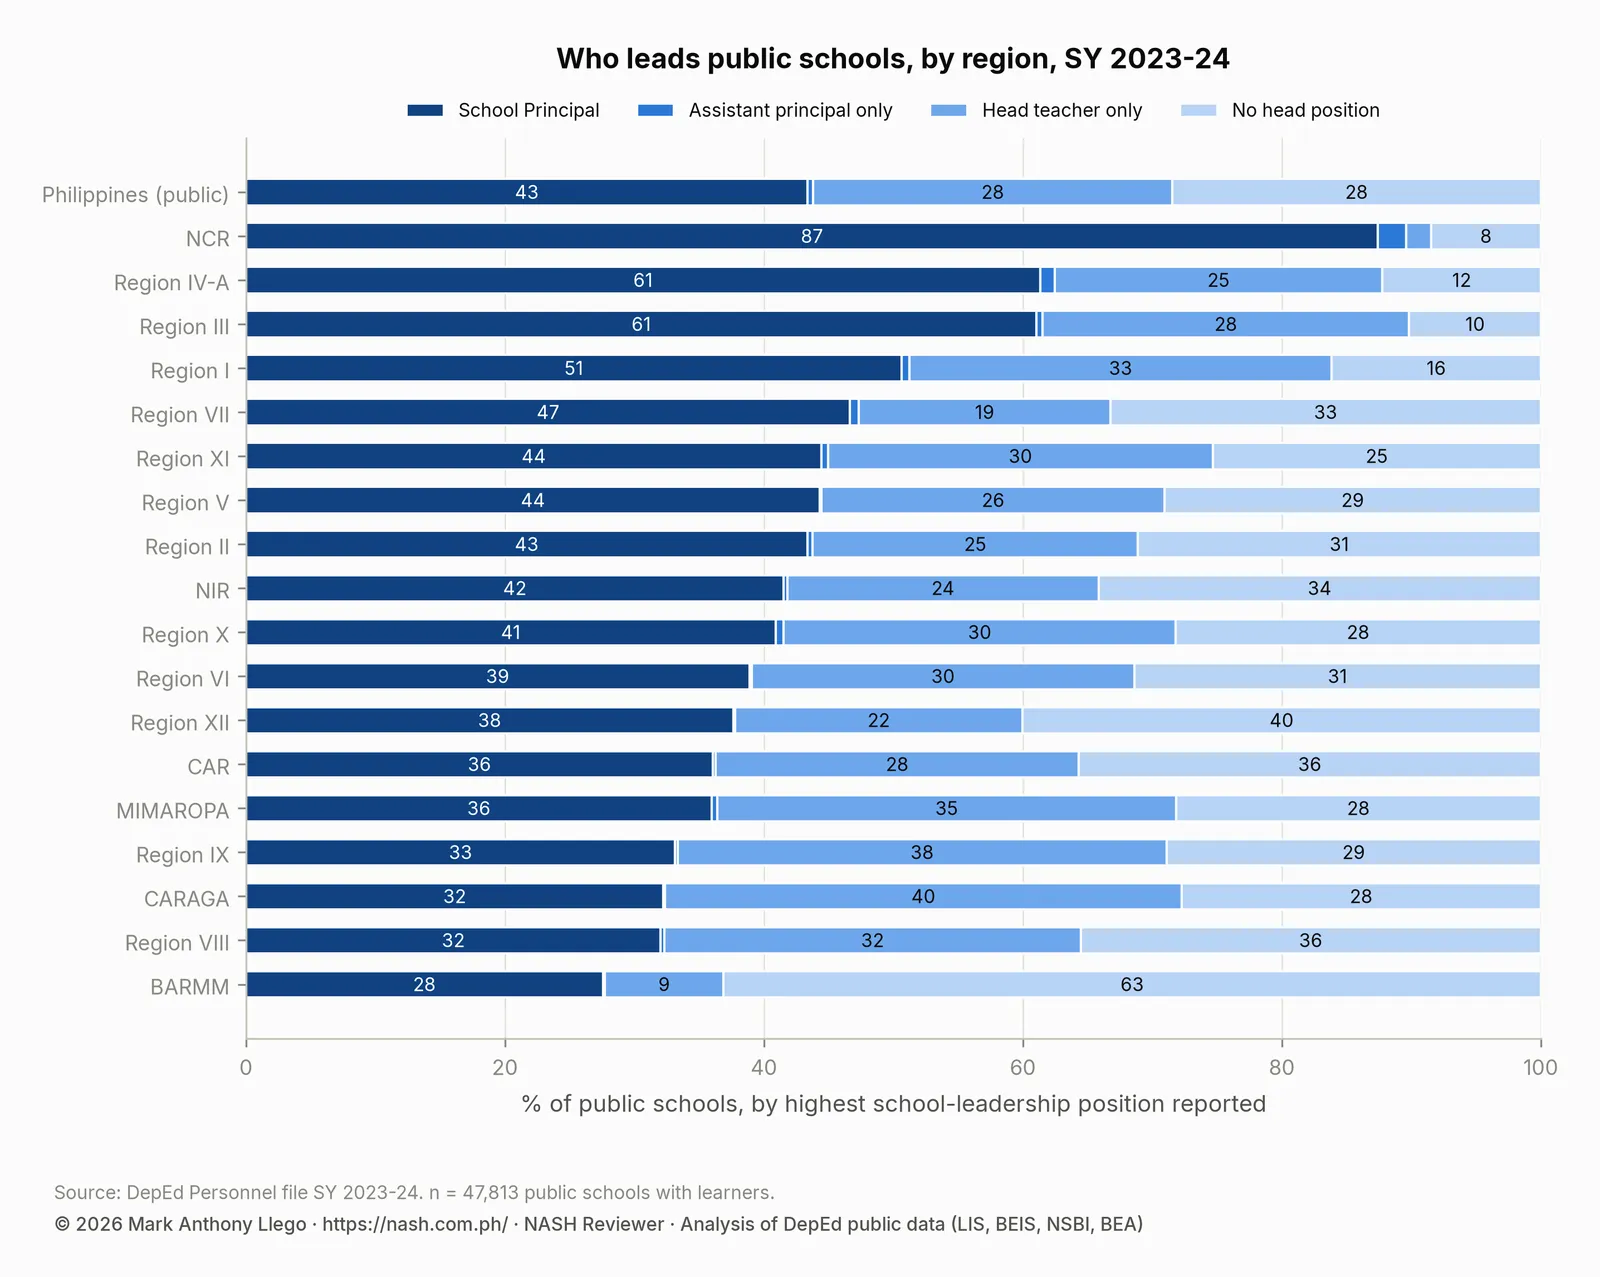
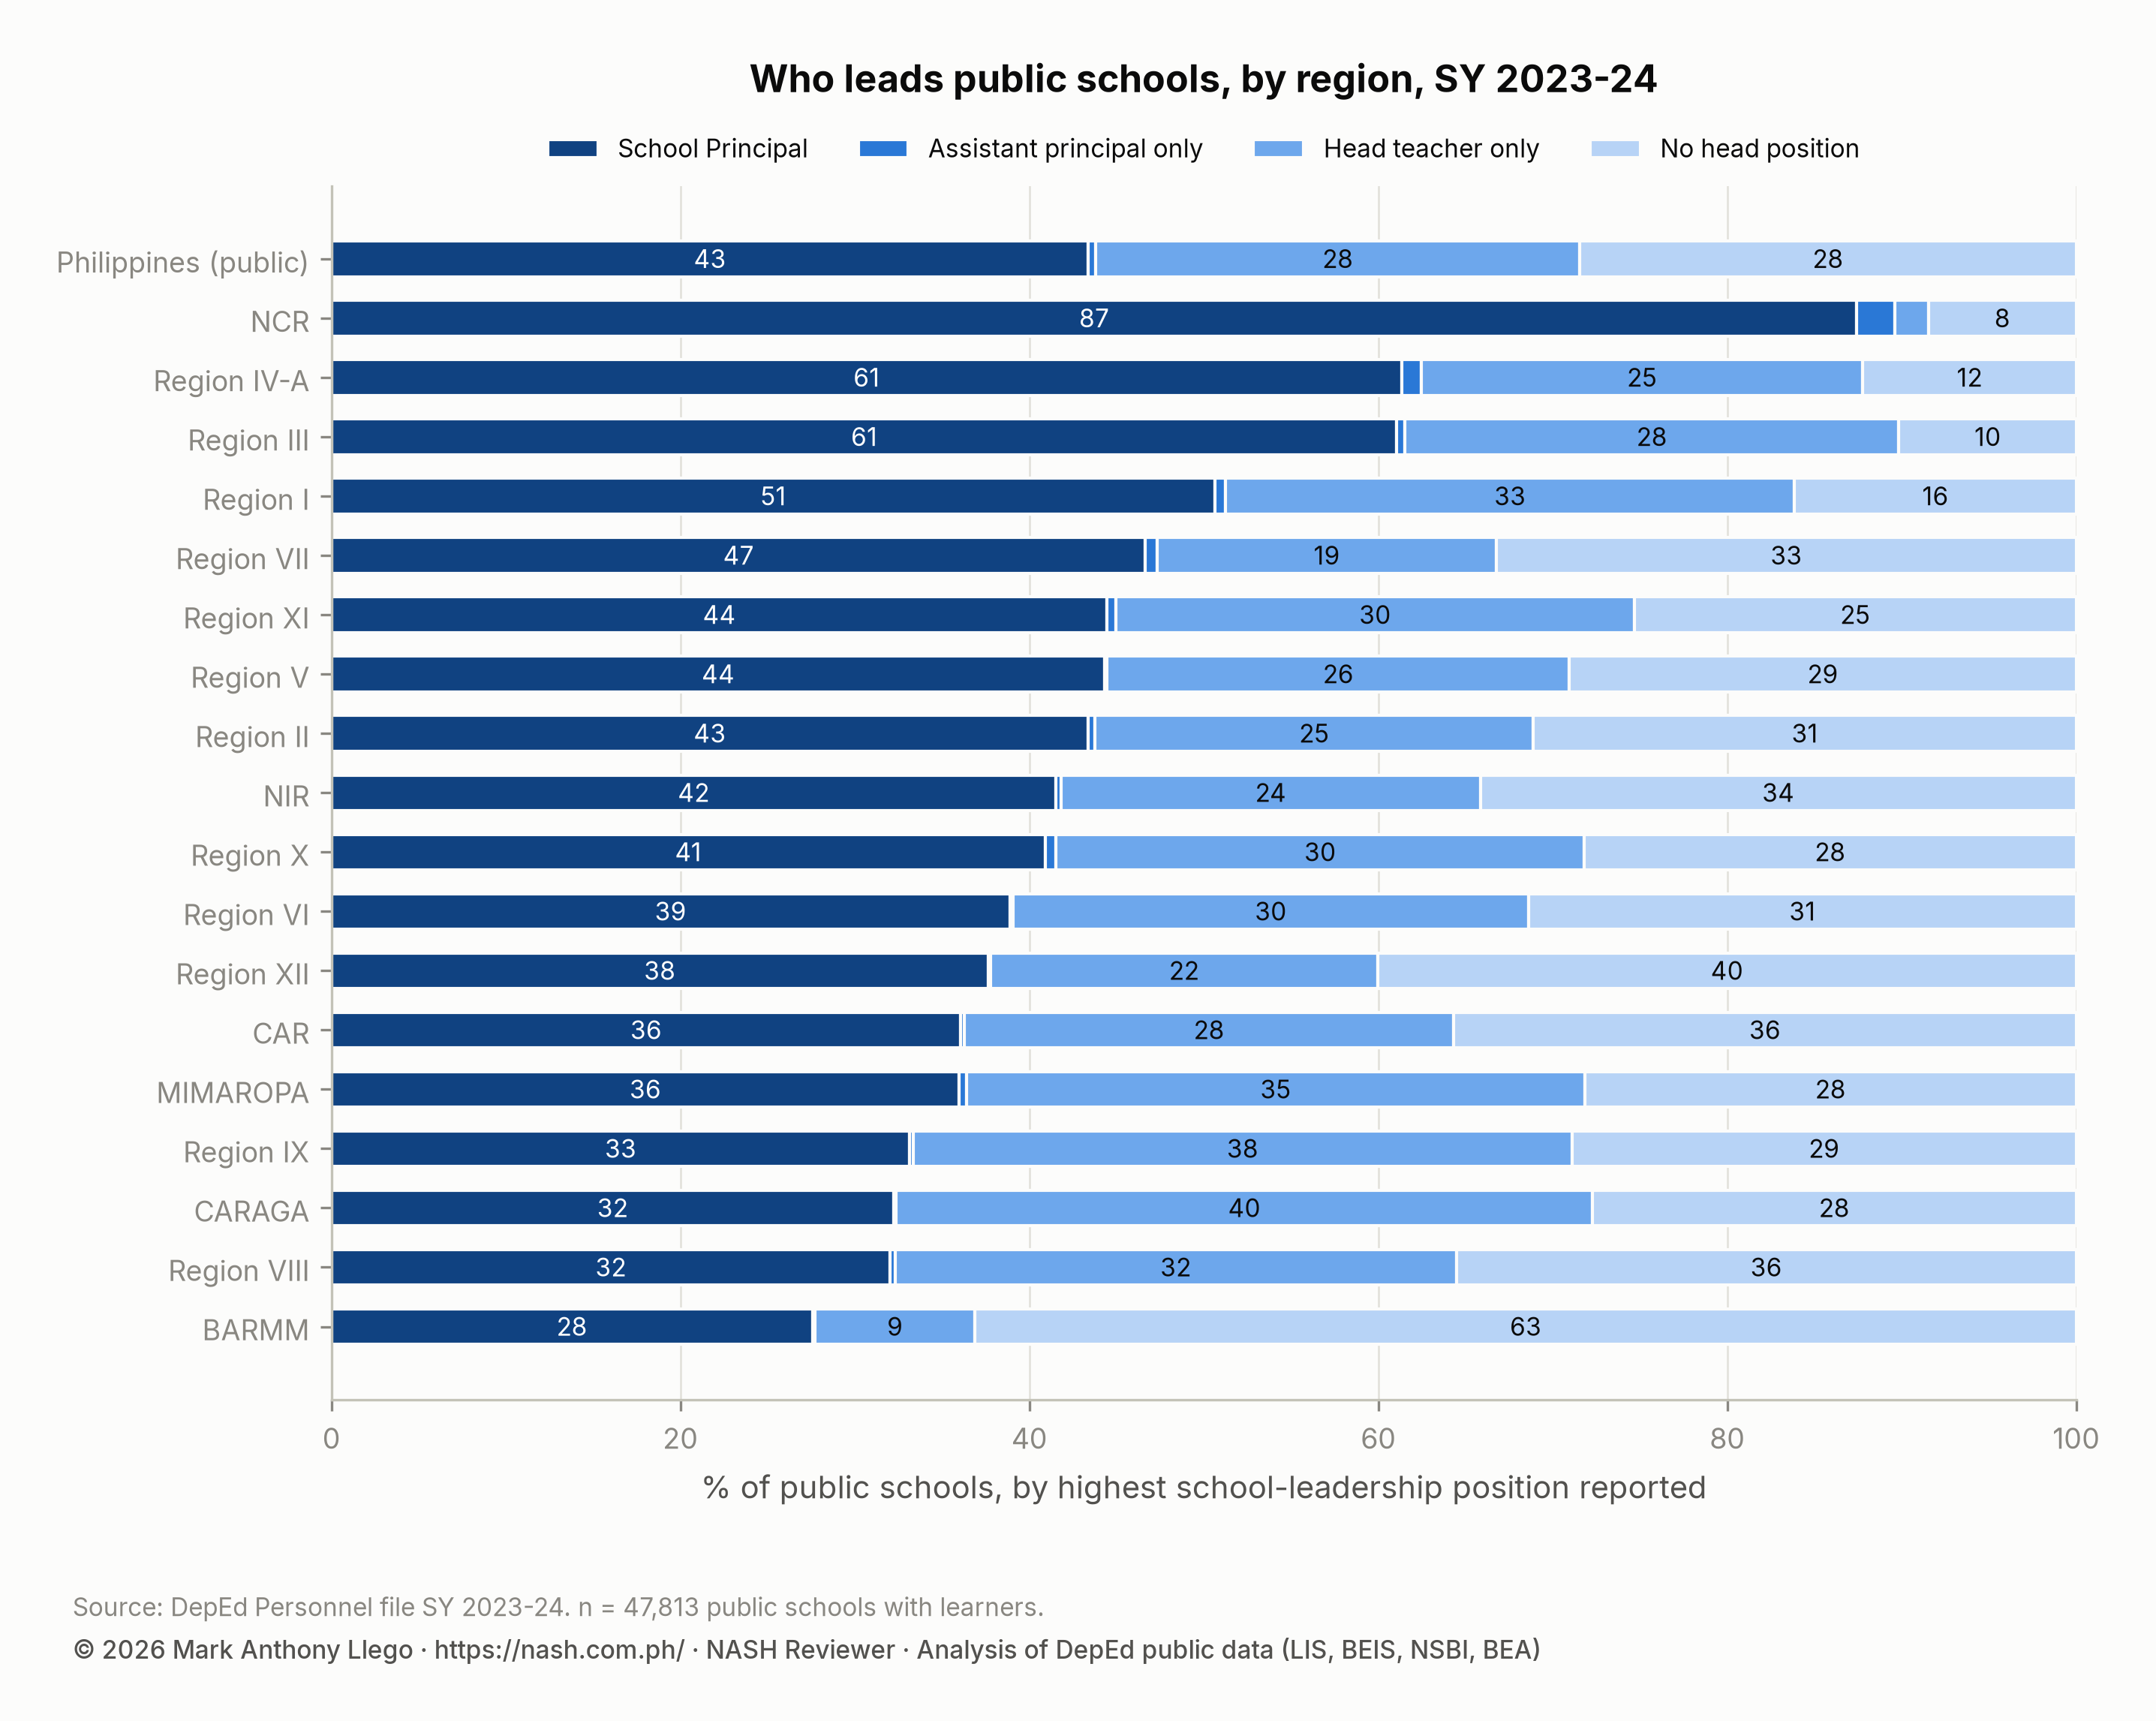
EDCOM II’s finding is the same from the plantilla side. In SY 2024-2025, 18,576 schools (48%) had no principal item and 12,057 had incorrect items. In June 2025, 23,661 schools had Principal I to IV items, of which 22,320 were filled. Recommendation 7 asks that “leadership pipelines should be strengthened through targeted training, mentoring, and succession planning linked to the Career Progression System for School Leaders”. The National Education Plan adds 6,000 principal items in 2026, 8,000 in 2027 and 8,124 in 2028. The head teachers, teachers-in-charge and assistant principals in the table above are the Batch 1 and Batch 2 takers the NASH memorandum names. A school head’s succession plan is the list of which of them is ready.
4.7 General welfare of human resources
Indicator 4.7.1 asks for knowledge of the laws on rights, privileges and benefits. EDCOM II’s chapter on teacher education discusses these:
- Republic Act No. 12288 (2025), the Career Progression System for Public School Teachers and School Leaders Act, put the career progression system of Executive Order No. 174, s. 2022 into law and changed it: Teacher I to Master Teacher I become the base, and Master Teacher VI and School Principal V are added. DepEd has not yet issued an order implementing it, so reclassification still follows DO 24 and DO 34, s. 2025. EDCOM II asks DepEd to review qualification standards, recalibrate promotion criteria toward “demonstrable classroom impact”, fund the new positions, link pathways to the HRIS and PDIS, and “remove outdated quotas that artificially limit advancement”.
- DepEd Order No. 24, s. 2025, the Expanded Career Progression (ECP) guidelines, applies the qualification standards of DepEd Order No. 019, s. 2025, which require a master’s degree at Master Teacher I. EDCOM II asks DepEd and the Civil Service Commission (CSC) to move that requirement to a later step, since the career line is chosen only after Master Teacher I.
- DepEd Order No. 002, s. 2024 and DepEd Order No. 006, s. 2025 removed administrative tasks from teachers and cut their forms from 174 to 75. EDCOM II had found that teachers had over 50 ancillary tasks and that nearly half worked more than 50 hours a week.
- Mental health. EDCOM II cites evidence that teachers “experience mounting mental health pressures” and that national mechanisms such as the DRRMS helpline “are insufficient substitutes for structured, accessible, and sustained mental health programs”.
- Support staff. The 2025 budget funded 10,000 administrative officer and support positions, and DepEd committed to 7,000 contract-of-service school-based staff. The staffing standards still show gaps of 12,078 Administrative Officer II and 44,285 Project Development Officer I items.
Most of this welfare agenda is about workload. The pupil-teacher ratio you will be held to is the regional aggregate (25.5 nationally, 30.0 in BARMM). Under DepEd Order No. 002, s. 2024, the administrative load removed from teachers falls on you until the support items exist. Teacher Workload and Accountability covers EDCOM II’s workload findings, the support-staff gap and what has changed since 2024.
Welfare includes fair process when complaints arise. See Oppression Cases: How Principals Must Treat Teachers and Preventive Suspension, Appeals and Back Pay for Principals.
4.8 Rewards and recognition
Indicator 4.8.1 asks you to reward exemplary performance and support. EDCOM II’s caution is about what gets rewarded. Performance systems that “historically rewarded high pass rates rather than accurate reporting of learning gaps” produced mass promotion. The revised RPMS and OPCRF are to reward “effective remediation and truthful reporting”.
The report’s own examples of recognition are results-based. In Norzagaray, Bulacan, 60.73% of learners read at grade level, against a national 47.74%. Pasay City’s two-decade partnership with its local government unit (LGU) moved almost all flagged non-readers up a level. In the national Literacy Remediation Program, 96% of low emerging readers progressed. A rewards mechanism aligned with the PPSSH recognizes the teacher whose Grade 1 class moved from low emerging to developing on the CRLA. It also recognizes the stakeholder whose Special Education Fund (SEF) line paid for the reading teacher. Local Education Models in EDCOM II covers these programs and the evidence behind each result.
How the NASH may test Domain 4
A situational item might describe a newly appointed principal of a 300-learner elementary school with nine teachers, no master teacher and a Head Teacher I. The school has a promotion rate of 99% and a CRLA profile with half of Grade 1 at low emerging. A relational answer runs the RPMS cycle so that the year’s objectives are the CRLA targets and the remediation delivered, not the promotion rate. It assigns the Head Teacher I to coach Grades 1 to 3 and treats that as her leadership development. It schedules classroom observation as the school head’s own OPCRF priority, and uses the division’s network of school heads for the training the faculty needs. An extended abstract answer explains what changes in a 2,000-learner secondary school with four master teachers and an assistant principal. It also explains why the succession plan in the small school is the division’s problem as much as the school’s.
Before you apply
- Score yourself against all 34 Career Stage 1 indicators before the examination. The Individual Development Report will do it for you afterwards.
- Read your prospective school’s personnel rows: ranks, master teachers, head-teacher positions, locally funded teachers.
- Know the RPMS, IPCRF and OPCRF as they are and EDCOM II’s schedule for revising them.
- Know Republic Act No. 12288, Executive Order No. 174, s. 2022, DepEd Order No. 24, s. 2025 and DepEd Order No. 002, s. 2024 well enough to explain each to a teacher. Our career progression guide is a place to start.
Frequently asked questions
What is PPSSH Domain 4, Developing Self and Others?
PPSSH Domain 4, Developing Self and Others, has eight strands: personal and professional development, professional reflection and learning, professional networks, performance management, professional development of school personnel, leadership development, general welfare, and rewards and recognition. Career Stage 1 starts with self-assessment against the PPSSH.
What does the NASH Individual Development Report do?
The Individual Development Report reports your domain scores against the 65-point standard and identifies your developmental areas. PPSSH indicator 4.1.1 asks you to conduct exactly this self-assessment. DepEd Memorandum No. 069, s. 2025 encourages coaching and mentoring by serving principals to act on the report.
How many DepEd public schools are led by head teachers or teachers-in-charge?
In the SY 2023-2024 personnel file, 27.7% of public schools report head teachers only and 28.5% report no school-leadership position, so 56.6% have no principal position. EDCOM II counts 48% of schools without a principal plantilla item in SY 2024-2025.
Download the data
The cleaned, harmonized DepEd files behind this series are free to download in CSV and Parquet, with a codebook and checksums, under the terms of use set out in the release. Download Cleaned DepEd School Data, SY 2017-18 to 2025-26 documents every file and column. The files themselves are at data.nash.com.ph, starting with the README, the SY 2023-24 school master file (CSV, 8.0 MB) and the nine-year enrollment panel (Parquet, 17.2 MB).
Guides for aspiring school heads
- DepEd Data for Aspiring School Heads: Where to Start
- NASH Practice Questions With Answers: 50 Items on the PPSSH
- How to Read DepEd Data: A Guide for Aspiring School Heads
- EDCOM II Final Report: Guide for Aspiring School Heads
- National Education Plan 2026-2035: Guide for School Heads
- NASH Study Guide: DepEd Memorandum 069, s. 2025 and PPSSH
- PPSSH Domain 1: Leading Strategically With DepEd Data
- PPSSH Domain 2: Managing School Operations With DepEd Data
- PPSSH Domain 3: Teaching and Learning With DepEd Data
- PPSSH Domain 5: Building Connections With DepEd Data
- On the app: the NASH guide, the PPSSH guide, the principal shortage and the full data report, Philippine basic education in numbers
The data reports
- DepEd Enrollment Trends SY 2017-2018 to SY 2025-2026
- Enrollment by school year: SY 2017-18, SY 2018-19, SY 2019-20, SY 2020-21, SY 2021-22, SY 2022-23, SY 2023-24, SY 2024-25, SY 2025-26
- DepEd Learner Data SY 2023-2024: IP, ALIVE and School Size
- DepEd Teachers and School Personnel Data, SY 2023-2024
- DepEd Classroom and School Building Data, SY 2023-2024
- DepEd WASH Data SY 2023-2024: Toilets, Water, Electricity
- DepEd ICT Data SY 2023-2024: Computers and Internet
- NAT Grade 6 Results SY 2023-2024: DepEd Division Scores
- ELLNA Grade 3 Results SY 2023-2024: DepEd Division Scores
- CRLA Results SY 2025-2026: Reading Levels in Grades 1 to 3
- DepEd School Inputs vs Test Results: Multigrade and Internet
- DepEd Open Data Quality: Errors, Blanks and Coverage Limits
- Download Cleaned DepEd School Data, SY 2017-18 to 2025-26
Written by Mark Anthony Llego for NASH Reviewer. Sources: DepEd Order No. 024, s. 2020 and the PPSSH booklet; DepEd Memorandum No. 069, s. 2025; EDCOM II Final Report, January 2026, and Year Two Report, 2025; DepEd public datasets. Charts may be reused only with written permission from support@nash.com.ph.