DepEd’s SY 2023-2024 school input files, set beside each public elementary school’s test results, show which inputs are associated with results among schools in the same division. The results are the Grade 3 Early Language, Literacy and Numeracy Assessment (ELLNA) and Grade 6 National Achievement Test (NAT) means of SY 2023-2024, and the Comprehensive Rapid Literacy Assessment (CRLA) reading shares of SY 2025-2026. A fully multigrade school scores about 4 points lower than a fully monograde school in the same division. A school with internet scores about 2.6 NAT points higher than one without.
Every input here has a policy behind it: teacher items, classroom construction, WASH facilities, the Computerization Program, connectivity and the multigrade program. The natural question is which of them move results. DepEd’s public files allow a careful version of that question for the 44 divisions with assessment data.
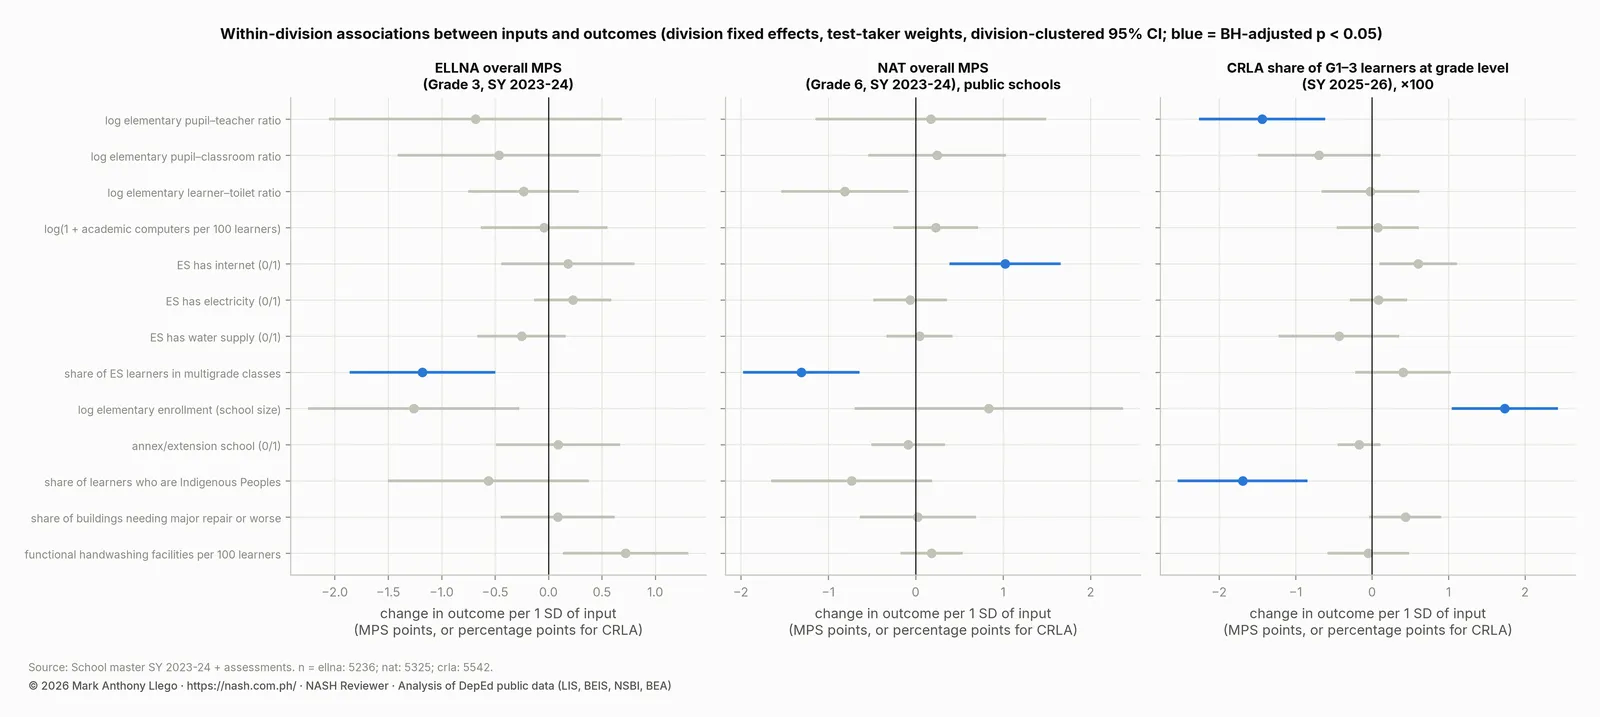
The honest answer is that most input ratios show small or no association once schools are compared within their division. Two inputs stand out: multigrade organization and internet access. The companion report, Philippine basic education in numbers, holds the method notes and every table.
Key findings
- Multigrade organization is the most consistent correlate of lower results: −1.2 Grade 3 ELLNA points and −1.3 Grade 6 NAT points per standard deviation of the multigrade share. That is about 4 points between a fully multigrade and a fully monograde school in the same division. The sign holds in every region and every alternative specification.
- Internet access at the elementary level is associated with better results: about +2.6 NAT points for a connected school against an unconnected one. Connected schools also have +1.5 percentage points more Grade 1 to 3 readers at grade level.
- The pupil-teacher ratio is associated with early reading but not, measurably, with Grade 3 or Grade 6 scores: −1.4 percentage points of readers at grade level per standard deviation. That is about four points between a school at 15 and one at 45 learners per teacher.
- Classrooms, toilets and computers per learner show no detectable association with any outcome once division and school size are held constant.
- Every association is small: the largest is 0.15 standard deviations of the outcome. Which division a school is in explains far more (an intraclass correlation of 0.22 to 0.25 for ELLNA and NAT).
- These are associations in observational data, not effects. Multigrade schools are small and remote, connected schools are urban, and the files measure neither poverty nor teacher quality.
Model design: three outcomes and thirteen inputs
The unit is the public elementary school. Three outcomes are modeled: the school’s ELLNA overall mean (5,236 schools), its NAT overall mean (5,325 schools) and its CRLA share of Grade 1 to 3 learners at grade level in percentage points (5,542 schools). Private schools have no input data and are excluded. Thirteen inputs enter together. They are the elementary pupil-teacher, pupil-classroom and learner-toilet ratios (logged), academic computers per 100 learners (log of 1 plus), and internet, electricity and water at the elementary level (yes/no). They also include the share of elementary learners in multigrade classes, log elementary enrollment, annex status and the share of Indigenous Peoples (IP) learners. The last two are the share of buildings needing major repair or worse and functional handwashing facilities per 100 learners.
Each model has division fixed effects, so every comparison is between schools in the same division. Divisions differ in language, in test administration and in how the assessed schools were selected, and the policy question is about allocation within a division. Observations are weighted by test-takers, so a school mean built on six learners counts less than one built on sixty. Standard errors are clustered by division (44 clusters).
Predictors are standardized, so each coefficient is the change in the outcome per one standard deviation of the input. In raw units, one standard deviation is about a 45% higher pupil-teacher ratio (22 to 32 learners per teacher), a 65% higher pupil-classroom ratio and an 83% higher learner-toilet ratio. It is also a 0.31 change in the multigrade share, a 2.6-fold change in enrollment and a 0.30 change in the Indigenous Peoples share. The p-values are Benjamini–Hochberg adjusted across the thirteen inputs within each outcome.
Estimates: which inputs are associated with ELLNA, NAT and CRLA results
| Input (per 1 SD) | ELLNA Grade 3 (MPS points) | NAT Grade 6 (MPS points) | CRLA Grades 1–3 (percentage points) |
|---|---|---|---|
| log elementary pupil–teacher ratio | -0.68 (-2.04 to +0.68) | +0.17 (-1.13 to +1.48) | -1.44 (-2.25 to -0.63) * |
| log elementary pupil–classroom ratio | -0.46 (-1.40 to +0.47) | +0.25 (-0.53 to +1.02) | -0.69 (-1.48 to +0.09) |
| log elementary learner–toilet ratio | -0.23 (-0.74 to +0.27) | -0.81 (-1.52 to -0.10) | -0.02 (-0.64 to +0.60) |
| log(1 + academic computers per 100 learners) | -0.04 (-0.62 to +0.54) | +0.23 (-0.24 to +0.70) | +0.07 (-0.45 to +0.59) |
| ES has internet (0/1) | +0.18 (-0.43 to +0.79) | +1.02 (+0.40 to +1.64) * | +0.61 (+0.12 to +1.09) |
| ES has electricity (0/1) | +0.23 (-0.12 to +0.58) | -0.06 (-0.47 to +0.34) | +0.09 (-0.27 to +0.44) |
| ES has water supply (0/1) | -0.25 (-0.65 to +0.15) | +0.05 (-0.32 to +0.41) | -0.43 (-1.21 to +0.34) |
| share of ES learners in multigrade classes | -1.18 (-1.85 to -0.51) * | -1.31 (-1.96 to -0.66) * | +0.40 (-0.20 to +1.01) |
| log elementary enrollment (school size) | -1.26 (-2.24 to -0.28) | +0.84 (-0.68 to +2.36) | +1.74 (+1.06 to +2.41) * |
| annex/extension school (0/1) | +0.09 (-0.48 to +0.66) | -0.09 (-0.49 to +0.32) | -0.17 (-0.43 to +0.09) |
| share of learners who are Indigenous Peoples | -0.56 (-1.49 to +0.37) | -0.73 (-1.64 to +0.17) | -1.69 (-2.52 to -0.86) * |
| share of buildings needing major repair or worse | +0.09 (-0.43 to +0.61) | +0.02 (-0.62 to +0.67) | +0.43 (-0.02 to +0.89) |
| functional handwashing facilities per 100 learners | +0.72 (+0.15 to +1.30) | +0.18 (-0.16 to +0.52) | -0.05 (-0.56 to +0.47) |
Reading the table by row:
- Pupil-teacher ratio. No detectable association with ELLNA (−0.7, interval −2.0 to +0.7) or NAT (+0.2, −1.1 to +1.5). There is a clear association with early reading: −1.4 percentage points of Grade 1 to 3 learners at grade level per standard deviation (−2.2 to −0.6). It is stable at −1.0 to −1.5 across every specification.
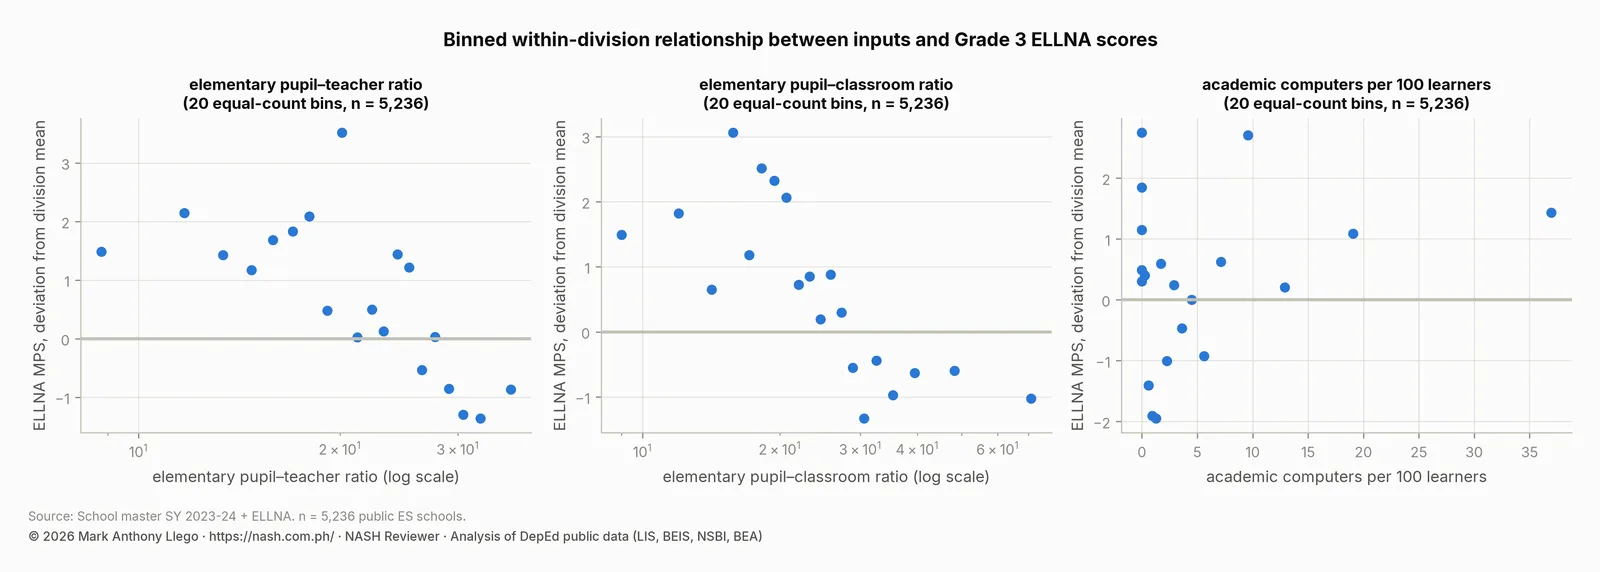
- Pupil-classroom and learner-toilet ratios. Intervals include zero for every outcome. The NAT learner-toilet coefficient (−0.8) is the nearest to significance (adjusted p = 0.11) and keeps its sign in all nine specifications. The binned chart below shows a gentle downward slope in ELLNA across both ratios, within about two points of the division mean. Small negative associations are therefore not ruled out, but large ones are.
- Computers per learner. Close to zero for every outcome in every specification, with or without winsorizing the counts.
- Internet. +1.0 NAT point per standard deviation (+0.4 to +1.6), which is about +2.6 points for a connected school against an unconnected one. Also +0.6 percentage points of early readers (adjusted p = 0.05), and a positive but imprecise ELLNA estimate. The sign holds in all five regions for NAT and CRLA.
- Electricity and water. No association. 99% of schools in the sample have both, so there is little variation to learn from.
- Multigrade share. −1.2 ELLNA points (−1.8 to −0.5) and −1.3 NAT points (−2.0 to −0.7) per standard deviation. The CRLA coefficient is positive and not significant. The sign holds in every region and in all 10 (ELLNA) and 9 (NAT) specifications. The interval excludes zero in 10 and 8 of them.
- School size. Larger schools score lower on ELLNA (−1.3 per standard deviation, borderline) and higher on CRLA (+1.7, clearly). The NAT estimate is imprecise.
- Indigenous Peoples share. Negative for all three outcomes and clearly so for CRLA (−1.7 percentage points per standard deviation).
- Annex status, building condition, handwashing. No association, except a borderline positive ELLNA association for handwashing facilities (+0.7, adjusted p = 0.06), which is most plausibly a marker of a well-run school.
How much the inputs explain
With division fixed effects, the models explain 37% (ELLNA), 32% (NAT) and 13% (CRLA) of the variance in school results. Most of that comes from the fixed effects. A random-intercept multilevel model gives the division’s share of the variance directly: 0.25 for ELLNA, 0.22 for NAT and 0.05 for CRLA. Where a school is matters more than any measured input. The input coefficients are modest: the largest standardized effect is 0.15 standard deviations of the outcome (school size on CRLA), and the multigrade effects are 0.08 to 0.09.
Checks: diagnostics, alternative specifications, subgroups and selection
Four kinds of check were run, and the headline results survive all of them.
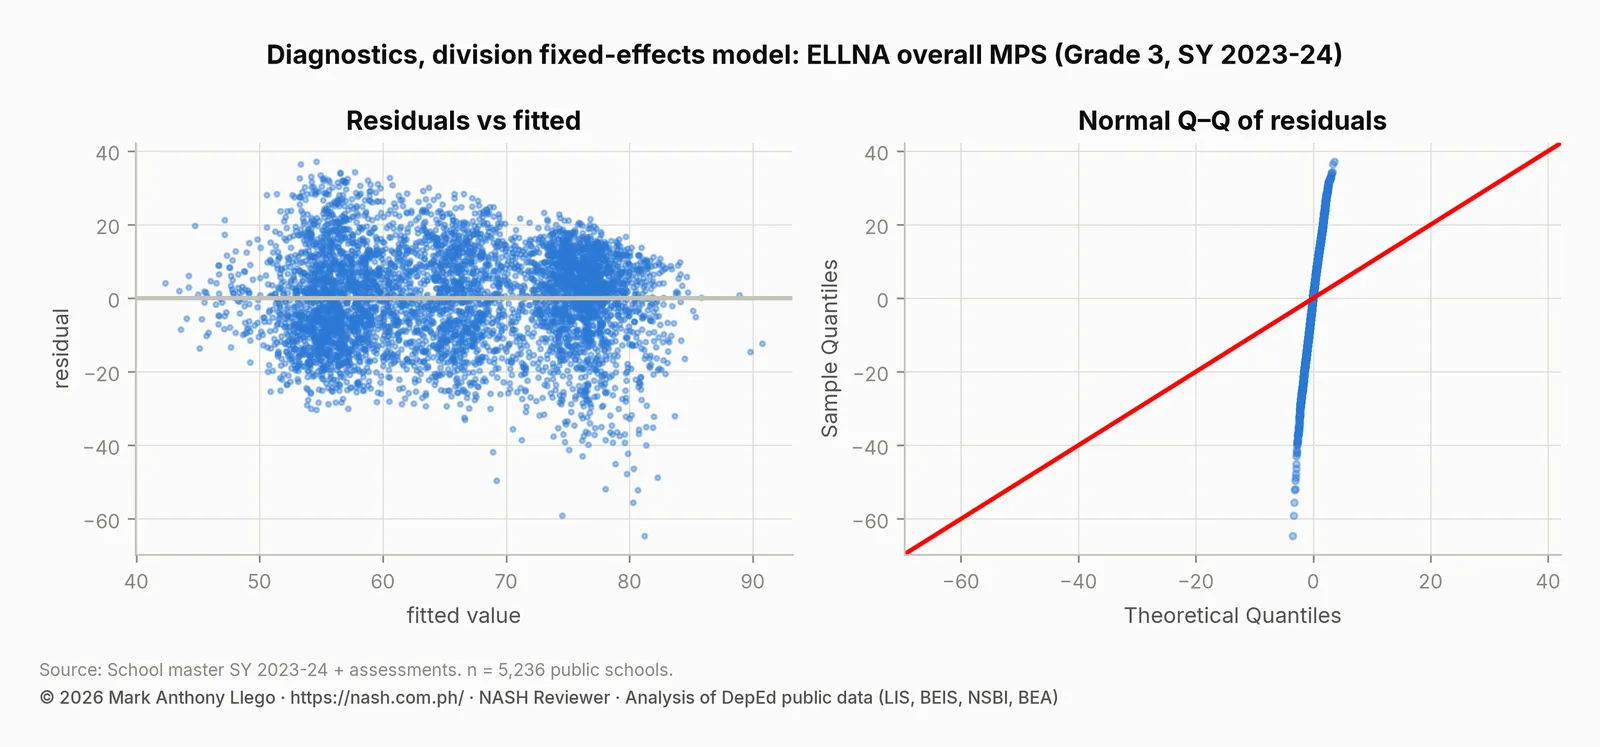
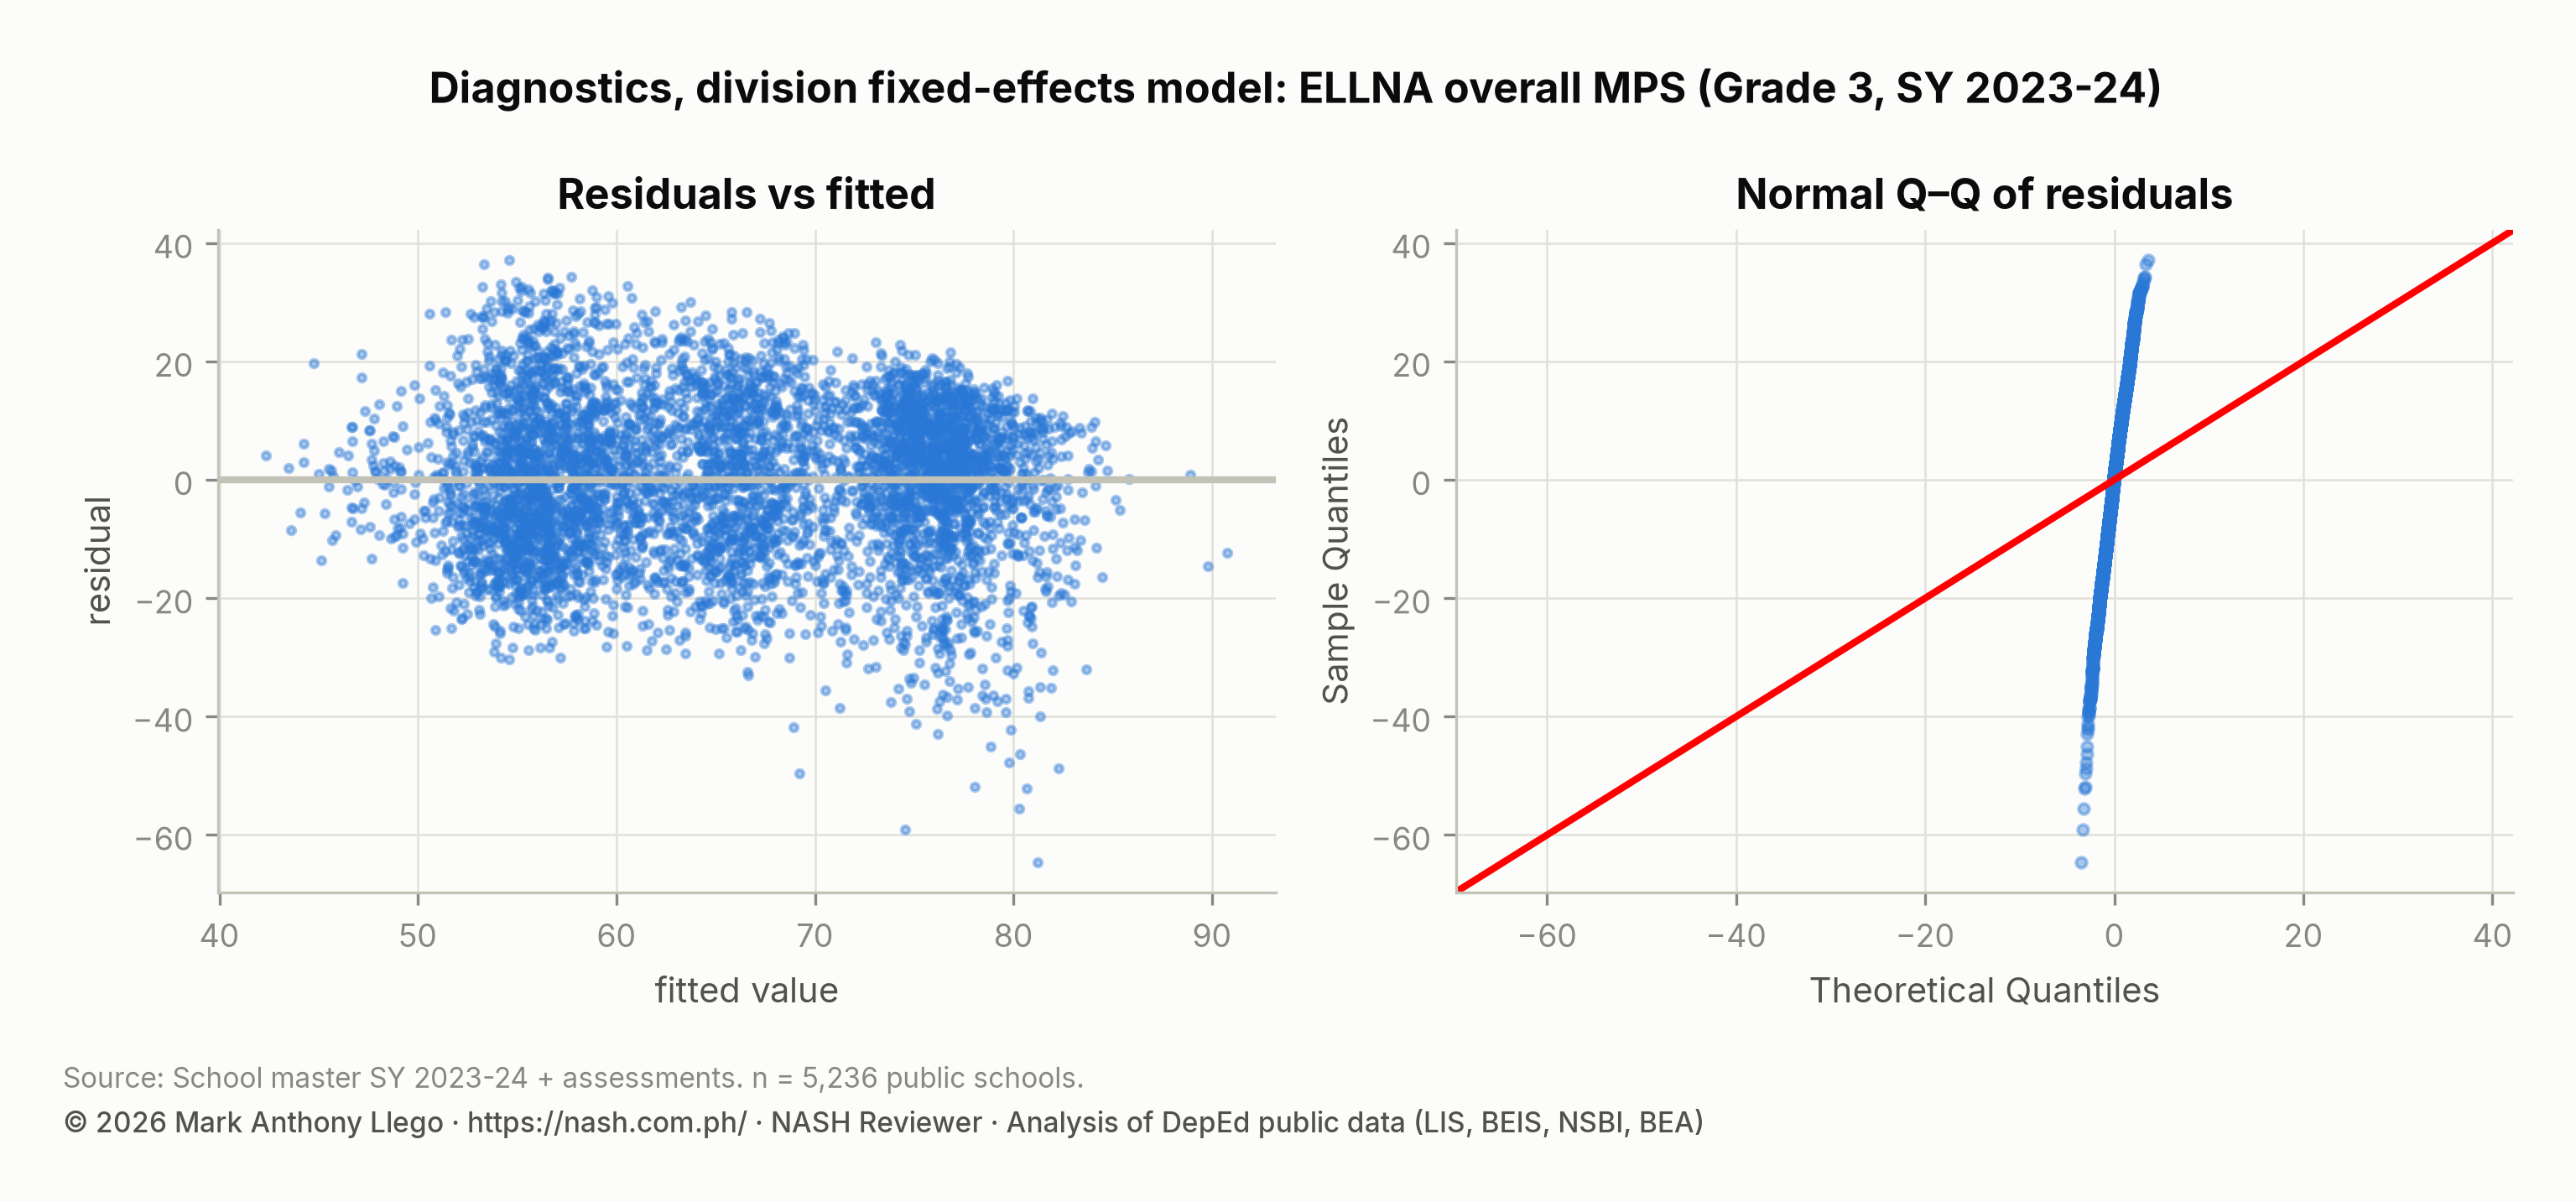
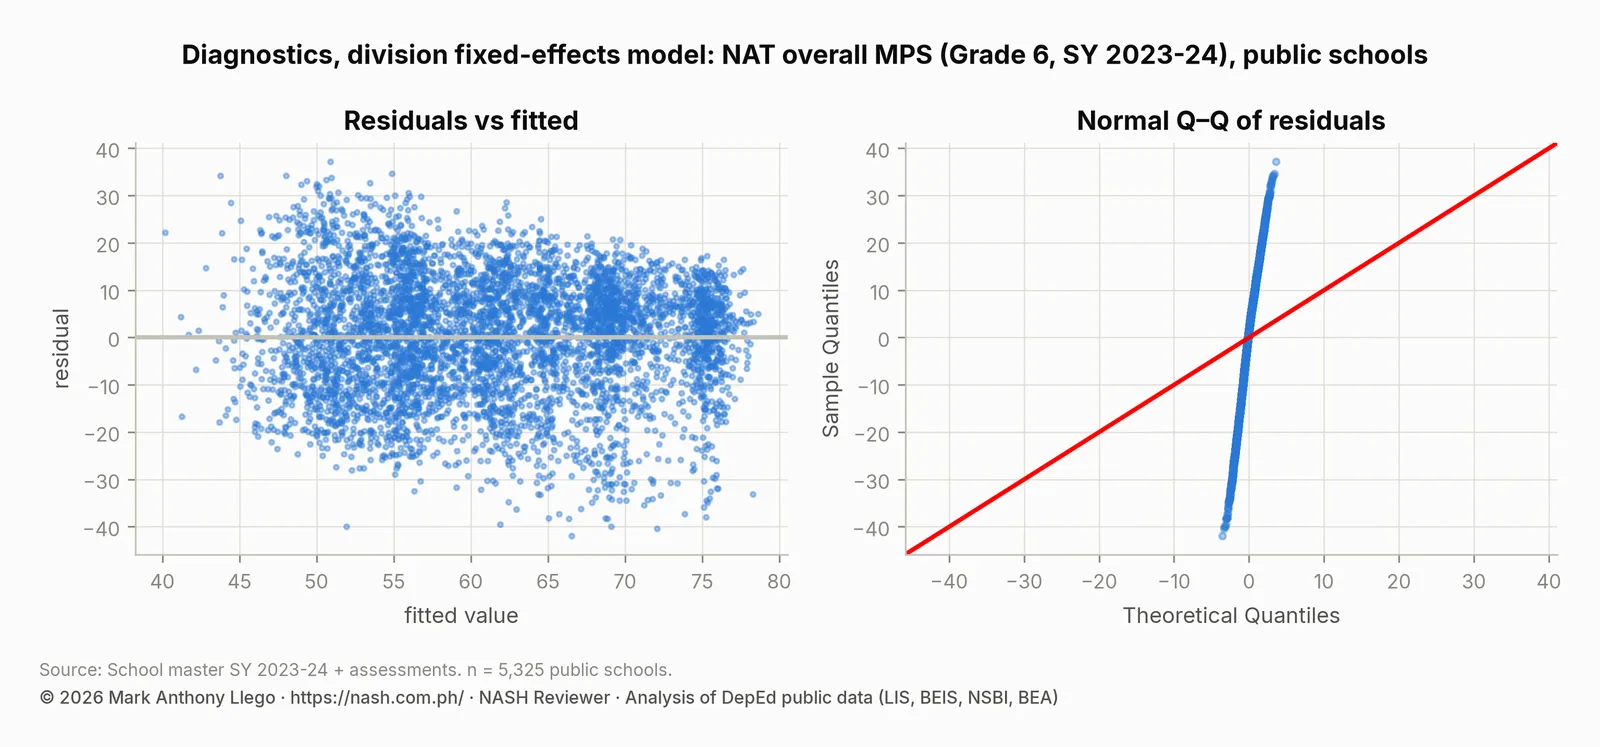
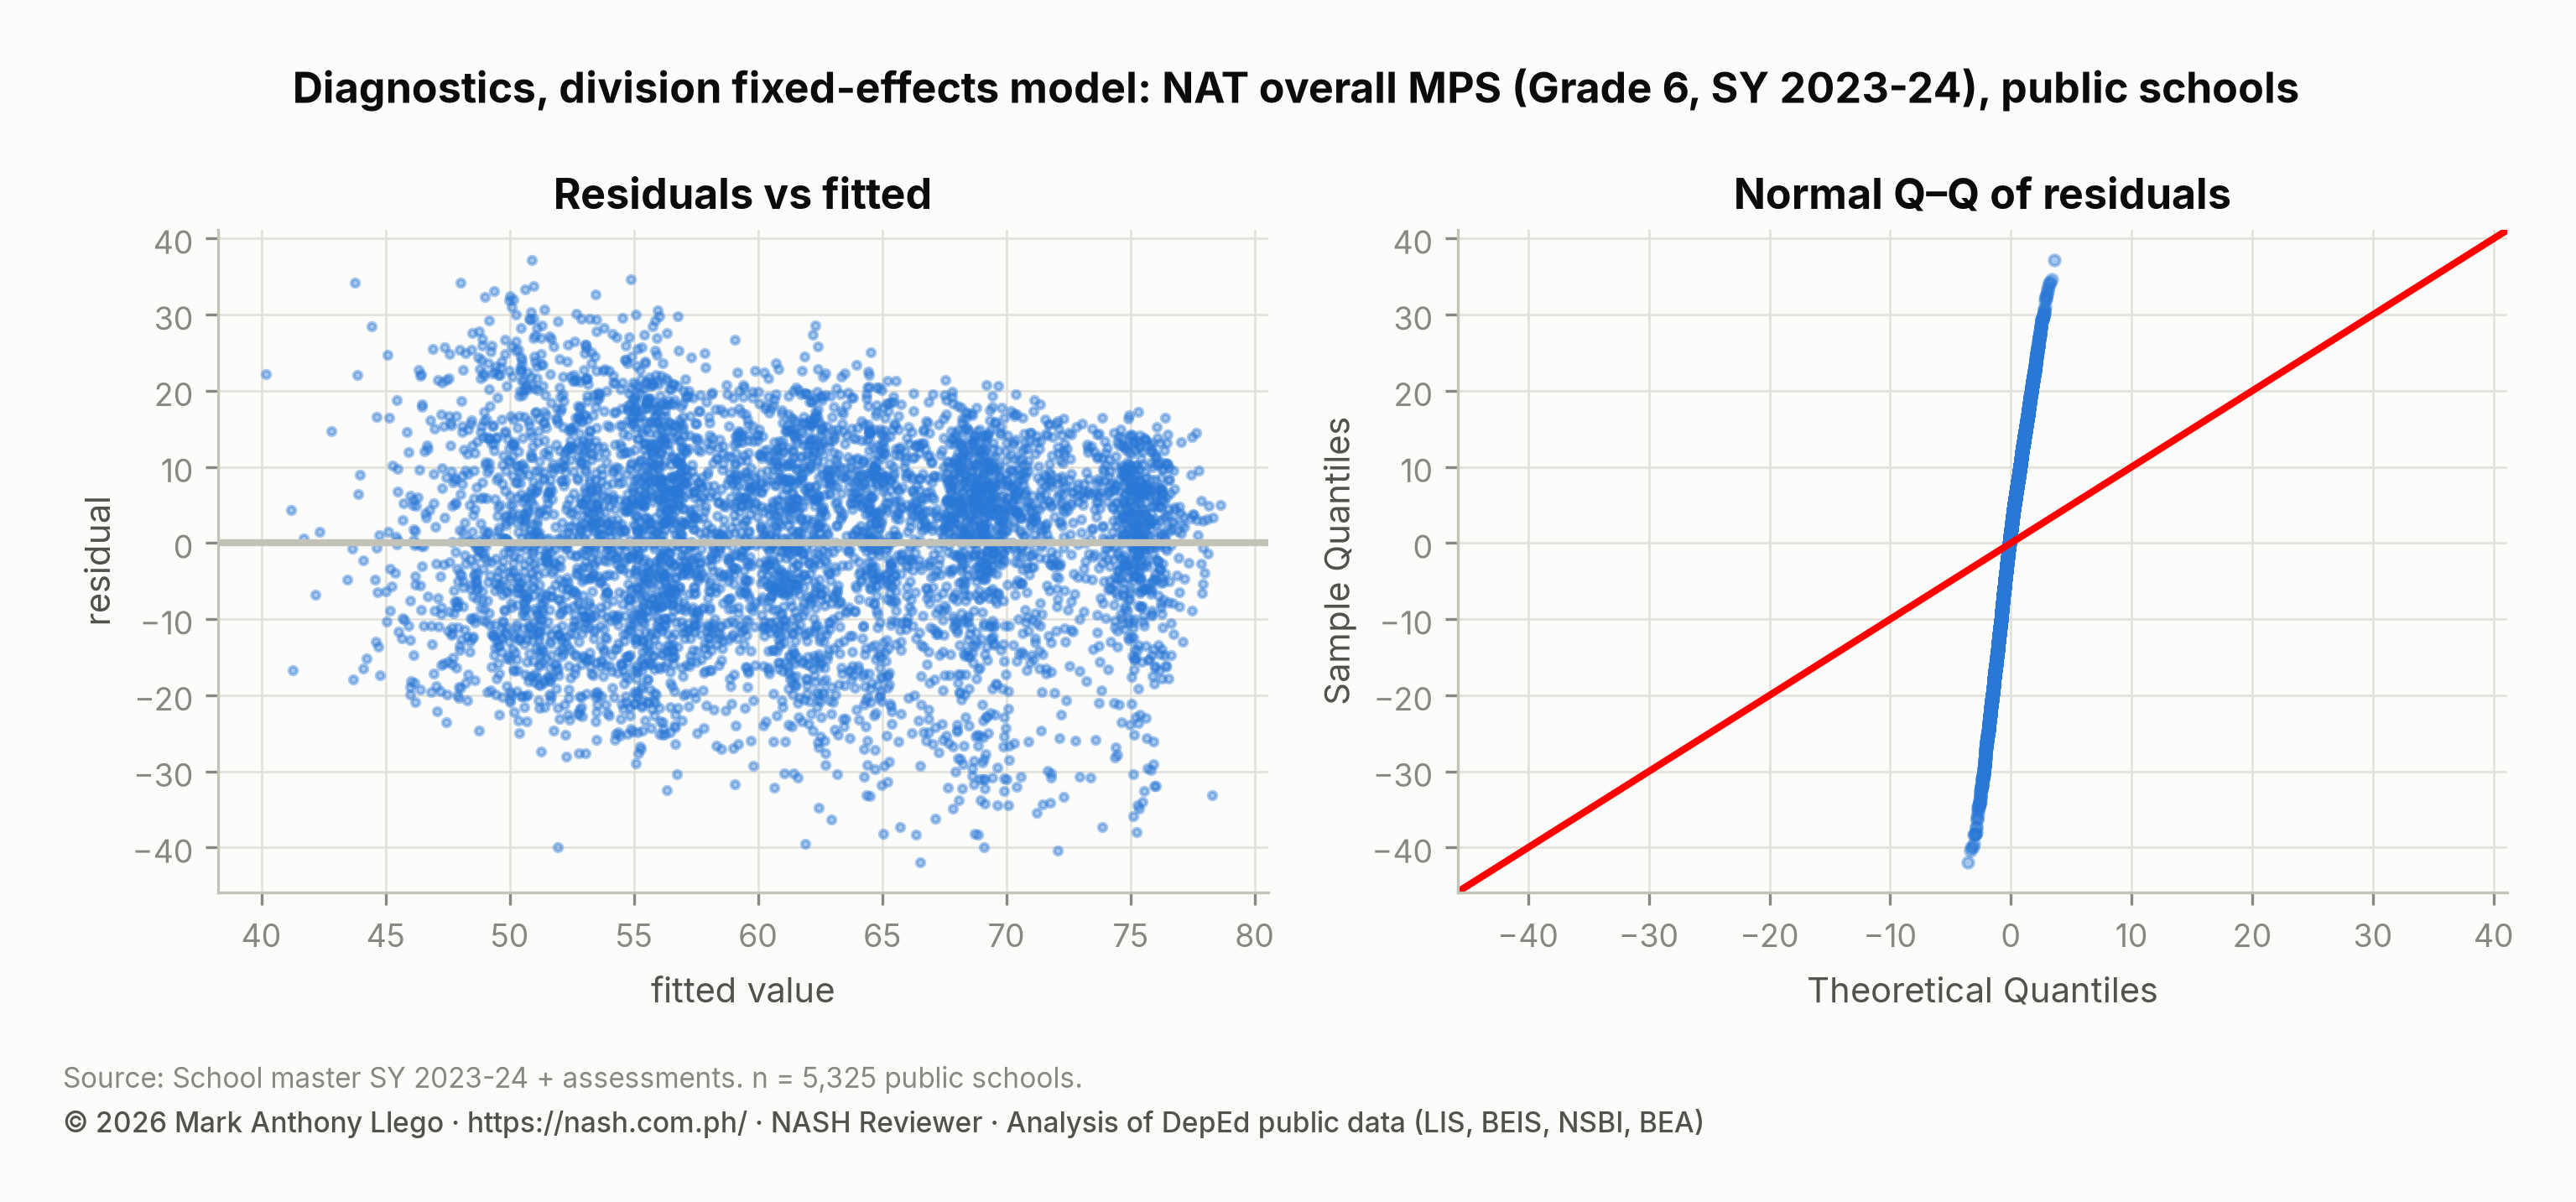
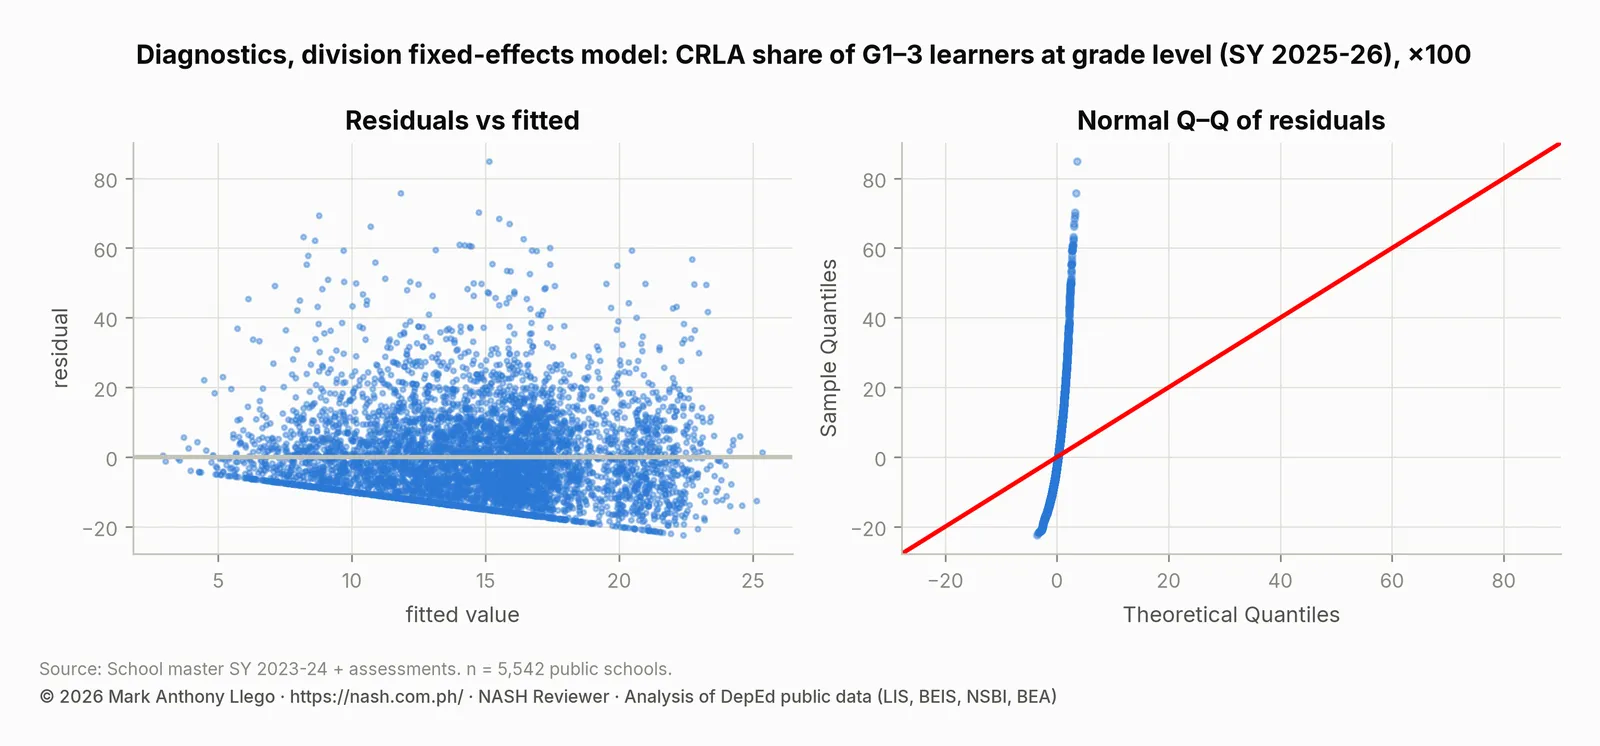
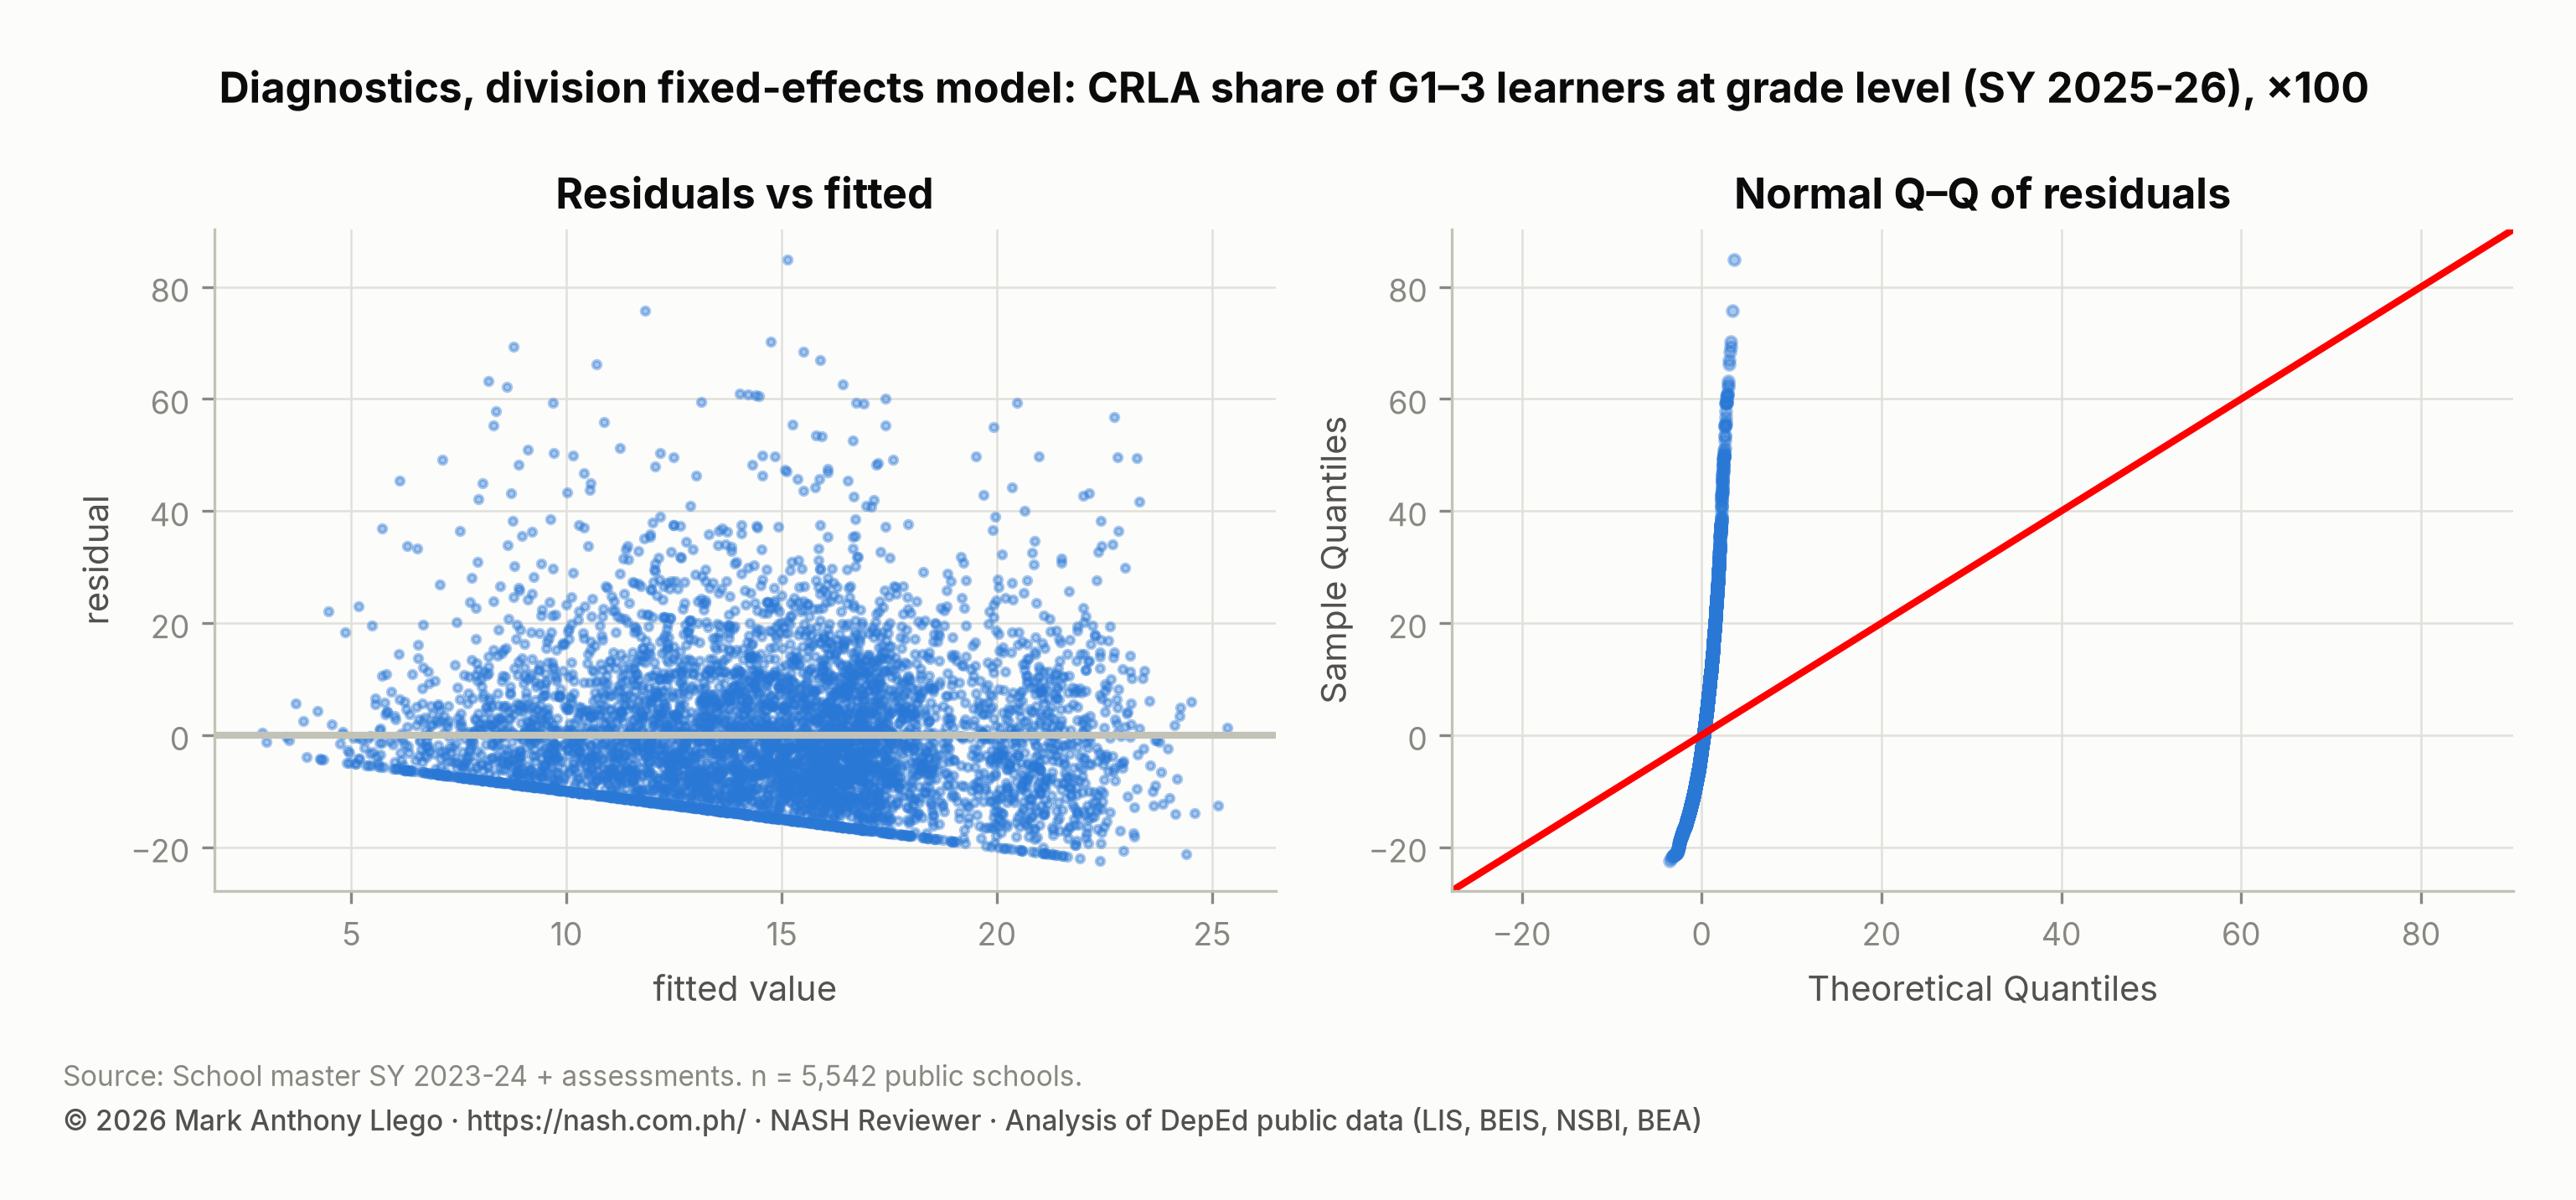
Diagnostics. The largest variance inflation factor is 4.0, so the inputs are not collinear enough to distort the estimates. Residuals are near-symmetric for ELLNA and NAT (skew −0.3) and right-skewed for CRLA, as a share bounded at zero will be. A binomial logit model for CRLA gives average marginal effects within 0.1 points of the linear ones. Dropping the 219 to 264 schools with the largest influence (Cook’s distance above 4/n) changes no reported coefficient by more than 0.2.
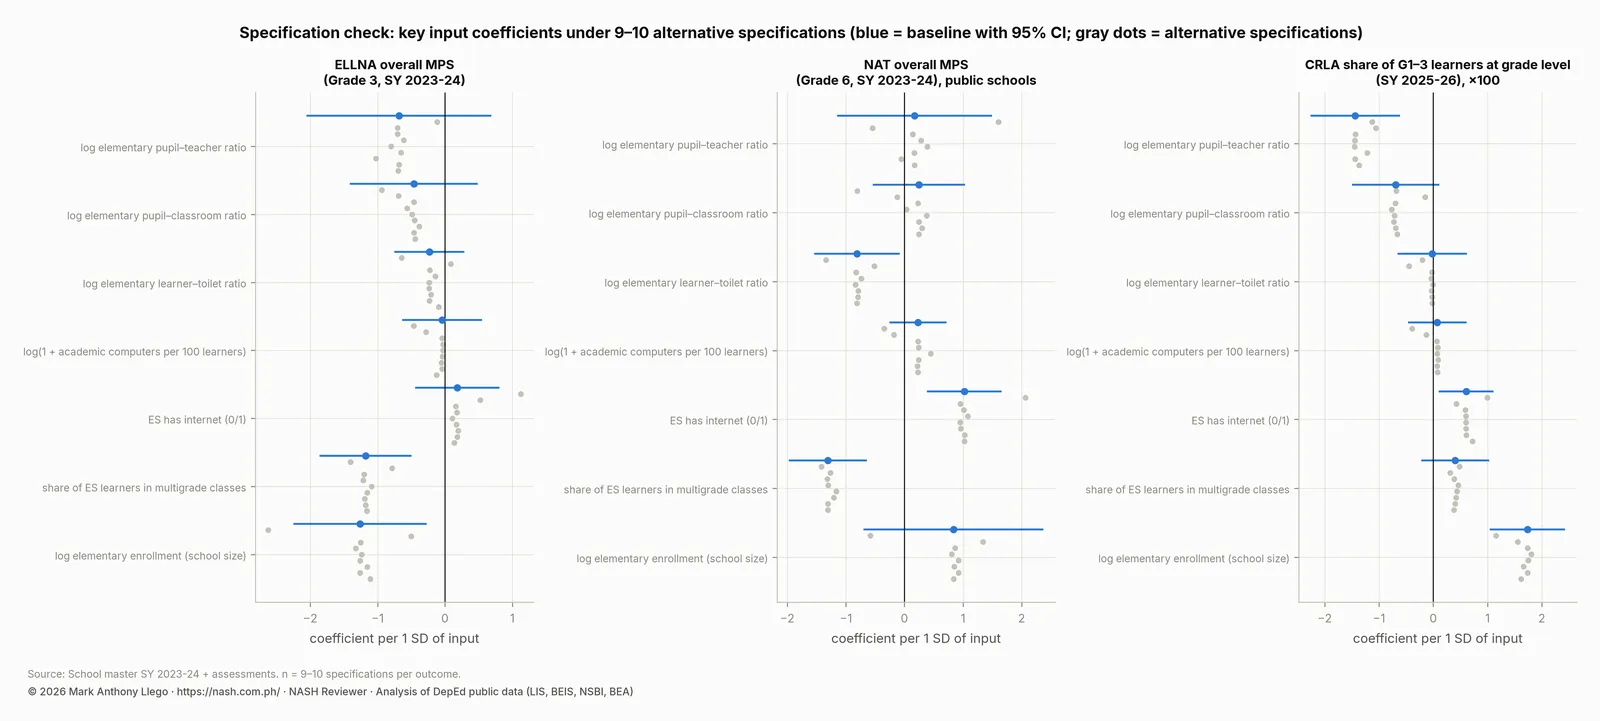
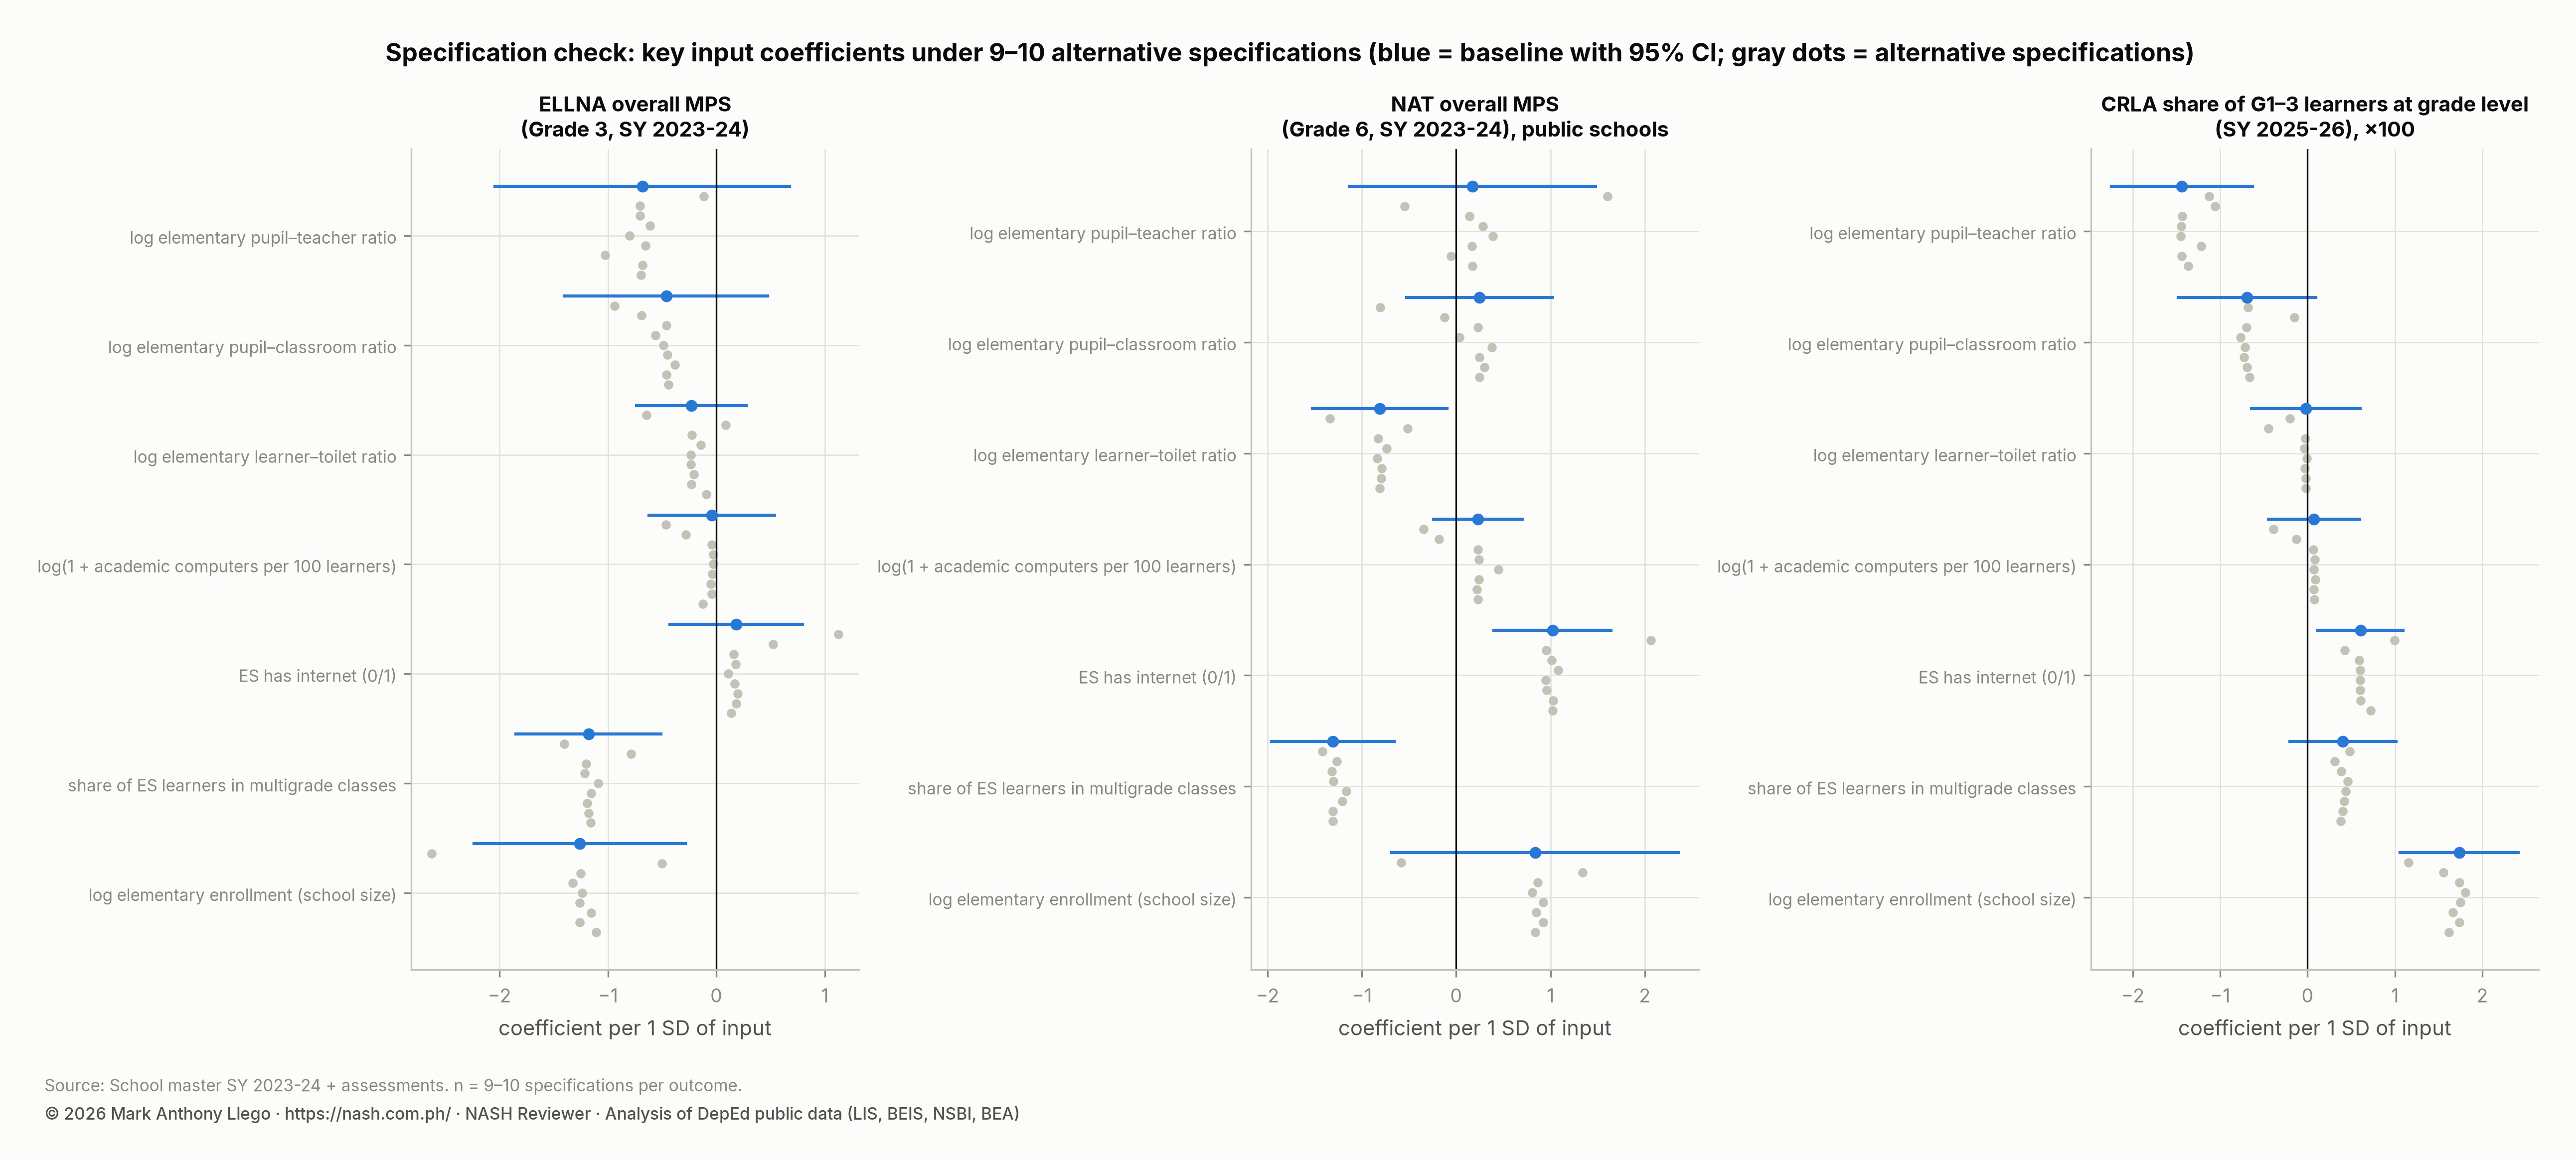
Alternative specifications. Each model was re-estimated in several ways: with region fixed effects instead of division, without weights, without annex schools, and without schools with implausible inputs (teachers or computers exceeding learners, or a pupil-teacher ratio outside 5 to 100). Further variants used a minimum number of test-takers, shrunk outcomes, a pupil-teacher ratio computed from nationally funded teachers only, raw instead of winsorized computer counts, language-of-assessment fixed effects for ELLNA, and a logit model for CRLA.
| Outcome | Input | Specifications | Same sign as baseline | CI excludes zero | Smallest coefficient | Largest coefficient |
|---|---|---|---|---|---|---|
| CRLA | ES has internet (0/1) | 9 | 9 | 8 | 0.42 | 0.99 |
| CRLA | log(1 + academic computers per 100 learners) | 9 | 7 | 0 | -0.39 | 0.09 |
| CRLA | log elementary enrollment (school size) | 9 | 9 | 9 | 1.16 | 1.81 |
| CRLA | log elementary learner–toilet ratio | 9 | 9 | 1 | -0.45 | -0.01 |
| CRLA | log elementary pupil–classroom ratio | 9 | 9 | 0 | -0.77 | -0.15 |
| CRLA | log elementary pupil–teacher ratio | 9 | 9 | 9 | -1.45 | -1.06 |
| CRLA | share of ES learners in multigrade classes | 9 | 9 | 0 | 0.31 | 0.48 |
| ELLNA | ES has internet (0/1) | 10 | 10 | 1 | 0.11 | 1.13 |
| ELLNA | log(1 + academic computers per 100 learners) | 10 | 10 | 0 | -0.46 | -0.03 |
| ELLNA | log elementary enrollment (school size) | 10 | 10 | 9 | -2.63 | -0.5 |
| ELLNA | log elementary learner–toilet ratio | 10 | 9 | 0 | -0.64 | 0.09 |
| ELLNA | log elementary pupil–classroom ratio | 10 | 10 | 1 | -0.94 | -0.38 |
| ELLNA | log elementary pupil–teacher ratio | 10 | 10 | 0 | -1.02 | -0.11 |
| ELLNA | share of ES learners in multigrade classes | 10 | 10 | 10 | -1.4 | -0.79 |
| NAT | ES has internet (0/1) | 9 | 9 | 8 | 0.95 | 2.07 |
| NAT | log(1 + academic computers per 100 learners) | 9 | 7 | 0 | -0.35 | 0.45 |
| NAT | log elementary enrollment (school size) | 9 | 8 | 1 | -0.58 | 1.34 |
| NAT | log elementary learner–toilet ratio | 9 | 9 | 6 | -1.34 | -0.52 |
| NAT | log elementary pupil–classroom ratio | 9 | 7 | 0 | -0.8 | 0.38 |
| NAT | log elementary pupil–teacher ratio | 9 | 7 | 0 | -0.54 | 1.61 |
| NAT | share of ES learners in multigrade classes | 9 | 9 | 8 | -1.42 | -1.17 |
Multigrade (ELLNA, NAT), internet (NAT, CRLA), school size (CRLA) and the pupil-teacher ratio (CRLA) keep their sign and significance in eight to ten specifications each. The pupil-teacher coefficient for NAT changes sign across specifications, which confirms there is no NAT association to report. Replacing division fixed effects with region fixed effects moves several coefficients by more than their intervals. The ELLNA internet coefficient moves from +0.2 to +1.1 and the NAT pupil-teacher coefficient from +0.2 to +1.6. That shows how much between-division confounding the within-division design removes.
Subgroups. When the models are re-fitted within each region, the multigrade sign holds in five of five regions for ELLNA, NAT and CRLA. The internet sign holds in five of five regions for NAT and CRLA. No reversal appears when the models are re-fitted by school-size tercile, so Simpson’s paradox is not concealing a different result.
Selection. The assessed schools are about half of the public elementary schools in their divisions, chosen by an unpublished rule. Compared with the non-assessed schools in the same 44 divisions, they are slightly larger (standardized difference +0.17) and slightly more crowded (+0.15 for teachers, +0.14 for classrooms). They have a lower share of Indigenous Peoples learners (−0.23). Every other input differs by less than 0.1. The subset is not strongly selected on inputs, but the outcomes of the non-assessed schools are unknown.
| Indicator | Assessed schools (mean) | Not assessed (mean) | Standardized difference |
|---|---|---|---|
| elementary enrollment | 289.81 | 232.97 | 0.17 |
| elementary PTR | 21.68 | 20.59 | 0.15 |
| elementary PCR | 27.29 | 24.86 | 0.14 |
| elementary LTR | 24 | 21.6 | 0.09 |
| computers per 100 | 6.12 | 7.31 | -0.08 |
| multigrade share | 0.15 | 0.16 | -0.05 |
| IP share | 0.15 | 0.23 | -0.23 |
| bad buildings share | 0.39 | 0.39 | 0.01 |
| handwash per 100 | 6 | 6.95 | -0.15 |
| ES internet (share) | 0.79 | 0.76 | 0.06 |
| ES electricity (share) | 0.98 | 0.99 | -0.03 |
| ES water (share) | 0.98 | 0.99 | -0.05 |
| annex school (share) | 0.01 | 0 | 0 |
What the results do not say
The results do not say that multigrade teaching lowers scores or that an internet connection raises them. Multigrade schools are small, remote and serve poorer communities. Connected schools are urban and better staffed in ways the files do not record. A policy that converts multigrade schools to monograde, or connects every school, might or might not move results; these data cannot tell. What they can say is where the gaps are. Multigrade schools, unconnected schools, schools with many Indigenous Peoples learners and, for early reading, schools with high pupil-teacher ratios lag their division neighbors after the measured inputs are held constant. Those are the schools where support is most likely to be needed.
What this means for school heads
- A multigrade school should plan for the gap. The association is the most consistent in the data. The Philippine Professional Standards for School Heads (PPSSH) strands on curriculum and teaching are where it is closed.
- Connectivity is the input with the clearest association. A school head can pursue a local government unit (LGU) line, a Department of Information and Communications Technology (DICT) free Wi-Fi site, or a DepEd connectivity program. A working connection has a measurable association with results; a box of tablets without one does not.
- Teacher items matter most in the early grades. The pupil-teacher ratio is associated with Grade 1 to 3 reading and with nothing else. A request for a teacher item is best made for the early grades.
- Compare within the division. Division explains a quarter of the variation in results. A regional or national comparison says less than a comparison with nearby schools.
How these numbers were made
- Source: the SY 2023-24 learner, personnel, facilities, ICT and WASH files joined on school ID to the NAT and ELLNA SY 2023-24 and CRLA SY 2025-26 selected-school files. The sample is public schools offering elementary with elementary learners and every input present.
- Model: weighted least squares with division fixed effects, test-taker weights and division-clustered standard errors; predictors standardized over the estimation sample. Random-intercept multilevel models (schools within divisions, region fixed effects) for the intraclass correlation.
- Multiple comparisons: Benjamini–Hochberg adjustment across the thirteen inputs within each outcome; the asterisk in the table marks an adjusted p-value below 0.05.
- Influence: Cook’s distance on the unweighted fixed-effects fit; the weighted model is refit without schools above 4/n.
- Every coefficient, interval and specification is in the tables behind the full report.
Limits
Inputs are SY 2023-24 stocks and the CRLA outcomes are from SY 2025-26. Outcomes are school means or shares, not learner scores; no statement about individual learners follows. The models control only for the inputs in the files; poverty, teacher qualifications and experience, language match and school leadership are absent. The sample is the assessed half of 44 divisions in five regions. All coefficients are associations.
Frequently asked questions
Does a lower pupil-teacher ratio improve DepEd test scores?
In these data, a lower ratio is associated with more Grade 1 to 3 learners reading at grade level. The difference is about four percentage points between a school at 15 and one at 45 learners per teacher. It shows no detectable association with Grade 3 ELLNA or Grade 6 NAT means once schools are compared within a division.
Do computers in DepEd schools improve learning?
Computers per learner show no association with any of the three outcomes once division, school size and internet access are held constant. Internet access does: about +2.6 NAT points for a connected school against an unconnected one.
Which school characteristic is most associated with low NAT and ELLNA scores?
The share of elementary learners in multigrade classes. A fully multigrade school scores about 4 points lower on both the ELLNA and the NAT than a fully monograde school in the same division. The association is consistent across every region and specification.
Download the data
The cleaned, harmonized DepEd files behind this series are free to download in CSV and Parquet, with a codebook and checksums, under the terms of use set out in the release. Download Cleaned DepEd School Data, SY 2017-18 to 2025-26 documents every file and column. The files themselves are at data.nash.com.ph, starting with the README, the SY 2023-24 school master file (CSV, 8.0 MB) and the nine-year enrollment panel (Parquet, 17.2 MB).
More in this series
- DepEd Enrollment Trends SY 2017-2018 to SY 2025-2026
- Enrollment by school year: SY 2017-18, SY 2018-19, SY 2019-20, SY 2020-21, SY 2021-22, SY 2022-23, SY 2023-24, SY 2024-25, SY 2025-26
- DepEd Learner Data SY 2023-2024: IP, ALIVE and School Size
- DepEd Teachers and School Personnel Data, SY 2023-2024
- DepEd Classroom and School Building Data, SY 2023-2024
- DepEd WASH Data SY 2023-2024: Toilets, Water, Electricity
- DepEd ICT Data SY 2023-2024: Computers and Internet
- NAT Grade 6 Results SY 2023-2024: DepEd Division Scores
- ELLNA Grade 3 Results SY 2023-2024: DepEd Division Scores
- CRLA Results SY 2025-2026: Reading Levels in Grades 1 to 3
- DepEd Open Data Quality: Errors, Blanks and Coverage Limits
- Download Cleaned DepEd School Data, SY 2017-18 to 2025-26
- The full report: Philippine basic education in numbers
Guides for aspiring school heads
- DepEd Data for Aspiring School Heads: Where to Start
- NASH Practice Questions With Answers: 50 Items on the PPSSH
- How to Read DepEd Data: A Guide for Aspiring School Heads
- EDCOM II Final Report: Guide for Aspiring School Heads
- National Education Plan 2026-2035: Guide for School Heads
- NASH Study Guide: DepEd Memorandum 069, s. 2025 and PPSSH
- PPSSH Domain 1: Leading Strategically With DepEd Data
- PPSSH Domain 2: Managing School Operations With DepEd Data
- PPSSH Domain 3: Teaching and Learning With DepEd Data
- PPSSH Domain 4: Developing Self and Others With DepEd Data
- PPSSH Domain 5: Building Connections With DepEd Data
Analysis and charts by Mark Anthony Llego for NASH Reviewer. Data: Department of Education public datasets. Charts may be reused only with written permission from support@nash.com.ph.