From DepEd’s public datasets
DepEd data: Philippine basic education in numbers
This report is an analysis of DepEd’s open data on Philippine basic education: enrollment by school from SY 2017-2018 to SY 2025-2026, the SY 2023-2024 school files, and three learning assessments. It shows how enrollment has changed by region, sector, grade and sex. It also shows how many teachers, classrooms and toilets public schools have, and how learners scored in the 44 divisions with published results. The assessments are the Grade 3 Early Language, Literacy, and Numeracy Assessment (ELLNA), the Grade 6 National Achievement Test (NAT) and the Grade 1–3 Comprehensive Rapid Literacy Assessment (CRLA). Every chart was computed from DepEd’s open data, and each chart comes with a table of its numbers.
The cleaned data behind every chart is free to download in CSV and Parquet, with a codebook, under DepEd’s terms of use. Download the cleaned data.
- Learners enrolled in SY 2025-26, all sectors, down from the 27.8M peak in SY 2022-23
- 25.9M
- Average change in enrollment per year since SY 2022-23
- −2.3%
- Pupil–teacher ratio in public schools, SY 2023-24 (learners per teacher)
- 25.5
- Share of Grade 1–3 learners reading at grade level in the 44 assessed divisions, CRLA SY 2025-26
- 15.7%
What the DepEd datasets cover
DepEd publishes school-level files from three systems: the Learner Information System (LIS) for enrollment, the Basic Education Information System (BEIS) and the National School Building Inventory (NSBI) for school profiles, and the Bureau of Education Assessment for test results.
| Dataset | Unit and size | Who it covers | Used for |
|---|---|---|---|
| Enrollment, SY 2017-18 to SY 2025-26 | One row per school; 60,129 to 61,923 schools a year | All sectors: public, private, SUC/LUC and Philippine Schools Overseas | Trends by region, sector, grade and sex; school openings and closures |
| Learner data, SY 2023-24 | 60,167 schools | All sectors | Enrollment by grade, learner types, multigrade classes |
| Personnel, Facilities, ICT and WASH, SY 2023-24 | 60,167 rows each; 47,818 with data | Public schools only (other rows are blank) | Pupil–teacher, pupil–classroom and learner–toilet ratios; computers, water, electricity, internet |
| NAT Grade 6, SY 2023-24 | 6,636 schools; 52,761 test-takers | 5 regions, 44 divisions; a sample of learners in each school (median 6) | School mean percentage scores by subject |
| ELLNA Grade 3, SY 2023-24 | 5,752 schools; 218,296 test-takers | The same 44 divisions; public schools; all learners tested | School mean percentage scores in English, Filipino, Numeracy and Mother Tongue |
| CRLA Grades 1–3, SY 2025-26 | 6,121 schools; 647,681 test-takers | The same 44 divisions; public schools | Counts of learners at each reading level by grade and language |
Two facts limit every finding. First, the assessment files cover only five regions: CAR, Region I, Region III, Region VIII and Region IX. Within those regions, they cover 44 of the 63 divisions and about half of the public Grade 3 schools. Second, the personnel, facilities, ICT (information and communications technology) and WASH (water, sanitation and hygiene) files hold a row for every school. They have data for public schools only, as the technical notes state.
School IDs match across files. The six SY 2023-24 files hold the same 60,167 schools, and every NAT and ELLNA school matches one of them. Over the nine years, 66,967 distinct school IDs appear, and 55,029 schools are present in every year.
Region boundaries changed during the period. ARMM became BARMM in SY 2019-20, and Cotabato City moved to BARMM in SY 2021-22. The Negros Island Region took 21 divisions from Regions VI and VII in SY 2024-25, and Sulu moved to Region IX in SY 2025-26. Every regional series on this page uses the SY 2025-26 boundaries, so each line compares the same places in every year.
Mark Anthony Llego analyzed the data and drew the charts for NASH Reviewer (https://nash.com.ph/). The report was published on 25 October 2026 from the datasets listed under Sources. The full pipeline, data dictionary and quality audit can be re-run from the raw files.
DepEd enrollment by school year, SY 2017-18 to SY 2025-26
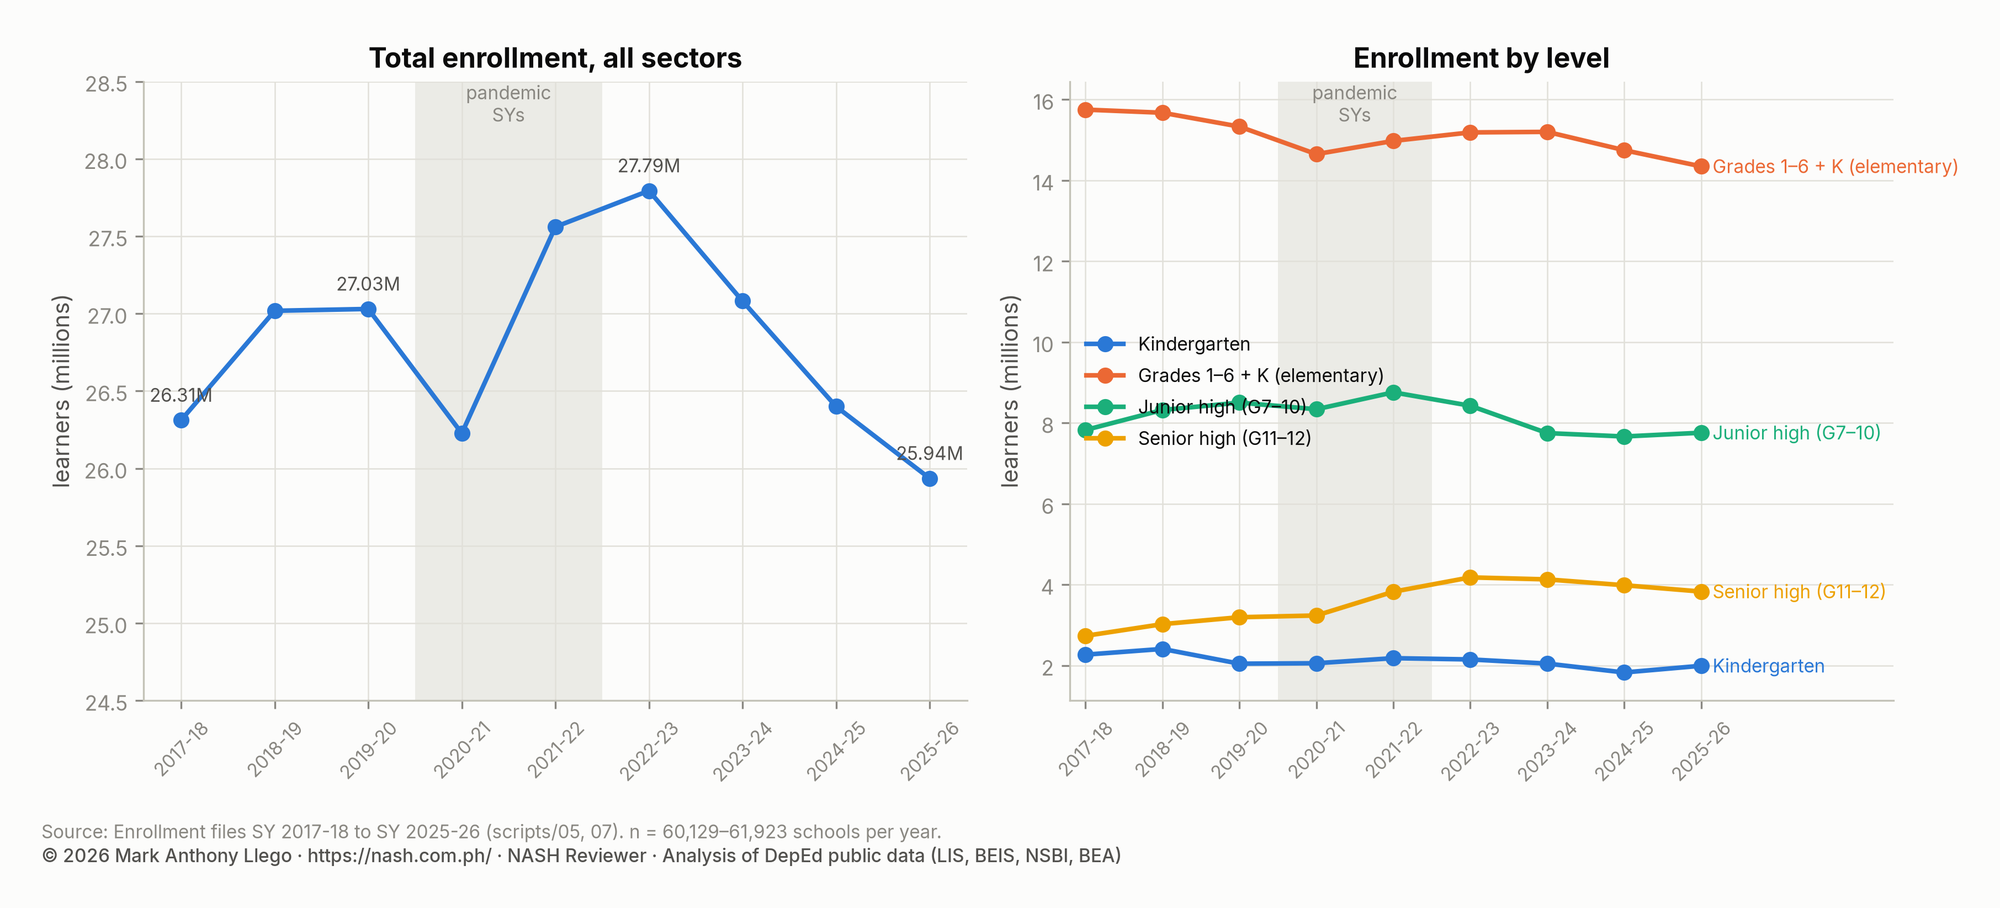
Enrollment in all sectors rose from 26.31 million in SY 2017-18 to 27.79 million in SY 2022-23. It has fallen every year since, to 25.94 million in SY 2025-26.
Show the data as a table
| School year | Schools | Total enrollment | Year-on-year | Kindergarten | Elementary (K–6) | Junior high | Senior high |
|---|---|---|---|---|---|---|---|
| 2017-18 | 61,563 | 26,311,949 | 2,268,455 | 15,752,075 | 7,826,414 | 2,733,460 | |
| 2018-19 | 61,916 | 27,018,509 | +2.7% | 2,409,782 | 15,675,041 | 8,320,627 | 3,022,841 |
| 2019-20 | 61,923 | 27,030,391 | +0.0% | 2,044,745 | 15,332,706 | 8,503,650 | 3,194,035 |
| 2020-21 | 60,957 | 26,227,022 | -3.0% | 2,055,635 | 14,650,804 | 8,339,391 | 3,236,827 |
| 2021-22 | 60,429 | 27,560,661 | +5.1% | 2,181,189 | 14,977,991 | 8,757,957 | 3,824,713 |
| 2022-23 | 60,137 | 27,794,282 | +0.8% | 2,149,891 | 15,188,435 | 8,426,203 | 4,179,644 |
| 2023-24 | 60,167 | 27,081,292 | -2.6% | 2,047,356 | 15,201,951 | 7,749,265 | 4,130,076 |
| 2024-25 | 60,129 | 26,400,182 | -2.5% | 1,827,258 | 14,748,764 | 7,665,606 | 3,985,812 |
| 2025-26 | 60,204 | 25,935,863 | -1.8% | 1,993,117 | 14,348,159 | 7,758,408 | 3,829,296 |
Show the data as a table
| School year | Schools | Total enrollment | Year-on-year | Kindergarten | Elementary (K–6) | Junior high | Senior high |
|---|---|---|---|---|---|---|---|
| 2017-18 | 61,563 | 26,311,949 | 2,268,455 | 15,752,075 | 7,826,414 | 2,733,460 | |
| 2018-19 | 61,916 | 27,018,509 | +2.7% | 2,409,782 | 15,675,041 | 8,320,627 | 3,022,841 |
| 2019-20 | 61,923 | 27,030,391 | +0.0% | 2,044,745 | 15,332,706 | 8,503,650 | 3,194,035 |
| 2020-21 | 60,957 | 26,227,022 | -3.0% | 2,055,635 | 14,650,804 | 8,339,391 | 3,236,827 |
| 2021-22 | 60,429 | 27,560,661 | +5.1% | 2,181,189 | 14,977,991 | 8,757,957 | 3,824,713 |
| 2022-23 | 60,137 | 27,794,282 | +0.8% | 2,149,891 | 15,188,435 | 8,426,203 | 4,179,644 |
| 2023-24 | 60,167 | 27,081,292 | -2.6% | 2,047,356 | 15,201,951 | 7,749,265 | 4,130,076 |
| 2024-25 | 60,129 | 26,400,182 | -2.5% | 1,827,258 | 14,748,764 | 7,665,606 | 3,985,812 |
| 2025-26 | 60,204 | 25,935,863 | -1.8% | 1,993,117 | 14,348,159 | 7,758,408 | 3,829,296 |
Show the data as a table
| School year | Schools | Total enrollment | Year-on-year | Kindergarten | Elementary (K–6) | Junior high | Senior high |
|---|---|---|---|---|---|---|---|
| 2017-18 | 61,563 | 26,311,949 | 2,268,455 | 15,752,075 | 7,826,414 | 2,733,460 | |
| 2018-19 | 61,916 | 27,018,509 | +2.7% | 2,409,782 | 15,675,041 | 8,320,627 | 3,022,841 |
| 2019-20 | 61,923 | 27,030,391 | +0.0% | 2,044,745 | 15,332,706 | 8,503,650 | 3,194,035 |
| 2020-21 | 60,957 | 26,227,022 | -3.0% | 2,055,635 | 14,650,804 | 8,339,391 | 3,236,827 |
| 2021-22 | 60,429 | 27,560,661 | +5.1% | 2,181,189 | 14,977,991 | 8,757,957 | 3,824,713 |
| 2022-23 | 60,137 | 27,794,282 | +0.8% | 2,149,891 | 15,188,435 | 8,426,203 | 4,179,644 |
| 2023-24 | 60,167 | 27,081,292 | -2.6% | 2,047,356 | 15,201,951 | 7,749,265 | 4,130,076 |
| 2024-25 | 60,129 | 26,400,182 | -2.5% | 1,827,258 | 14,748,764 | 7,665,606 | 3,985,812 |
| 2025-26 | 60,204 | 25,935,863 | -1.8% | 1,993,117 | 14,348,159 | 7,758,408 | 3,829,296 |
Over the eight years, the compound change in enrollment is −0.18% a year. The year-by-year changes say more than the average. Enrollment grew 1.4% a year before the pandemic, fell 3.0% in SY 2020-21 and rebounded 5.1% in SY 2021-22. Since SY 2022-23 it has fallen 2.3% a year. Excluding the two pandemic years from a fitted trend changes the long-run rate by only 0.03 points, so the pandemic does not explain the decline.
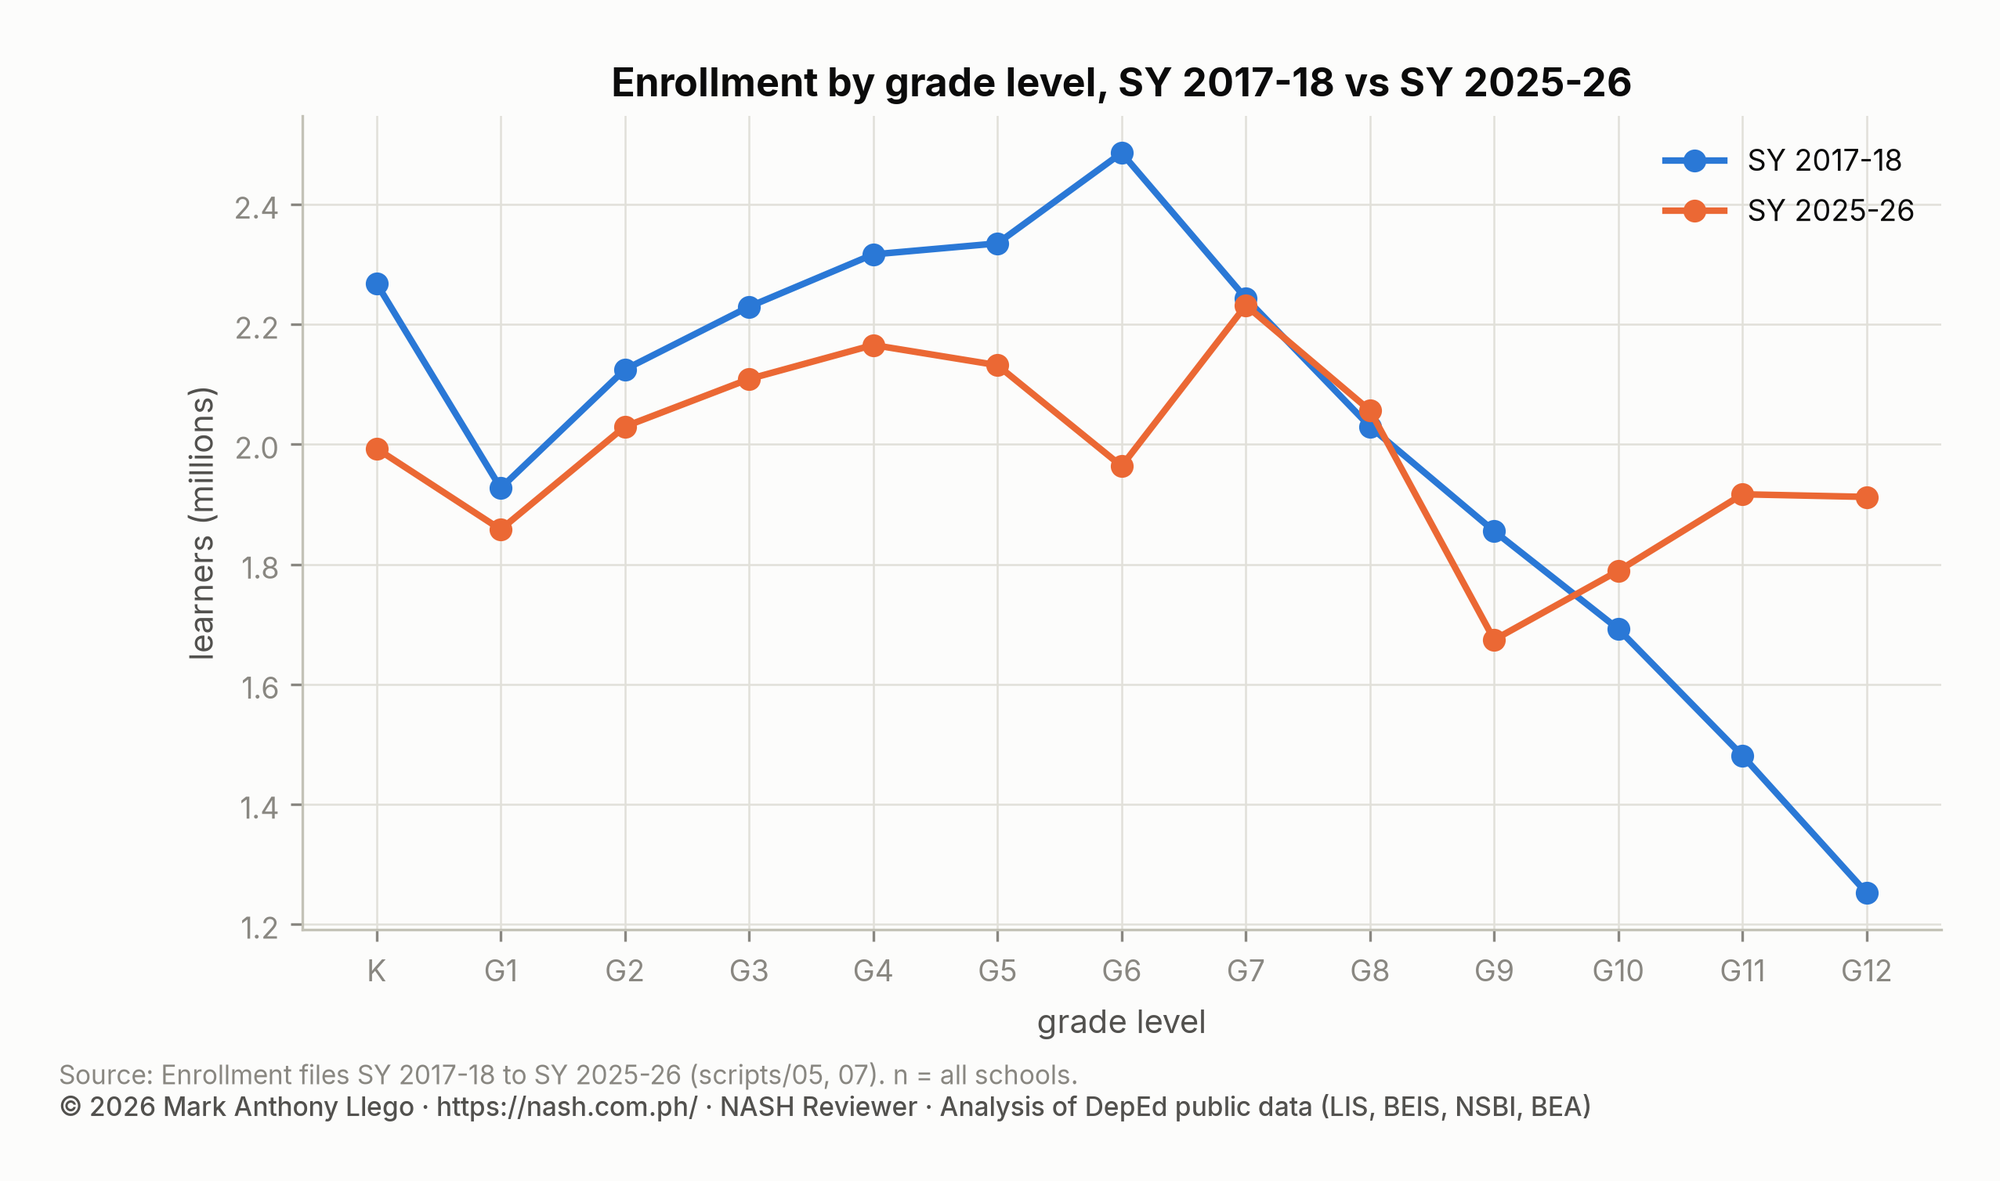
Kindergarten enrollment fell from 2.27 million to 1.99 million, or 1.6% a year, which is consistent with fewer births. Those smaller cohorts are now moving up through the elementary grades. Elementary enrollment is 14.3 million, 1.4 million below SY 2017-18.
Senior high school is the only level that grew. It rose from 2.73 million to 3.83 million, or 4.3% a year, as the first full cohorts moved through Grades 11 and 12. Senior high also accounted for most of the SY 2021-22 rebound: it added 588,000 learners in that one year.
The SY 2025-26 file leaves out 46 schools that reported no enrollment. Their SY 2024-25 total was about 465 learners, too small to change any figure on this page.
Enrollment in public and private schools
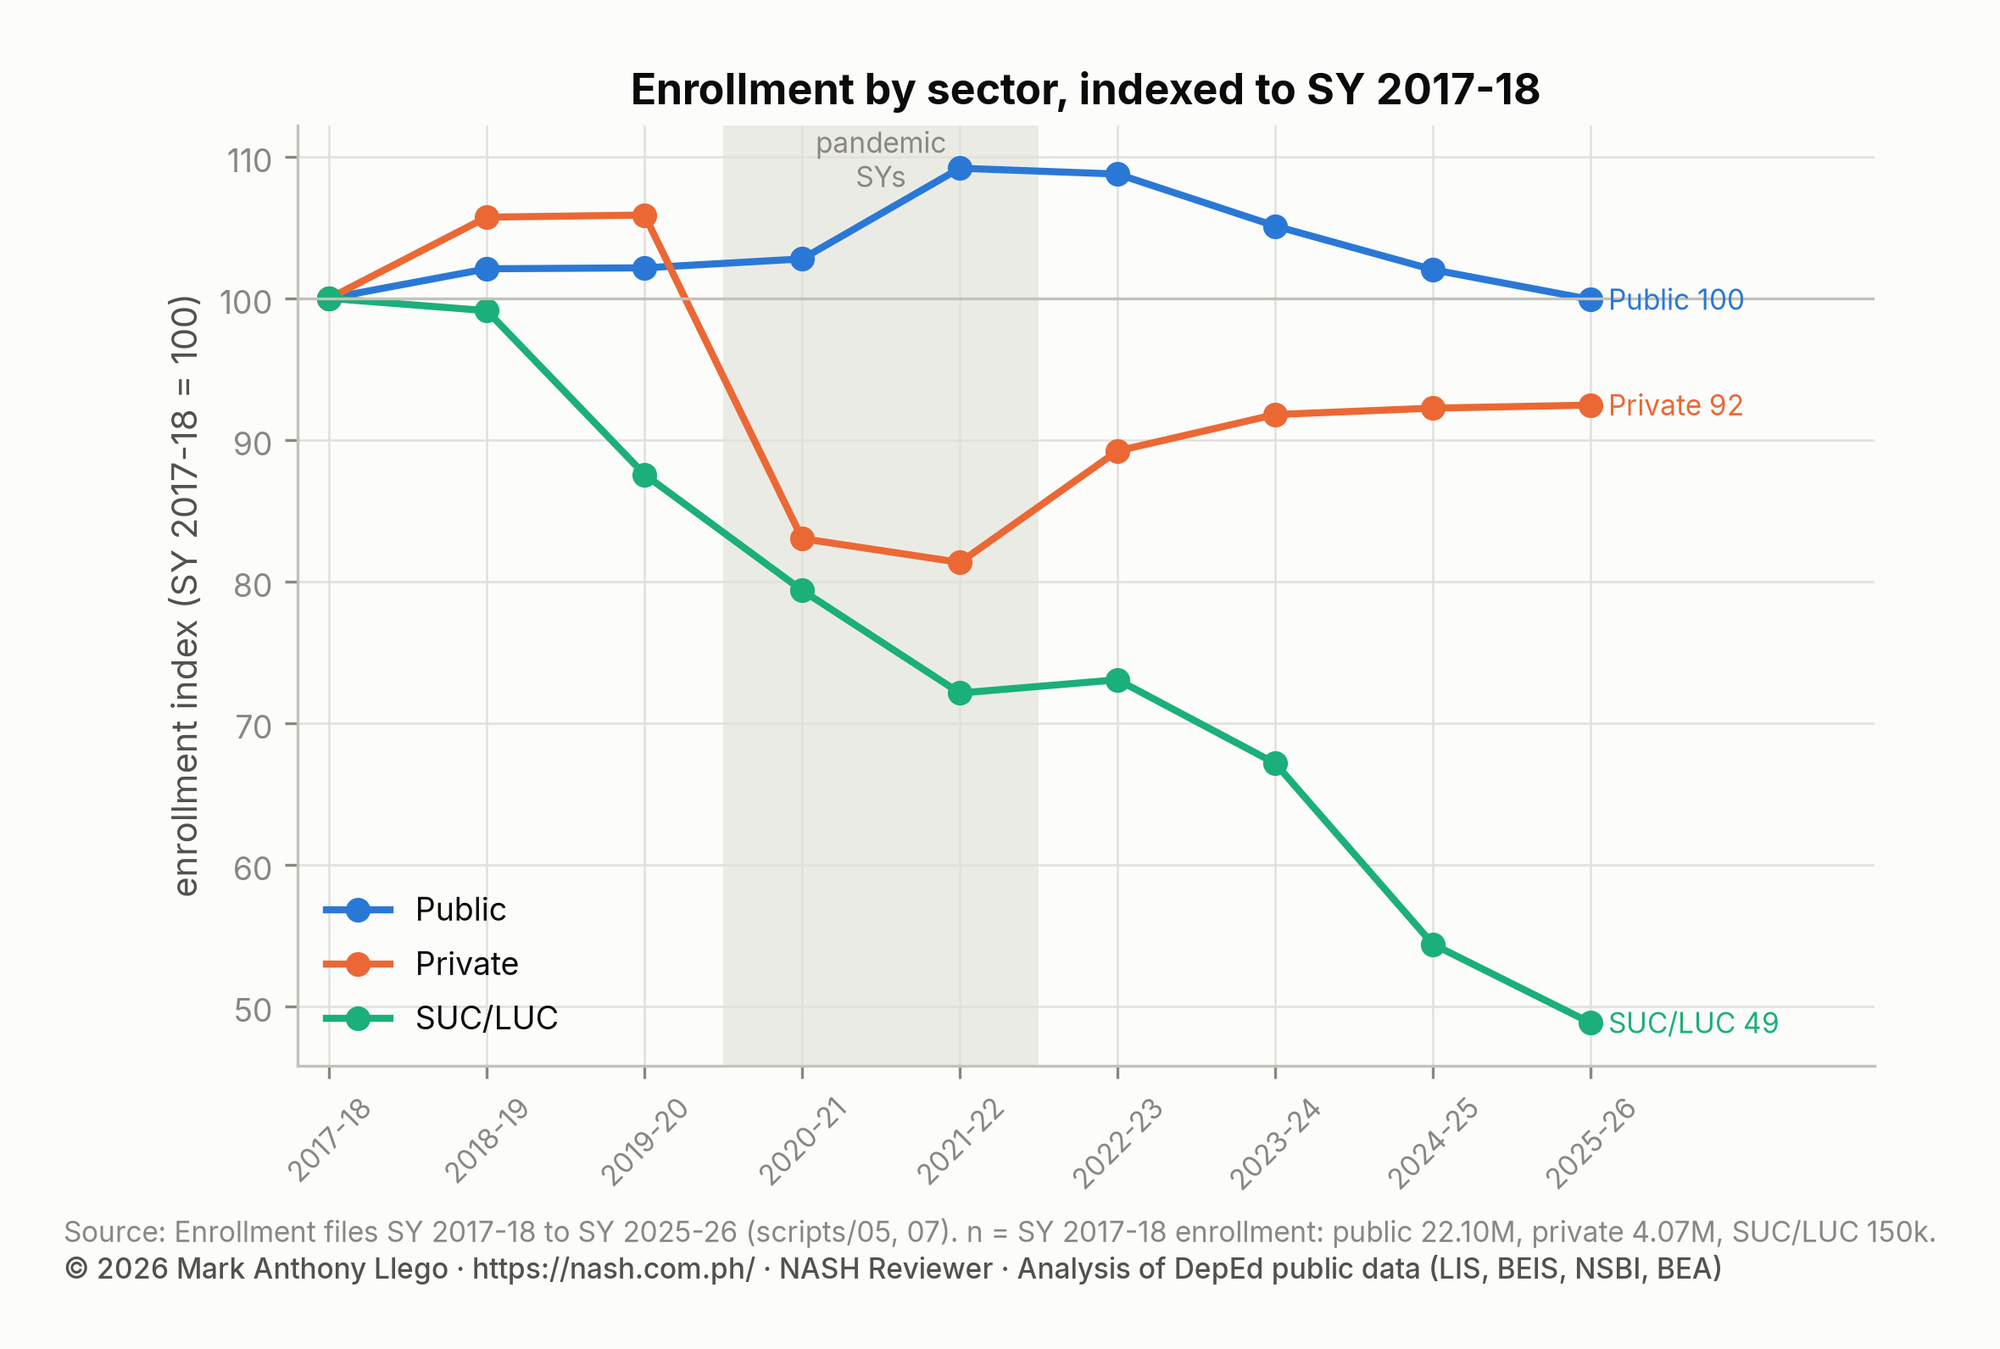
The pandemic moved learners from private schools to public schools. Only part of that movement has reversed.
Show the data as a table
| School year | Public | Private | SUC/LUC | PSO | Private share |
|---|---|---|---|---|---|
| 2017-18 | 22,096,820 | 4,065,515 | 149,614 | 15.5% | |
| 2018-19 | 22,558,138 | 4,298,566 | 148,313 | 13,492 | 15.9% |
| 2019-20 | 22,572,923 | 4,304,676 | 131,006 | 21,786 | 15.9% |
| 2020-21 | 22,712,409 | 3,375,748 | 118,755 | 20,110 | 12.9% |
| 2021-22 | 24,127,495 | 3,307,342 | 107,912 | 17,912 | 12.0% |
| 2022-23 | 24,036,251 | 3,627,506 | 109,314 | 21,211 | 13.1% |
| 2023-24 | 23,225,427 | 3,731,936 | 100,481 | 23,448 | 13.8% |
| 2024-25 | 22,543,711 | 3,750,251 | 81,365 | 24,855 | 14.2% |
| 2025-26 | 22,078,460 | 3,758,971 | 73,060 | 25,372 | 14.5% |
Show the data as a table
| School year | Public schools entering | Private schools entering | Public schools exiting after this year | Private schools exiting after this year |
|---|---|---|---|---|
| 2017-18 | 283 | 420 | ||
| 2018-19 | 496 | 552 | 411 | 581 |
| 2019-20 | 574 | 454 | 263 | 1,422 |
| 2020-21 | 496 | 243 | 263 | 833 |
| 2021-22 | 395 | 201 | 204 | 638 |
| 2022-23 | 329 | 226 | 291 | 394 |
| 2023-24 | 431 | 295 | 204 | 404 |
| 2024-25 | 358 | 230 | 169 | 295 |
| 2025-26 | 326 | 224 |
| Transition | Growth, all schools | Growth, same schools in both years | Schools in both years |
|---|---|---|---|
| 2017-18 → 2018-19 | +2.69% | +2.35% | 60,839 |
| 2018-19 → 2019-20 | +0.04% | -0.19% | 60,882 |
| 2019-20 → 2020-21 | -2.97% | -2.97% | 60,212 |
| 2020-21 → 2021-22 | +5.08% | +5.00% | 59,828 |
| 2021-22 → 2022-23 | +0.85% | +0.75% | 59,577 |
| 2022-23 → 2023-24 | -2.57% | -2.76% | 59,438 |
| 2023-24 → 2024-25 | -2.52% | -2.60% | 59,537 |
| 2024-25 → 2025-26 | -1.76% | -1.93% | 59,653 |
The private share of enrollment was 15.9% in SY 2019-20, 12.0% in SY 2021-22 and 14.5% in SY 2025-26. Private enrollment in SY 2025-26 is 3.76 million, still 13% below its SY 2019-20 level of 4.30 million.
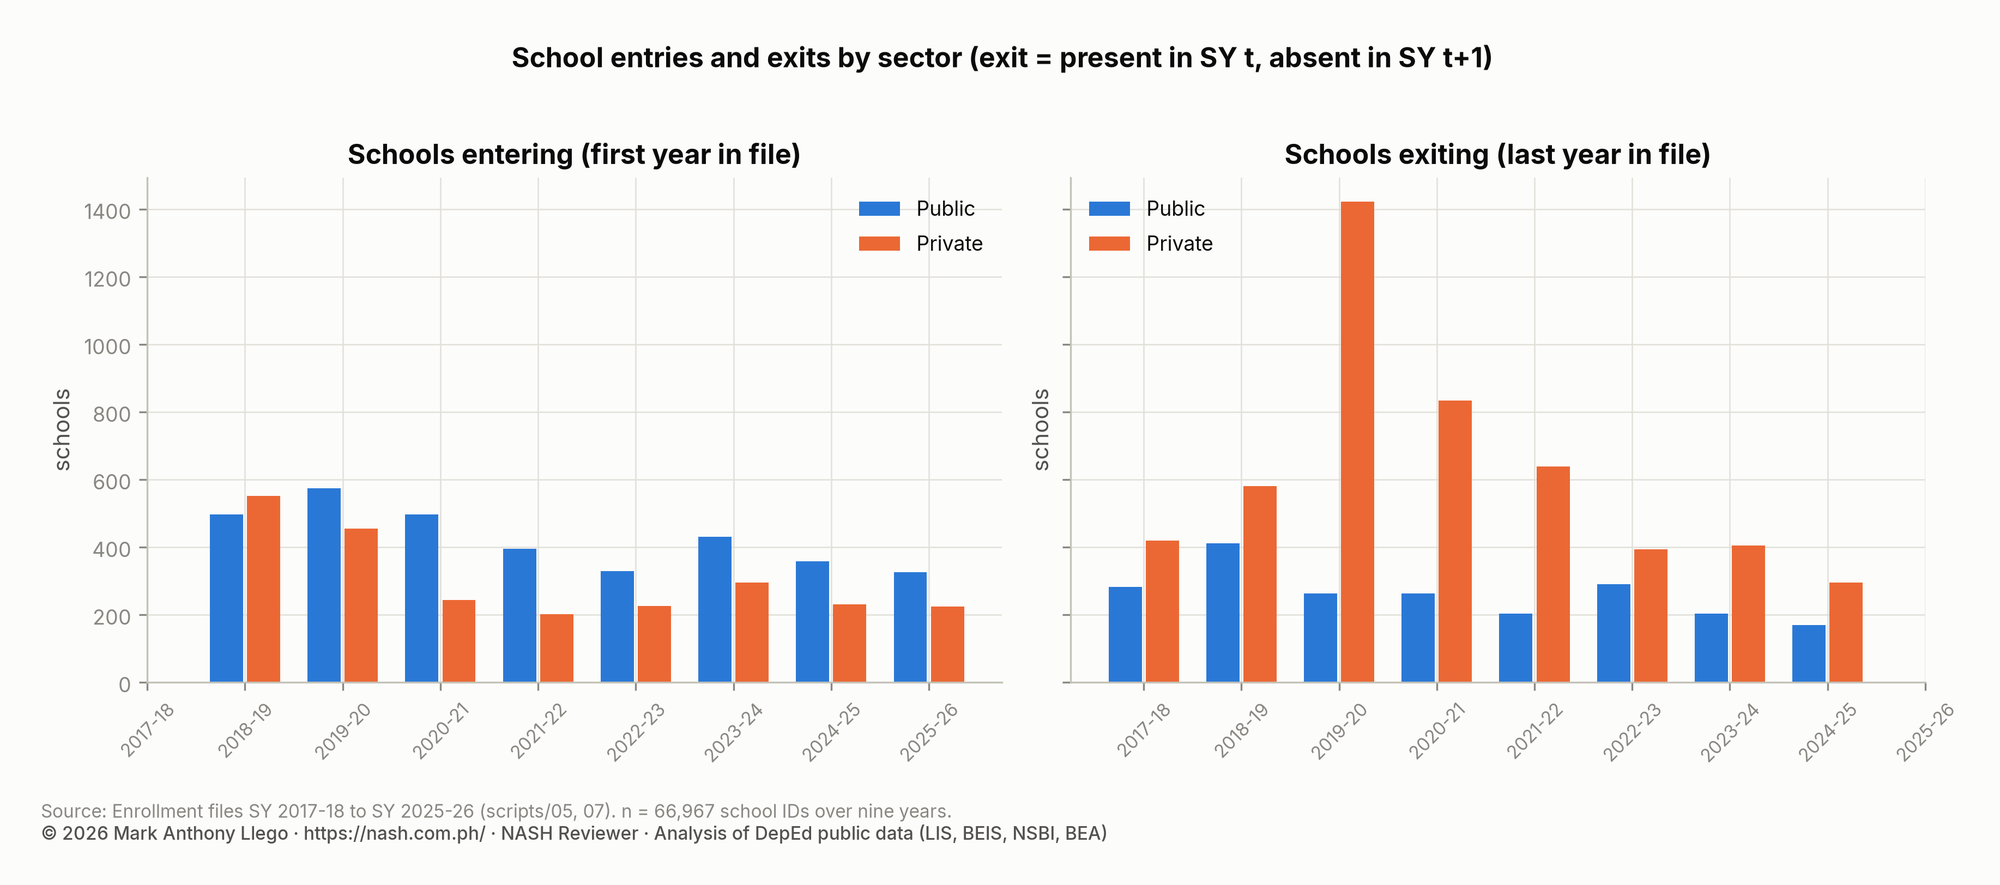
In SY 2020-21, 1,422 private schools that were in the SY 2019-20 file were absent. They had 67,236 learners in their last year. Of the 1,711 schools of all sectors that left that year, 194 later returned, so some had paused rather than closed.
Public enrollment ends the period almost where it began: 22.10 million in SY 2017-18 and 22.08 million in SY 2025-26, after a peak of 24.13 million in SY 2021-22. Schools managed by state and local universities and colleges lost half of their enrollment, from 149,614 to 73,060.
The 55,029 schools present in all nine years shrank by 0.46% a year, faster than the system as a whole at 0.18%. New schools therefore account for part of the stability in the national total.
Enrollment by region: only BARMM is still growing
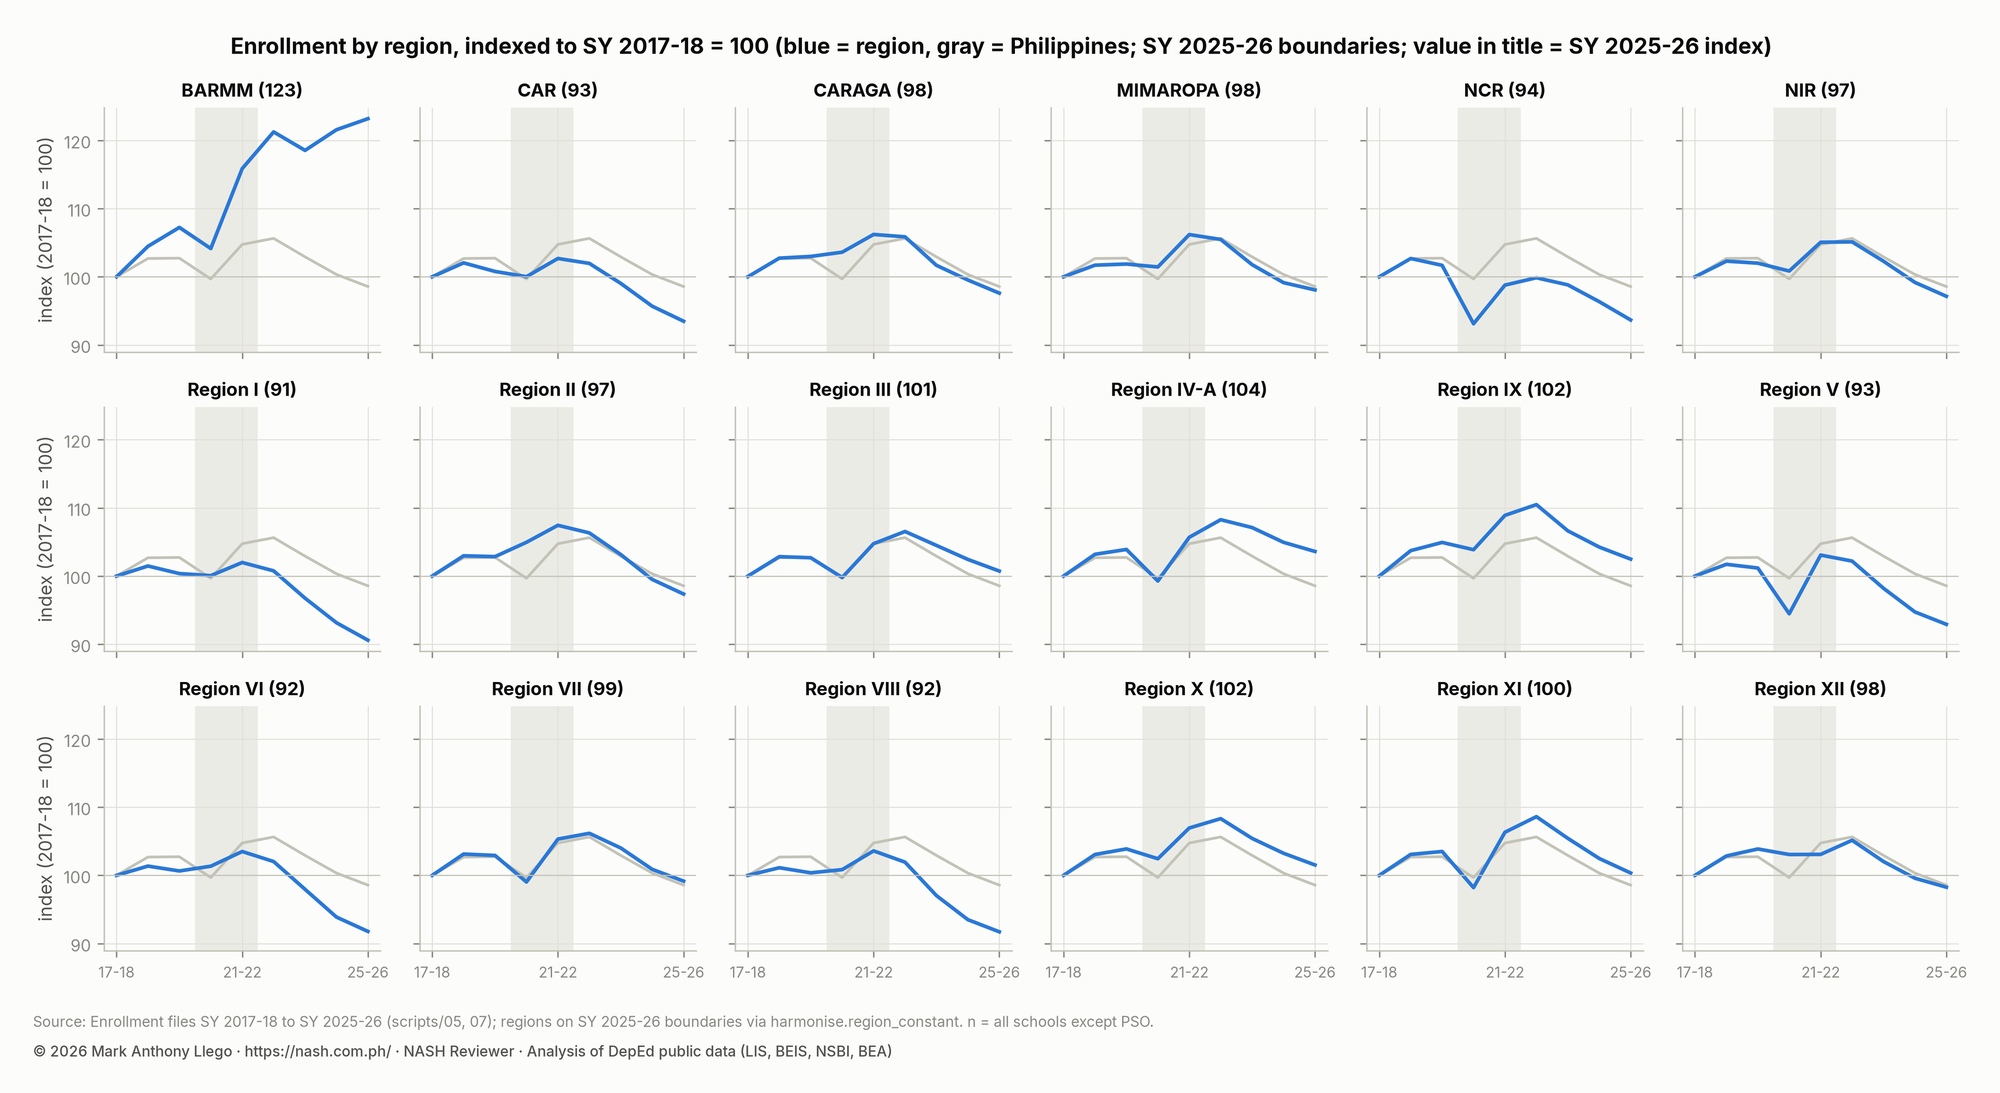
Under constant SY 2025-26 boundaries, BARMM enrollment grew 2.6% a year over the period. Regions I, VI and VIII lost about 1% a year.
Show the data as a table
| Region (SY 2025-26 boundaries) | SY 2017-18 | SY 2025-26 | Change per year, 2017-18 to 2025-26 | Change per year, 2022-23 to 2025-26 | Trend excluding pandemic years |
|---|---|---|---|---|---|
| Region I | 1,286,348 | 1,165,403 | -1.23% | -3.48% | -1.17% |
| Region VIII | 1,256,668 | 1,152,614 | -1.07% | -3.46% | -1.03% |
| Region VI | 1,176,643 | 1,079,924 | -1.07% | -3.47% | -1.00% |
| Region V | 1,764,865 | 1,640,002 | -0.91% | -3.12% | -0.90% |
| CAR | 436,484 | 408,037 | -0.84% | -2.85% | -0.79% |
| NCR | 2,868,073 | 2,686,394 | -0.81% | -2.11% | -0.85% |
| NIR | 1,226,368 | 1,191,317 | -0.36% | -2.60% | -0.28% |
| Region II | 871,626 | 848,648 | -0.33% | -2.89% | -0.27% |
| CARAGA | 754,330 | 736,260 | -0.30% | -2.67% | -0.30% |
| MIMAROPA | 871,849 | 855,106 | -0.24% | -2.40% | -0.19% |
| Region XII | 1,155,084 | 1,135,036 | -0.22% | -2.23% | -0.29% |
| Region VII | 1,646,395 | 1,632,444 | -0.11% | -2.25% | -0.07% |
| Region XI | 1,312,861 | 1,317,420 | +0.04% | -2.60% | +0.14% |
| Region III | 2,839,168 | 2,860,078 | +0.09% | -1.85% | +0.15% |
| Region X | 1,262,319 | 1,281,565 | +0.19% | -2.14% | +0.24% |
| Region IX | 1,135,114 | 1,163,334 | +0.31% | -2.47% | +0.34% |
| Region IV-A | 3,689,236 | 3,822,536 | +0.44% | -1.45% | +0.49% |
| BARMM | 758,518 | 934,373 | +2.64% | +0.53% | +2.68% |
| Region | SY 2017-18 | SY 2019-20 | SY 2021-22 | SY 2023-24 | SY 2025-26 |
|---|---|---|---|---|---|
| BARMM | 9.4% | 12.4% | 10.8% | 11.9% | 15.1% |
| CAR | 20.0% | 20.2% | 15.3% | 16.3% | 16.9% |
| CARAGA | 9.0% | 9.2% | 7.8% | 8.6% | 8.7% |
| MIMAROPA | 8.3% | 8.4% | 7.0% | 7.4% | 7.8% |
| NCR | 28.1% | 28.9% | 22.2% | 25.5% | 26.5% |
| NIR | 10.6% | 11.0% | 8.5% | 9.5% | 9.7% |
| Region I | 13.1% | 13.1% | 9.9% | 11.1% | 11.4% |
| Region II | 12.1% | 12.2% | 9.6% | 10.0% | 10.5% |
| Region III | 18.7% | 19.1% | 14.0% | 16.2% | 17.0% |
| Region IV-A | 22.7% | 22.8% | 16.5% | 19.1% | 20.5% |
| Region IX | 7.8% | 8.3% | 6.9% | 7.6% | 7.8% |
| Region V | 8.6% | 9.2% | 7.6% | 8.6% | 9.0% |
| Region VI | 10.7% | 11.1% | 8.0% | 9.4% | 9.9% |
| Region VII | 16.1% | 17.0% | 12.6% | 14.9% | 15.4% |
| Region VIII | 6.7% | 6.8% | 5.3% | 5.9% | 6.3% |
| Region X | 13.0% | 13.3% | 11.1% | 12.4% | 12.3% |
| Region XI | 13.9% | 14.5% | 10.2% | 11.9% | 11.9% |
| Region XII | 10.9% | 11.6% | 8.4% | 9.6% | 10.1% |
BARMM enrollment rose from 758,518 to 934,373, the only region with sustained growth. Region IV-A grew 0.4% a year and Region IX 0.3%. Region I lost 1.2% a year, and Regions VI and VIII lost 1.1%. Region V lost 0.9% a year, and CAR and NCR 0.8%.
Since SY 2022-23, every region except BARMM has lost enrollment. The losses range from 1.5% a year in Region IV-A to 3.5% a year in Region I.
Excluding the pandemic years changes no regional rate by more than 0.2 points. The gaps between regions reflect population change and migration, not the pandemic.
NCR has the highest private share: 26.5% of its learners were in private schools in SY 2025-26. Region VIII has the lowest, at 6.3%.
Enrollment by sex and grade-to-grade ratios
The share of girls and boys barely changes from year to year. Grade-to-grade ratios, built from consecutive school years, show where the pandemic interrupted progression through the grades and how far it has recovered.
| School year | Elementary | Junior high | Senior high | All levels |
|---|---|---|---|---|
| 2017-18 | 47.9% | 50.3% | 52.9% | 49.1% |
| 2018-19 | 48.1% | 49.9% | 52.5% | 49.2% |
| 2019-20 | 48.1% | 49.8% | 52.1% | 49.1% |
| 2020-21 | 48.2% | 49.8% | 52.6% | 49.2% |
| 2021-22 | 48.1% | 49.2% | 52.5% | 49.1% |
| 2022-23 | 48.0% | 49.0% | 50.9% | 48.7% |
| 2023-24 | 48.1% | 49.6% | 50.0% | 48.8% |
| 2024-25 | 48.2% | 49.7% | 50.4% | 49.0% |
| 2025-26 | 48.2% | 49.9% | 51.0% | 49.1% |
| School year | Grade 1 ÷ last year's Kindergarten | Grade 4 ÷ last year's Grade 3 | Grade 7 ÷ last year's Grade 6 | Grade 11 ÷ last year's Grade 10 |
|---|---|---|---|---|
| 2018-19 | 1.034 | 0.992 | 0.985 | 0.964 |
| 2019-20 | 1.016 | 0.991 | 0.996 | 0.969 |
| 2020-21 | 0.992 | 0.960 | 0.928 | 0.934 |
| 2021-22 | 1.065 | 1.011 | 1.011 | 1.084 |
| 2022-23 | 1.025 | 1.005 | 0.995 | 1.015 |
| 2023-24 | 1.005 | 0.979 | 0.971 | 0.983 |
| 2024-25 | 1.011 | 0.990 | 0.981 | 1.018 |
| 2025-26 | 1.017 | 0.988 | 0.981 | 1.006 |
In every year, the female share is 48.1% to 48.2% in elementary. In junior high it is 49.0% to 50.3%. In senior high it fell from 52.9% in SY 2017-18 to 50.0% in SY 2023-24, then rose to 51.0% in SY 2025-26.
Grade 1 enrollment is higher than the previous year’s kindergarten, with ratios of 1.01 to 1.07, because over-age learners and children who skipped kindergarten enter at Grade 1. The only year below 1 was SY 2020-21.
The Grade 6 to Grade 7 ratio fell to 0.93 in SY 2020-21 and has been 0.97 to 0.98 since SY 2023-24. The Grade 10 to Grade 11 ratio also dropped to 0.93 in SY 2020-21. It rebounded to 1.08 the next year as learners who had paused returned.
The SY 2017-18 kindergarten cohort, followed one grade a year, reached Grade 8 in SY 2025-26 at 91% of its kindergarten size. That path includes repeaters and transfers, so it is a rough guide, not a survival rate.
Teachers, classrooms, toilets and internet in public schools
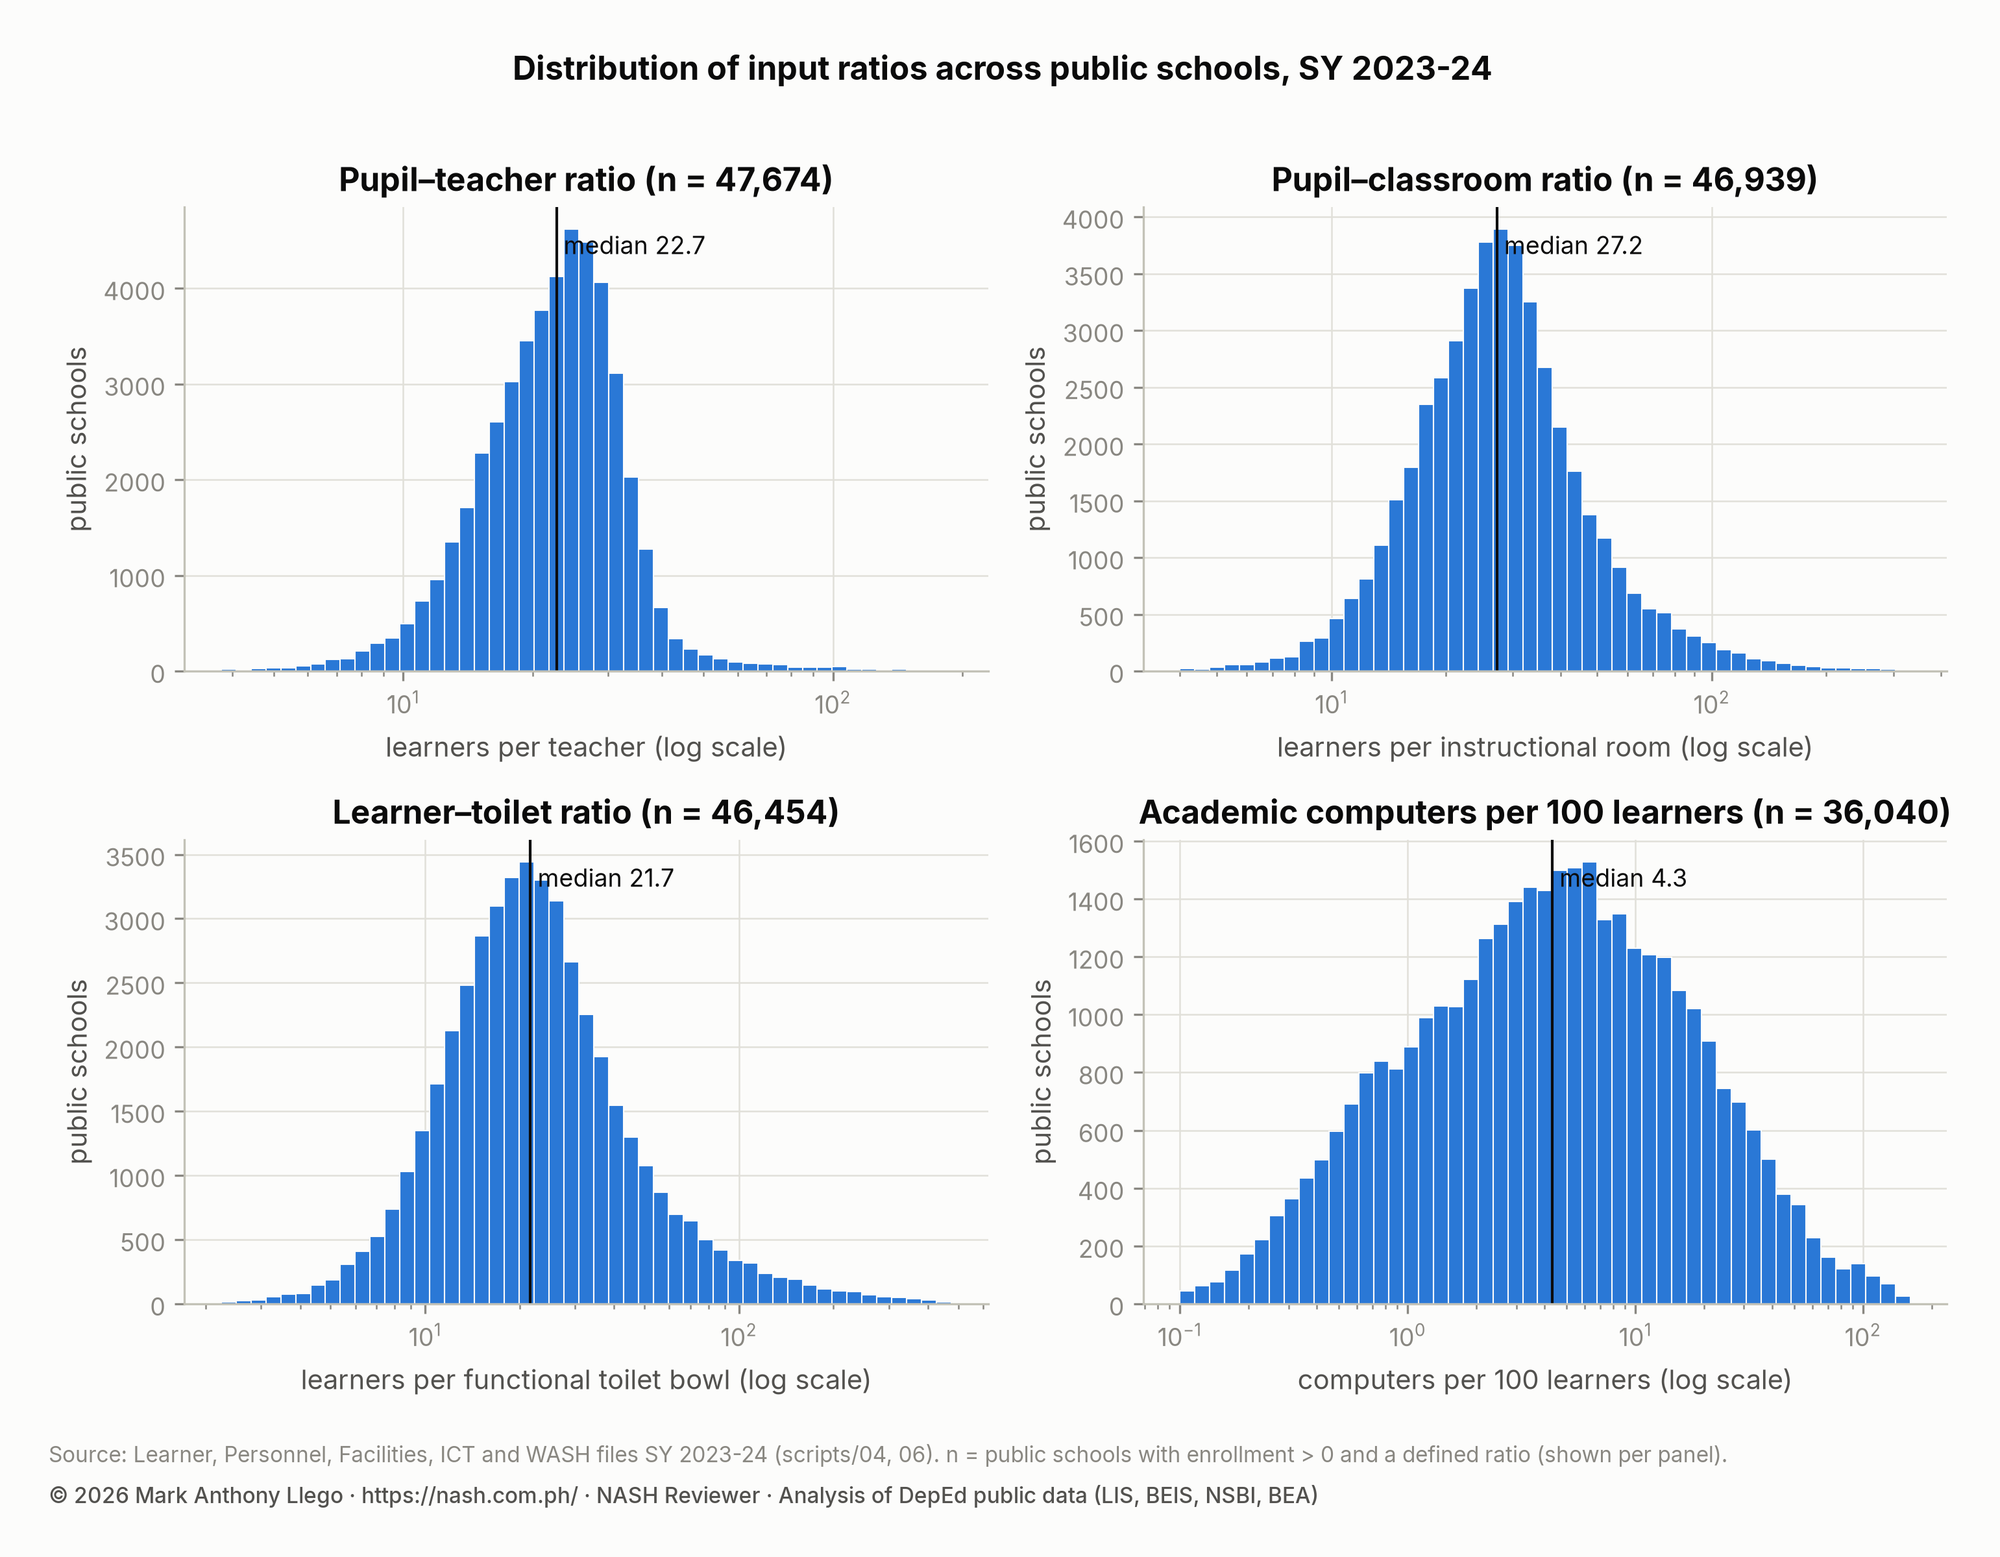
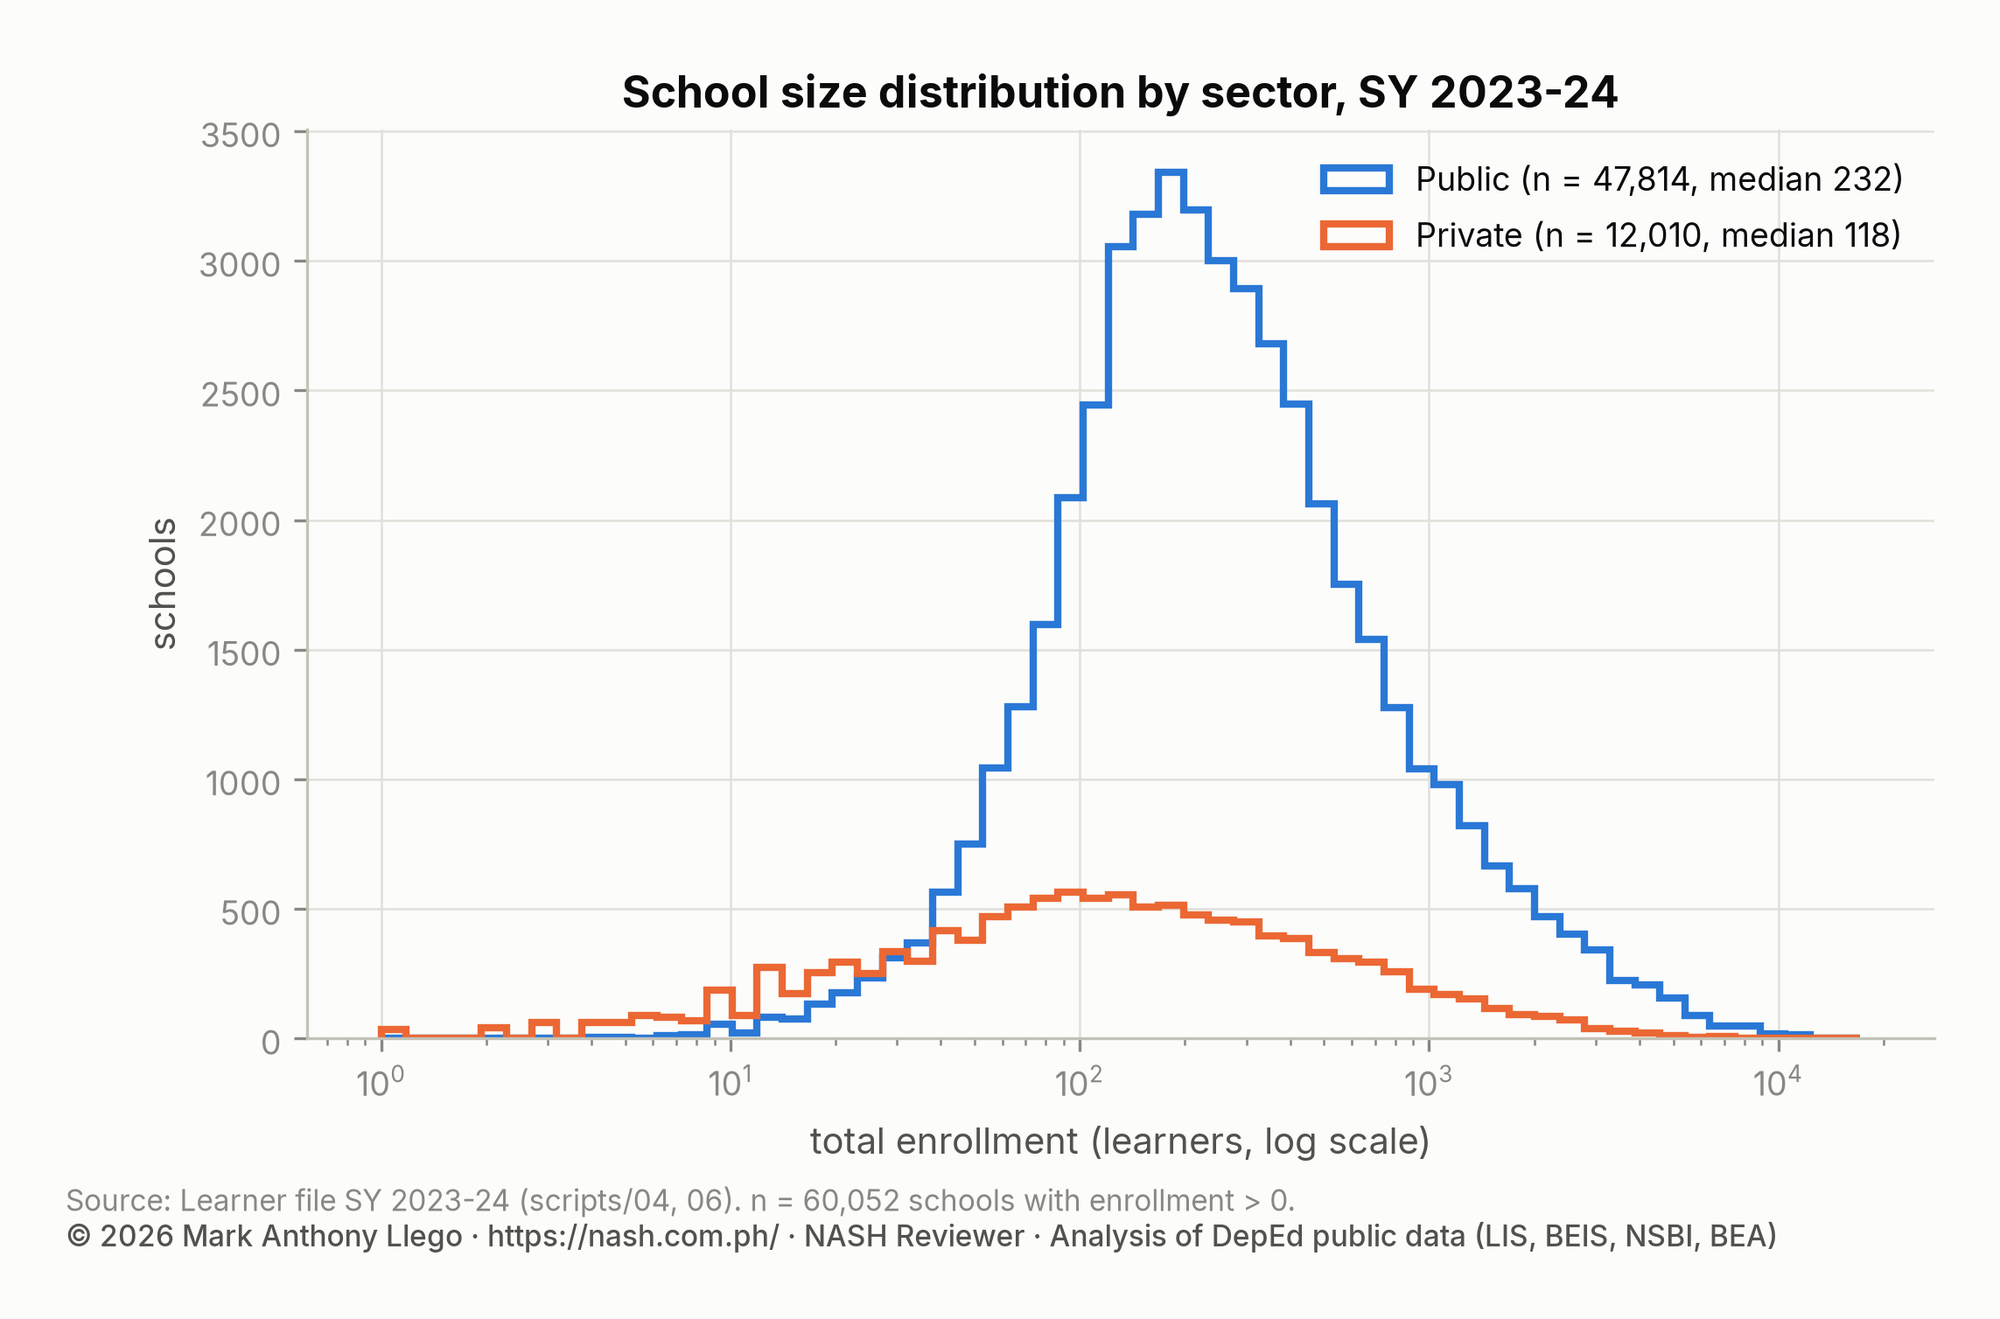
Across the 47,814 public schools with learners in SY 2023-24, the national ratios are higher than the typical school’s ratios, and the shortages are concentrated in a few regions.
Show the data as a table
| Indicator | Schools | 5th percentile | 25th | Median | 75th | 95th percentile |
|---|---|---|---|---|---|---|
| total enrollment (learners) | 47,814 | 48.0 | 126.0 | 232.0 | 480.0 | 1795.3 |
| pupil–teacher ratio | 47,674 | 11.2 | 17.4 | 22.7 | 28.1 | 37.6 |
| elementary pupil–teacher ratio | 39,334 | 11.1 | 17.2 | 22.9 | 28.2 | 36.0 |
| pupil–classroom ratio | 46,939 | 12.0 | 19.9 | 27.2 | 37.0 | 71.5 |
| elementary pupil–classroom ratio | 38,674 | 11.5 | 18.9 | 25.9 | 35.0 | 67.6 |
| learner–toilet ratio | 46,454 | 8.0 | 14.5 | 21.7 | 33.4 | 86.0 |
| academic computers per 100 learners | 47,813 | 0.0 | 0.1 | 2.3 | 8.1 | 33.0 |
| functional handwashing facilities per 100 learners | 44,186 | 0.6 | 2.1 | 4.1 | 6.7 | 14.3 |
| share of elementary learners in multigrade classes | 39,341 | 0.0 | 0.0 | 0.0 | 0.0 | 0.9 |
| share of buildings needing major repair or worse | 47,182 | 0.0 | 0.0 | 0.3 | 0.7 | 1.0 |
Show the data as a table
| Region | Public schools | Learners | Pupil–teacher ratio | Median school PTR | Pupil–classroom ratio | Learner–toilet ratio | Computers per 100 learners | Schools with no functional toilet | ES learners with water | ES learners with electricity | ES learners with internet | ES learners in multigrade classes |
|---|---|---|---|---|---|---|---|---|---|---|---|---|
| BARMM | 2,155 | 769,022 | 30.0 | 29.8 | 46.4 | 50.5 | 3.1 | 19.1% | 96% | 94% | 80% | 3% |
| Region IV-A | 3,564 | 3,188,202 | 29.7 | 27.9 | 45.1 | 33.7 | 6.9 | 0.7% | 99% | 99% | 96% | 0% |
| NCR | 827 | 2,101,985 | 27.5 | 27.9 | 55.1 | 47.6 | 9.3 | 1.5% | 96% | 96% | 97% | 0% |
| Region III | 3,729 | 2,478,610 | 27.4 | 26.9 | 36.0 | 27.7 | 6.3 | 0.8% | 99% | 99% | 98% | 0% |
| Region XI | 2,218 | 1,218,778 | 26.8 | 24.9 | 36.3 | 29.5 | 6.8 | 2.8% | 99% | 99% | 85% | 2% |
| Region X | 2,531 | 1,159,212 | 26.5 | 24.3 | 36.2 | 25.5 | 5.5 | 2.8% | 98% | 99% | 83% | 3% |
| Region IX | 2,993 | 1,106,260 | 25.7 | 22.7 | 34.0 | 30.3 | 5.6 | 8.6% | 95% | 95% | 73% | 3% |
| Region XII | 2,155 | 1,062,105 | 25.7 | 23.7 | 36.7 | 25.8 | 5.9 | 3.2% | 97% | 97% | 83% | 2% |
| Region VII | 2,810 | 1,456,462 | 25.5 | 23.1 | 36.5 | 32.0 | 5.2 | 2.4% | 98% | 99% | 91% | 1% |
| NIR | 2,231 | 1,134,333 | 25.4 | 24.3 | 32.4 | 26.8 | 5.7 | 2.6% | 99% | 99% | 83% | 1% |
| MIMAROPA | 2,382 | 817,395 | 24.2 | 22.9 | 30.8 | 22.3 | 8.0 | 2.1% | 96% | 96% | 74% | 4% |
| Region V | 3,862 | 1,581,329 | 23.4 | 21.9 | 31.2 | 24.6 | 4.4 | 0.8% | 98% | 99% | 74% | 2% |
| Region I | 2,861 | 1,101,162 | 23.1 | 21.1 | 28.0 | 20.0 | 10.4 | 0.6% | 99% | 99% | 96% | 2% |
| CARAGA | 2,099 | 700,496 | 22.6 | 21.1 | 30.6 | 22.9 | 10.1 | 2.1% | 99% | 99% | 89% | 4% |
| Region VI | 2,835 | 1,040,714 | 22.3 | 19.5 | 27.3 | 20.4 | 5.1 | 0.7% | 99% | 100% | 84% | 2% |
| Region II | 2,539 | 809,342 | 22.2 | 20.4 | 27.5 | 19.2 | 6.6 | 0.7% | 99% | 99% | 94% | 4% |
| Region VIII | 4,179 | 1,141,816 | 21.2 | 18.7 | 26.9 | 22.1 | 6.0 | 1.7% | 99% | 99% | 80% | 9% |
| CAR | 1,844 | 358,204 | 19.4 | 15.6 | 24.1 | 20.0 | 11.5 | 2.4% | 100% | 100% | 81% | 10% |
Show the data as a table
| Region | Public schools | Learners | Pupil–teacher ratio | Median school PTR | Pupil–classroom ratio | Learner–toilet ratio | Computers per 100 learners | Schools with no functional toilet | ES learners with water | ES learners with electricity | ES learners with internet | ES learners in multigrade classes |
|---|---|---|---|---|---|---|---|---|---|---|---|---|
| BARMM | 2,155 | 769,022 | 30.0 | 29.8 | 46.4 | 50.5 | 3.1 | 19.1% | 96% | 94% | 80% | 3% |
| Region IV-A | 3,564 | 3,188,202 | 29.7 | 27.9 | 45.1 | 33.7 | 6.9 | 0.7% | 99% | 99% | 96% | 0% |
| NCR | 827 | 2,101,985 | 27.5 | 27.9 | 55.1 | 47.6 | 9.3 | 1.5% | 96% | 96% | 97% | 0% |
| Region III | 3,729 | 2,478,610 | 27.4 | 26.9 | 36.0 | 27.7 | 6.3 | 0.8% | 99% | 99% | 98% | 0% |
| Region XI | 2,218 | 1,218,778 | 26.8 | 24.9 | 36.3 | 29.5 | 6.8 | 2.8% | 99% | 99% | 85% | 2% |
| Region X | 2,531 | 1,159,212 | 26.5 | 24.3 | 36.2 | 25.5 | 5.5 | 2.8% | 98% | 99% | 83% | 3% |
| Region IX | 2,993 | 1,106,260 | 25.7 | 22.7 | 34.0 | 30.3 | 5.6 | 8.6% | 95% | 95% | 73% | 3% |
| Region XII | 2,155 | 1,062,105 | 25.7 | 23.7 | 36.7 | 25.8 | 5.9 | 3.2% | 97% | 97% | 83% | 2% |
| Region VII | 2,810 | 1,456,462 | 25.5 | 23.1 | 36.5 | 32.0 | 5.2 | 2.4% | 98% | 99% | 91% | 1% |
| NIR | 2,231 | 1,134,333 | 25.4 | 24.3 | 32.4 | 26.8 | 5.7 | 2.6% | 99% | 99% | 83% | 1% |
| MIMAROPA | 2,382 | 817,395 | 24.2 | 22.9 | 30.8 | 22.3 | 8.0 | 2.1% | 96% | 96% | 74% | 4% |
| Region V | 3,862 | 1,581,329 | 23.4 | 21.9 | 31.2 | 24.6 | 4.4 | 0.8% | 98% | 99% | 74% | 2% |
| Region I | 2,861 | 1,101,162 | 23.1 | 21.1 | 28.0 | 20.0 | 10.4 | 0.6% | 99% | 99% | 96% | 2% |
| CARAGA | 2,099 | 700,496 | 22.6 | 21.1 | 30.6 | 22.9 | 10.1 | 2.1% | 99% | 99% | 89% | 4% |
| Region VI | 2,835 | 1,040,714 | 22.3 | 19.5 | 27.3 | 20.4 | 5.1 | 0.7% | 99% | 100% | 84% | 2% |
| Region II | 2,539 | 809,342 | 22.2 | 20.4 | 27.5 | 19.2 | 6.6 | 0.7% | 99% | 99% | 94% | 4% |
| Region VIII | 4,179 | 1,141,816 | 21.2 | 18.7 | 26.9 | 22.1 | 6.0 | 1.7% | 99% | 99% | 80% | 9% |
| CAR | 1,844 | 358,204 | 19.4 | 15.6 | 24.1 | 20.0 | 11.5 | 2.4% | 100% | 100% | 81% | 10% |
Show the data as a table
| Indicator | Schools with data | Share of schools | Share of learners |
|---|---|---|---|
| water supply (ES) | 39,341 | 97.6% | 98.1% |
| electricity, grid or off-grid (ES) | 39,343 | 97.4% | 98.2% |
| internet (ES) | 39,341 | 76.2% | 87.7% |
| water supply (any level) | 47,813 | 97.6% | 98.3% |
| electricity (any level) | 47,813 | 97.4% | 98.3% |
| internet (any level) | 47,813 | 78.1% | 90.4% |
| at least one academic computer | 47,813 | 75.4% | 86.9% |
| no functional toilet bowl | 47,814 | 2.8% | 1.1% |
Show the data as a table
| Indicator | Schools | 5th percentile | 25th | Median | 75th | 95th percentile |
|---|---|---|---|---|---|---|
| total enrollment (learners) | 47,814 | 48.0 | 126.0 | 232.0 | 480.0 | 1795.3 |
| pupil–teacher ratio | 47,674 | 11.2 | 17.4 | 22.7 | 28.1 | 37.6 |
| elementary pupil–teacher ratio | 39,334 | 11.1 | 17.2 | 22.9 | 28.2 | 36.0 |
| pupil–classroom ratio | 46,939 | 12.0 | 19.9 | 27.2 | 37.0 | 71.5 |
| elementary pupil–classroom ratio | 38,674 | 11.5 | 18.9 | 25.9 | 35.0 | 67.6 |
| learner–toilet ratio | 46,454 | 8.0 | 14.5 | 21.7 | 33.4 | 86.0 |
| academic computers per 100 learners | 47,813 | 0.0 | 0.1 | 2.3 | 8.1 | 33.0 |
| functional handwashing facilities per 100 learners | 44,186 | 0.6 | 2.1 | 4.1 | 6.7 | 14.3 |
| share of elementary learners in multigrade classes | 39,341 | 0.0 | 0.0 | 0.0 | 0.0 | 0.9 |
| share of buildings needing major repair or worse | 47,182 | 0.0 | 0.0 | 0.3 | 0.7 | 1.0 |
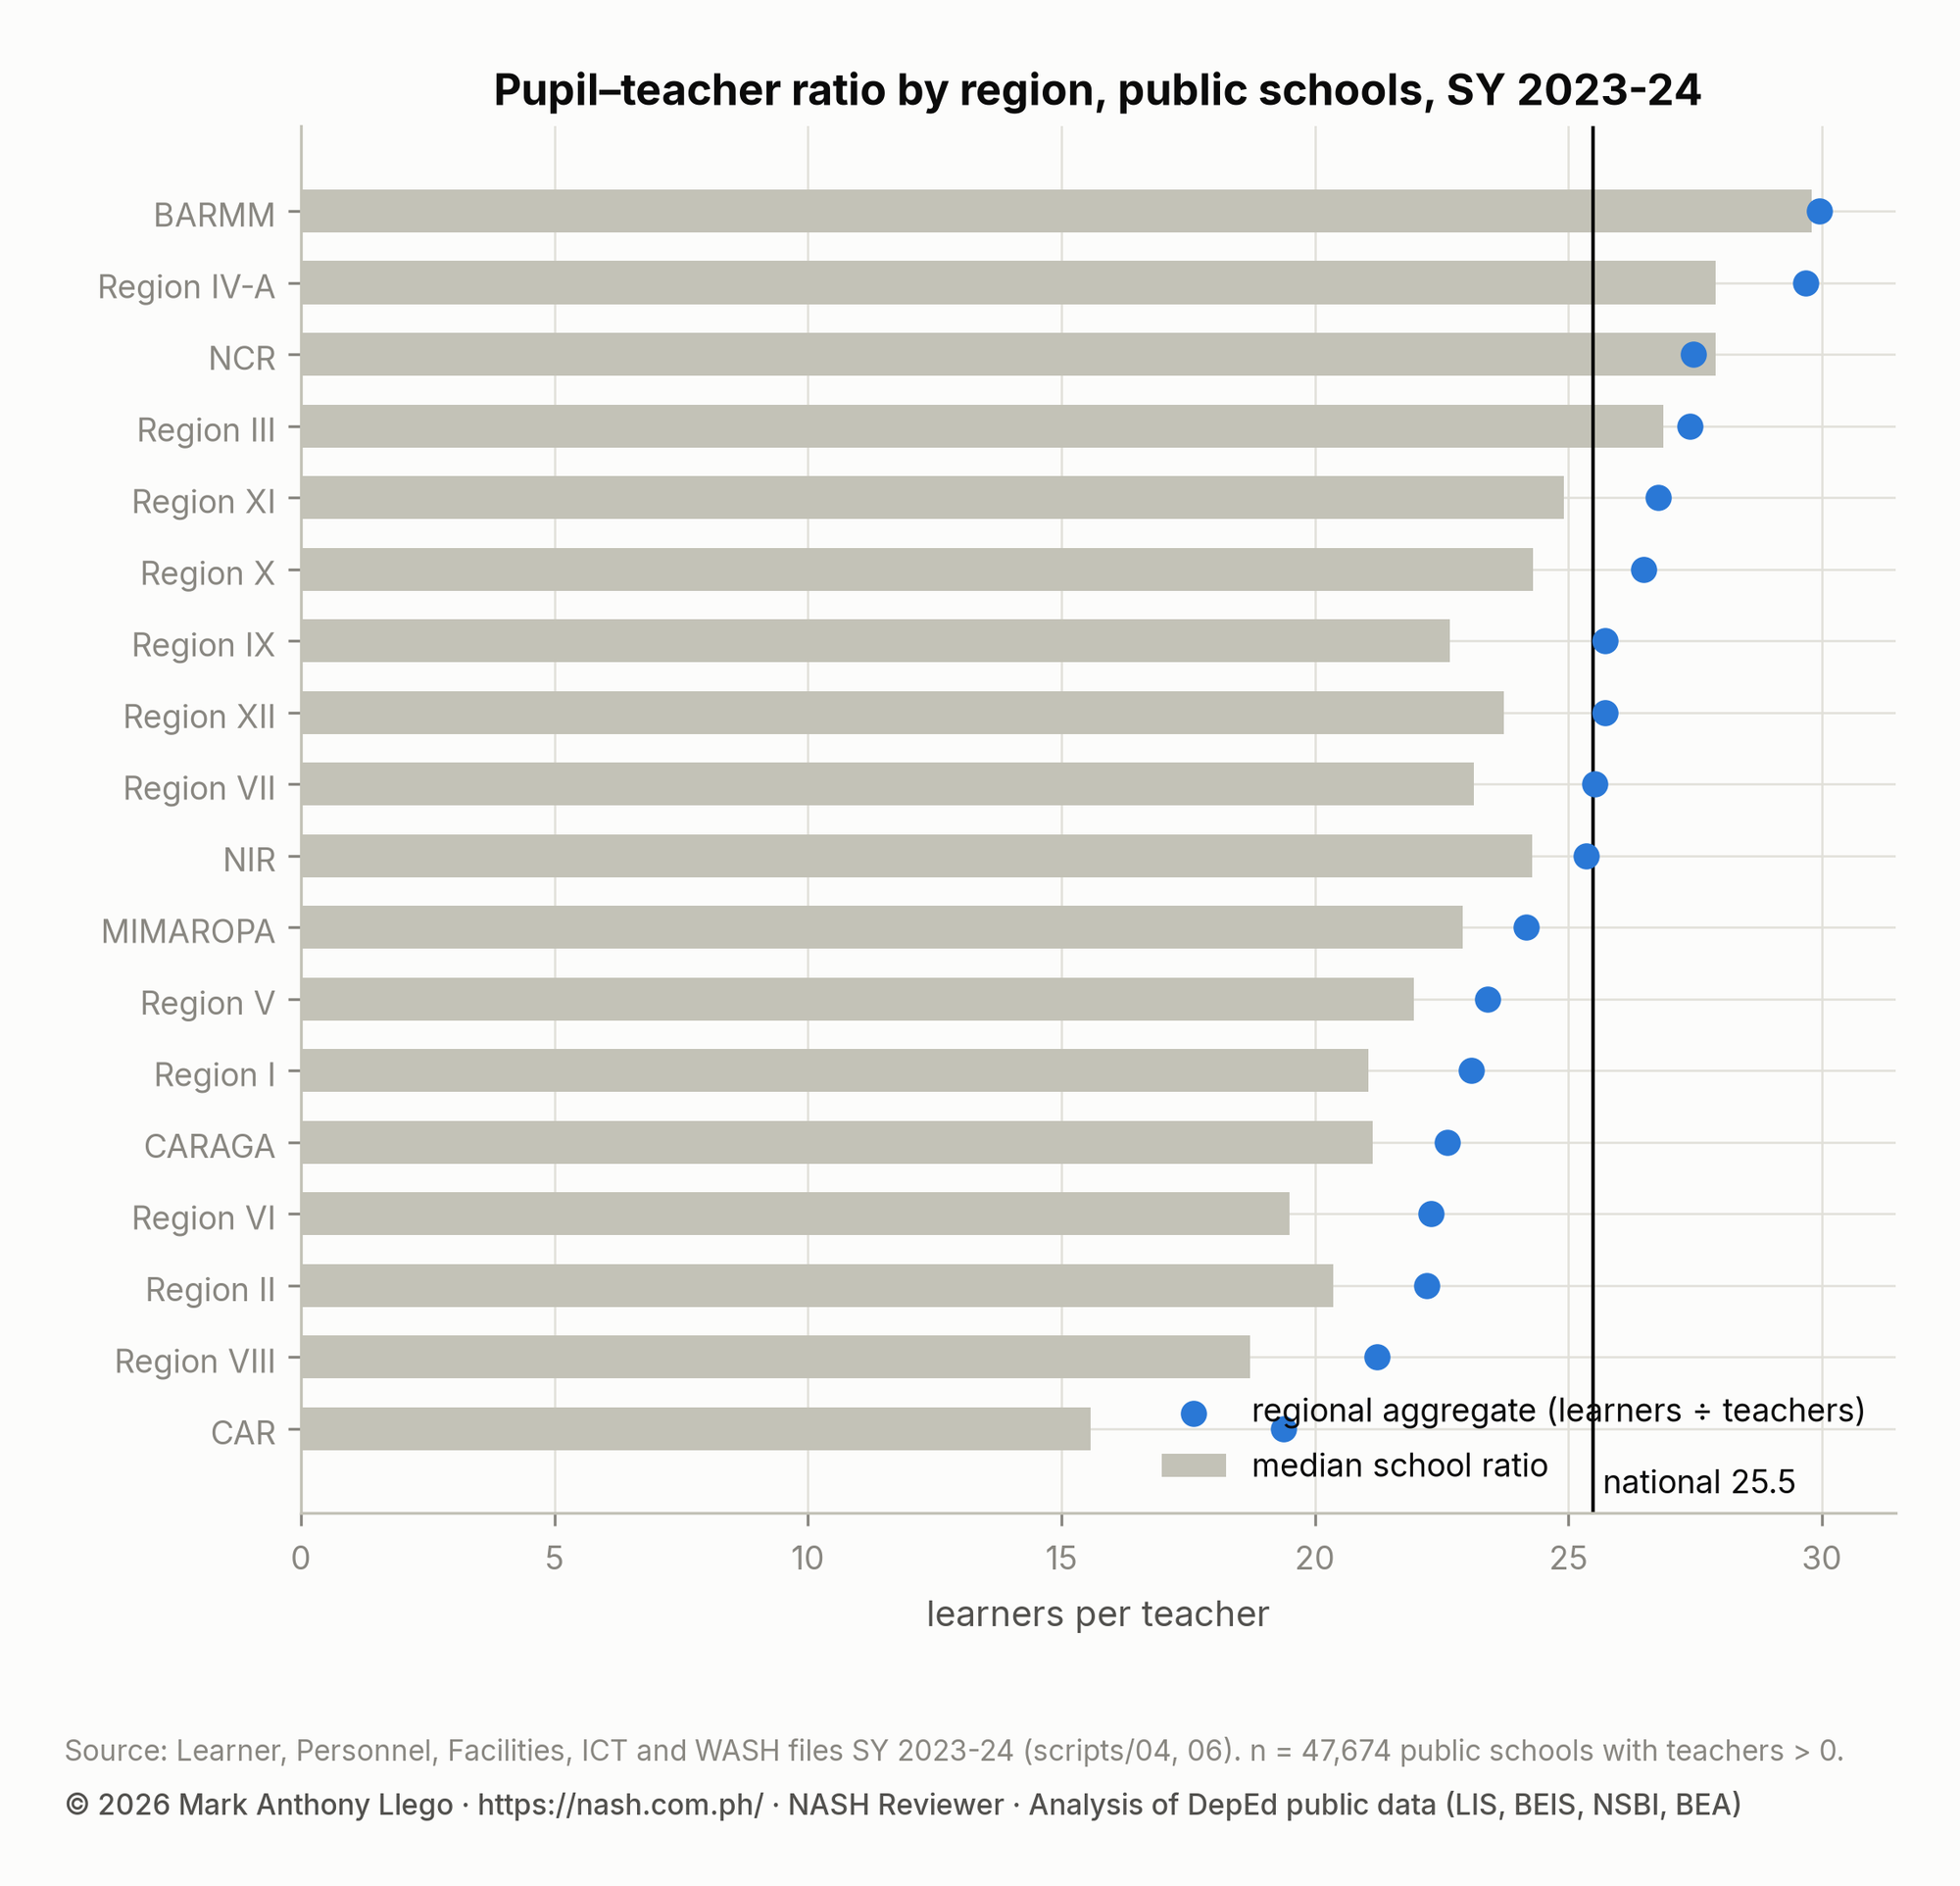
DepEd computes the pupil–teacher ratio as total learners divided by total teachers. On that count, the public pupil–teacher ratio is 25.5, while the median school has 22.7 learners per teacher.
The same gap appears for classrooms and toilets. Nationally there are 35.1 learners per instructional room, but 27.2 in the median school. There are 27.4 learners per functional toilet bowl nationally, but 21.7 in the median school. The shortage is concentrated in large urban schools.
BARMM has the highest ratios on every count: 30.0 learners per teacher, 46.4 per classroom and 50.5 per toilet bowl. In BARMM, 19% of public schools report no functional toilet. NCR has the most crowded classrooms, with 55 learners per room, followed by Region IV-A with 45. CAR, with 19.4 learners per teacher, and Region VIII, with 21.2, have the most teachers for their learners.
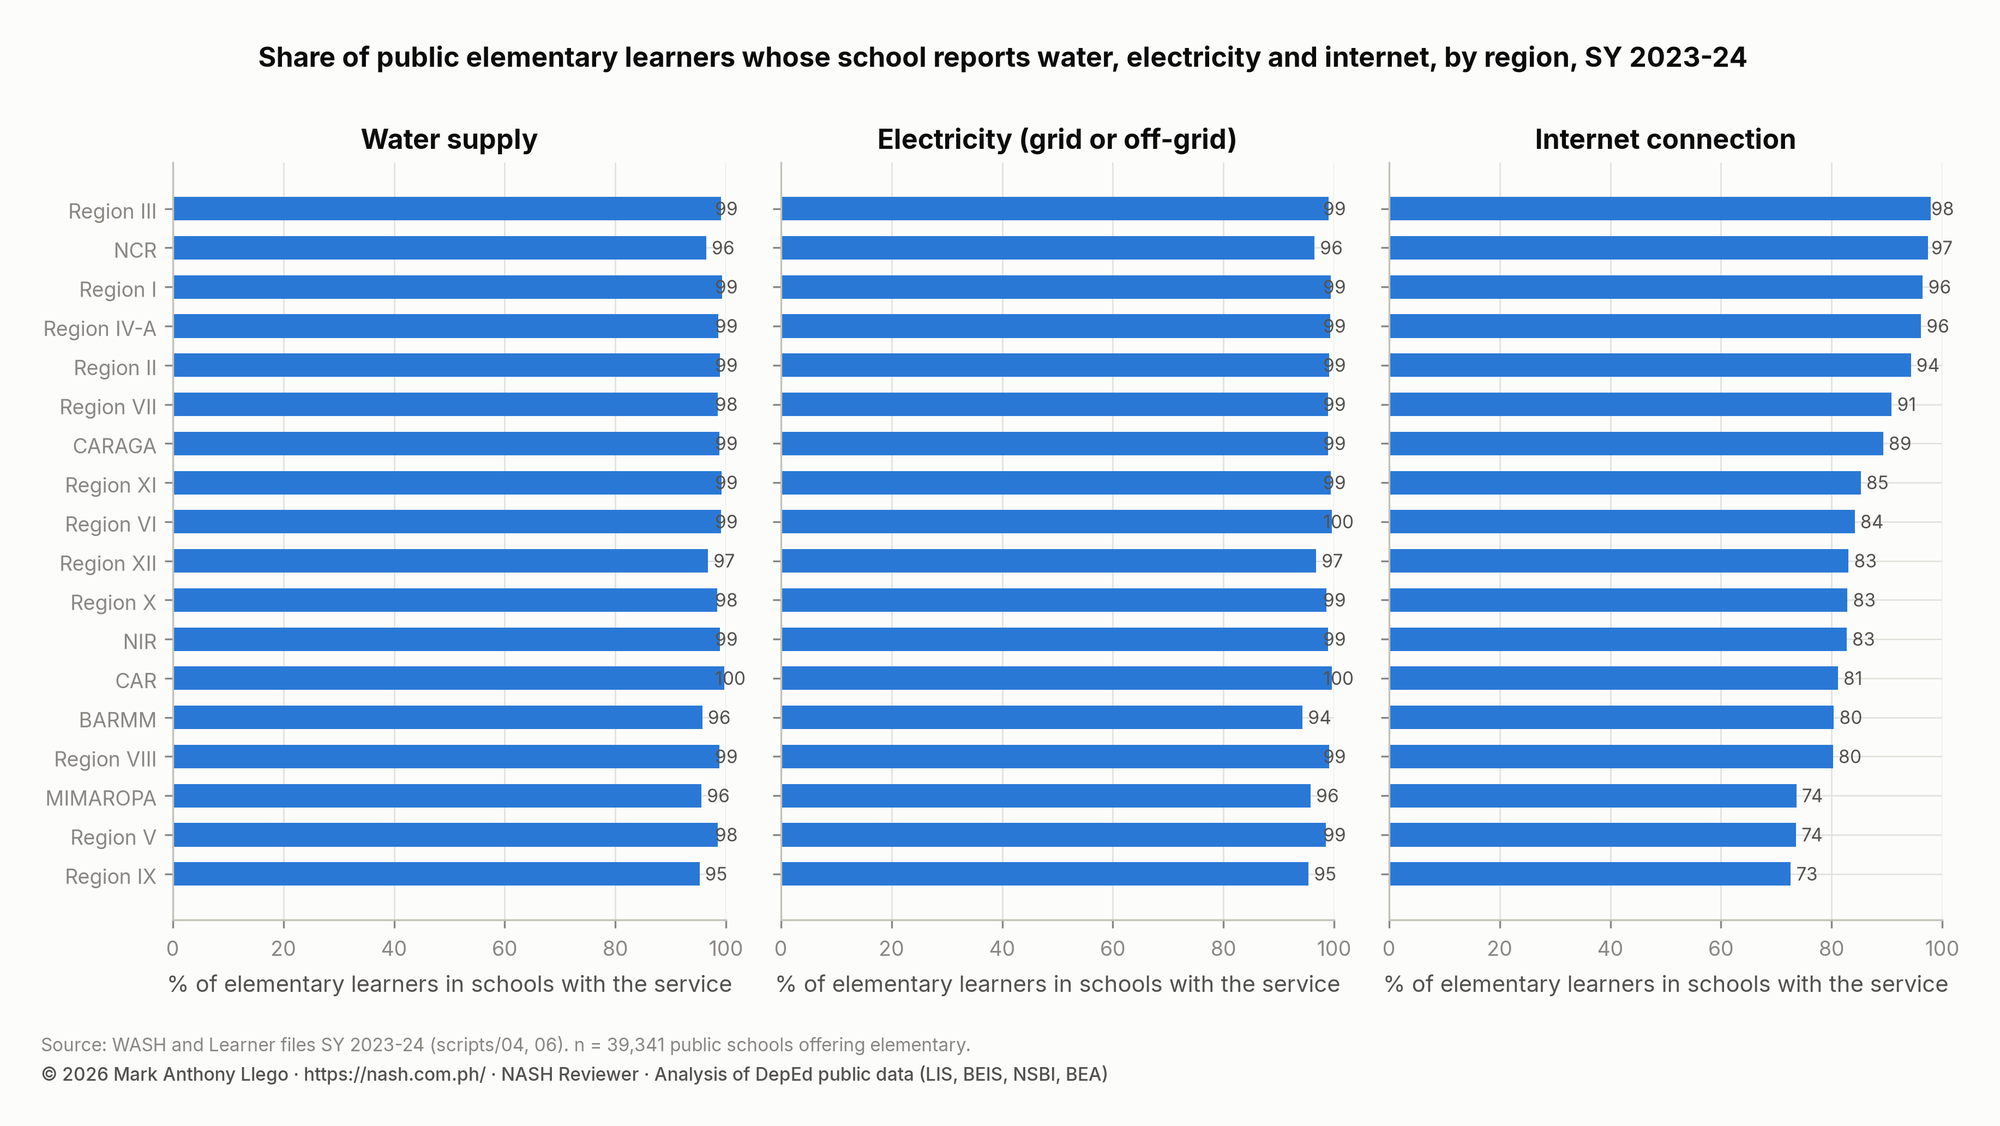
Water and electricity reach almost every learner: 98% of public elementary learners attend a school that reports a water supply, and 98% attend one with electricity. Fewer schools have internet. Only 76% of public elementary schools, with 88% of learners, report a connection. The share of learners with a connected school ranges from 73% in Region IX to 98% in Region III.
Academic computers are scarce and unevenly spread. There are 6.6 per 100 learners nationally, but the median school has 2.3 per 100. In 25% of public schools there are none. One public school in 36, or 2.8%, reports no functional toilet bowl at all. Those schools hold 1.1% of learners.
Nationally, 2% of elementary learners are taught in multigrade classes. The share is 9% in Region VIII and 10% in CAR, where small mountain and island schools are common.
NAT Grade 6 and ELLNA Grade 3 results by division
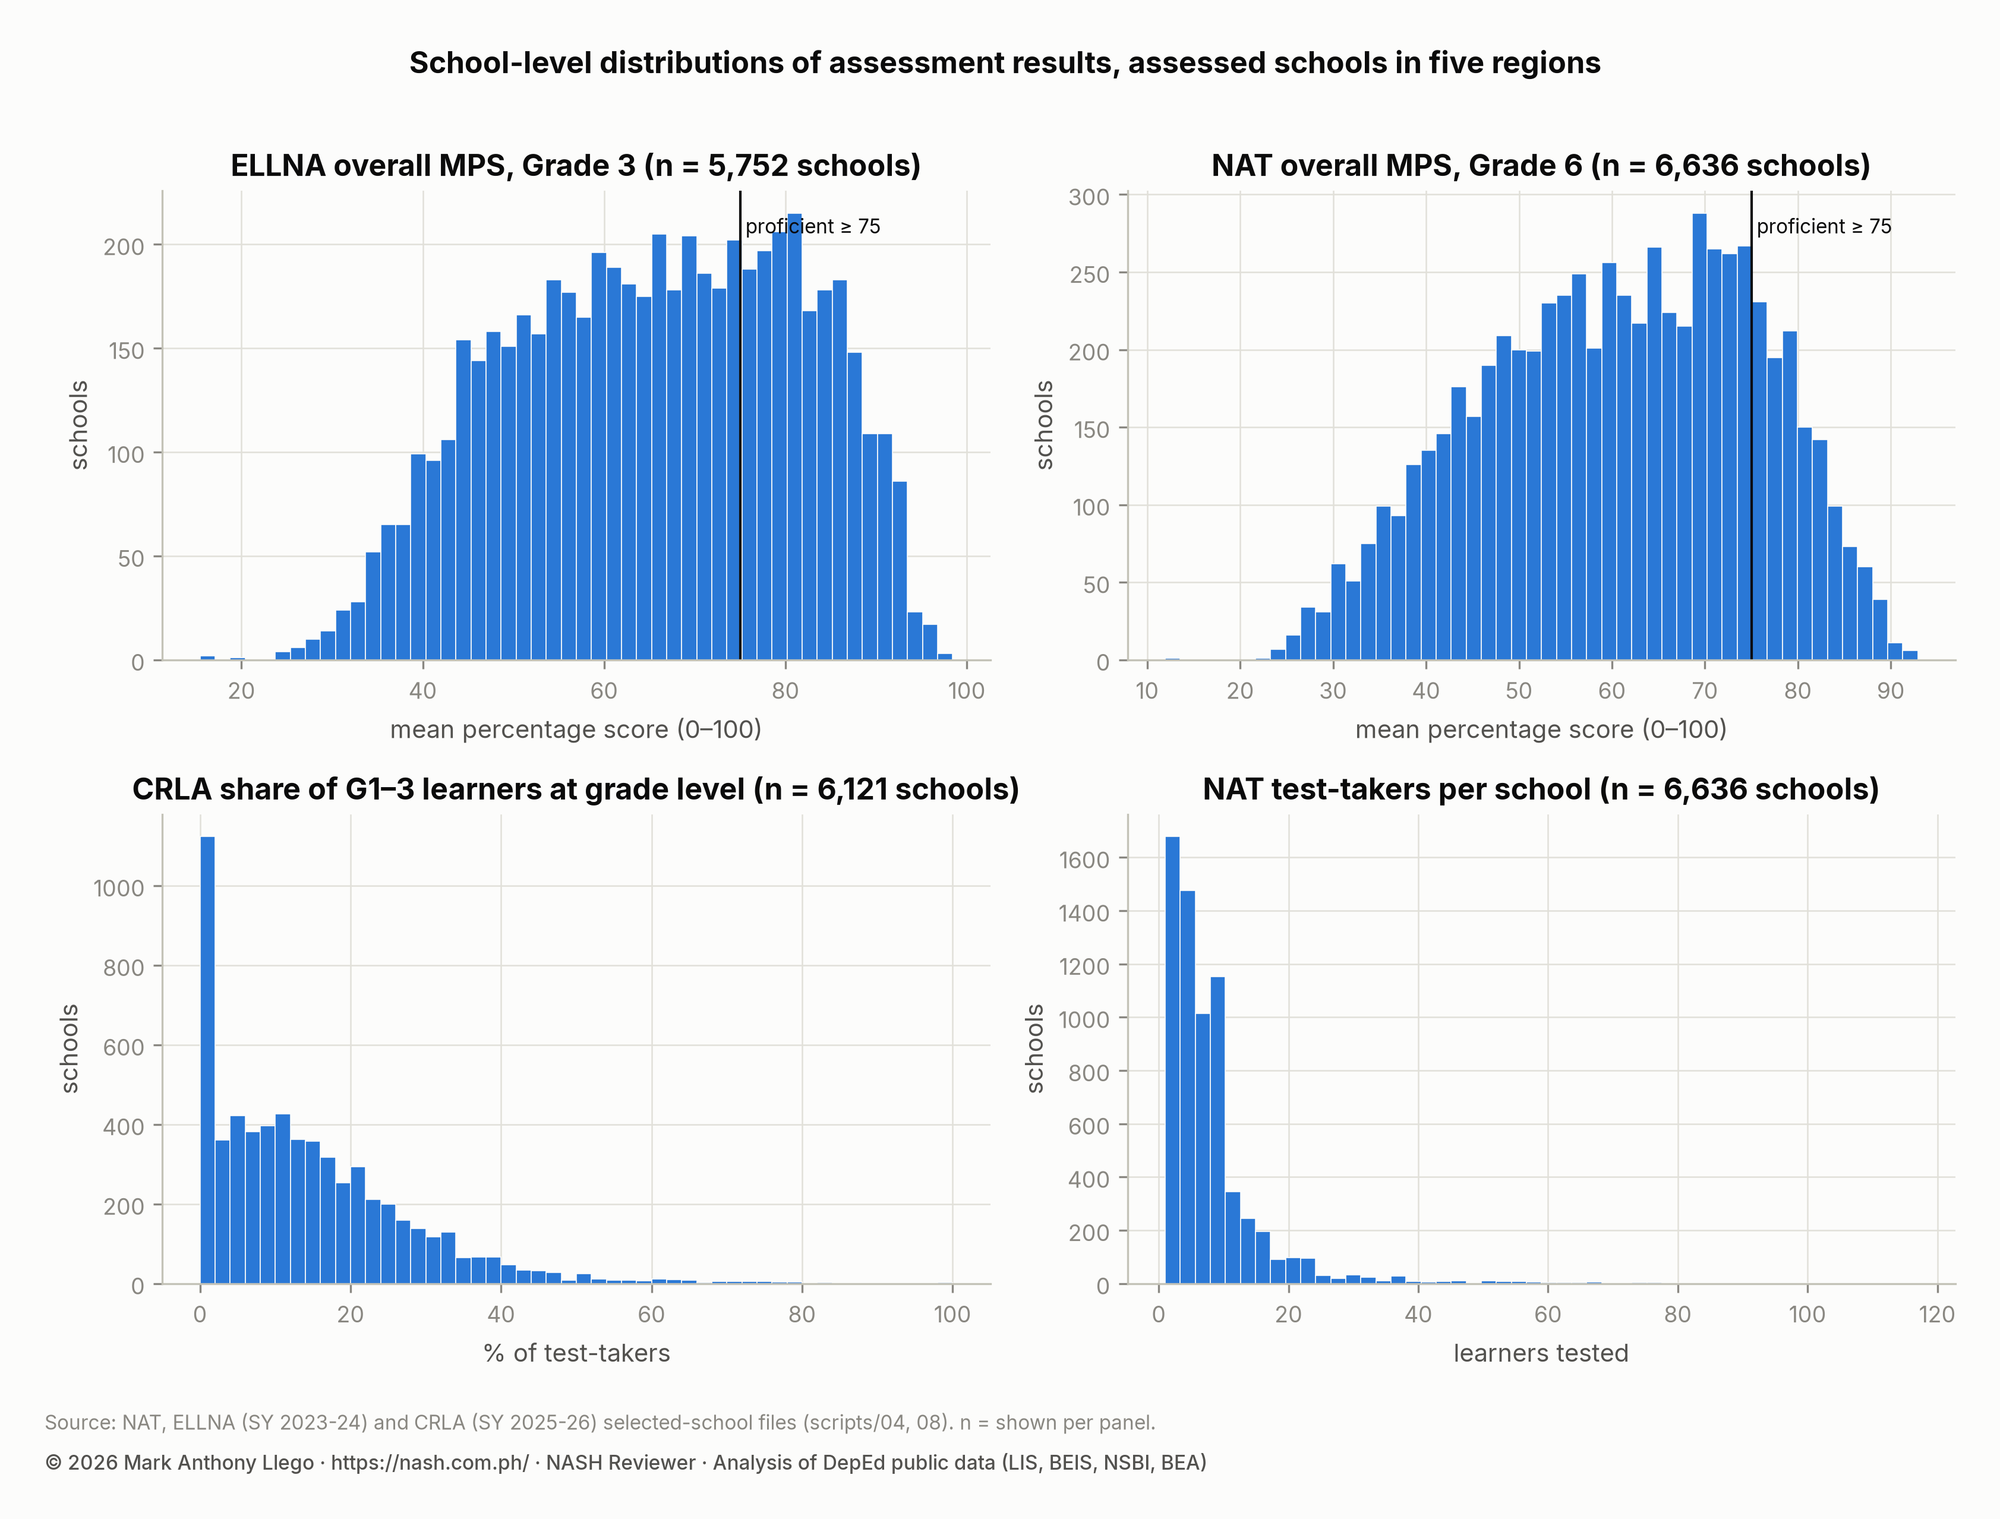
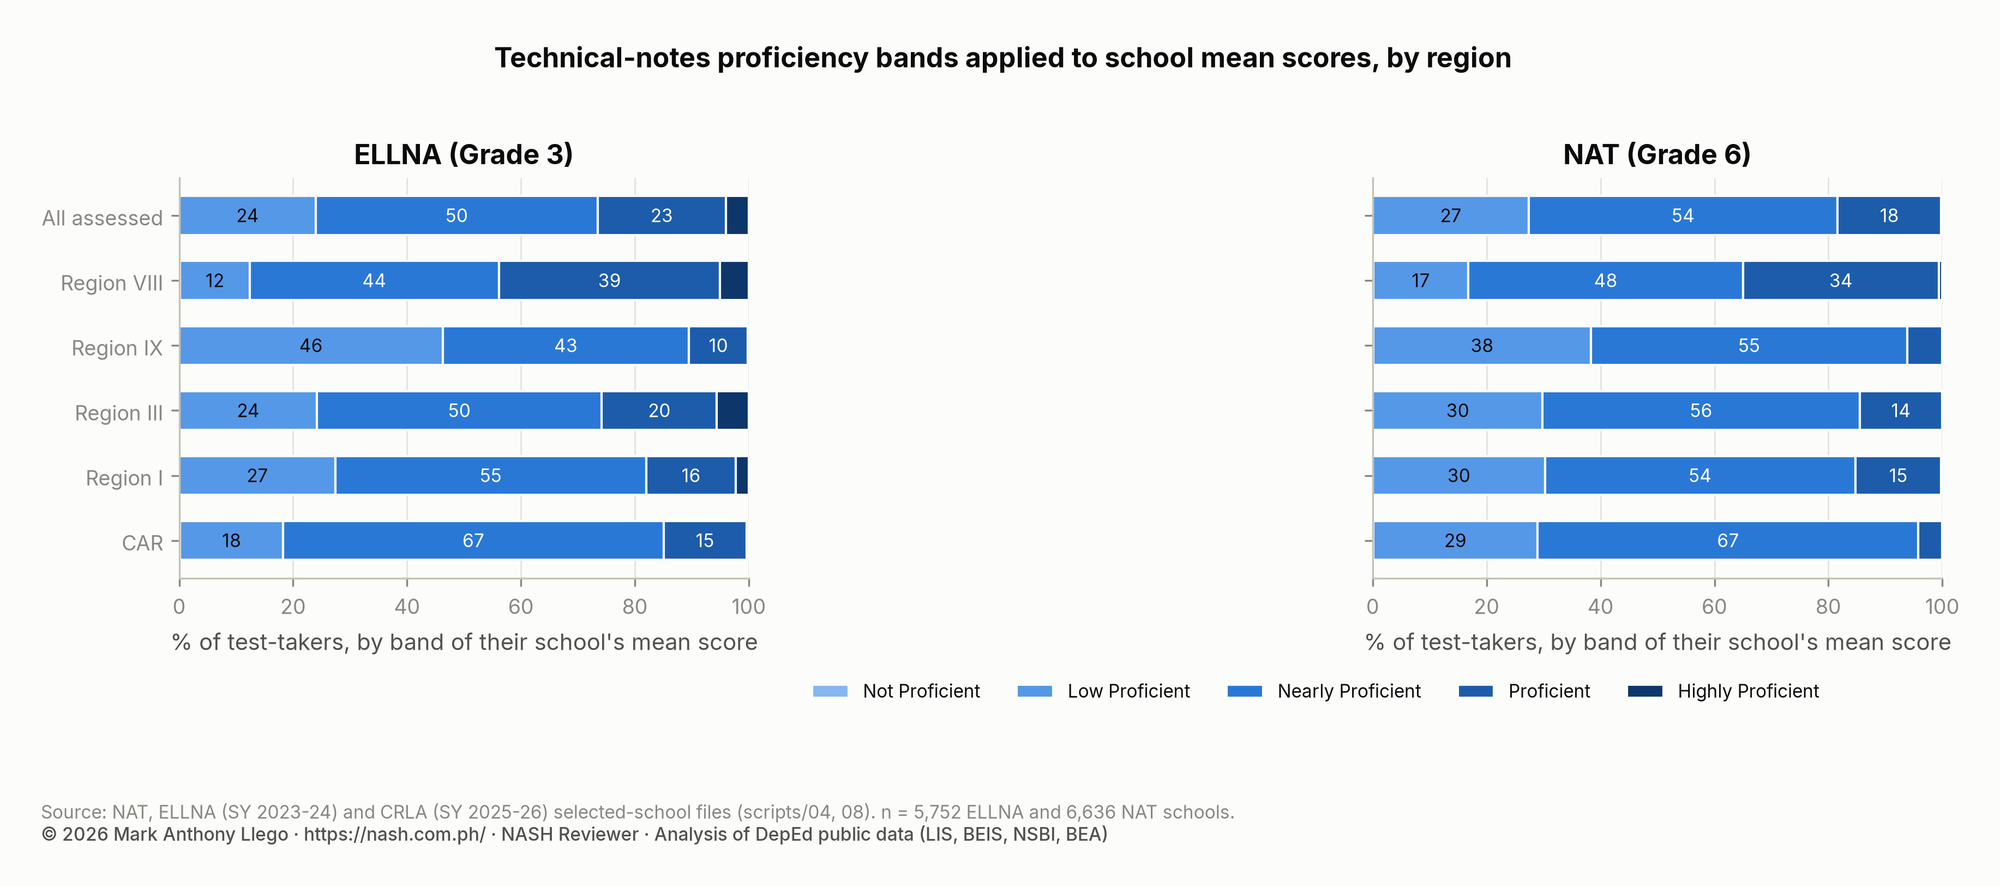
In the assessed schools, the Grade 3 ELLNA mean percentage score is 63.2 and the Grade 6 NAT mean is 60.3, weighted by test-takers. Both are below 75, the score the technical notes call proficient. Divisions differ widely, and most of those differences are statistically significant.
Show the data as a table
| Region | ELLNA schools | ELLNA mean (95% CI) | NAT schools | NAT mean (95% CI) | CRLA schools | At grade level (95% CI) | Low emerging (95% CI) |
|---|---|---|---|---|---|---|---|
| CAR | 527 | 61.1 (59.7–62.4) | 778 | 56.1 (55.0–57.2) | 772 | 13.8 (12.8–14.8)% | 27.6 (26.1–29.0)% |
| Region I | 1,107 | 60.9 (59.9–61.9) | 1,250 | 59.3 (58.2–60.3) | 1,131 | 14.2 (13.5–15.0)% | 31.6 (30.7–32.5)% |
| Region III | 1,364 | 62.8 (61.8–63.9) | 1,786 | 59.1 (58.2–60.0) | 1,384 | 18.4 (17.7–19.2)% | 28.8 (28.0–29.7)% |
| Region IX | 792 | 54.4 (53.2–55.6) | 795 | 53.9 (52.6–55.2) | 810 | 15.0 (13.9–16.0)% | 34.2 (32.8–35.5)% |
| Region VIII | 1,962 | 69.9 (68.8–70.9) | 2,027 | 66.5 (65.6–67.4) | 2,024 | 12.7 (12.1–13.3)% | 31.2 (30.3–32.2)% |
Show the data as a table
| Division (region) | ELLNA mean (95% CI) | ELLNA rank (95% interval) | NAT mean (95% CI) | NAT rank | CRLA at grade level (95% CI) | CRLA rank |
|---|---|---|---|---|---|---|
| Abra (CAR) | 64.6 (62.0–67.3) | 20 (15–24) | 57.9 (55.5–60.2) | 25 (21–30) | 13.9 (12.0–16.1)% | 26 (16–35) |
| Apayao (CAR) | 58.5 (56.0–60.8) | 28 (25–33) | 50.6 (47.4–54.0) | 39 (33–43) | 13.7 (10.8–17.2)% | 27 (11–38) |
| Baguio City (CAR) | 56.4 (54.3–58.6) | 32 (28–37) | 57.6 (55.3–60.2) | 26 (21–31) | 16.2 (13.8–19.3)% | 16 (6–27) |
| Benguet (CAR) | 59.0 (53.8–64.6) | 27 (20–38) | 56.4 (54.4–58.5) | 29 (24–32) | 10.6 (9.2–11.9)% | 38 (34–41) |
| Ifugao (CAR) | 59.4 (56.6–62.2) | 26 (23–32) | 53.9 (51.6–56.3) | 33 (29–37) | 12.5 (10.5–14.4)% | 34 (24–38) |
| Kalinga (CAR) | 66.6 (62.1–70.9) | 16 (11–23) | 55.8 (52.2–59.4) | 30 (23–36) | 21.8 (17.8–26.4)% | 2 (1–9) |
| Mt. Province (CAR) | 61.3 (55.4–67.4) | 24 (15–34) | 53.9 (45.3–63.2) | 34 (16–44) | 16.2 (9.6–25.0)% | 15 (1–39) |
| Candon City (Region I) | 47.7 (45.6–50.0) | 43 (42–44) | 45.8 (42.8–48.4) | 44 (43–44) | 11.4 (7.2–15.4)% | 36 (20–44) |
| Dagupan City (Region I) | 56.5 (53.5–59.6) | 31 (26–39) | 60.1 (55.7–64.5) | 23 (14–30) | 14.3 (11.1–17.6)% | 25 (10–37) |
| Ilocos Norte (Region I) | 81.3 (78.4–83.8) | 1 (1–2) | 73.5 (70.6–76.2) | 3 (1–5) | 8.8 (7.1–10.7)% | 41 (38–44) |
| Ilocos Sur (Region I) | 65.8 (63.9–67.9) | 18 (14–21) | 61.5 (59.7–63.2) | 17 (15–23) | 15.8 (13.9–18.0)% | 21 (9–27) |
| La Union (Region I) | 66.8 (65.1–68.6) | 15 (13–19) | 64.0 (62.0–65.9) | 14 (11–18) | 12.8 (11.2–14.5)% | 33 (24–37) |
| Laoag City (Region I) | 69.0 (65.8–72.1) | 12 (10–18) | 64.3 (60.5–68.3) | 13 (7–21) | 16.7 (12.9–19.8)% | 10 (6–31) |
| Pangasinan I, Lingayen (Region I) | 55.2 (53.5–56.9) | 34 (31–39) | 55.0 (53.0–56.8) | 31 (27–35) | 14.9 (13.6–16.5)% | 23 (14–28) |
| Pangasinan II, Binalonan (Region I) | 54.5 (52.1–57.3) | 37 (30–40) | 50.2 (47.7–53.0) | 41 (34–43) | 16.7 (14.6–19.1)% | 11 (7–24) |
| San Carlos City (Region I) | 65.0 (61.9–68.3) | 19 (13–23) | 63.4 (60.2–66.5) | 15 (10–22) | 13.4 (11.0–15.8)% | 29 (18–37) |
| Urdaneta City (Region I) | 67.0 (62.6–71.8) | 14 (10–22) | 68.1 (63.8–71.0) | 8 (5–15) | 10.5 (7.8–14.4)% | 39 (24–43) |
| Aurora (Region III) | 57.9 (55.1–60.8) | 30 (25–35) | 50.8 (47.9–53.7) | 38 (33–43) | 14.3 (11.8–16.7)% | 24 (13–35) |
| Bataan (Region III) | 68.0 (63.1–72.8) | 13 (9–22) | 61.4 (58.4–64.5) | 18 (14–24) | 12.4 (9.8–15.6)% | 35 (20–40) |
| Bulacan (Region III) | 63.1 (60.5–65.9) | 22 (18–25) | 60.9 (58.5–63.2) | 20 (15–25) | 20.9 (18.9–22.9)% | 4 (1–7) |
| City of San Jose Del Monte (Region III) | 52.1 (50.5–53.8) | 41 (38–42) | 48.8 (46.6–51.6) | 43 (37–44) | 16.2 (14.2–18.2)% | 18 (8–25) |
| Mabalacat City (Region III) | 54.1 (50.7–57.7) | 38 (30–42) | 51.4 (48.4–54.5) | 37 (32–43) | 17.8 (14.6–21.2)% | 8 (4–24) |
| Nueva Ecija (Region III) | 76.5 (74.5–78.4) | 3 (2–7) | 67.6 (65.7–69.4) | 9 (6–12) | 20.9 (18.9–22.9)% | 5 (1–7) |
| Pampanga (Region III) | 58.0 (56.3–59.7) | 29 (26–32) | 57.1 (55.4–58.8) | 27 (23–31) | 18.3 (17.0–19.5)% | 7 (6–13) |
| San Jose City (Region III) | 60.8 (57.1–65.0) | 25 (19–31) | 59.0 (55.4–63.4) | 24 (15–30) | 16.0 (13.2–19.0)% | 19 (7–29) |
| Science City of Muñoz (Region III) | 56.2 (52.3–59.5) | 33 (27–40) | 56.8 (53.8–59.8) | 28 (22–33) | 24.1 (17.7–30.7)% | 1 (1–9) |
| Tarlac (Region III) | 77.5 (75.1–79.7) | 2 (2–6) | 65.7 (63.4–67.8) | 11 (8–15) | 21.7 (19.6–23.8)% | 3 (1–6) |
| Tarlac City (Region III) | 54.8 (52.4–57.3) | 36 (30–40) | 61.2 (59.0–63.6) | 19 (15–24) | 16.6 (14.2–19.1)% | 14 (7–25) |
| Zambales (Region III) | 50.4 (48.5–52.3) | 42 (40–43) | 52.3 (50.4–54.4) | 35 (32–40) | 13.3 (11.2–15.6)% | 30 (18–37) |
| Pagadian City (Region IX) | 45.4 (43.2–47.7) | 44 (43–44) | 50.4 (46.7–53.9) | 40 (33–43) | 16.0 (12.9–18.7)% | 20 (7–31) |
| Zamboanga Sibugay (Region IX) | 62.0 (59.8–64.3) | 23 (20–26) | 60.2 (57.4–62.9) | 22 (16–27) | 16.2 (14.0–18.6)% | 17 (7–27) |
| Zamboanga del Norte (Region IX) | 54.0 (51.8–56.3) | 39 (32–41) | 50.2 (48.2–52.3) | 42 (36–43) | 13.1 (11.5–14.8)% | 31 (23–36) |
| Zamboanga del Sur (Region IX) | 55.1 (53.2–57.1) | 35 (30–40) | 54.1 (52.3–56.0) | 32 (29–36) | 15.6 (13.7–17.5)% | 22 (10–28) |
| Biliran (Region VIII) | 75.5 (73.0–78.4) | 5 (2–9) | 73.6 (70.7–76.3) | 2 (1–5) | 11.3 (9.2–13.4)% | 37 (29–41) |
| Borongan City (Region VIII) | 71.6 (67.2–76.7) | 10 (4–15) | 68.2 (63.8–71.9) | 7 (5–14) | 19.9 (15.5–23.3)% | 6 (1–20) |
| Calbayog City (Region VIII) | 73.2 (70.6–75.8) | 9 (5–11) | 74.4 (72.6–76.1) | 1 (1–4) | 8.6 (6.5–11.1)% | 42 (37–44) |
| Catbalogan City (Region VIII) | 64.4 (59.5–70.1) | 21 (12–26) | 63.4 (56.5–69.1) | 16 (6–28) | 9.7 (6.9–12.3)% | 40 (33–44) |
| Eastern Samar (Region VIII) | 70.7 (67.8–73.4) | 11 (9–14) | 65.7 (63.8–67.6) | 12 (8–15) | 13.5 (11.9–15.2)% | 28 (21–35) |
| Leyte (Region VIII) | 74.9 (73.6–76.2) | 7 (4–9) | 72.9 (71.7–74.1) | 4 (2–5) | 16.6 (15.2–18.0)% | 12 (8–22) |
| Northern Samar (Region VIII) | 53.2 (51.0–55.6) | 40 (34–41) | 52.3 (50.2–54.2) | 36 (32–40) | 8.4 (7.5–9.5)% | 43 (40–44) |
| Ormoc City (Region VIII) | 73.7 (71.4–76.0) | 8 (4–11) | 71.7 (65.7–76.6) | 5 (1–11) | 16.6 (14.3–19.1)% | 13 (7–25) |
| Samar (Western Samar) (Region VIII) | 75.0 (72.7–77.3) | 6 (3–10) | 66.3 (64.6–68.0) | 10 (7–14) | 12.9 (11.2–14.5)% | 32 (24–37) |
| Southern Leyte (Region VIII) | 76.0 (72.8–79.1) | 4 (2–9) | 68.9 (66.2–71.5) | 6 (5–11) | 17.0 (15.1–19.0)% | 9 (7–22) |
| Tacloban City (Region VIII) | 66.3 (61.3–71.4) | 17 (11–24) | 60.4 (55.2–65.4) | 21 (12–31) | 7.7 (5.3–10.7)% | 44 (38–44) |
Show the data as a table
| Division (region) | ELLNA mean (95% CI) | ELLNA rank (95% interval) | NAT mean (95% CI) | NAT rank | CRLA at grade level (95% CI) | CRLA rank |
|---|---|---|---|---|---|---|
| Abra (CAR) | 64.6 (62.0–67.3) | 20 (15–24) | 57.9 (55.5–60.2) | 25 (21–30) | 13.9 (12.0–16.1)% | 26 (16–35) |
| Apayao (CAR) | 58.5 (56.0–60.8) | 28 (25–33) | 50.6 (47.4–54.0) | 39 (33–43) | 13.7 (10.8–17.2)% | 27 (11–38) |
| Baguio City (CAR) | 56.4 (54.3–58.6) | 32 (28–37) | 57.6 (55.3–60.2) | 26 (21–31) | 16.2 (13.8–19.3)% | 16 (6–27) |
| Benguet (CAR) | 59.0 (53.8–64.6) | 27 (20–38) | 56.4 (54.4–58.5) | 29 (24–32) | 10.6 (9.2–11.9)% | 38 (34–41) |
| Ifugao (CAR) | 59.4 (56.6–62.2) | 26 (23–32) | 53.9 (51.6–56.3) | 33 (29–37) | 12.5 (10.5–14.4)% | 34 (24–38) |
| Kalinga (CAR) | 66.6 (62.1–70.9) | 16 (11–23) | 55.8 (52.2–59.4) | 30 (23–36) | 21.8 (17.8–26.4)% | 2 (1–9) |
| Mt. Province (CAR) | 61.3 (55.4–67.4) | 24 (15–34) | 53.9 (45.3–63.2) | 34 (16–44) | 16.2 (9.6–25.0)% | 15 (1–39) |
| Candon City (Region I) | 47.7 (45.6–50.0) | 43 (42–44) | 45.8 (42.8–48.4) | 44 (43–44) | 11.4 (7.2–15.4)% | 36 (20–44) |
| Dagupan City (Region I) | 56.5 (53.5–59.6) | 31 (26–39) | 60.1 (55.7–64.5) | 23 (14–30) | 14.3 (11.1–17.6)% | 25 (10–37) |
| Ilocos Norte (Region I) | 81.3 (78.4–83.8) | 1 (1–2) | 73.5 (70.6–76.2) | 3 (1–5) | 8.8 (7.1–10.7)% | 41 (38–44) |
| Ilocos Sur (Region I) | 65.8 (63.9–67.9) | 18 (14–21) | 61.5 (59.7–63.2) | 17 (15–23) | 15.8 (13.9–18.0)% | 21 (9–27) |
| La Union (Region I) | 66.8 (65.1–68.6) | 15 (13–19) | 64.0 (62.0–65.9) | 14 (11–18) | 12.8 (11.2–14.5)% | 33 (24–37) |
| Laoag City (Region I) | 69.0 (65.8–72.1) | 12 (10–18) | 64.3 (60.5–68.3) | 13 (7–21) | 16.7 (12.9–19.8)% | 10 (6–31) |
| Pangasinan I, Lingayen (Region I) | 55.2 (53.5–56.9) | 34 (31–39) | 55.0 (53.0–56.8) | 31 (27–35) | 14.9 (13.6–16.5)% | 23 (14–28) |
| Pangasinan II, Binalonan (Region I) | 54.5 (52.1–57.3) | 37 (30–40) | 50.2 (47.7–53.0) | 41 (34–43) | 16.7 (14.6–19.1)% | 11 (7–24) |
| San Carlos City (Region I) | 65.0 (61.9–68.3) | 19 (13–23) | 63.4 (60.2–66.5) | 15 (10–22) | 13.4 (11.0–15.8)% | 29 (18–37) |
| Urdaneta City (Region I) | 67.0 (62.6–71.8) | 14 (10–22) | 68.1 (63.8–71.0) | 8 (5–15) | 10.5 (7.8–14.4)% | 39 (24–43) |
| Aurora (Region III) | 57.9 (55.1–60.8) | 30 (25–35) | 50.8 (47.9–53.7) | 38 (33–43) | 14.3 (11.8–16.7)% | 24 (13–35) |
| Bataan (Region III) | 68.0 (63.1–72.8) | 13 (9–22) | 61.4 (58.4–64.5) | 18 (14–24) | 12.4 (9.8–15.6)% | 35 (20–40) |
| Bulacan (Region III) | 63.1 (60.5–65.9) | 22 (18–25) | 60.9 (58.5–63.2) | 20 (15–25) | 20.9 (18.9–22.9)% | 4 (1–7) |
| City of San Jose Del Monte (Region III) | 52.1 (50.5–53.8) | 41 (38–42) | 48.8 (46.6–51.6) | 43 (37–44) | 16.2 (14.2–18.2)% | 18 (8–25) |
| Mabalacat City (Region III) | 54.1 (50.7–57.7) | 38 (30–42) | 51.4 (48.4–54.5) | 37 (32–43) | 17.8 (14.6–21.2)% | 8 (4–24) |
| Nueva Ecija (Region III) | 76.5 (74.5–78.4) | 3 (2–7) | 67.6 (65.7–69.4) | 9 (6–12) | 20.9 (18.9–22.9)% | 5 (1–7) |
| Pampanga (Region III) | 58.0 (56.3–59.7) | 29 (26–32) | 57.1 (55.4–58.8) | 27 (23–31) | 18.3 (17.0–19.5)% | 7 (6–13) |
| San Jose City (Region III) | 60.8 (57.1–65.0) | 25 (19–31) | 59.0 (55.4–63.4) | 24 (15–30) | 16.0 (13.2–19.0)% | 19 (7–29) |
| Science City of Muñoz (Region III) | 56.2 (52.3–59.5) | 33 (27–40) | 56.8 (53.8–59.8) | 28 (22–33) | 24.1 (17.7–30.7)% | 1 (1–9) |
| Tarlac (Region III) | 77.5 (75.1–79.7) | 2 (2–6) | 65.7 (63.4–67.8) | 11 (8–15) | 21.7 (19.6–23.8)% | 3 (1–6) |
| Tarlac City (Region III) | 54.8 (52.4–57.3) | 36 (30–40) | 61.2 (59.0–63.6) | 19 (15–24) | 16.6 (14.2–19.1)% | 14 (7–25) |
| Zambales (Region III) | 50.4 (48.5–52.3) | 42 (40–43) | 52.3 (50.4–54.4) | 35 (32–40) | 13.3 (11.2–15.6)% | 30 (18–37) |
| Pagadian City (Region IX) | 45.4 (43.2–47.7) | 44 (43–44) | 50.4 (46.7–53.9) | 40 (33–43) | 16.0 (12.9–18.7)% | 20 (7–31) |
| Zamboanga Sibugay (Region IX) | 62.0 (59.8–64.3) | 23 (20–26) | 60.2 (57.4–62.9) | 22 (16–27) | 16.2 (14.0–18.6)% | 17 (7–27) |
| Zamboanga del Norte (Region IX) | 54.0 (51.8–56.3) | 39 (32–41) | 50.2 (48.2–52.3) | 42 (36–43) | 13.1 (11.5–14.8)% | 31 (23–36) |
| Zamboanga del Sur (Region IX) | 55.1 (53.2–57.1) | 35 (30–40) | 54.1 (52.3–56.0) | 32 (29–36) | 15.6 (13.7–17.5)% | 22 (10–28) |
| Biliran (Region VIII) | 75.5 (73.0–78.4) | 5 (2–9) | 73.6 (70.7–76.3) | 2 (1–5) | 11.3 (9.2–13.4)% | 37 (29–41) |
| Borongan City (Region VIII) | 71.6 (67.2–76.7) | 10 (4–15) | 68.2 (63.8–71.9) | 7 (5–14) | 19.9 (15.5–23.3)% | 6 (1–20) |
| Calbayog City (Region VIII) | 73.2 (70.6–75.8) | 9 (5–11) | 74.4 (72.6–76.1) | 1 (1–4) | 8.6 (6.5–11.1)% | 42 (37–44) |
| Catbalogan City (Region VIII) | 64.4 (59.5–70.1) | 21 (12–26) | 63.4 (56.5–69.1) | 16 (6–28) | 9.7 (6.9–12.3)% | 40 (33–44) |
| Eastern Samar (Region VIII) | 70.7 (67.8–73.4) | 11 (9–14) | 65.7 (63.8–67.6) | 12 (8–15) | 13.5 (11.9–15.2)% | 28 (21–35) |
| Leyte (Region VIII) | 74.9 (73.6–76.2) | 7 (4–9) | 72.9 (71.7–74.1) | 4 (2–5) | 16.6 (15.2–18.0)% | 12 (8–22) |
| Northern Samar (Region VIII) | 53.2 (51.0–55.6) | 40 (34–41) | 52.3 (50.2–54.2) | 36 (32–40) | 8.4 (7.5–9.5)% | 43 (40–44) |
| Ormoc City (Region VIII) | 73.7 (71.4–76.0) | 8 (4–11) | 71.7 (65.7–76.6) | 5 (1–11) | 16.6 (14.3–19.1)% | 13 (7–25) |
| Samar (Western Samar) (Region VIII) | 75.0 (72.7–77.3) | 6 (3–10) | 66.3 (64.6–68.0) | 10 (7–14) | 12.9 (11.2–14.5)% | 32 (24–37) |
| Southern Leyte (Region VIII) | 76.0 (72.8–79.1) | 4 (2–9) | 68.9 (66.2–71.5) | 6 (5–11) | 17.0 (15.1–19.0)% | 9 (7–22) |
| Tacloban City (Region VIII) | 66.3 (61.3–71.4) | 17 (11–24) | 60.4 (55.2–65.4) | 21 (12–31) | 7.7 (5.3–10.7)% | 44 (38–44) |
Show the data as a table
| Region | Not Proficient | Low Proficient | Nearly Proficient | Proficient | Highly Proficient |
|---|---|---|---|---|---|
| CAR | 0.1% | 18.2% | 66.8% | 14.5% | 0.4% |
| Region I | 0.0% | 27.4% | 54.6% | 15.8% | 2.3% |
| Region III | 0.0% | 24.2% | 50.0% | 20.2% | 5.6% |
| Region IX | 0.0% | 46.3% | 43.2% | 10.3% | 0.2% |
| Region VIII | 0.2% | 12.2% | 43.8% | 38.8% | 5.0% |
| All assessed | 0.1% | 23.9% | 49.5% | 22.5% | 4.0% |
| Region | Not Proficient | Low Proficient | Nearly Proficient | Proficient | Highly Proficient |
|---|---|---|---|---|---|
| CAR | 0.1% | 28.9% | 66.8% | 4.2% | 0.0% |
| Region I | 0.0% | 30.2% | 54.5% | 15.1% | 0.2% |
| Region III | 0.0% | 29.8% | 55.7% | 14.5% | 0.0% |
| Region IX | 0.1% | 38.3% | 55.5% | 6.2% | 0.0% |
| Region VIII | 0.1% | 16.7% | 48.2% | 34.3% | 0.6% |
| All assessed | 0.0% | 27.3% | 54.3% | 18.2% | 0.2% |
| Assessment and component | Schools | Weighted mean (95% CI) | Schools with a mean of 75 or more |
|---|---|---|---|
| ELLNA English | 5,752 | 64.5 (63.9–65.1) | 35% |
| ELLNA Filipino | 5,752 | 66.9 (66.4–67.4) | 39% |
| ELLNA Numeracy | 5,598 | 53.6 (52.7–54.5) | 26% |
| ELLNA Mother Tongue | 3,827 | 62.2 (61.5–62.9) | 31% |
| NAT Filipino | 6,636 | 66.0 (65.6–66.4) | 27% |
| NAT Mathematics | 6,636 | 56.4 (55.7–57.1) | 21% |
| NAT English | 6,636 | 63.2 (62.6–63.7) | 28% |
| NAT Science | 6,636 | 53.8 (53.2–54.3) | 10% |
| NAT Araling Panlipunan | 6,636 | 62.1 (61.5–62.7) | 29% |
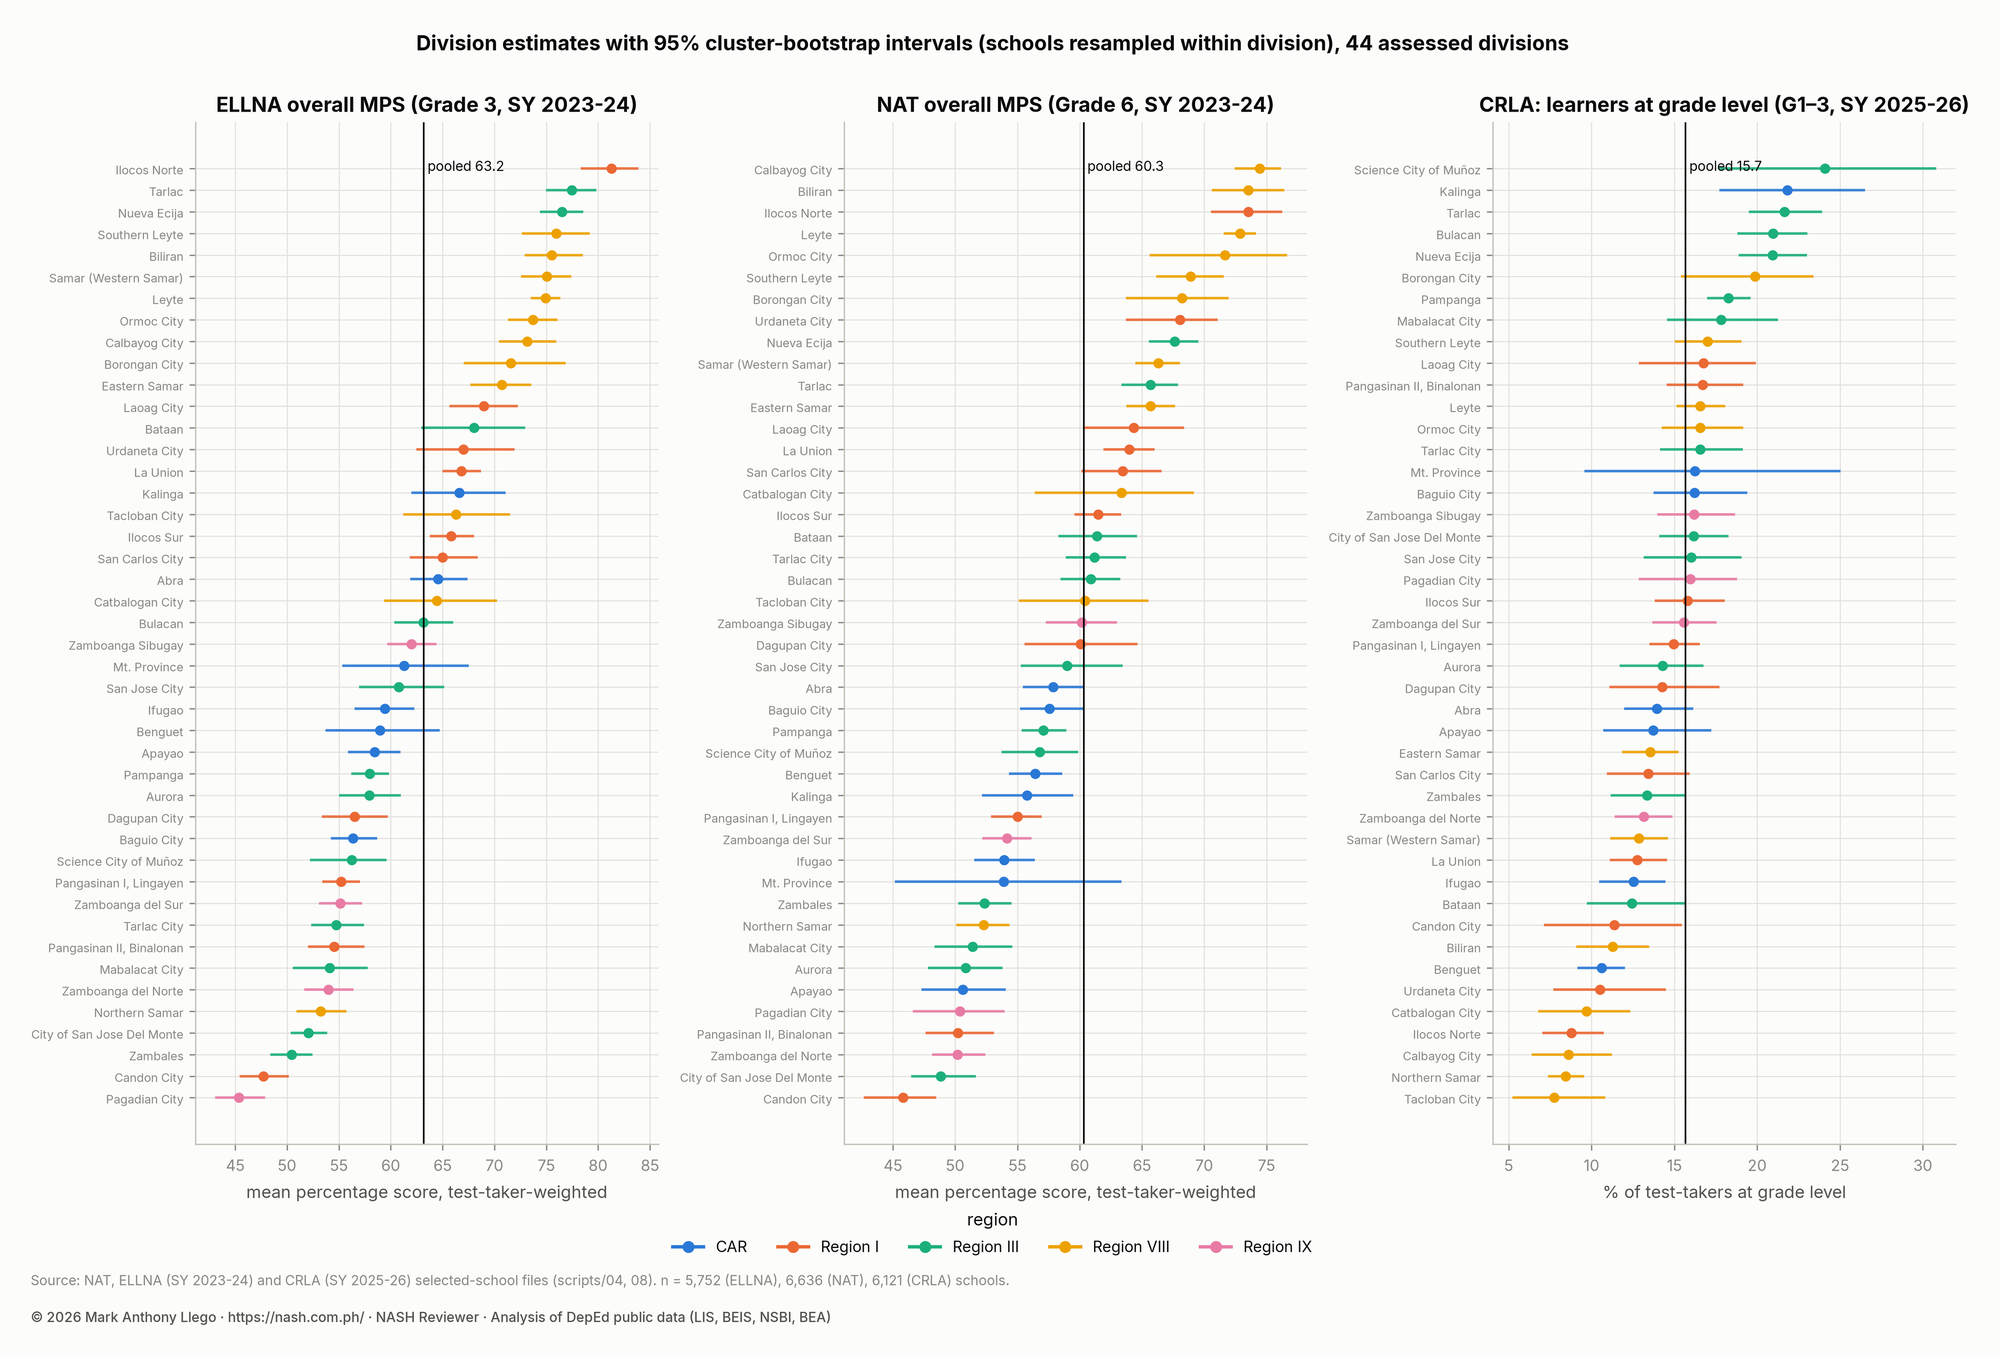
Region VIII ranks first on both tests, with an ELLNA mean of 69.9 and a NAT mean of 66.5. Region IX ranks last, with 54.4 and 53.9. The intervals are about one point wide, so these ranks are not in doubt. CAR, Region I and Region III have means between 56 and 63.
Across the 44 divisions, the ELLNA mean runs from 45.4 in Pagadian City to 81.3 in Ilocos Norte. The NAT mean runs from 45.8 in Candon City to 74.4 in Calbayog City. After adjusting for the 44 comparisons, 18 divisions are significantly below the pooled ELLNA mean and 14 are above it. For NAT, 18 are below and 13 above.
Differences between divisions account for 36% of the weighted variance in ELLNA school means and 27% in NAT. Differences between regions account for 8%. Most of the variation is between schools inside the same division, which is where a school head works.
Divisions in the middle of the table cannot be distinguished from each other: their 95% rank intervals span five to ten places. Only the top and bottom of the table should be read as a ranking.
The weakest subjects are ELLNA Numeracy at 53.6, NAT Science at 53.8 and NAT Mathematics at 56.4. Filipino is the strongest subject on both tests. Only 10% of assessed schools have a NAT Science mean of 75 or more.
Within the same schools, the ELLNA and NAT means correlate at 0.62. A school with low Grade 3 results tends to have low Grade 6 results too.
CRLA results: reading levels in Grades 1 to 3
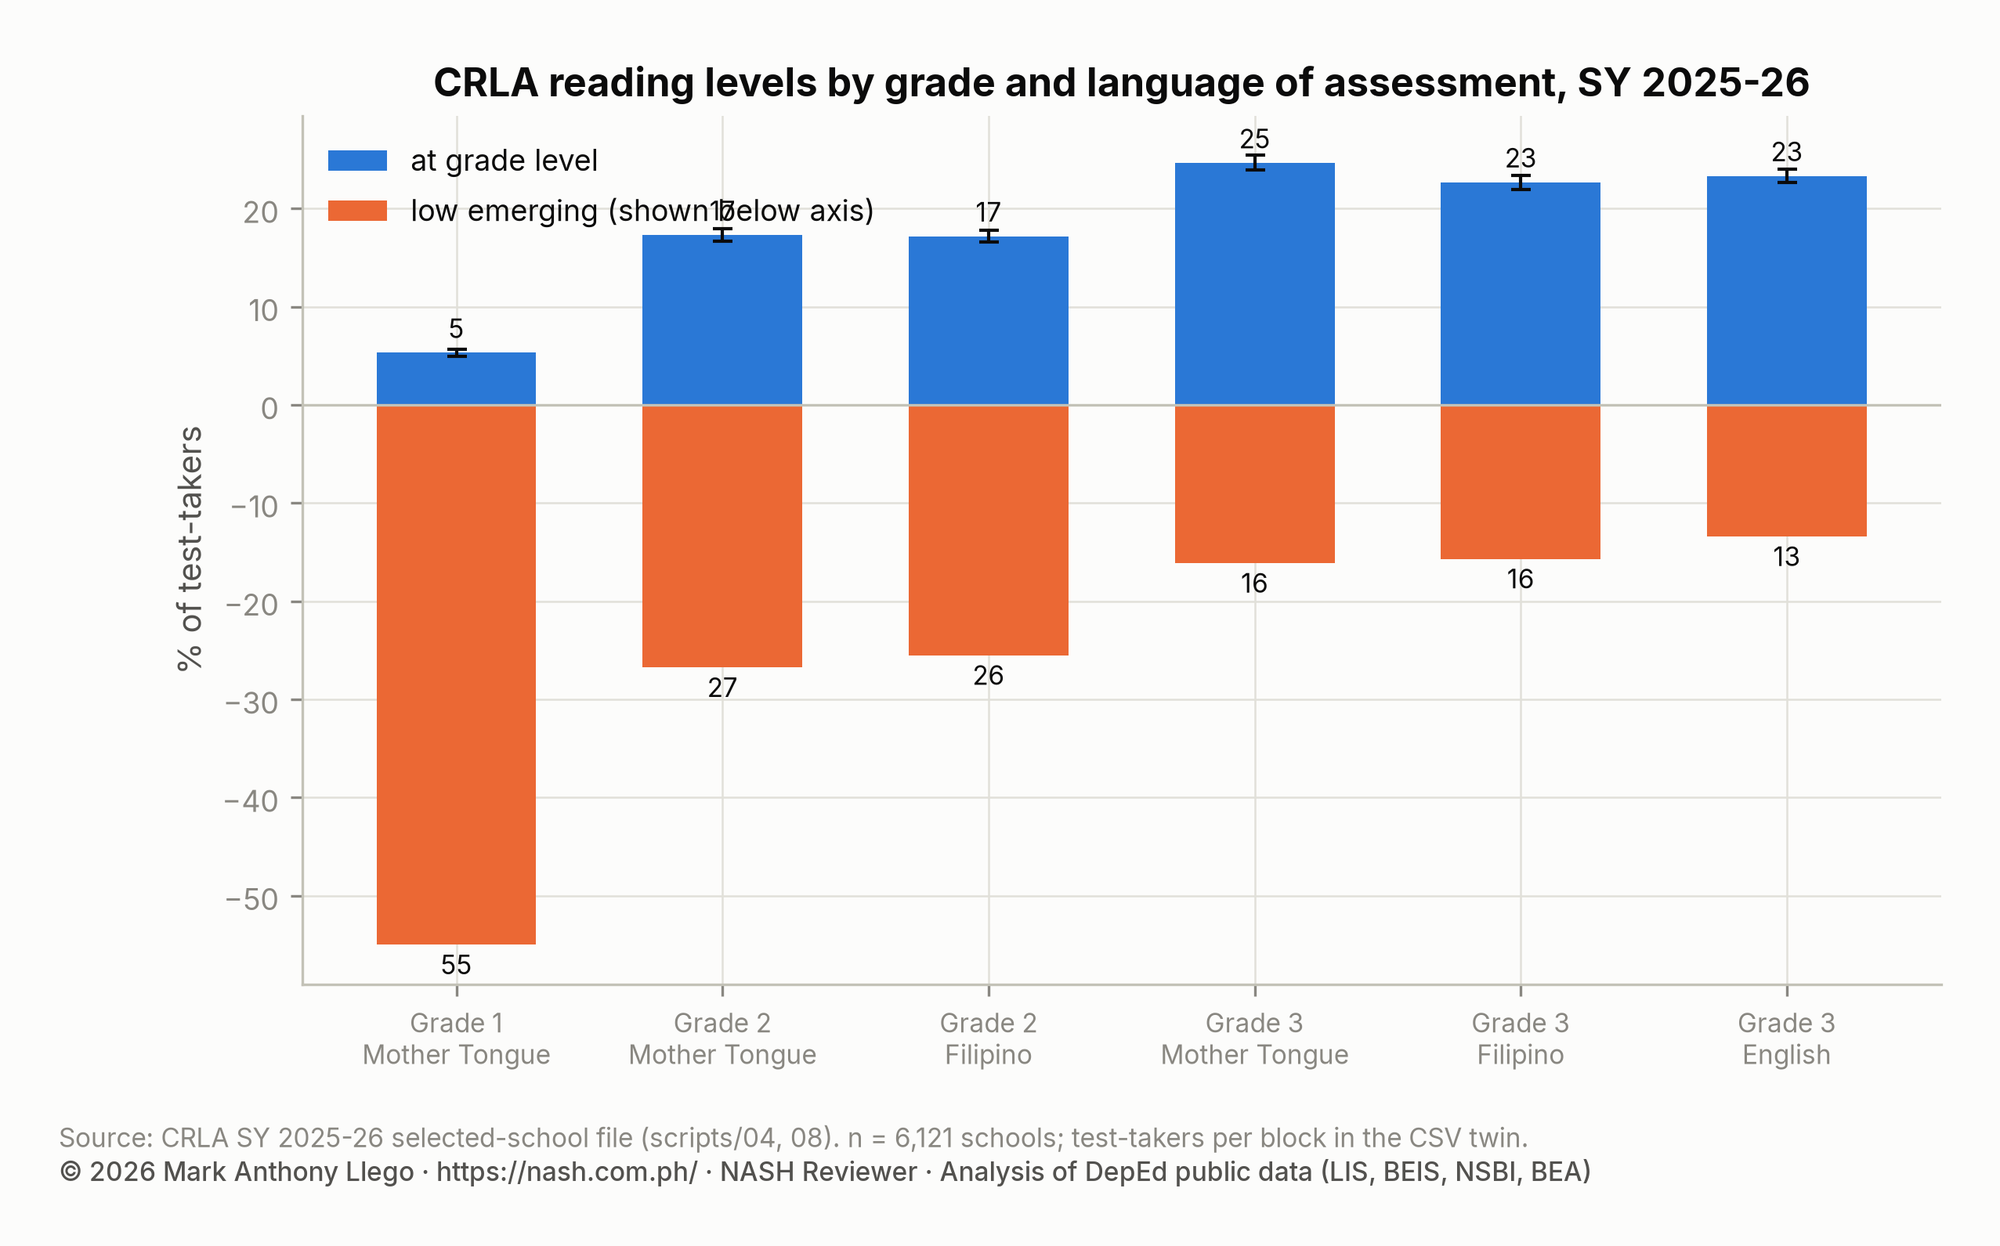
In SY 2025-26, 15.7% of the 647,681 Grade 1–3 test-takers in the assessed schools read at grade level. The share at the lowest level, “low emerging”, was 30.3%.
Show the data as a table
| Grade and language | Schools | Test-takers | At grade level (95% CI) | Low emerging (95% CI) |
|---|---|---|---|---|
| Grade 1, Mother Tongue | 6,090 | 199,903 | 5.3 (5.0–5.7)% | 55.0 (54.2–55.9)% |
| Grade 2, Mother Tongue | 6,060 | 221,487 | 17.3 (16.7–17.9)% | 26.7 (26.1–27.4)% |
| Grade 2, Filipino | 6,096 | 220,074 | 17.2 (16.6–17.8)% | 25.5 (24.9–26.1)% |
| Grade 3, Mother Tongue | 5,920 | 227,945 | 24.6 (23.9–25.4)% | 16.1 (15.6–16.6)% |
| Grade 3, Filipino | 6,056 | 232,270 | 22.7 (22.0–23.4)% | 15.7 (15.2–16.1)% |
| Grade 3, English | 5,918 | 227,704 | 23.3 (22.7–24.0)% | 13.4 (12.9–13.9)% |
| Language of instruction | Schools | Test-takers | At grade level (95% CI) |
|---|---|---|---|
| Kapampangan | 83 | 14,335 | 19.4 (17.0–22.3)% |
| Tagalog | 2,135 | 336,387 | 17.3 (16.7–18.0)% |
| Sinugbuanong Binisaya/Cebuano | 1,352 | 112,527 | 14.8 (14.0–15.6)% |
| Pangasinan/Pangasinense | 157 | 25,511 | 14.6 (13.0–16.0)% |
| Ilokano/Iloko | 940 | 57,298 | 14.0 (13.1–14.8)% |
| Waray | 1,435 | 99,875 | 12.0 (11.2–12.8)% |
The gap is largest in Grade 1. Only 5.3% of Grade 1 learners read at grade level in Mother Tongue, with a 95% interval of 5.0% to 5.7%. In the same grade, 55.0% are low emerging, with an interval of 54.2% to 55.9%. By Grade 3, the share at grade level is 24.6% in Mother Tongue, 22.7% in Filipino and 23.3% in English. The share at low emerging falls to 13% to 16%.
By region, Region III has the highest share at grade level, 18.4%, and Region VIII the lowest, 12.7%. Region IX has the largest share of low-emerging readers, 34.2%. By language of instruction, Kapampangan schools are highest at 19.4% and Tagalog schools next at 17.3%. Waray schools are lowest at 12.0%.
The CRLA does not agree with the other two tests. At school level, its share at grade level correlates at only 0.06 with the SY 2023-24 ELLNA mean. Divisions at the top of ELLNA and NAT, such as Ilocos Norte and Calbayog City, are near the bottom on CRLA. The CRLA is a rapid screening test given by teachers, two years later, to different cohorts, and DepEd has not documented its school-level summary. Treat it as a different measure, not as a contradiction.
Which school inputs are associated with test results
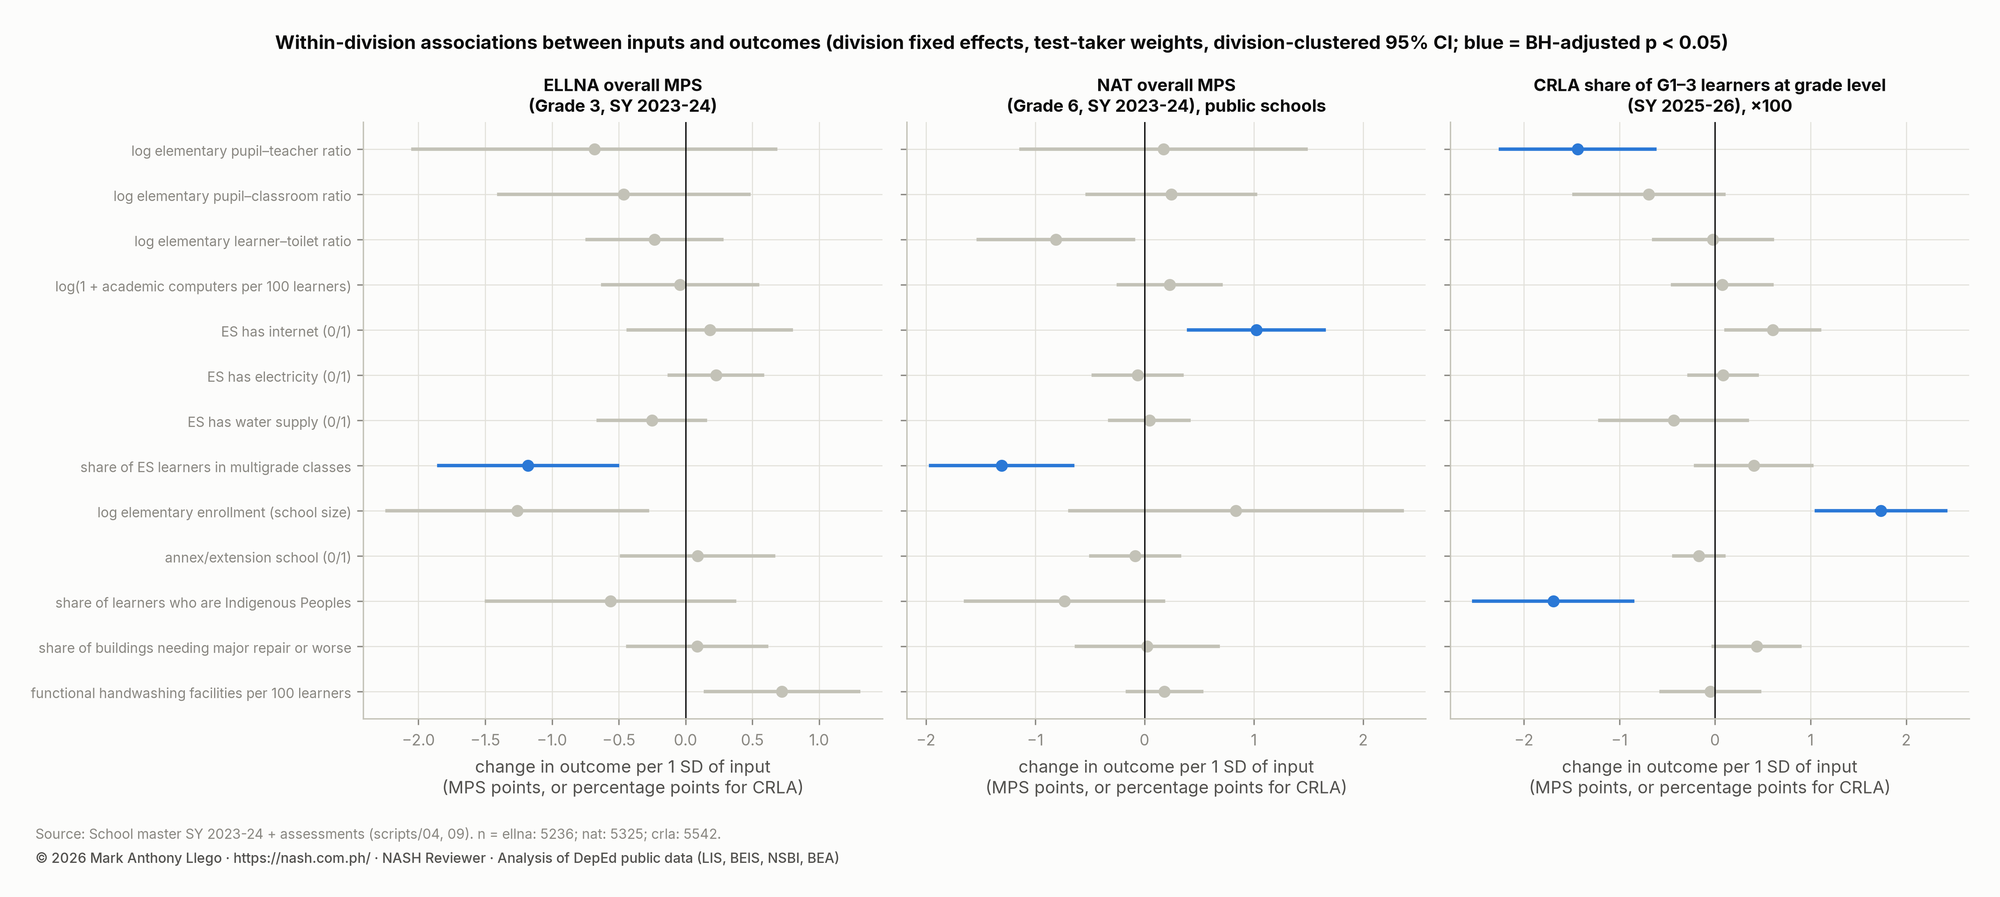
When schools are compared inside the same division, with results weighted by test-takers, most input ratios show a small association with scores or none. Multigrade organization and internet access are the two consistent exceptions.
Show the data as a table
| Input (per 1 SD) | ELLNA Grade 3 (MPS points) | NAT Grade 6 (MPS points) | CRLA Grades 1–3 (percentage points) |
|---|---|---|---|
| log elementary pupil–teacher ratio | -0.68 (-2.04 to +0.68) | +0.17 (-1.13 to +1.48) | -1.44 (-2.25 to -0.63) * |
| log elementary pupil–classroom ratio | -0.46 (-1.40 to +0.47) | +0.25 (-0.53 to +1.02) | -0.69 (-1.48 to +0.09) |
| log elementary learner–toilet ratio | -0.23 (-0.74 to +0.27) | -0.81 (-1.52 to -0.10) | -0.02 (-0.64 to +0.60) |
| log(1 + academic computers per 100 learners) | -0.04 (-0.62 to +0.54) | +0.23 (-0.24 to +0.70) | +0.07 (-0.45 to +0.59) |
| ES has internet (0/1) | +0.18 (-0.43 to +0.79) | +1.02 (+0.40 to +1.64) * | +0.61 (+0.12 to +1.09) |
| ES has electricity (0/1) | +0.23 (-0.12 to +0.58) | -0.06 (-0.47 to +0.34) | +0.09 (-0.27 to +0.44) |
| ES has water supply (0/1) | -0.25 (-0.65 to +0.15) | +0.05 (-0.32 to +0.41) | -0.43 (-1.21 to +0.34) |
| share of ES learners in multigrade classes | -1.18 (-1.85 to -0.51) * | -1.31 (-1.96 to -0.66) * | +0.40 (-0.20 to +1.01) |
| log elementary enrollment (school size) | -1.26 (-2.24 to -0.28) | +0.84 (-0.68 to +2.36) | +1.74 (+1.06 to +2.41) * |
| annex/extension school (0/1) | +0.09 (-0.48 to +0.66) | -0.09 (-0.49 to +0.32) | -0.17 (-0.43 to +0.09) |
| share of learners who are Indigenous Peoples | -0.56 (-1.49 to +0.37) | -0.73 (-1.64 to +0.17) | -1.69 (-2.52 to -0.86) * |
| share of buildings needing major repair or worse | +0.09 (-0.43 to +0.61) | +0.02 (-0.62 to +0.67) | +0.43 (-0.02 to +0.89) |
| functional handwashing facilities per 100 learners | +0.72 (+0.15 to +1.30) | +0.18 (-0.16 to +0.52) | -0.05 (-0.56 to +0.47) |
Show the data as a table
| Input (per 1 SD) | ELLNA Grade 3 (MPS points) | NAT Grade 6 (MPS points) | CRLA Grades 1–3 (percentage points) |
|---|---|---|---|
| log elementary pupil–teacher ratio | -0.68 (-2.04 to +0.68) | +0.17 (-1.13 to +1.48) | -1.44 (-2.25 to -0.63) * |
| log elementary pupil–classroom ratio | -0.46 (-1.40 to +0.47) | +0.25 (-0.53 to +1.02) | -0.69 (-1.48 to +0.09) |
| log elementary learner–toilet ratio | -0.23 (-0.74 to +0.27) | -0.81 (-1.52 to -0.10) | -0.02 (-0.64 to +0.60) |
| log(1 + academic computers per 100 learners) | -0.04 (-0.62 to +0.54) | +0.23 (-0.24 to +0.70) | +0.07 (-0.45 to +0.59) |
| ES has internet (0/1) | +0.18 (-0.43 to +0.79) | +1.02 (+0.40 to +1.64) * | +0.61 (+0.12 to +1.09) |
| ES has electricity (0/1) | +0.23 (-0.12 to +0.58) | -0.06 (-0.47 to +0.34) | +0.09 (-0.27 to +0.44) |
| ES has water supply (0/1) | -0.25 (-0.65 to +0.15) | +0.05 (-0.32 to +0.41) | -0.43 (-1.21 to +0.34) |
| share of ES learners in multigrade classes | -1.18 (-1.85 to -0.51) * | -1.31 (-1.96 to -0.66) * | +0.40 (-0.20 to +1.01) |
| log elementary enrollment (school size) | -1.26 (-2.24 to -0.28) | +0.84 (-0.68 to +2.36) | +1.74 (+1.06 to +2.41) * |
| annex/extension school (0/1) | +0.09 (-0.48 to +0.66) | -0.09 (-0.49 to +0.32) | -0.17 (-0.43 to +0.09) |
| share of learners who are Indigenous Peoples | -0.56 (-1.49 to +0.37) | -0.73 (-1.64 to +0.17) | -1.69 (-2.52 to -0.86) * |
| share of buildings needing major repair or worse | +0.09 (-0.43 to +0.61) | +0.02 (-0.62 to +0.67) | +0.43 (-0.02 to +0.89) |
| functional handwashing facilities per 100 learners | +0.72 (+0.15 to +1.30) | +0.18 (-0.16 to +0.52) | -0.05 (-0.56 to +0.47) |
Show the data as a table
| Outcome and input | Specifications | Same sign as baseline | CI excludes zero | Smallest coefficient | Largest coefficient |
|---|---|---|---|---|---|
| CRLA: ES has internet (0/1) | 9 | 9 | 8 | +0.42 | +0.99 |
| CRLA: log(1 + academic computers per 100 learners) | 9 | 7 | 0 | -0.39 | +0.09 |
| CRLA: log elementary enrollment (school size) | 9 | 9 | 9 | +1.16 | +1.81 |
| CRLA: log elementary learner–toilet ratio | 9 | 9 | 1 | -0.45 | -0.01 |
| CRLA: log elementary pupil–classroom ratio | 9 | 9 | 0 | -0.77 | -0.15 |
| CRLA: log elementary pupil–teacher ratio | 9 | 9 | 9 | -1.45 | -1.06 |
| CRLA: share of ES learners in multigrade classes | 9 | 9 | 0 | +0.31 | +0.48 |
| ELLNA: ES has internet (0/1) | 10 | 10 | 1 | +0.11 | +1.13 |
| ELLNA: log(1 + academic computers per 100 learners) | 10 | 10 | 0 | -0.46 | -0.03 |
| ELLNA: log elementary enrollment (school size) | 10 | 10 | 9 | -2.63 | -0.50 |
| ELLNA: log elementary learner–toilet ratio | 10 | 9 | 0 | -0.64 | +0.09 |
| ELLNA: log elementary pupil–classroom ratio | 10 | 10 | 1 | -0.94 | -0.38 |
| ELLNA: log elementary pupil–teacher ratio | 10 | 10 | 0 | -1.02 | -0.11 |
| ELLNA: share of ES learners in multigrade classes | 10 | 10 | 10 | -1.40 | -0.79 |
| NAT: ES has internet (0/1) | 9 | 9 | 8 | +0.95 | +2.07 |
| NAT: log(1 + academic computers per 100 learners) | 9 | 7 | 0 | -0.35 | +0.45 |
| NAT: log elementary enrollment (school size) | 9 | 8 | 1 | -0.58 | +1.34 |
| NAT: log elementary learner–toilet ratio | 9 | 9 | 6 | -1.34 | -0.52 |
| NAT: log elementary pupil–classroom ratio | 9 | 7 | 0 | -0.80 | +0.38 |
| NAT: log elementary pupil–teacher ratio | 9 | 7 | 0 | -0.54 | +1.61 |
| NAT: share of ES learners in multigrade classes | 9 | 9 | 8 | -1.42 | -1.17 |
Show the data as a table
| Assessment and alternative estimator | Rank correlation with baseline | Bottom-10 divisions in common |
|---|---|---|
| ELLNA: unweighted mean | 0.987 | 9 |
| ELLNA: school median | 0.984 | 9 |
| ELLNA: weighted mean n ge 10 | 1.000 | 10 |
| ELLNA: weighted mean shrunk | 1.000 | 10 |
| ELLNA: public only weighted mean | 1.000 | 10 |
| NAT: unweighted mean | 0.966 | 10 |
| NAT: school median | 0.955 | 8 |
| NAT: weighted mean n ge 5 | 0.991 | 8 |
| NAT: weighted mean shrunk | 1.000 | 10 |
| NAT: public only weighted mean | 0.992 | 10 |
| Indicator | Assessed schools (mean) | Not assessed (mean) | Standardised difference |
|---|---|---|---|
| elementary enrollment | 289.81 | 232.97 | +0.17 |
| elementary PTR | 21.68 | 20.59 | +0.15 |
| elementary PCR | 27.29 | 24.86 | +0.14 |
| elementary LTR | 24.00 | 21.60 | +0.09 |
| computers per 100 | 6.12 | 7.31 | -0.08 |
| multigrade share | 0.15 | 0.16 | -0.05 |
| IP share | 0.15 | 0.23 | -0.23 |
| bad buildings share | 0.39 | 0.39 | +0.01 |
| handwash per 100 | 6.00 | 6.95 | -0.15 |
| ES internet (share) | 0.79 | 0.76 | +0.06 |
| ES electricity (share) | 0.98 | 0.99 | -0.03 |
| ES water (share) | 0.98 | 0.99 | -0.05 |
| annex school (share) | 0.01 | 0.00 | +0.00 |
A higher share of elementary learners in multigrade classes is associated with lower scores: −1.2 ELLNA points and −1.3 NAT points per standard deviation. One standard deviation is a 0.31 change in the share. A fully multigrade school is therefore associated with about 3.8 ELLNA points and 4.2 NAT points less than a fully monograde school in the same division. The direction of the association holds in every region and every specification.
Internet access at the elementary level is associated with +1.0 NAT point per standard deviation, or about 2.6 points for a connected school compared with an unconnected one. It is also associated with 1.5 percentage points more Grade 1–3 readers at grade level. The ELLNA estimate is positive but imprecise.
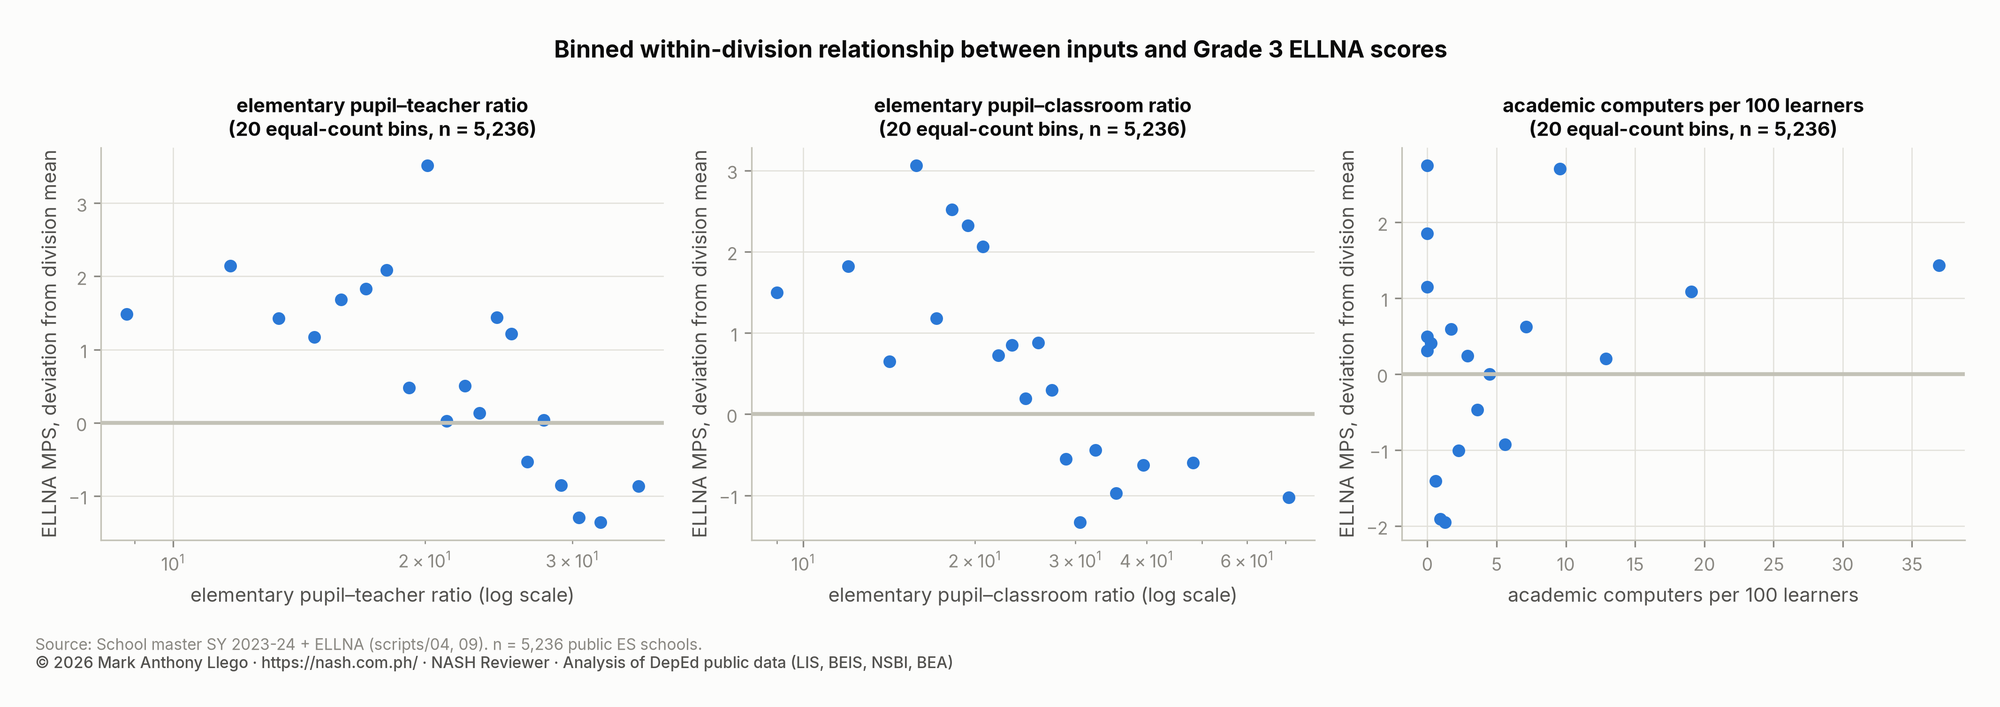
The pupil–teacher ratio is associated with early reading: −1.4 percentage points at grade level per standard deviation. That is about four points between a school with 15 learners per teacher and one with 45. It shows no detectable association with ELLNA or NAT. The pupil–classroom ratio, the learner–toilet ratio and computers per learner are not associated with any outcome once division and school size are held constant.
Larger schools score lower on ELLNA and higher on CRLA. A higher share of Indigenous Peoples learners is associated with lower results on all three tests, most clearly on CRLA.
All of these effects are small. The largest is 0.15 standard deviations of the outcome. Which division a school belongs to explains far more, with an intraclass correlation of 0.22 to 0.25 for ELLNA and NAT. These are associations in observational data, not causes. Multigrade schools are small and remote, connected schools are urban, and the files measure neither poverty nor teacher quality.
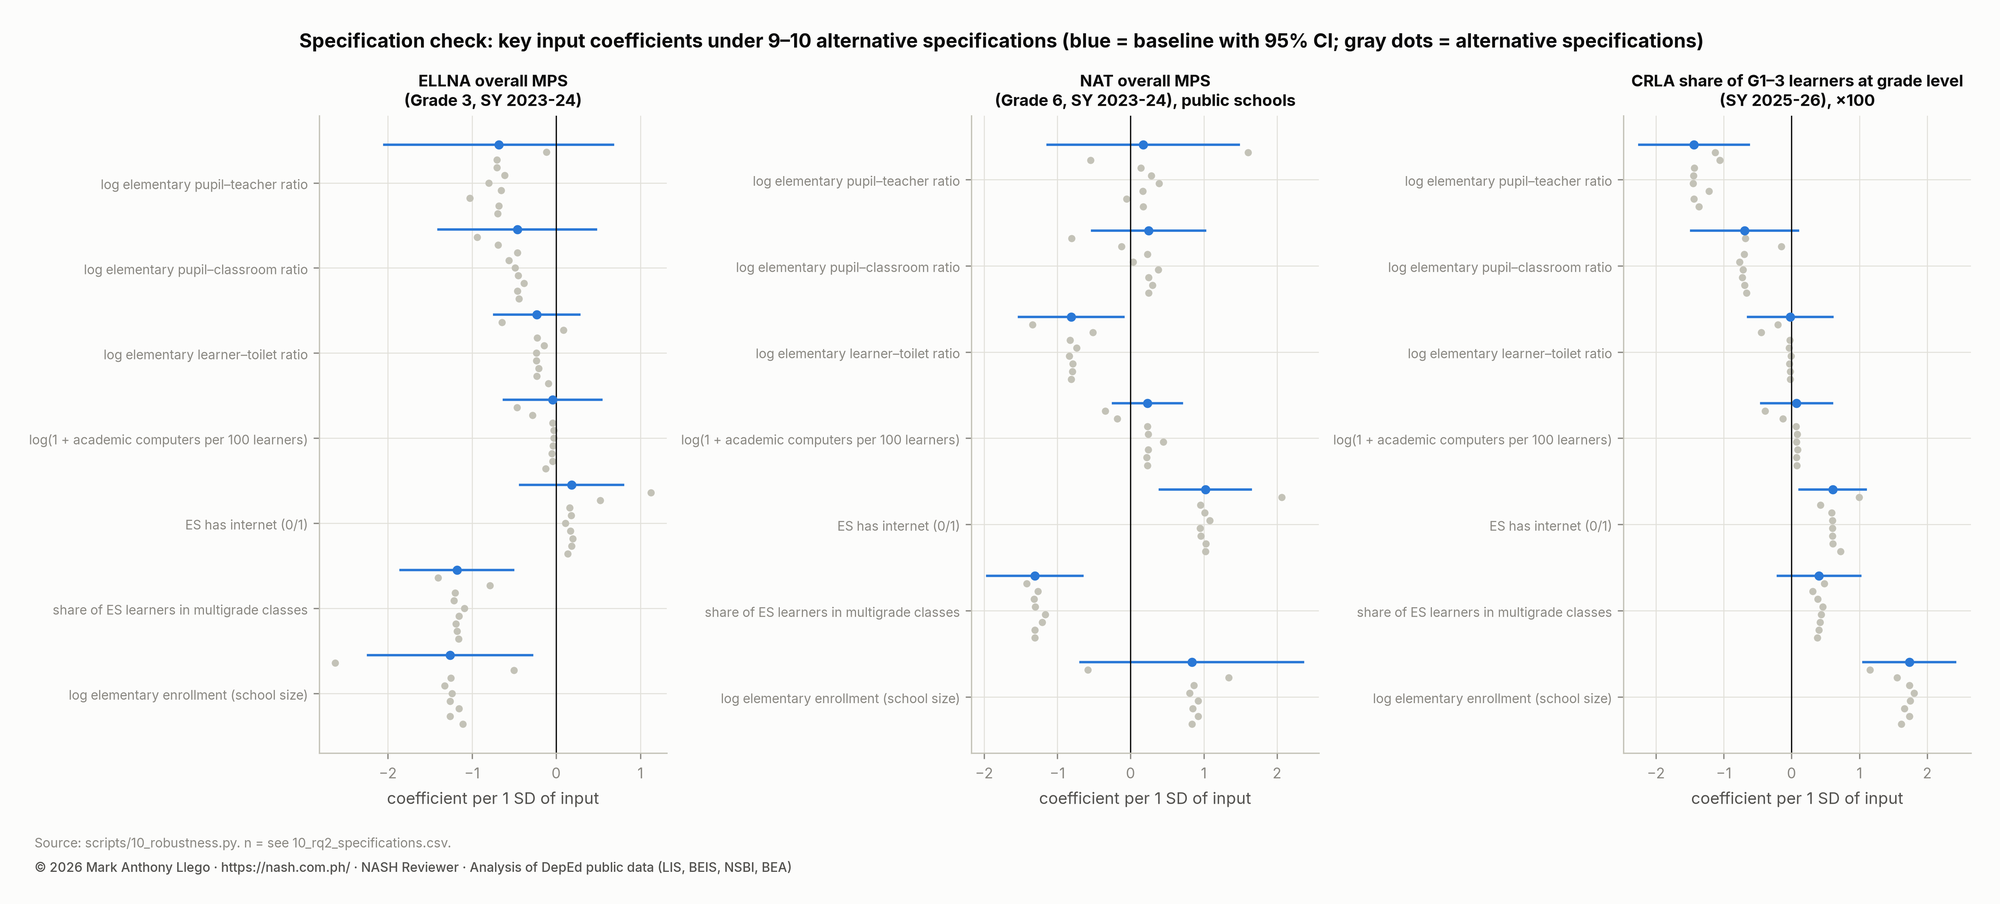
Replacing division fixed effects with region fixed effects moves several coefficients by more than their intervals. That shows how much division-level confounding the within-division design removes. Dropping the 219 to 264 most influential schools changes no reported coefficient by more than 0.2.
What the data mean for a school head
Six points from the data for a school head, or for someone preparing to become one.
Plan for fewer learners
Enrollment has fallen three years in a row, and the kindergarten cohorts entering now are the smallest in the series. A school improvement plan that assumes growth will build too much. A plan that assumes the national trend of −2.3% a year, adjusted for its region, will not.
Know whether your region is growing or shrinking
BARMM schools face rising enrollment and the fewest teachers, classrooms and toilets per learner in the country. Schools in Regions I, VI and VIII face falling enrollment, with the risk of merged classes and lost plantilla items. Each situation requires a different staffing request.
Compute ratios the way DepEd does
The pupil–teacher, pupil–classroom and learner–toilet ratios in your school profile are total learners divided by total teachers, rooms or bowls. The median school looks adequate on all three. The national ratios do not, because the shortage is concentrated in large schools.
Start with early reading and numeracy
In the assessed divisions, one Grade 1 learner in twenty reads at grade level in the mother tongue. The weakest subjects in Grades 3 and 6 are numeracy, mathematics and science. The PPSSH strands on curriculum, teaching and learner outcomes begin with these results.
Check multigrade classes and internet access
Multigrade organization and the lack of an internet connection are the two inputs associated with lower results after everything else is held constant. If your school has either, put it near the top of the improvement plan.
Read rankings with their intervals
School means based on a few tested learners change a lot from year to year. Compare your school with its division and with its own past results, not with a league table built from six test-takers.
How the figures were computed
The analysis can be re-run from the raw archives. These are the choices that determine what the charts show.
- Every count traces to a named file, column and script. The raw archives were never edited. The pipeline extracts them, audits them and builds one SY 2023-24 school master file of 60,167 schools and 207 columns, and a nine-year enrollment panel of 547,425 school-years.
- A blank was never treated as zero where the variable applied. A grade a school does not offer is 0. A blank for a level the school does offer is missing. Non-public rows in the public-only modules are blank by design.
- Regional ratios are totals divided by totals, as the technical notes define them, not averages of school ratios. Skewed indicators are described by medians and percentiles.
- Division and regional assessment estimates are means of school means, weighted by test-takers, with 95% intervals from resampling the schools within each division 2,000 times. Differences from the pooled mean are tested with the Benjamini–Hochberg adjustment across the 44 divisions.
- Proficiency bands are the bands in the technical notes (Not Proficient 0–24, Low 25–49, Nearly 50–74, Proficient 75–89, Highly 90–100), applied to school mean percentage scores, the only scores DepEd publishes.
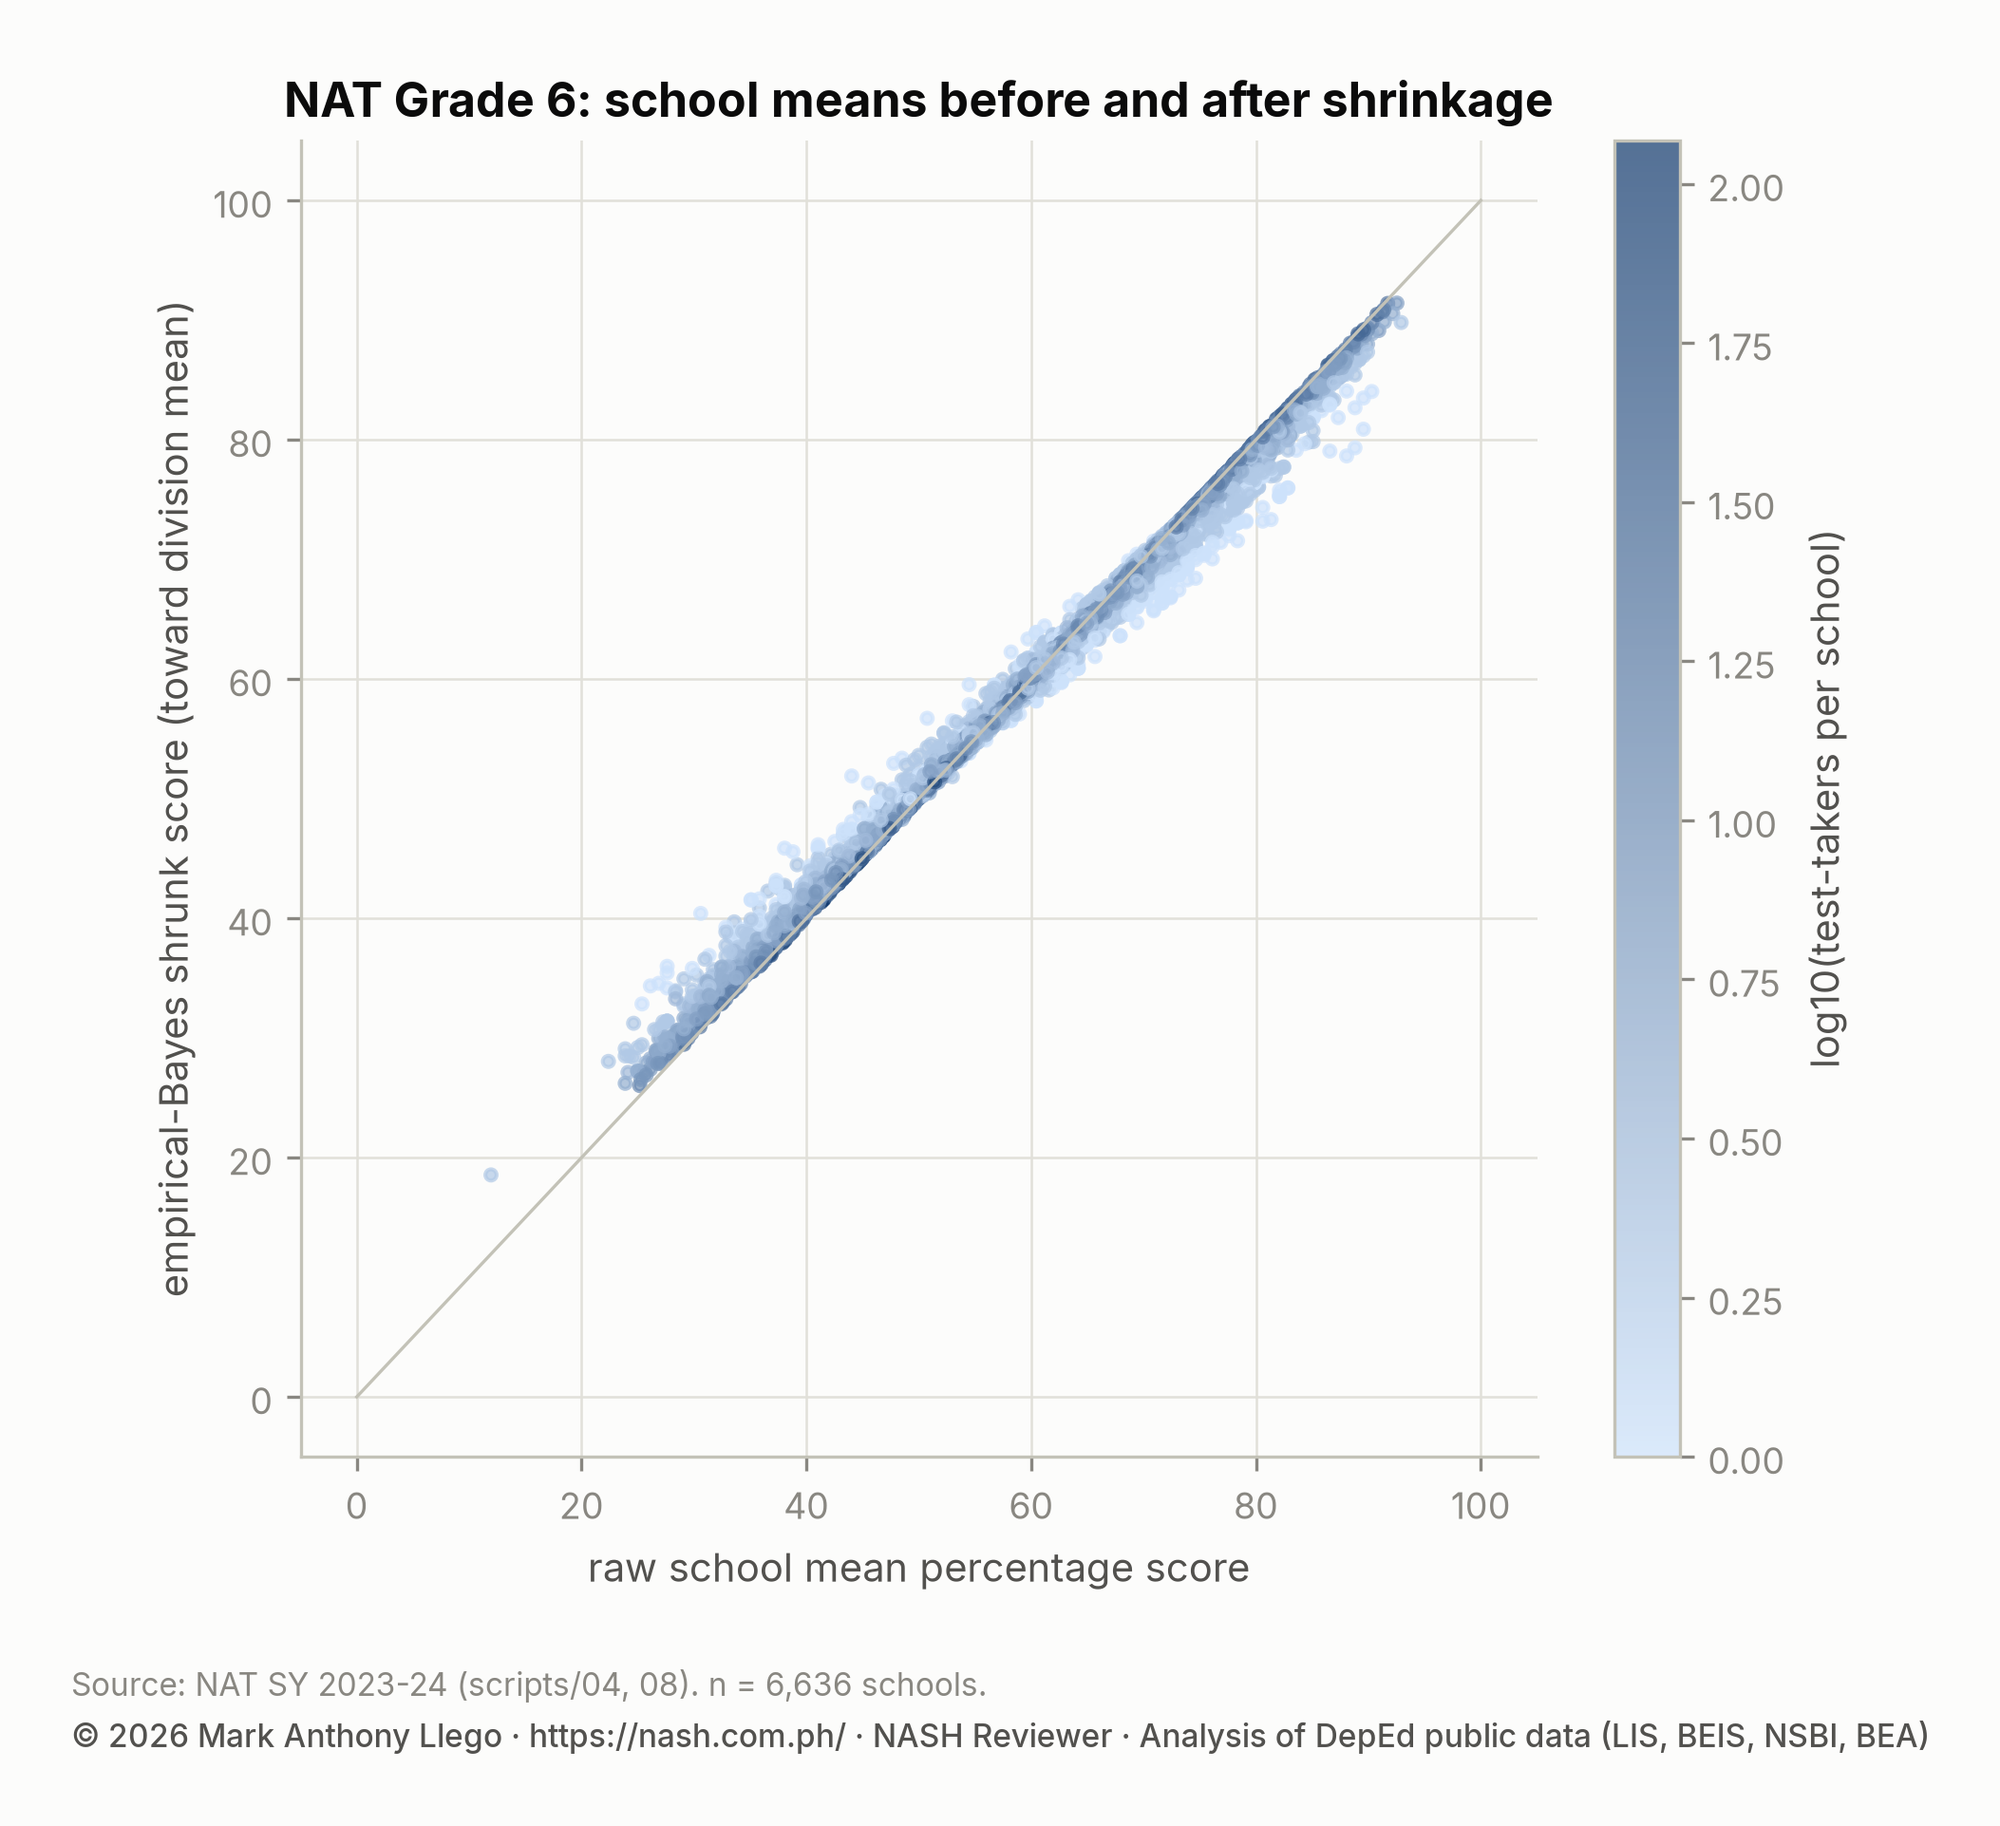
- Before any statement about individual schools, school means were shrunk toward their division mean with an empirical-Bayes estimator, because NAT means rest on a median of six sampled learners.
- Input–outcome associations come from weighted least squares with division fixed effects and division-clustered standard errors, with standardized predictors. A random-intercept multilevel model, diagnostics (VIF, residual plots, Cook’s distance) and re-fits by region and school size check the results.
- Time series use all schools present in each year. A balanced panel and like-for-like comparisons of schools present in both adjacent years are reported as checks. Trends were also re-fitted without the two pandemic school years.
Limits of the data
What these files cannot say, and the quality problems found while cleaning them.
- Assessment results exist for 44 divisions in five regions, and for about half of the public schools inside them, chosen by a rule DepEd has not published. Nothing on this page describes learning outcomes in the other 13 regions or in the 19 divisions without results.
- The files give school means, not learner scores. They support no statement about an individual learner, and the share of proficient learners cannot be computed from them.
- NAT school means rest on a median of six sampled learners, and the sampling design is not described. Division estimates average out that noise. School-level rankings would not.
- The input files describe SY 2023-24 and cover public schools only, while the CRLA results are from SY 2025-26. The 814 private schools with NAT results have no input data.
- The technical notes caution that test difficulty varies from year to year, so no score was compared across years.
- Annex schools are separate rows. They could not be merged into their mother schools, as the technical notes require for the pupil–teacher ratio, because DepEd publishes no mapping between them. Dropping them does not change any result.
- The facilities file has no seat counts, so the seat–learner ratio in the technical notes cannot be computed. The ICT file contains obvious entry errors, such as one school that reports 15,699 tablets. Counts were capped at the 99th percentile to limit their effect.
- A small number of schools change their school ID. Matching by name and place found 146 likely cases, and each is counted as an exit plus an entry.
- The SY 2025-26 file uses a different coding scheme (sector and management labels, Yes/No flags, blanks instead of zeros) and a mixed text encoding. Both were harmonized. The change shows that each new release should be checked before use.
About these numbers
- No file has duplicate school IDs, negative counts or percentages over 100.
- In the public-school files, 139 schools with learners report no teachers, 267 report no instructional classroom, 1,362 report no functional toilet bowl, and 316 report more academic computers than learners. Ratios that cannot be computed are excluded. The implausible cases are dropped in a separate check run.
- The CRLA README calls its level shares percentages, but the values are proportions from 0 to 1, and they were used as proportions. In 764 schools, its school-level summary does not equal the sum of the three Mother Tongue blocks, and DepEd has not documented how the summary is derived.
- In 544 schools, ELLNA test-takers exceed Grade 3 beginning-of-year enrollment, and in 2,129 schools CRLA test-takers exceed Grade 1–3 enrollment. The tests are given at a different point in the year from the enrollment count.
Download the cleaned DepEd data (CSV and Parquet)
The cleaned, harmonized files behind this report are free to download in CSV and Parquet, with a codebook and checksums. The data files follow DepEd’s terms of use; our code and documentation need our written permission to reuse.
- School master file, SY 2023-24One row per school in DepEd's SY 2023-24 files (60,167 schools, all sectors): geography, enrollment by grade and sex, learner types, teachers, classrooms and buildings, toilets, water, electricity and internet, computers and ICT equipment, the NAT, ELLNA and CRLA results where they exist, and the derived ratios the report uses. Input modules are blank for non-public schools.
- Enrollment panel, SY 2017-18 to SY 2025-26One row per school per school year it appears in (547,425 rows): enrollment by grade, level, sex and senior-high strand, with harmonised labels, constant-boundary regions, and entry, exit and year-on-year columns.
- School spine, SY 2017-18 to SY 2025-26One row per school ID ever observed in the nine enrollment files (66,967 IDs): first and last year, gaps, entry and exit flags, and the sector and location in the last year present.
- CRLA reading levels, SY 2025-26One row per assessed school (6,121): learners at each CRLA reading level by grade and language, the school-level shares as proportions, and the SY 2025-26 Grade 1 to 3 enrollment.
- Shrunk NAT and ELLNA school means, SY 2023-24One row per school with a NAT or ELLNA result (6,840): the published school mean, the number of test-takers, and the empirical-Bayes estimate shrunk toward the division mean, for any school-level use.
- Likely school-ID changes146 cases where a school that leaves the files reappears the next year under a new ID with the same name, municipality and barangay. DepEd publishes no mapping, so the panel counts each as an exit plus an entry; this table lets you link them.
- Assessment coverage by divisionFor each of the 63 divisions in the five assessed regions, how many public schools with Grade 3 or Grade 6 learners have NAT, ELLNA and CRLA results, and the share covered. Nineteen of the 63 divisions have no assessed schools.
Version 1.0, released October 25, 2026: 343 documented columns, 66.6 MB in total. The folder name carries the version number, so the file at a given URL never changes. The blog post documents every file and column, lists the cleaning rules and gives the citation.
The DepEd data series on the blog
The analysis continues on the blog in forty-seven posts and an index. The posts read each dataset in depth, follow enrollment year by year, rank divisions and provinces, and turn the findings into NASH practice questions.
- Start here
- Enrollment, year by year
- DepEd Enrollment SY 2017-2018: 26.3 Million Learners
- DepEd Enrollment SY 2018-2019: Growth to 27.0 Million
- DepEd Enrollment SY 2019-2020: The Pre-Pandemic Peak
- DepEd Enrollment SY 2020-2021: The Pandemic Drop
- DepEd Enrollment SY 2021-2022: Rebound to 27.6 Million
- DepEd Enrollment SY 2022-2023: The Peak at 27.8 Million
- DepEd Enrollment SY 2023-2024: The Decline Begins
- DepEd Enrollment SY 2024-2025: Smallest Kindergarten Class
- DepEd Enrollment SY 2025-2026: Below the 2017 Level
- DepEd Enrollment Projection to SY 2031-2032 by Grade
- Divisions, provinces and districts
- The SY 2023-24 school files
- DepEd Learner Data SY 2023-2024: IP, ALIVE and School Size
- DepEd IP, ALIVE and Balik-Aral Learners by Grade, SY 2023-24
- DepEd Teachers and School Personnel Data, SY 2023-2024
- DepEd Principals and Head Teachers per School, SY 2023-2024
- DepEd School Counselors, Nurses, Librarians, SY 2023-2024
- LGU-Funded Teachers and Staff in DepEd Schools, SY 2023-2024
- DepEd Classroom and School Building Data, SY 2023-2024
- DepEd Data on School Access, Roads and Safety, SY 2023-2024
- DepEd WASH Data SY 2023-2024: Toilets, Water, Electricity
- DepEd School Toilets for Girls, Boys and PWD, SY 2023-2024
- DepEd ICT Data SY 2023-2024: Computers and Internet
- DepEd Smart TVs and Computers vs National Education Plan
- Assessment results and school inputs
- NAT Grade 6 Results SY 2023-2024: DepEd Division Scores
- ELLNA Grade 3 Results SY 2023-2024: DepEd Division Scores
- CRLA Results SY 2025-2026: Reading Levels in Grades 1 to 3
- DepEd School Inputs vs Test Results: Multigrade and Internet
- NAT Grade 6 SY 2023-2024: Private vs Public School Scores
- Do the Same DepEd Schools Lag on the ELLNA, NAT and CRLA?
- DepEd Senior High Strands by Sex, SY 2017-18 to 2025-26
- DepEd Open Data Quality: Errors, Blanks and Coverage Limits
- Study guides and practice for the NASH
- NASH Study Guide: DepEd Memorandum 069, s. 2025 and PPSSH
- PPSSH Domain 1: Leading Strategically With DepEd Data
- PPSSH Domain 2: Managing School Operations With DepEd Data
- PPSSH Domain 3: Teaching and Learning With DepEd Data
- PPSSH Domain 4: Developing Self and Others With DepEd Data
- PPSSH Domain 5: Building Connections With DepEd Data
- EDCOM II Final Report: Guide for Aspiring School Heads
- National Education Plan 2026-2035: Guide for School Heads
- NASH Practice Questions With Answers: 50 Items on the PPSSH
- NASH Practice Test Set B: 50 PPSSH Items With Answer Keys
- Download the data
How to cite this page
Use APA style (7th edition). The date is the day the page was last updated. Where you use a figure or a rule, also cite the law, issuance, or report the page names for it.
Llego, M. A. (2026, October 30). DepEd data: Philippine basic education in numbers. NASH Reviewer. https://nash.com.ph/deped-data
In-text citation: (Llego, 2026). To cite the cleaned data files rather than this page, use the data citation in the release documentation linked under Download the cleaned DepEd data.
Sources
DepEd’s proactively released datasets and their technical notes. Each was read in full and checked against the PDFs before any analysis.
- DepEd Enrollment datasets, SY 2017-18 to SY 2025-26 (Learner Information System)Nine archives, one CSV per school year with one row per school: enrollment by grade, sex and senior-high strand, with region, division, district, municipality, sector and management.
- DepEd Learner, Personnel, Facilities, ICT and WASH datasets, SY 2023-24 (BEIS and NSBI)Five archives for SY 2023-24: learner types and class structure; teachers and other personnel by position and funding; classrooms, buildings and amenities; computers and ICT equipment; handwashing, sanitation, water, electricity and internet.
- DepEd NAT Grade 6 and ELLNA SY 2023-24 and CRLA SY 2025-26 selected-school datasets (Bureau of Education Assessment)Three archives of selected schools: NAT Grade 6 and ELLNA Grade 3 mean percentage scores by subject for SY 2023-24, and CRLA reading-level counts by grade and language for SY 2025-26.
- DepEd Policy and Planning Service, Technical Notes on the School Characteristics Data (2024)Data sources, collection, the formulas for the pupil–teacher, classroom, seat, toilet and computer ratios, and the coverage limits of each module.
- DepEd Bureau of Education Assessment, Technical Notes on Learning Outcomes Data, ELLNA and NAT Grade 6 (March 2025)Test design, modality by school year, scoring, the proficiency bands and the known limitations of ELLNA and NAT Grade 6.
- Analysis pipelineEleven numbered Python scripts, a data inventory, a data dictionary of 2,216 columns, a quality audit and an assumptions log, which can be re-run from the raw archives.
For aspiring school heads
Know the numbers before you lead a school
The NASH tests how you would run a school under these conditions: fewer learners, crowded large schools and low results in early reading and numeracy. Practice the PPSSH strands with situational questions that ask you to decide as a school head would.