Below are the learners in every province and in 385 legislative districts in DepEd’s SY 2025-2026 enrollment file, with nine-year growth, private share, and public school inputs. Cebu has the most learners of any province, 1,300,304, and only 26 of 87 provinces have more learners than in SY 2017-2018.
DepEd organizes itself by region and schools division. Local governments and Congress organize the country by province and legislative district. Governors fund classrooms through the Special Education Fund (SEF), and representatives insert school buildings into the national budget. The Local School Board that a school head must work with sits at the province or city.
The enrollment files carry a province field and a legislative-district field for every school, so the tables below can follow how local government sees schools.
Two tables follow. The first covers the 88 province-level units in the SY 2025-2026 file. These are the 81 provinces, the four districts into which the file divides Metro Manila, and three units the file lists as provinces in their own right. The three are Cotabato City, Isabela City, and the Special Geographic Area in North Cotabato. The second table covers legislative districts within each schools division.
Key findings
- Cebu has the most learners of any province, 1,300,304 in SY 2025-2026, followed by Cavite (1,010,719) and Metro Manila’s Second District (967,894). Eight provinces hold 28% of all learners.
- Only 26 of 87 provinces have more learners than in SY 2017-2018, and since the SY 2022-2023 peak only Maguindanao and Tawi-Tawi have grown. Growth is in the Bangsamoro and the Sulu archipelago, led by Maguindanao (+2.75% a year), and in the provinces around Metro Manila, led by Cavite (+1.18%).
- The private share of enrollment is highest in cities: 31.3% in the City of Manila and 29.5% in Metro Manila’s Second District, against 1.1% in the Special Geographic Area.
- The growing provinces are also the most crowded. In SY 2023-2024, Sulu had 34.6 public learners per teacher and Metro Manila’s Third District 65.9 learners per instructional room.
- 385 legislative districts hold at least 1,000 learners each. The largest is Rizal’s 2nd District with 305,538; the median district has 62,113.
Provinces with the most and the fewest learners
Cebu is the only province with more than 1.2 million learners: 1,300,304 in SY 2025-2026, counting Cebu City, Lapu-Lapu, Mandaue, and the other city divisions on the island. Cavite is next with 1,010,719, and Metro Manila’s Second District (Quezon City, Pasig, Marikina, Mandaluyong, and San Juan) is third with 967,894. Bulacan, Negros Occidental, Rizal, Laguna, and Pangasinan follow, with between 864,811 (Bulacan) and 735,658 (Pangasinan) learners each. Together these eight provinces hold 28% of all learners.
The smallest are Batanes with 4,048 learners, Siquijor with 22,392, Camiguin with 23,380, Apayao with 28,036, and Dinagat Islands with 28,498. Cebu has 321 times the learners of Batanes.
Enrollment growth by province: 26 of 87 are larger than in SY 2017-2018
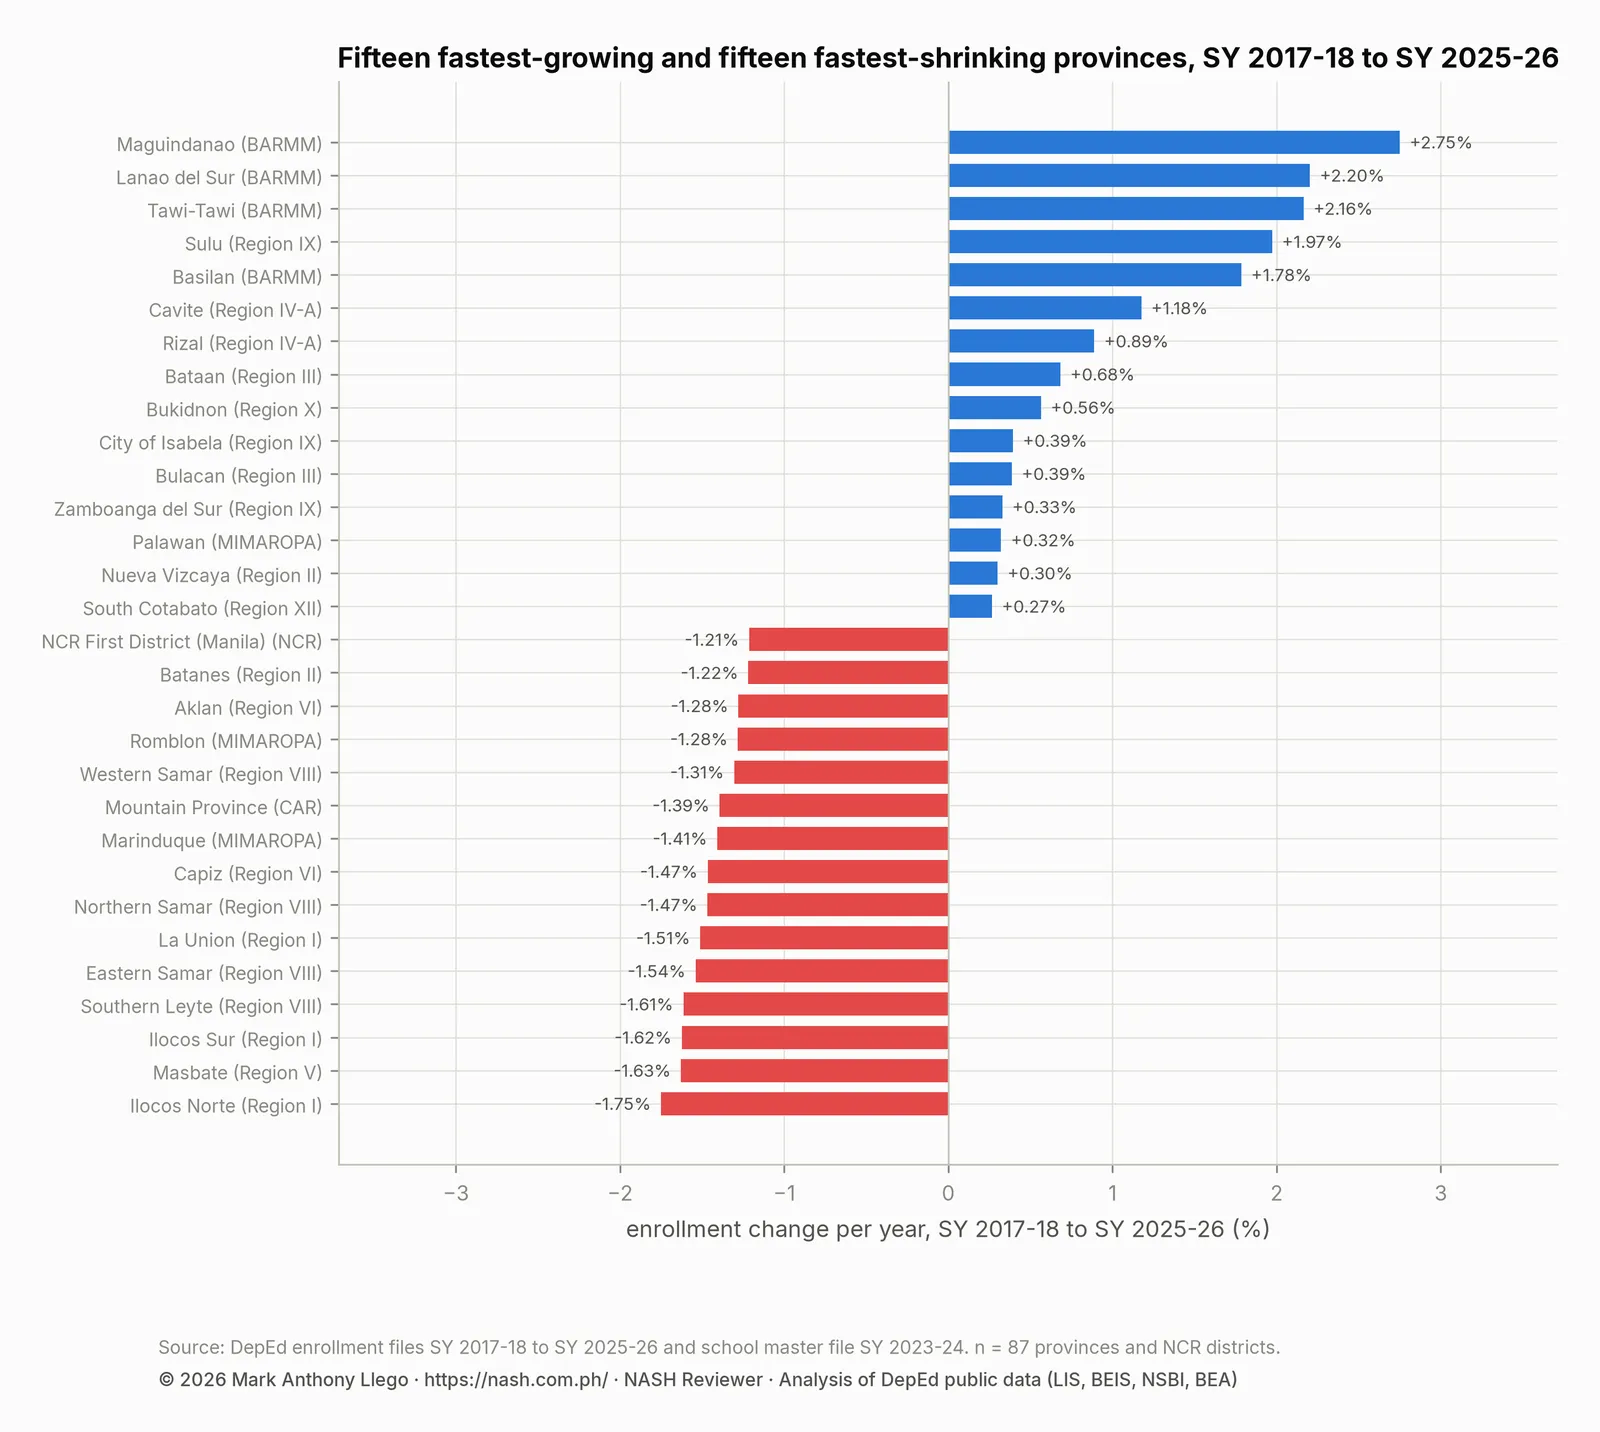
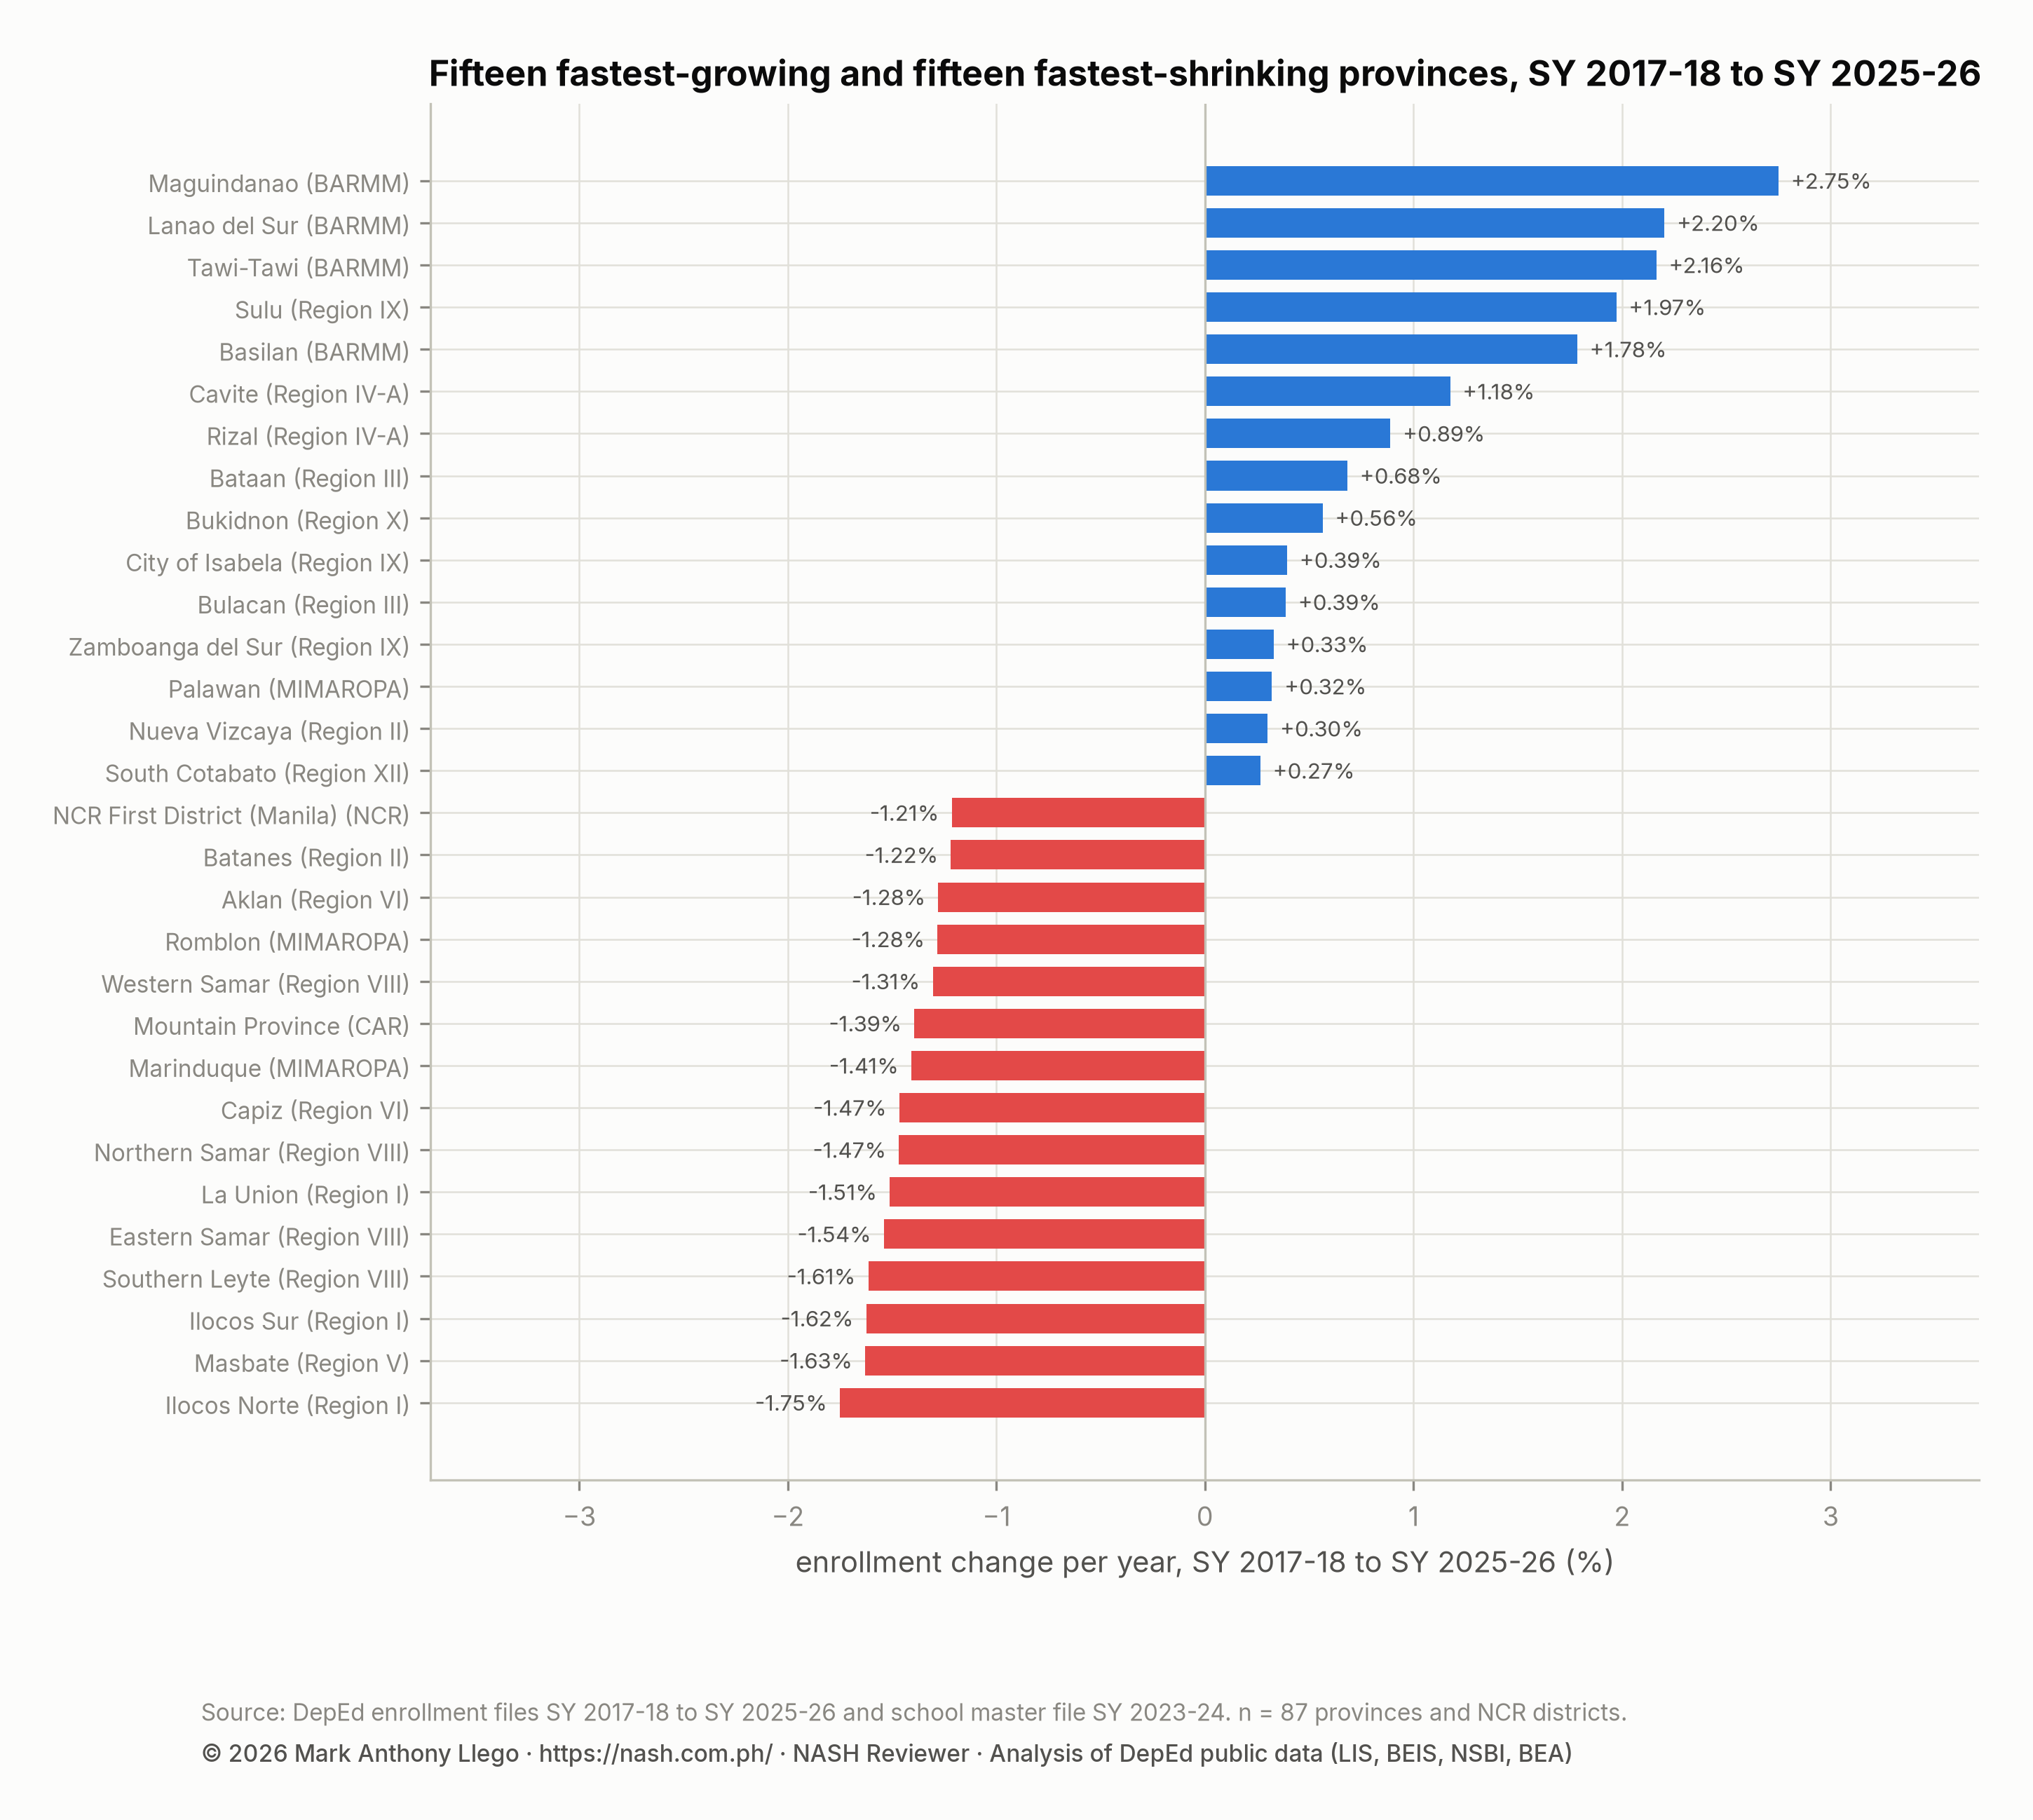
Twenty-six provinces have more learners than in SY 2017-2018, and 61 have fewer. The growth is in two places.
The first is the Bangsamoro and the islands to its west: Maguindanao (+2.75% a year), Lanao del Sur (+2.20%), Tawi-Tawi (+2.16%), Sulu (+1.97%), and Basilan (+1.78%). The second is the provinces around Metro Manila: Cavite (+1.18%), Rizal (+0.89%), Bataan (+0.68%), and Bulacan (+0.39%). Bukidnon (+0.56%), Palawan (+0.32%), Nueva Vizcaya (+0.30%), and South Cotabato (+0.27%) complete the list of provinces growing faster than a quarter of a percent a year.
The steepest declines are on the Ilocos coast, in Eastern Visayas, and in the Visayan islands. They are Ilocos Norte (−1.75% a year), Masbate (−1.63%), Ilocos Sur (−1.62%), Southern Leyte (−1.61%), Eastern Samar (−1.54%), La Union (−1.51%), Northern Samar (−1.47%), and Capiz (−1.47%). Metro Manila’s First District, which is the City of Manila, lost 1.21% a year, and Batanes lost 1.22% a year.
Since the SY 2022-2023 peak, only two provinces have grown: Maguindanao and Tawi-Tawi. The median province is 7.9% smaller than three years ago. Six provinces have lost more than a tenth of their learners in that time: Davao Occidental (−16.7%), Masbate (−12.3%), Ilocos Norte (−11.2%), Capiz (−11.0%), Northern Samar (−10.9%), and Zamboanga Sibugay (−10.8%).
Two provinces need a note. Davao Occidental’s schools were still labeled Davao del Sur in the SY 2017-2018 file, so the table shows the two provinces’ combined growth, +0.15% a year, for both. North Cotabato lost 63 barangays to the Special Geographic Area in SY 2021-2022. The Special Geographic Area, with 38,387 learners in SY 2025-2026, therefore has no SY 2017-2018 figure of its own.
Private school share and public school inputs by province
The private share of enrollment is highest in cities. Private schools hold 31.3% of learners in the City of Manila, 29.5% in Metro Manila’s Second District, 25.0% in Cotabato City, 24.7% in the Fourth District (Las Piñas to Taguig), and 23.9% in Cavite. The private share is lowest in the Special Geographic Area (1.1%), Davao Occidental (1.9%), Catanduanes (2.1%), Western Samar (2.3%), and Biliran (2.6%).
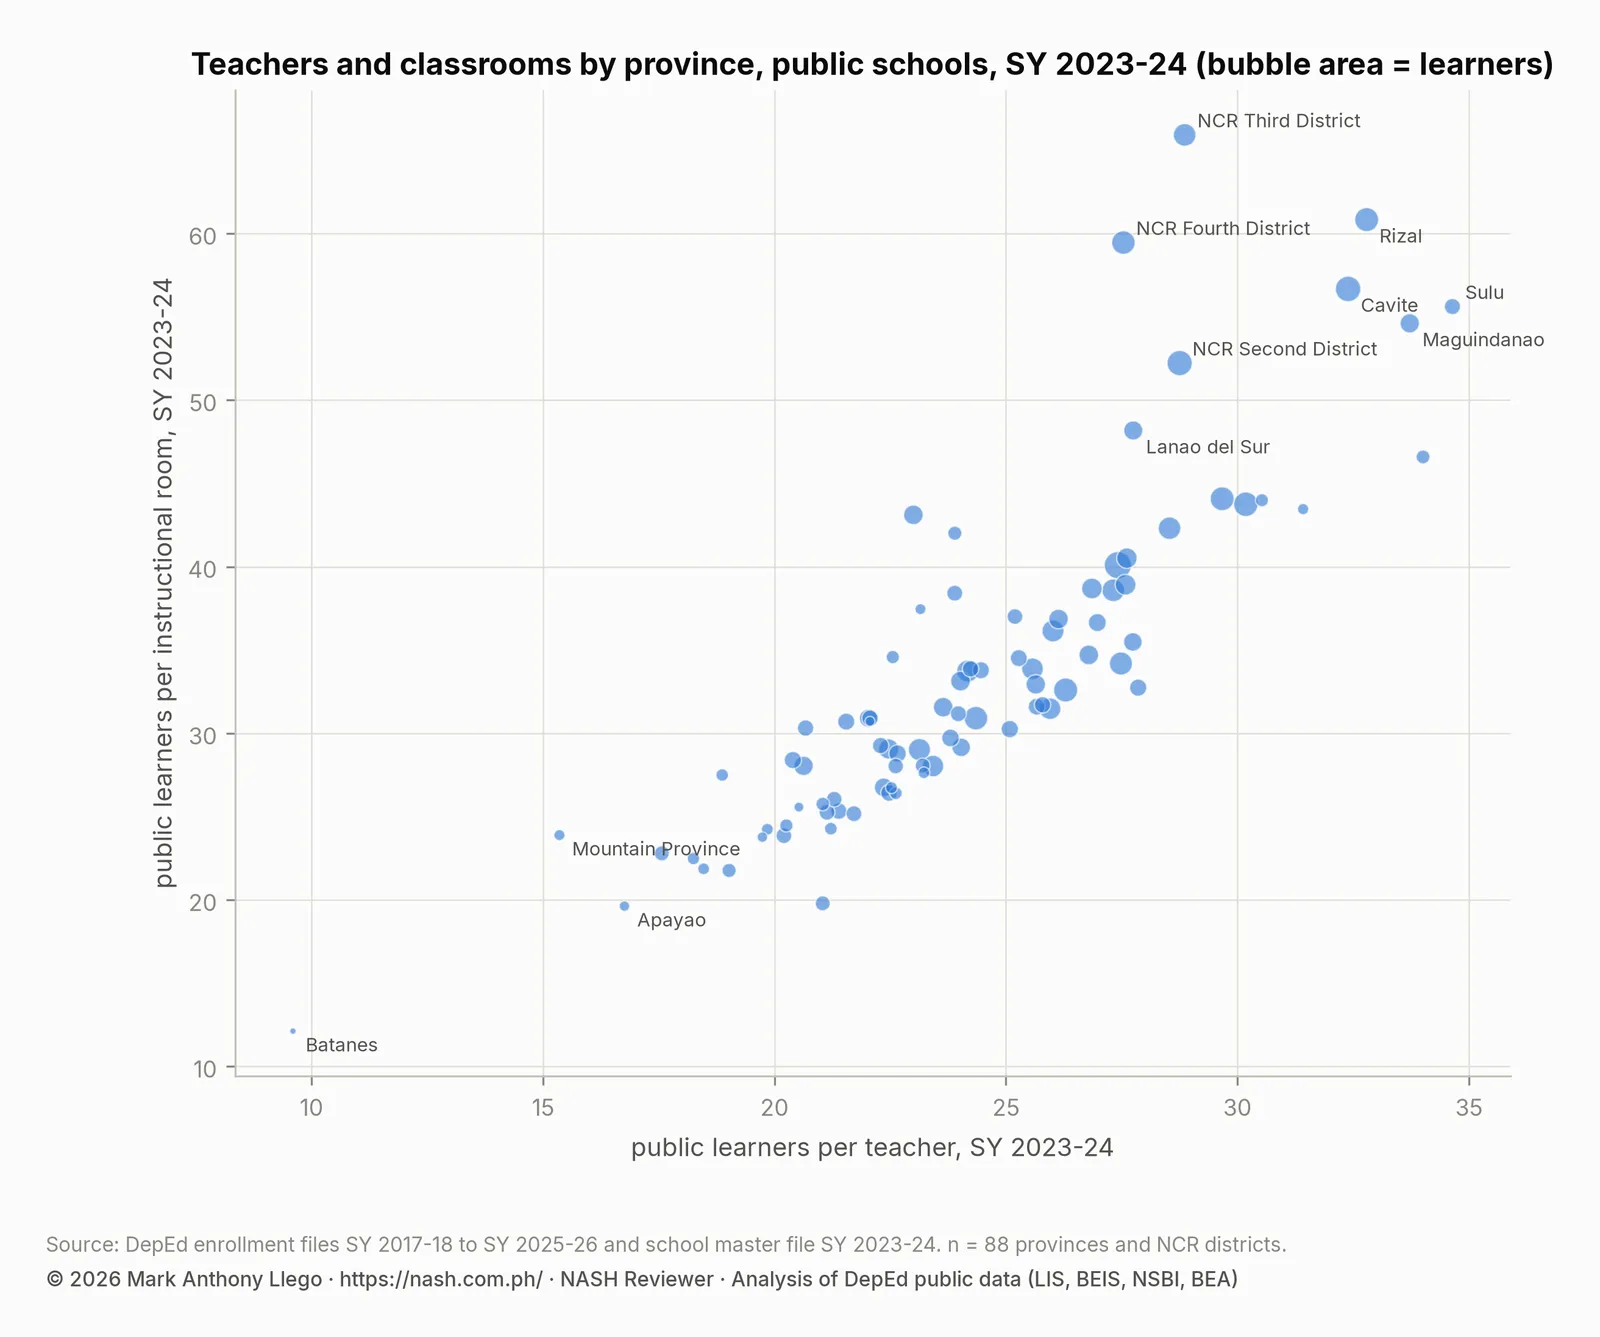
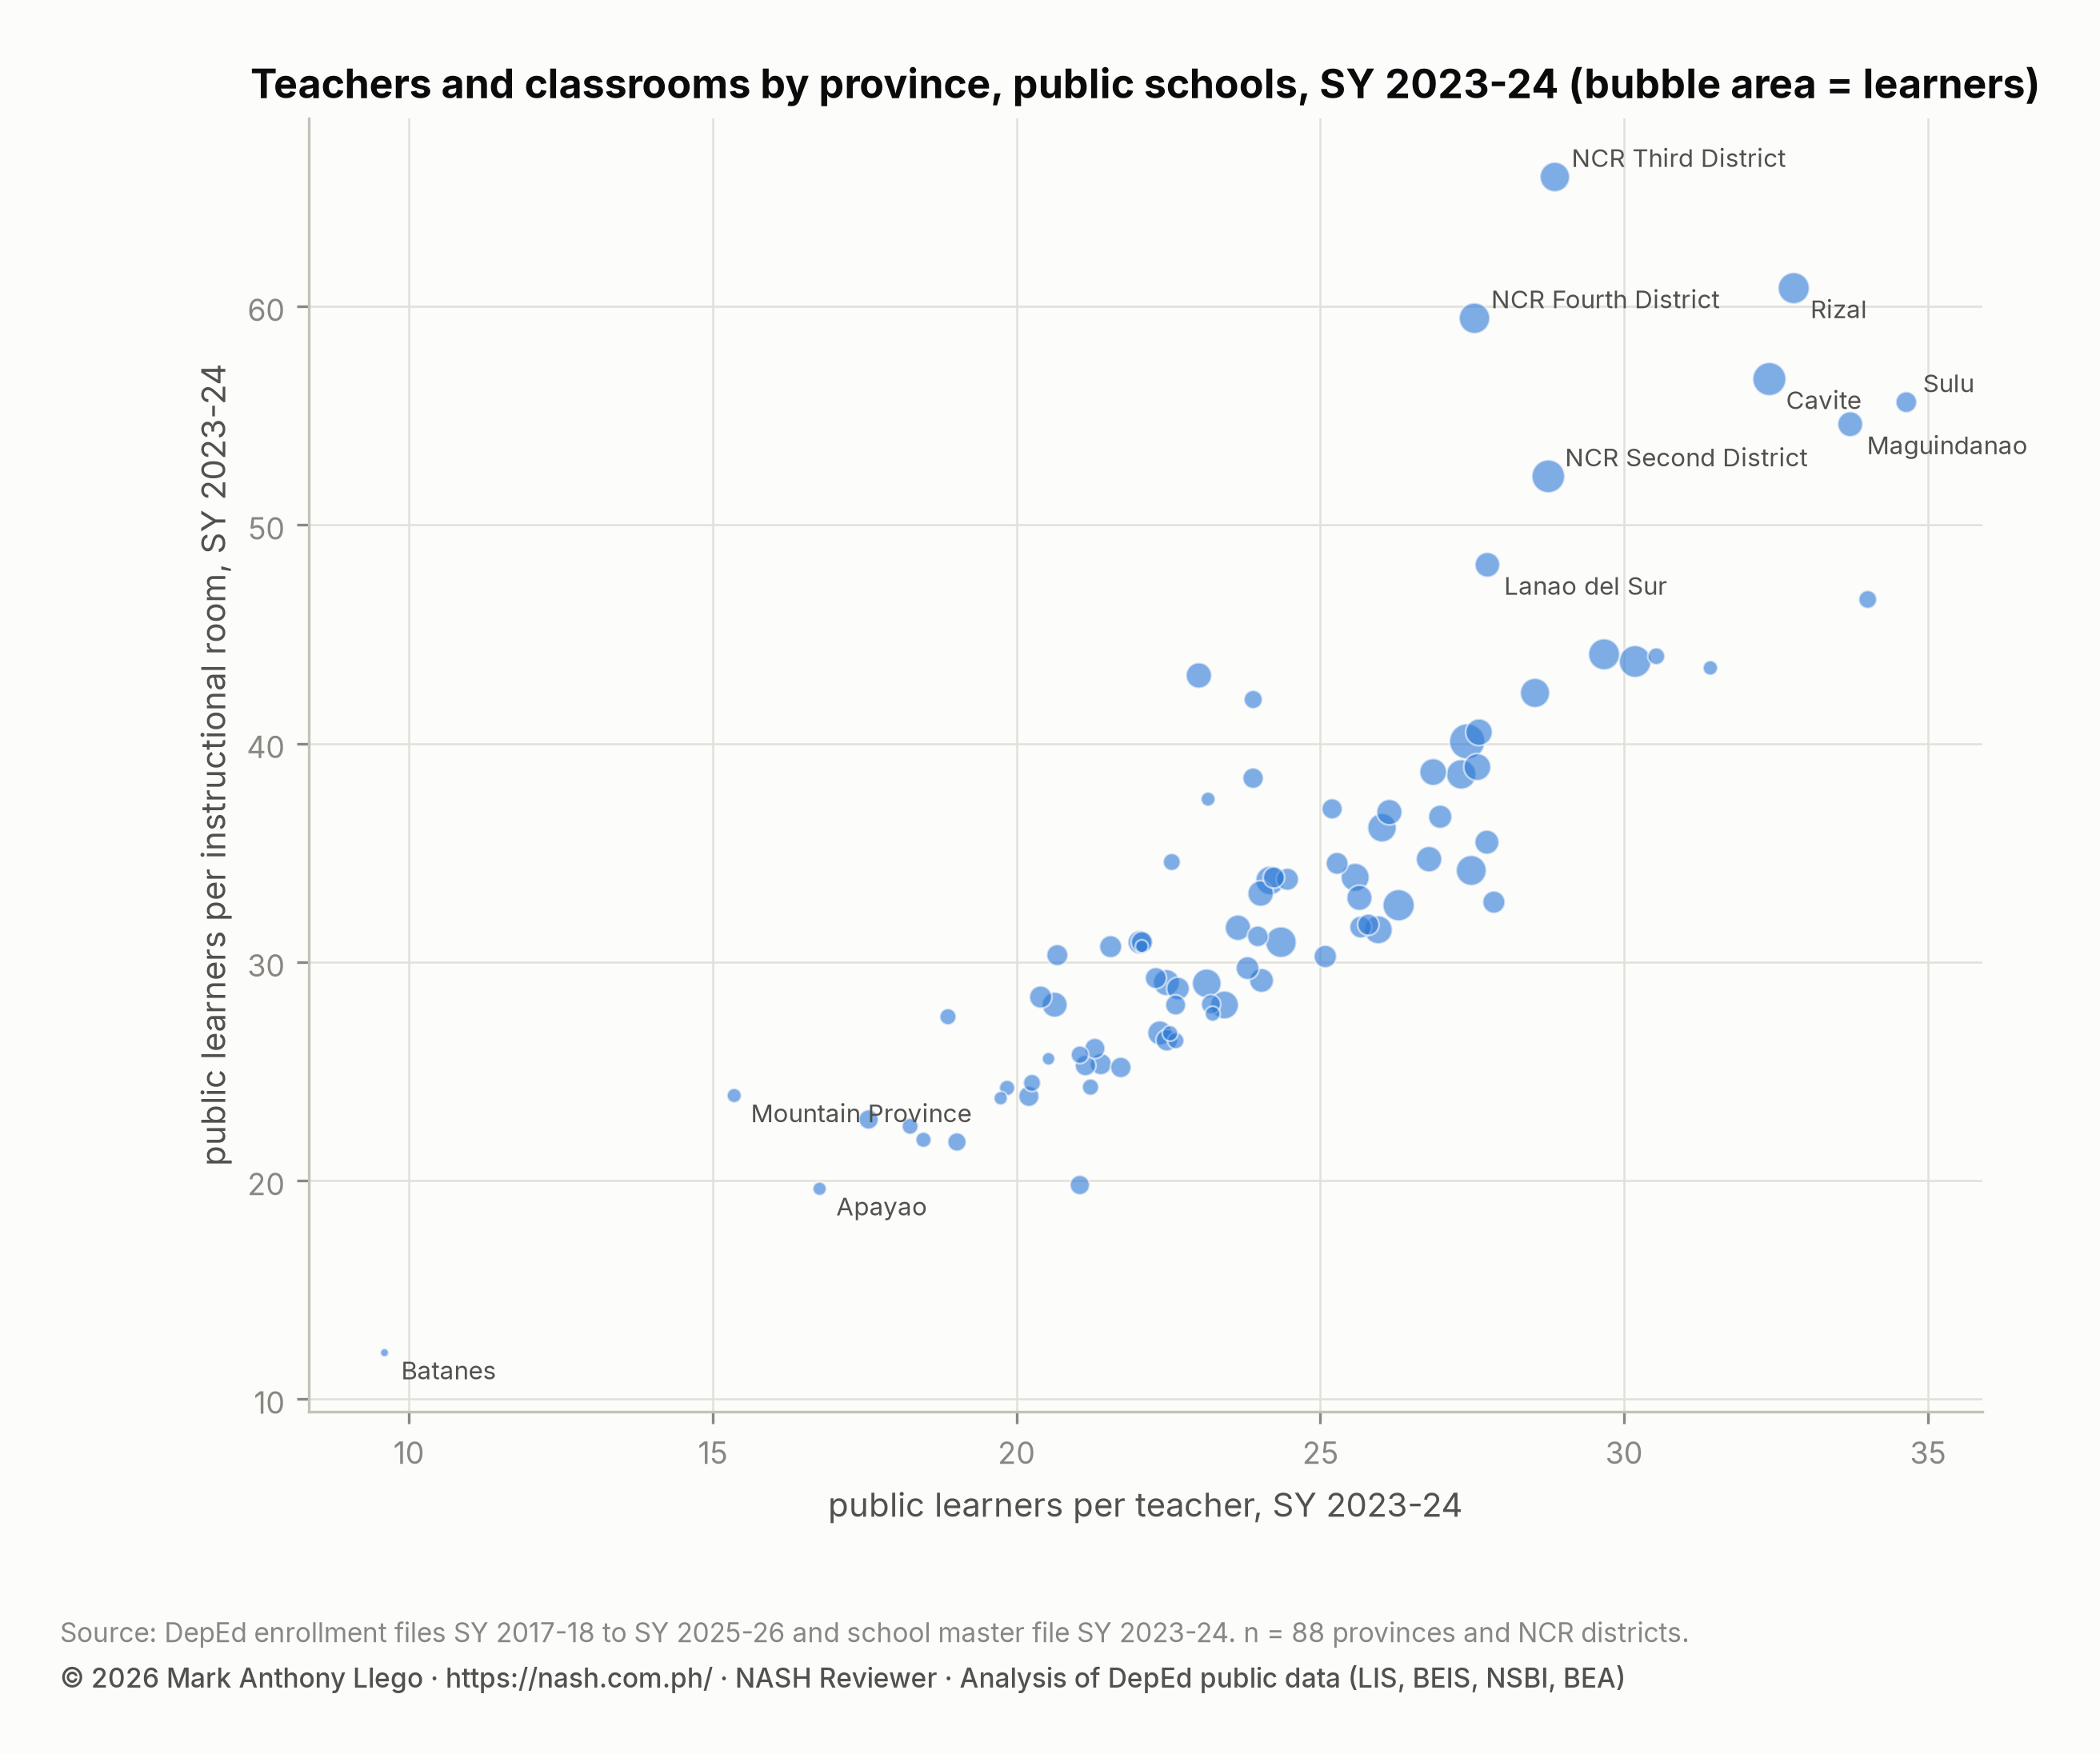
Public school inputs come from the SY 2023-2024 school files. The provinces with the most public learners per teacher are Sulu (34.6), Basilan (34.0), Maguindanao (33.7), Rizal (32.8), and Cavite (32.4). The fewest are in Batanes (9.6), Mountain Province (15.4), Apayao (16.8), Eastern Samar (17.6), and Abra (18.2).
Classrooms are most crowded in Metro Manila’s Third District (Caloocan, Malabon, Navotas, and Valenzuela), at 65.9 learners per instructional room. Rizal (60.8), the Fourth District (59.5), Cavite (56.7), and Sulu (55.6) follow. The lowest shares of public learners in schools with internet are in Mountain Province (43%), Masbate (51%), Davao Occidental (53%), Basilan (62%), and the Special Geographic Area (65%).
The scatter plot shows the two measures together. The growing provinces, Cavite, Rizal, Sulu, Maguindanao, and Lanao del Sur, are also the crowded ones. The shrinking Cordillera and Ilocos provinces have the most teachers and rooms per learner. Metro Manila is crowded without growing, because its classroom count has not grown to match a population that was already large before the files begin.
| Province | Region | Learners, SY 2017-18 | SY 2022-23 | SY 2025-26 | Per year, 2017-18 to 2025-26 | Since SY 2022-23 | Private share, SY 2025-26 | Public learners per teacher, SY 2023-24 | Per instructional room | Public learners with internet | Note |
|---|---|---|---|---|---|---|---|---|---|---|---|
| Cebu | Region VII | 1,284,408 | 1,380,206 | 1,300,304 | +0.15% | -5.8% | 15.8% | 27.4 | 40.1 | 94.1% | |
| Cavite | Region IV-A | 920,531 | 1,040,791 | 1,010,719 | +1.18% | -2.9% | 23.9% | 32.4 | 56.7 | 99.6% | |
| NCR Second District | NCR | 1,036,253 | 1,028,527 | 967,894 | -0.85% | -5.9% | 29.5% | 28.8 | 52.2 | 95.8% | |
| Bulacan | Region III | 838,517 | 906,684 | 864,811 | +0.39% | -4.6% | 22.6% | 30.2 | 43.8 | 98.7% | |
| Negros Occidental | NIR | 844,520 | 887,019 | 808,217 | -0.55% | -8.9% | 10.8% | 26.3 | 32.6 | 89.1% | |
| Rizal | Region IV-A | 737,951 | 814,603 | 792,081 | +0.89% | -2.8% | 21.7% | 32.8 | 60.8 | 95.1% | |
| Laguna | Region IV-A | 770,614 | 820,133 | 782,731 | +0.20% | -4.6% | 23.4% | 29.7 | 44.1 | 99.5% | |
| Pangasinan | Region I | 796,782 | 815,577 | 735,658 | -0.99% | -9.8% | 11.5% | 24.4 | 30.9 | 98.2% | |
| NCR Fourth District | NCR | 787,737 | 774,448 | 733,933 | -0.88% | -5.2% | 24.7% | 27.5 | 59.5 | 100.0% | |
| Batangas | Region IV-A | 683,528 | 714,329 | 678,719 | -0.09% | -5.0% | 17.9% | 27.5 | 34.2 | 97.6% | |
| Pampanga | Region III | 645,110 | 669,514 | 636,724 | -0.16% | -4.9% | 17.2% | 27.3 | 38.6 | 99.0% | |
| NCR Third District | NCR | 654,942 | 671,201 | 631,653 | -0.45% | -5.9% | 21.5% | 28.9 | 65.9 | 96.4% | |
| Davao del Sur | Region XI | 677,014 | 654,472 | 613,945 | +0.15% | -6.2% | 17.0% | 28.5 | 42.3 | 90.0% | included Davao Occidental in SY 2017-18; growth shown for the two provinces combined |
| Iloilo | Region VI | 623,026 | 638,132 | 572,673 | -1.05% | -10.3% | 10.1% | 23.1 | 29 | 91.3% | |
| Camarines Sur | Region V | 598,013 | 619,744 | 566,091 | -0.68% | -8.7% | 12.5% | 24.2 | 33.7 | 82.8% | |
| Quezon | Region IV-A | 576,612 | 604,456 | 558,286 | -0.40% | -7.6% | 11.6% | 26 | 36.1 | 88.7% | |
| Zamboanga del Sur | Region IX | 508,296 | 561,703 | 521,817 | +0.33% | -7.1% | 10.0% | 25.6 | 33.9 | 83.8% | |
| Nueva Ecija | Region III | 523,298 | 560,918 | 516,167 | -0.17% | -8.0% | 12.8% | 26 | 31.5 | 98.3% | |
| Leyte | Region VIII | 541,440 | 565,971 | 511,501 | -0.71% | -9.6% | 8.3% | 23.4 | 28 | 95.0% | |
| Misamis Oriental | Region X | 432,318 | 467,018 | 440,813 | +0.24% | -5.6% | 16.1% | 27.6 | 38.9 | 90.7% | |
| South Cotabato | Region XII | 428,357 | 468,011 | 437,536 | +0.27% | -6.5% | 12.8% | 26.9 | 38.7 | 93.5% | |
| Bukidnon | Region X | 401,512 | 444,196 | 419,984 | +0.56% | -5.5% | 9.0% | 27.6 | 40.5 | 78.3% | |
| Isabela | Region II | 401,249 | 426,379 | 391,899 | -0.29% | -8.1% | 11.1% | 22.5 | 29.1 | 98.9% | |
| Negros Oriental | NIR | 358,352 | 378,445 | 360,708 | +0.08% | -4.7% | 7.3% | 24 | 33.1 | 84.5% | |
| Tarlac | Region III | 352,545 | 377,650 | 359,250 | +0.24% | -4.9% | 15.0% | 26.8 | 34.7 | 98.0% | |
| Albay | Region V | 385,602 | 386,371 | 354,404 | -1.05% | -8.3% | 8.6% | 23.6 | 31.6 | 84.5% | |
| NCR First District (Manila) | NCR | 389,141 | 389,853 | 352,914 | -1.21% | -9.5% | 31.3% | 23 | 43.1 | 100.0% | |
| North Cotabato | Region XII | 375,893 | 368,335 | 346,341 | -1.02% | -6.0% | 8.2% | 26.1 | 36.9 | 78.4% | 63 barangays moved to the Special Geographic Area in SY 2021-22 |
| Palawan | MIMAROPA | 330,397 | 359,142 | 338,982 | +0.32% | -5.6% | 4.6% | 25.6 | 32.9 | 65.0% | |
| Bohol | Region VII | 361,987 | 367,722 | 332,140 | -1.07% | -9.7% | 13.7% | 20.6 | 28 | 90.9% | |
| Maguindanao | BARMM | 264,627 | 302,355 | 328,757 | +2.75% | +8.7% | 18.5% | 33.7 | 54.6 | 87.2% | |
| Lanao del Sur | BARMM | 266,082 | 318,067 | 316,749 | +2.20% | -0.4% | 14.5% | 27.7 | 48.2 | 74.3% | |
| Cagayan | Region II | 304,511 | 317,332 | 288,682 | -0.67% | -9.0% | 10.4% | 22.4 | 26.8 | 92.8% | |
| Davao del Norte | Region XI | 281,640 | 305,118 | 283,697 | +0.09% | -7.0% | 10.6% | 27.7 | 35.5 | 96.6% | |
| Zamboanga del Norte | Region IX | 279,854 | 297,324 | 277,176 | -0.12% | -6.8% | 4.3% | 24 | 29.2 | 69.3% | |
| Masbate | Region V | 288,689 | 288,547 | 253,144 | -1.63% | -12.3% | 6.6% | 22 | 30.9 | 51.3% | |
| Lanao del Norte | Region X | 249,690 | 268,140 | 248,172 | -0.08% | -7.4% | 11.0% | 27 | 36.7 | 90.5% | |
| Oriental Mindoro | MIMAROPA | 242,013 | 252,351 | 232,149 | -0.52% | -8.0% | 12.6% | 23.8 | 29.7 | 91.3% | |
| Sorsogon | Region V | 241,111 | 244,207 | 223,111 | -0.97% | -8.6% | 5.2% | 22.7 | 28.8 | 88.2% | |
| Zambales | Region III | 221,078 | 230,194 | 216,245 | -0.28% | -6.1% | 14.0% | 25.1 | 30.3 | 97.1% | |
| Western Samar | Region VIII | 229,985 | 231,663 | 207,038 | -1.31% | -10.6% | 2.3% | 20.4 | 28.4 | 82.8% | |
| Bataan | Region III | 195,798 | 215,649 | 206,747 | +0.68% | -4.1% | 11.8% | 27.9 | 32.7 | 99.5% | |
| Sultan Kudarat | Region XII | 199,074 | 217,399 | 202,084 | +0.19% | -7.0% | 11.6% | 24.5 | 33.8 | 89.2% | |
| Agusan del Sur | CARAGA | 211,102 | 220,535 | 201,450 | -0.58% | -8.7% | 8.3% | 21.5 | 30.7 | 86.7% | |
| Agusan del Norte | CARAGA | 203,626 | 217,844 | 196,796 | -0.43% | -9.7% | 11.7% | 25.3 | 34.5 | 95.0% | |
| Compostela Valley | Region XI | 195,936 | 209,709 | 192,044 | -0.25% | -8.4% | 5.1% | 25.7 | 31.6 | 86.6% | |
| Benguet | CAR | 196,051 | 198,403 | 182,792 | -0.87% | -7.9% | 22.9% | 22.5 | 26.4 | 93.4% | |
| Capiz | Region VI | 194,290 | 193,887 | 172,646 | -1.47% | -11.0% | 6.6% | 21.4 | 25.3 | 74.0% | |
| Surigao del Sur | CARAGA | 171,075 | 184,053 | 172,571 | +0.11% | -6.2% | 8.6% | 22.1 | 30.9 | 93.1% | |
| Camarines Norte | Region V | 172,180 | 184,788 | 170,803 | -0.10% | -7.6% | 9.5% | 25.8 | 31.7 | 89.7% | |
| Zamboanga Sibugay | Region IX | 177,268 | 191,116 | 170,500 | -0.49% | -10.8% | 7.5% | 24.2 | 33.9 | 79.9% | |
| Northern Samar | Region VIII | 190,299 | 189,810 | 169,076 | -1.47% | -10.9% | 3.7% | 20.7 | 30.3 | 69.5% | |
| La Union | Region I | 188,546 | 185,799 | 166,922 | -1.51% | -10.2% | 11.4% | 22.3 | 29.3 | 94.6% | |
| Sulu | Region IX | 136,549 | 166,353 | 159,636 | +1.97% | -4.0% | 7.4% | 34.6 | 55.6 | 69.9% | |
| Davao Oriental | Region XI | 156,803 | 169,450 | 155,160 | -0.13% | -8.4% | 6.7% | 24 | 31.2 | 88.8% | |
| Antique | Region VI | 159,131 | 166,145 | 150,418 | -0.70% | -9.5% | 9.8% | 21.1 | 25.3 | 94.1% | |
| Misamis Occidental | Region X | 153,040 | 162,187 | 149,216 | -0.32% | -8.0% | 13.5% | 21.7 | 25.2 | 96.5% | |
| Sarangani | Region XII | 151,760 | 160,753 | 149,075 | -0.22% | -7.3% | 4.9% | 23.9 | 38.4 | 83.2% | |
| Occidental Mindoro | MIMAROPA | 143,131 | 154,267 | 143,619 | +0.04% | -6.9% | 7.1% | 25.2 | 37 | 85.8% | |
| Ilocos Sur | Region I | 163,070 | 159,900 | 143,048 | -1.62% | -10.5% | 11.8% | 20.2 | 23.9 | 96.8% | |
| Aklan | Region VI | 156,136 | 155,759 | 140,862 | -1.28% | -9.6% | 14.2% | 21.3 | 26 | 92.5% | |
| Surigao del Norte | CARAGA | 138,034 | 144,428 | 136,945 | -0.10% | -5.2% | 6.3% | 22.6 | 28 | 96.6% | |
| Ilocos Norte | Region I | 137,950 | 134,919 | 119,775 | -1.75% | -11.2% | 10.5% | 21 | 19.8 | 98.2% | |
| Eastern Samar | Region VIII | 135,463 | 132,775 | 119,652 | -1.54% | -9.9% | 4.3% | 17.6 | 22.8 | 68.1% | |
| Nueva Vizcaya | Region II | 113,421 | 126,088 | 116,174 | +0.30% | -7.9% | 11.1% | 23.2 | 28.1 | 91.9% | |
| Southern Leyte | Region VIII | 110,078 | 107,985 | 96,640 | -1.61% | -10.5% | 13.0% | 19 | 21.8 | 85.7% | |
| Tawi-Tawi | BARMM | 79,403 | 93,932 | 94,237 | +2.16% | +0.3% | 8.6% | 23.9 | 42 | 84.3% | |
| Basilan | BARMM | 75,825 | 90,112 | 87,351 | +1.78% | -3.1% | 10.2% | 34 | 46.6 | 62.4% | |
| Romblon | MIMAROPA | 88,437 | 87,242 | 79,762 | -1.28% | -8.6% | 6.8% | 21 | 25.8 | 85.5% | |
| Davao Occidental | Region XI | 1,468 | 87,144 | 72,574 | +0.15% | -16.7% | 1.9% | 22.6 | 34.6 | 53.1% | labeled Davao del Sur in SY 2017-18; growth shown for the two provinces combined |
| Catanduanes | Region V | 79,270 | 79,987 | 72,449 | -1.12% | -9.4% | 2.1% | 20.3 | 24.5 | 84.5% | |
| City of Cotabato | BARMM | 72,581 | 72,271 | 68,892 | -0.65% | -4.7% | 25.0% | 30.5 | 44 | 93.1% | |
| Marinduque | MIMAROPA | 67,871 | 66,610 | 60,594 | -1.41% | -9.0% | 10.3% | 21.2 | 24.3 | 84.6% | |
| Aurora | Region III | 62,822 | 64,222 | 60,134 | -0.55% | -6.4% | 11.0% | 22.6 | 26.4 | 92.0% | |
| Kalinga | CAR | 59,988 | 63,769 | 58,689 | -0.27% | -8.0% | 13.5% | 18.9 | 27.5 | 84.4% | |
| Abra | CAR | 61,653 | 61,171 | 56,049 | -1.18% | -8.4% | 14.8% | 18.2 | 22.5 | 90.9% | |
| Biliran | Region VIII | 49,403 | 52,801 | 48,707 | -0.18% | -7.8% | 2.6% | 22.5 | 26.7 | 97.3% | |
| Quirino | Region II | 47,980 | 52,682 | 47,845 | -0.04% | -9.2% | 5.4% | 19.8 | 24.2 | 97.8% | |
| Ifugao | CAR | 48,618 | 51,461 | 47,116 | -0.39% | -8.4% | 15.0% | 18.5 | 21.9 | 93.2% | |
| Guimaras | Region VI | 44,060 | 46,544 | 43,325 | -0.21% | -6.9% | 5.9% | 23.2 | 27.6 | 94.0% | |
| Special Geographic Area (North Cotabato) | BARMM | 42,937 | 38,387 | -10.6% | 1.1% | 31.4 | 43.5 | 64.7% | created in SY 2021-22 from 63 North Cotabato barangays; no SY 2017-18 figure | ||
| Mountain Province | CAR | 39,554 | 39,104 | 35,355 | -1.39% | -9.6% | 7.7% | 15.4 | 23.9 | 42.6% | |
| City of Isabela | Region IX | 33,147 | 37,577 | 34,205 | +0.39% | -9.0% | 6.5% | 23.2 | 37.5 | 81.1% | |
| Dinagat Islands | CARAGA | 30,493 | 31,680 | 28,498 | -0.84% | -10.0% | 2.6% | 19.7 | 23.8 | 80.0% | |
| Apayao | CAR | 30,620 | 31,161 | 28,036 | -1.10% | -10.0% | 4.6% | 16.8 | 19.6 | 71.4% | |
| Camiguin | Region X | 25,759 | 25,792 | 23,380 | -1.20% | -9.4% | 6.7% | 22.1 | 30.7 | 97.3% | |
| Siquijor | NIR | 23,496 | 23,716 | 22,392 | -0.60% | -5.6% | 7.7% | 20.5 | 25.6 | 74.1% | |
| Batanes | Region II | 4,465 | 4,307 | 4,048 | -1.22% | -6.0% | 3.6% | 9.6 | 12.1 | 75.5% |
Enrollment by legislative district, SY 2025-2026
The legislative-district field holds a label such as “1st District” or “Lone District”. The label only makes sense together with the schools division, because Antipolo City’s 1st District and Rizal’s 1st District are different places.
Keyed that way, the SY 2025-2026 file yields 430 combinations. Of these, 45 hold fewer than 1,000 learners and are stray labels, usually a few private schools tagged with the wrong district. The 385 remaining districts hold a median of 62,113 learners.
The three largest districts exceed 200,000 learners: Rizal’s 2nd District (305,538, the municipalities east of Antipolo), Caloocan’s 1st District (268,215), and Rizal’s 1st District (263,830). Seven more districts hold between 187,800 (Pasig) and 166,194 (Cavite’s 7th District) learners: Pasig, Quezon City’s 2nd District, Maguindanao I’s 2nd District, General Santos, Davao City’s 1st District, San Jose del Monte, and Cavite’s 7th District. Fifty districts carry the “Lone District” label, one per city or small province. A hundred and fifty-four districts hold fewer than 50,000 learners.
The table gives each district’s schools, learners, public share, and change since SY 2017-2018. Read the change column with care. Laguna’s 2nd District shows a fall of 62% because Cabuyao and San Pedro became their own divisions, and several districts were redrawn between the 2019 and 2022 elections.
Where a division’s boundaries and district labels did not change, the change is real. Where they did change, the growth appears in another row.
| Province | Schools division | Legislative district | Region | Schools | Learners, SY 2025-26 | Public share | Learners, SY 2017-18 | Change |
|---|---|---|---|---|---|---|---|---|
| Rizal | Rizal | 2nd District | Region IV-A | 393 | 305,538 | 83.0% | 277,645 | +10.0% |
| NCR Third District | Caloocan City | 1st District | NCR | 199 | 268,215 | 77.4% | 270,660 | -0.9% |
| Rizal | Rizal | 1st District | Region IV-A | 316 | 263,830 | 73.6% | 246,658 | +7.0% |
| NCR Second District | Pasig City | Lone District | NCR | 151 | 187,800 | 73.6% | 181,831 | +3.3% |
| NCR Second District | Quezon City | 2nd District | NCR | 166 | 183,008 | 67.8% | 210,735 | -13.2% |
| Maguindanao | Maguindanao I | 2nd District | BARMM | 346 | 180,509 | 77.5% | 144,934 | +24.5% |
| South Cotabato | General Santos City | 1st District | Region XII | 165 | 175,363 | 86.1% | 169,936 | +3.2% |
| Davao del Sur | Davao City | 1st District | Region XI | 183 | 170,314 | 73.2% | 175,558 | -3.0% |
| Bulacan | City of San Jose Del Monte | Lone District | Region III | 165 | 167,865 | 74.3% | 157,922 | +6.3% |
| Cavite | Cavite | 7th District | Region IV-A | 308 | 166,194 | 78.1% | 110,152 | +50.9% |
| Bulacan | Bulacan | 2nd District | Region III | 202 | 161,622 | 76.0% | 196,605 | -17.8% |
| Davao del Sur | Davao City | 3rd District | Region XI | 283 | 151,104 | 88.9% | 127,456 | +18.6% |
| Bulacan | Bulacan | 3rd District | Region III | 256 | 150,546 | 86.0% | 137,143 | +9.8% |
| Antique | Antique | Lone District | Region VI | 610 | 150,418 | 89.8% | 159,131 | -5.5% |
| Cavite | Dasmarinas City | 4th District | Region IV-A | 149 | 149,808 | 73.1% | 160,681 | -6.8% |
| Sarangani | Sarangani | Lone District | Region XII | 355 | 149,075 | 95.1% | 151,760 | -1.8% |
| NCR Fourth District | Taguig City and Pateros | 2nd District | NCR | 136 | 147,021 | 77.2% | 116,004 | +26.7% |
| Cavite | Cavite | 6th District | Region IV-A | 87 | 144,308 | 85.5% | 192,505 | -25.0% |
| Occidental Mindoro | Occidental Mindoro | Lone District | MIMAROPA | 414 | 143,619 | 92.5% | 143,131 | +0.3% |
| Negros Occidental | Bacolod City | Lone District | NIR | 202 | 142,050 | 77.2% | 150,028 | -5.3% |
| Aklan | Aklan | Lone District | Region VI | 470 | 140,862 | 85.7% | 156,136 | -9.8% |
| Bulacan | Bulacan | 4th District | Region III | 170 | 138,468 | 75.3% | 126,014 | +9.9% |
| Palawan | Palawan | 2nd District | MIMAROPA | 410 | 138,031 | 96.2% | 132,347 | +4.3% |
| Lanao del Sur | Lanao del Sur - I | 1st District | BARMM | 446 | 137,698 | 89.1% | 139,705 | -1.4% |
| Laguna | Laguna | 4th District | Region IV-A | 277 | 136,659 | 85.1% | 138,467 | -1.3% |
| Camarines Sur | Camarines Sur | 4th District | Region V | 396 | 136,431 | 93.2% | 139,456 | -2.2% |
| Pampanga | Pampanga | 2nd District | Region III | 257 | 135,746 | 83.4% | 135,047 | +0.5% |
| Zamboanga del Sur | Zamboanga City | 2nd District | Region IX | 174 | 133,337 | 96.5% | 118,369 | +12.6% |
| North Cotabato | North Cotabato | 1st District | Region XII | 310 | 132,177 | 88.4% | 164,404 | -19.6% |
| Laguna | Calamba City | 2nd District | Region IV-A | 165 | 132,098 | 77.2% | 126,969 | +4.0% |
| Maguindanao | Maguindanao II | 1st District | BARMM | 327 | 131,004 | 91.3% | 114,241 | +14.7% |
| Misamis Oriental | Misamis Oriental | 2nd District | Region X | 276 | 130,541 | 91.9% | 129,461 | +0.8% |
| Bukidnon | Bukidnon | 3rd District | Region X | 322 | 129,524 | 90.5% | 126,863 | +2.1% |
| South Cotabato | South Cotabato | 2nd District | Region XII | 325 | 129,372 | 92.8% | 129,237 | +0.1% |
| Nueva Ecija | Nueva Ecija | 1st District | Region III | 345 | 128,744 | 90.5% | 128,935 | -0.1% |
| Zamboanga del Sur | Zamboanga City | 1st District | Region IX | 121 | 128,155 | 82.8% | 121,810 | +5.2% |
| Batangas | Batangas | 1st District | Region IV-A | 250 | 127,707 | 86.3% | 155,024 | -17.6% |
| Davao del Sur | Davao City | 2nd District | Region XI | 183 | 126,486 | 83.5% | 125,110 | +1.1% |
| Quezon | Quezon | 2nd District | Region IV-A | 192 | 125,037 | 85.6% | 120,747 | +3.6% |
| NCR Fourth District | Las Piñas City | Lone District | NCR | 148 | 124,362 | 69.7% | 144,271 | -13.8% |
| Palawan | Palawan | 1st District | MIMAROPA | 490 | 124,209 | 96.7% | 124,899 | -0.6% |
| Pangasinan | Pangasinan I, Lingayen | 2nd District | Region I | 261 | 123,556 | 89.5% | 134,518 | -8.1% |
| NCR Second District | Quezon City | 5th District | NCR | 97 | 123,528 | 76.1% | 102,633 | +20.4% |
| Cebu | Cebu | 2nd District | Region VII | 373 | 123,319 | 92.6% | 125,472 | -1.7% |
| Cebu | Cebu City | 2nd District | Region VII | 125 | 123,154 | 83.4% | 126,674 | -2.8% |
| Cebu | Lapu-Lapu City | 6th District | Region VII | 128 | 121,702 | 81.2% | 112,494 | +8.2% |
| Cebu | Cebu | 5th District | Region VII | 259 | 120,721 | 84.7% | 114,984 | +5.0% |
| Pampanga | Pampanga | 4th District | Region III | 255 | 119,743 | 87.6% | 127,761 | -6.3% |
| Bohol | Bohol | 2nd District | Region VII | 458 | 119,559 | 92.4% | 130,875 | -8.6% |
| Cebu | Cebu | 4th District | Region VII | 232 | 118,552 | 94.2% | 120,382 | -1.5% |
| Lanao del Sur | Lanao del Sur - II | 2nd District | BARMM | 420 | 117,976 | 90.8% | 105,709 | +11.6% |
| Quezon | Quezon | 1st District | Region IV-A | 282 | 117,795 | 90.7% | 117,980 | -0.2% |
| Iloilo | Iloilo | 5th District | Region VI | 328 | 116,515 | 94.4% | 127,154 | -8.4% |
| Nueva Vizcaya | Nueva Vizcaya | Lone District | Region II | 434 | 116,174 | 88.9% | 113,421 | +2.4% |
| Cavite | Bacoor City | 2nd District | Region IV-A | 166 | 115,795 | 68.5% | 124,065 | -6.7% |
| Oriental Mindoro | Oriental Mindoro | 2nd District | MIMAROPA | 334 | 115,658 | 85.4% | 116,386 | -0.6% |
| Batangas | Batangas | 4th District | Region IV-A | 254 | 115,471 | 84.7% | 116,257 | -0.7% |
| Pangasinan | Pangasinan I, Lingayen | 3rd District | Region I | 249 | 114,476 | 90.2% | 123,309 | -7.2% |
| Tarlac | Tarlac | 3rd District | Region III | 192 | 114,109 | 90.7% | 108,324 | +5.3% |
| Quezon | Quezon | 3rd District | Region IV-A | 306 | 113,346 | 91.5% | 121,514 | -6.7% |
| Cavite | Cavite | 5th District | Region IV-A | 139 | 113,272 | 76.9% | 128,032 | -11.5% |
| Pampanga | Angeles City | 1st District | Region III | 122 | 113,162 | 76.2% | 118,234 | -4.3% |
| Cebu | Cebu City | 1st District | Region VII | 137 | 112,171 | 62.9% | 125,727 | -10.8% |
| Rizal | Antipolo City | 1st District | Region IV-A | 106 | 112,037 | 75.0% | 106,155 | +5.5% |
| Quezon | Quezon | 4th District | Region IV-A | 353 | 111,253 | 91.3% | 122,209 | -9.0% |
| Rizal | Antipolo City | 2nd District | Region IV-A | 120 | 110,676 | 78.6% | 107,493 | +3.0% |
| NCR Fourth District | Muntinlupa City | Lone District | NCR | 98 | 110,239 | 74.9% | 111,882 | -1.5% |
| Cebu | Cebu | 3rd District | Region VII | 256 | 109,173 | 92.7% | 106,079 | +2.9% |
| Cavite | Imus City | 3rd District | Region IV-A | 142 | 107,113 | 66.6% | 101,106 | +5.9% |
| Leyte | Leyte | 2nd District | Region VIII | 451 | 106,312 | 96.9% | 114,377 | -7.1% |
| Sulu | Sulu | 1st District | Region IX | 254 | 105,399 | 86.4% | 90,631 | +16.3% |
| Iloilo | Iloilo City | Lone District | Region VI | 173 | 105,256 | 71.3% | 118,431 | -11.1% |
| Cagayan | Cagayan | 1st District | Region II | 385 | 104,020 | 91.1% | 109,727 | -5.2% |
| Zamboanga del Sur | Zamboanga del Sur | 1st District | Region IX | 445 | 103,739 | 90.9% | 109,203 | -5.0% |
| Batangas | Lipa City | 4th District | Region IV-A | 142 | 103,731 | 73.2% | 98,498 | +5.3% |
| Bulacan | Bulacan | 1st District | Region III | 173 | 103,587 | 82.0% | 109,072 | -5.0% |
| Zamboanga del Norte | Zamboanga del Norte | 3rd District | Region IX | 370 | 103,196 | 97.6% | 102,179 | +1.0% |
| Compostela Valley | Davao De Oro | 2nd District | Region XI | 250 | 103,080 | 98.1% | 105,707 | -2.5% |
| Zambales | Zambales | 2nd District | Region III | 288 | 102,824 | 87.5% | 103,981 | -1.1% |
| Bohol | Bohol | 3rd District | Region VII | 486 | 102,720 | 87.4% | 114,826 | -10.5% |
| Tarlac | Tarlac | 1st District | Region III | 314 | 102,579 | 83.3% | 107,078 | -4.2% |
| Sorsogon | Sorsogon | 2nd District | Region V | 339 | 101,929 | 94.7% | 109,485 | -6.9% |
| Iloilo | Iloilo | 3rd District | Region VI | 368 | 101,859 | 94.5% | 111,854 | -8.9% |
| Eastern Samar | Eastern Samar | Lone District | Region VIII | 481 | 101,115 | 95.9% | 115,312 | -12.3% |
| Zamboanga Sibugay | Zamboanga Sibugay | 2nd District | Region IX | 289 | 100,528 | 90.7% | 104,012 | -3.3% |
| Cavite | General Trias City | 6th District | Region IV-A | 109 | 100,466 | 77.0% | ||
| Pangasinan | Pangasinan II, Binalonan | 6th District | Region I | 320 | 100,026 | 91.7% | 107,014 | -6.5% |
| Zamboanga del Sur | Zamboanga del Sur | 2nd District | Region IX | 442 | 99,183 | 95.5% | 105,022 | -5.6% |
| Misamis Oriental | Cagayan de Oro City | 1st District | Region X | 127 | 98,736 | 70.2% | 94,167 | +4.9% |
| Albay | Albay | 3rd District | Region V | 291 | 97,669 | 94.5% | 110,790 | -11.8% |
| Camarines Sur | Camarines Sur | 5th District | Region V | 246 | 96,908 | 91.6% | 105,954 | -8.5% |
| Agusan del Norte | Butuan City | 1st District | CARAGA | 187 | 96,456 | 88.3% | 101,092 | -4.6% |
| NCR Fourth District | Taguig City and Pateros | 1st District | NCR | 88 | 96,349 | 78.9% | 80,492 | +19.7% |
| Agusan del Sur | Agusan del Sur | 2nd District | CARAGA | 296 | 95,943 | 97.4% | 99,161 | -3.2% |
| Benguet | Benguet | Lone District | CAR | 482 | 95,882 | 85.4% | 95,723 | +0.2% |
| Isabela | Isabela | 2nd District | Region II | 332 | 95,558 | 93.9% | 91,838 | +4.1% |
| Nueva Ecija | Nueva Ecija | 4th District | Region III | 197 | 95,368 | 83.4% | 97,618 | -2.3% |
| Lanao del Norte | Iligan City | Lone District | Region X | 176 | 94,904 | 83.2% | 100,817 | -5.9% |
| Tawi-Tawi | Tawi-Tawi | Lone District | BARMM | 309 | 94,237 | 83.9% | 79,403 | +18.7% |
| Davao del Sur | Davao del Sur | 1st District | Region XI | 223 | 94,105 | 91.7% | 87,870 | +7.1% |
| Pampanga | Pampanga | 3rd District | Region III | 158 | 93,904 | 90.1% | 95,172 | -1.3% |
| Bataan | Bataan | 1st District | Region III | 157 | 93,369 | 87.1% | 88,277 | +5.8% |
| Sultan Kudarat | Sultan Kudarat | 2nd District | Region XII | 280 | 92,707 | 99.0% | 88,513 | +4.7% |
| NCR Third District | Malabon City | Lone District | NCR | 81 | 91,998 | 73.1% | 95,938 | -4.1% |
| Northern Samar | Northern Samar | 1st District | Region VIII | 308 | 91,964 | 93.5% | 101,164 | -9.1% |
| La Union | La Union | 2nd District | Region I | 270 | 91,173 | 91.2% | 101,862 | -10.5% |
| Western Samar | Samar (Western Samar) | 2nd District | Region VIII | 502 | 90,888 | 99.6% | 101,467 | -10.4% |
| Bukidnon | Bukidnon | 1st District | Region X | 207 | 89,253 | 92.0% | 89,532 | -0.3% |
| Compostela Valley | Davao De Oro | 1st District | Region XI | 205 | 88,964 | 91.3% | 90,229 | -1.4% |
| Negros Occidental | Negros Occidental | 5th District | NIR | 188 | 88,602 | 91.6% | 123,401 | -28.2% |
| Misamis Oriental | Cagayan de Oro City | 2nd District | Region X | 91 | 88,563 | 77.9% | 85,670 | +3.4% |
| Laguna | Binan City | 1st District | Region IV-A | 102 | 87,254 | 70.3% | 85,737 | +1.8% |
| Camarines Sur | Camarines Sur | 3rd District | Region V | 209 | 87,141 | 87.8% | 90,868 | -4.1% |
| Tarlac | Tarlac City | 2nd District | Region III | 155 | 87,042 | 74.4% | 83,719 | +4.0% |
| Laguna | Sta. Rosa City | 1st District | Region IV-A | 109 | 86,972 | 72.4% | 83,761 | +3.8% |
| Masbate | Masbate | 3rd District | Region V | 309 | 86,808 | 93.3% | 102,624 | -15.4% |
| North Cotabato | North Cotabato | 2nd District | Region XII | 338 | 85,535 | 90.5% | 106,669 | -19.8% |
| Masbate | Masbate | 2nd District | Region V | 271 | 85,265 | 95.3% | 94,734 | -10.0% |
| Camarines Norte | Camarines Norte | 1st District | Region V | 197 | 84,840 | 93.2% | 80,423 | +5.5% |
| Camarines Sur | Camarines Sur | 2nd District | Region V | 243 | 84,301 | 94.5% | 90,877 | -7.2% |
| North Cotabato | North Cotabato | 3rd District | Region XII | 213 | 83,857 | 98.2% | 60,778 | +38.0% |
| Bataan | Bataan | 2nd District | Region III | 129 | 83,771 | 90.2% | 78,606 | +6.6% |
| Pangasinan | Pangasinan I, Lingayen | 1st District | Region I | 256 | 83,672 | 92.2% | 90,561 | -7.6% |
| Surigao del Sur | Surigao del Sur | 1st District | CARAGA | 298 | 83,060 | 93.8% | 80,139 | +3.6% |
| Laguna | Cabuyao City | 2nd District | Region IV-A | 112 | 82,724 | 69.0% | ||
| Camarines Norte | Camarines Norte | 2nd District | Region V | 177 | 82,544 | 91.2% | 77,175 | +7.0% |
| NCR Third District | Valenzuela City | 1st District | NCR | 64 | 82,475 | 87.3% | 79,076 | +4.3% |
| NCR Second District | Quezon City | 1st District | NCR | 109 | 82,157 | 66.9% | 126,714 | -35.2% |
| Benguet | Baguio City | Lone District | CAR | 144 | 81,687 | 69.0% | 96,399 | -15.3% |
| Pangasinan | Pangasinan II, Binalonan | 5th District | Region I | 218 | 81,632 | 92.9% | 86,264 | -5.4% |
| Cebu | Mandaue City | 6th District | Region VII | 78 | 81,529 | 75.9% | 95,620 | -14.7% |
| Oriental Mindoro | Oriental Mindoro | 1st District | MIMAROPA | 291 | 81,215 | 90.2% | 86,820 | -6.5% |
| Bohol | Bohol | 1st District | Region VII | 344 | 81,050 | 83.0% | 81,753 | -0.9% |
| South Cotabato | South Cotabato | 1st District | Region XII | 141 | 80,928 | 84.1% | 75,625 | +7.0% |
| Lanao del Norte | Lanao del Norte | 2nd District | Region X | 227 | 80,697 | 90.4% | 78,314 | +3.0% |
| Romblon | Romblon | Lone District | MIMAROPA | 298 | 79,762 | 93.0% | 88,437 | -9.8% |
| Sultan Kudarat | Sultan Kudarat | 1st District | Region XII | 187 | 79,762 | 80.9% | 79,041 | +0.9% |
| NCR Fourth District | Pasay City | Lone District | NCR | 69 | 78,757 | 80.7% | 80,136 | -1.7% |
| Iloilo | Iloilo | 2nd District | Region VI | 234 | 78,645 | 91.2% | 78,680 | -0.0% |
| Pampanga | San Fernando City | 3rd District | Region III | 93 | 78,403 | 80.9% | 80,193 | -2.2% |
| Southern Leyte | Southern Leyte | Lone District | Region VIII | 378 | 78,103 | 89.4% | 88,506 | -11.8% |
| Zamboanga del Norte | Zamboanga del Norte | 2nd District | Region IX | 268 | 78,053 | 96.5% | 80,730 | -3.3% |
| Nueva Ecija | Nueva Ecija | 3rd District | Region III | 183 | 77,332 | 89.1% | 76,096 | +1.6% |
| Batangas | Batangas City | 2nd District | Region IV-A | 149 | 77,167 | 77.1% | 85,048 | -9.3% |
| Northern Samar | Northern Samar | 2nd District | Region VIII | 336 | 77,112 | 98.1% | 89,135 | -13.5% |
| Palawan | Puerto Princesa City | 2nd District | MIMAROPA | 142 | 76,742 | 90.3% | 73,151 | +4.9% |
| NCR Third District | Valenzuela City | 2nd District | NCR | 66 | 76,535 | 71.8% | 85,057 | -10.0% |
| Cebu | Cebu | 1st District | Region VII | 172 | 76,334 | 80.3% | 66,023 | +15.6% |
| Batangas | Batangas | 3rd District | Region IV-A | 185 | 74,293 | 86.6% | 110,446 | -32.7% |
| NCR First District (Manila) | Manila | 5th District | NCR | 57 | 74,199 | 62.4% | 76,419 | -2.9% |
| NCR Second District | Mandaluyong City | Lone District | NCR | 68 | 73,911 | 68.8% | 78,530 | -5.9% |
| Cagayan | Cagayan | 3rd District | Region II | 232 | 73,330 | 93.8% | 72,859 | +0.6% |
| Leyte | Leyte | 1st District | Region VIII | 240 | 73,113 | 94.6% | 74,620 | -2.0% |
| Pangasinan | Pangasinan II, Binalonan | 4th District | Region I | 126 | 73,101 | 86.8% | 77,213 | -5.3% |
| Leyte | Leyte | 5th District | Region VIII | 318 | 72,801 | 90.8% | 78,920 | -7.8% |
| Lanao del Norte | Lanao del Norte | 1st District | Region X | 202 | 72,571 | 90.9% | 70,559 | +2.9% |
| Capiz | Capiz | 2nd District | Region VI | 330 | 72,517 | 97.3% | 83,758 | -13.4% |
| Iloilo | Iloilo | 1st District | Region VI | 252 | 72,490 | 94.6% | 81,901 | -11.5% |
| Catanduanes | Catanduanes | Lone District | Region V | 289 | 72,449 | 97.1% | 79,270 | -8.6% |
| Nueva Ecija | Cabanatuan City | 3rd District | Region III | 111 | 72,137 | 77.0% | 74,991 | -3.8% |
| Sorsogon | Sorsogon | 1st District | Region V | 238 | 71,884 | 98.1% | 78,782 | -8.8% |
| Negros Oriental | Negros Oriental | 3rd District | NIR | 208 | 71,619 | 95.5% | 70,860 | +1.1% |
| NCR First District (Manila) | Manila | 1st District | NCR | 42 | 71,468 | 82.8% | 83,520 | -14.4% |
| Misamis Oriental | Misamis Oriental | 1st District | Region X | 216 | 71,368 | 90.3% | 73,010 | -2.2% |
| Zamboanga Sibugay | Zamboanga Sibugay | 1st District | Region IX | 270 | 69,972 | 94.3% | 73,256 | -4.5% |
| Davao del Norte | Tagum City | 1st District | Region XI | 69 | 69,961 | 84.1% | 74,084 | -5.6% |
| Laguna | San Pablo City | 3rd District | Region IV-A | 122 | 69,801 | 80.7% | 71,219 | -2.0% |
| Cagayan | Cagayan | 2nd District | Region II | 301 | 69,355 | 88.9% | 76,604 | -9.5% |
| Laguna | San Pedro City | 1st District | Region IV-A | 95 | 69,143 | 72.9% | ||
| Iloilo | Iloilo | 4th District | Region VI | 213 | 68,795 | 94.5% | 75,217 | -8.5% |
| Ilocos Sur | Ilocos Sur | 2nd District | Region I | 358 | 68,571 | 87.0% | 77,702 | -11.8% |
| Agusan del Norte | Agusan del Norte | 2nd District | CARAGA | 194 | 68,340 | 89.3% | 70,577 | -3.2% |
| City of Cotabato | Cotabato City | 1st District | BARMM | 82 | 67,759 | 75.4% | 70,960 | -4.5% |
| Quezon | Lucena City | 2nd District | Region IV-A | 105 | 67,166 | 77.0% | 72,944 | -7.9% |
| Cebu | Talisay City | 1st District | Region VII | 83 | 65,964 | 80.4% | 60,599 | +8.9% |
| Davao del Norte | Davao del Norte | 1st District | Region XI | 203 | 65,684 | 94.5% | 67,124 | -2.1% |
| NCR Fourth District | Paranaque City | 1st District | NCR | 67 | 65,559 | 78.7% | 74,590 | -12.1% |
| Agusan del Sur | Agusan del Sur | 1st District | CARAGA | 246 | 65,514 | 99.6% | 70,633 | -7.2% |
| Negros Occidental | Negros Occidental | 6th District | NIR | 185 | 65,256 | 91.1% | 91,147 | -28.4% |
| NCR First District (Manila) | Manila | 4th District | NCR | 49 | 64,849 | 47.6% | 52,845 | +22.7% |
| NCR Third District | Caloocan City | 2nd District | NCR | 60 | 64,582 | 77.4% | 71,299 | -9.4% |
| Albay | Albay | 2nd District | Region V | 171 | 64,234 | 95.5% | 67,953 | -5.5% |
| Surigao del Norte | Surigao del Norte | 2nd District | CARAGA | 227 | 64,223 | 96.1% | 64,459 | -0.4% |
| NCR Second District | Quezon City | 4th District | NCR | 89 | 64,193 | 70.5% | 75,507 | -15.0% |
| Leyte | Tacloban City | 1st District | Region VIII | 95 | 64,190 | 81.3% | 69,415 | -7.5% |
| NCR Second District | Marikina City | 2nd District | NCR | 70 | 64,085 | 69.4% | 45,939 | +39.5% |
| Laguna | Laguna | 3rd District | Region IV-A | 130 | 64,019 | 89.7% | 63,896 | +0.2% |
| Pampanga | Mabalacat City | 1st District | Region III | 91 | 63,995 | 78.0% | 60,003 | +6.7% |
| Isabela | Isabela | 4th District | Region II | 239 | 63,802 | 91.4% | 63,889 | -0.1% |
| Leyte | Leyte | 4th District | Region VIII | 206 | 63,524 | 93.4% | 66,758 | -4.8% |
| NCR Second District | Quezon City | 3rd District | NCR | 81 | 62,959 | 52.4% | 63,985 | -1.6% |
| Negros Occidental | Negros Occidental | 3rd District | NIR | 115 | 62,941 | 89.9% | 90,006 | -30.1% |
| Davao Occidental | Davao Occidental | 1st District | Region XI | 172 | 62,113 | 100.0% | 1,222 | +4982.9% |
| Leyte | Ormoc City | 4th District | Region VIII | 121 | 62,095 | 85.4% | 59,995 | +3.5% |
| Capiz | Capiz | 1st District | Region VI | 198 | 61,970 | 96.7% | 68,739 | -9.8% |
| NCR Fourth District | Paranaque City | 2nd District | NCR | 78 | 61,130 | 77.2% | 66,951 | -8.7% |
| Isabela | Isabela | 1st District | Region II | 206 | 61,018 | 91.0% | 63,823 | -4.4% |
| Camarines Sur | Camarines Sur | 1st District | Region V | 191 | 60,621 | 84.9% | 64,570 | -6.1% |
| Marinduque | Marinduque | Lone District | MIMAROPA | 256 | 60,594 | 89.6% | 67,871 | -10.7% |
| Davao Oriental | Davao Oriental | 1st District | Region XI | 219 | 60,565 | 93.0% | 61,751 | -1.9% |
| NCR First District (Manila) | Manila | 3rd District | NCR | 50 | 60,368 | 64.1% | 72,387 | -16.6% |
| Albay | Albay | 1st District | Region V | 147 | 60,351 | 94.3% | 65,782 | -8.3% |
| Aurora | Aurora | Lone District | Region III | 203 | 60,134 | 89.0% | 62,822 | -4.3% |
| NCR Second District | Quezon City | 6th District | NCR | 48 | 60,118 | 89.6% | 59,283 | +1.4% |
| Bukidnon | Valencia City | 4th District | Region X | 106 | 59,553 | 83.6% | 57,102 | +4.3% |
| Batangas | Batangas | 2nd District | Region IV-A | 180 | 59,491 | 88.9% | 63,931 | -6.9% |
| Basilan | Basilan | Lone District | BARMM | 189 | 58,978 | 94.9% | 51,374 | +14.8% |
| Isabela | Isabela | 3rd District | Region II | 214 | 58,855 | 82.6% | 67,256 | -12.5% |
| Camarines Sur | Naga City | 3rd District | Region V | 83 | 58,716 | 80.3% | 63,499 | -7.5% |
| Zambales | Olongapo City | 1st District | Region III | 73 | 58,404 | 79.3% | 64,161 | -9.0% |
| Davao del Norte | Davao del Norte | 2nd District | Region XI | 106 | 58,332 | 94.7% | 56,595 | +3.1% |
| Batangas | Tanauan City | 3rd District | Region IV-A | 91 | 58,077 | 67.9% | 54,181 | +7.2% |
| Negros Oriental | Negros Oriental | 1st District | NIR | 212 | 58,070 | 94.6% | 73,379 | -20.9% |
| Bulacan | Malolos City | 1st District | Region III | 102 | 57,984 | 71.1% | 66,425 | -12.7% |
| Bukidnon | Bukidnon | 2nd District | Region X | 162 | 57,658 | 94.8% | 55,149 | +4.5% |
| Zamboanga del Sur | Pagadian City | 1st District | Region IX | 119 | 57,403 | 76.5% | 53,892 | +6.5% |
| Bukidnon | Malaybalay City | 2nd District | Region X | 110 | 56,753 | 91.3% | 53,425 | +6.2% |
| Lanao del Sur | Marawi City | 1st District | BARMM | 99 | 56,244 | 42.5% | 15,662 | +259.1% |
| Abra | Abra | Lone District | CAR | 351 | 56,049 | 84.3% | 61,653 | -9.1% |
| Tarlac | Tarlac | 2nd District | Region III | 128 | 55,520 | 91.3% | 53,424 | +3.9% |
| Davao del Norte | Panabo City | 2nd District | Region XI | 83 | 55,417 | 85.0% | 53,260 | +4.0% |
| Zambales | Zambales | 1st District | Region III | 107 | 55,017 | 89.6% | 52,936 | +3.9% |
| Albay | Legaspi City | 2nd District | Region V | 94 | 54,781 | 76.5% | 59,146 | -7.4% |
| Cebu | Toledo City | 3rd District | Region VII | 77 | 54,777 | 92.6% | 54,713 | +0.1% |
| Negros Occidental | Kabankalan City | 6th District | NIR | 119 | 54,756 | 88.4% | 57,060 | -4.0% |
| Sulu | Sulu | 2nd District | Region IX | 226 | 54,237 | 93.6% | 45,918 | +18.1% |
| Nueva Ecija | Nueva Ecija | 2nd District | Region III | 175 | 52,724 | 95.6% | 52,308 | +0.8% |
| Davao Oriental | Davao Oriental | 2nd District | Region XI | 133 | 52,430 | 96.8% | ||
| South Cotabato | Koronadal City | 2nd District | Region XII | 93 | 51,873 | 81.4% | 53,559 | -3.1% |
| Cebu | Cebu | 6th District | Region VII | 69 | 51,620 | 85.8% | 48,158 | +7.2% |
| Davao del Sur | Digos City | 1st District | Region XI | 75 | 50,576 | 78.8% | 49,667 | +1.8% |
| Negros Oriental | Negros Oriental | 2nd District | NIR | 138 | 49,789 | 98.1% | 46,959 | +6.0% |
| Pangasinan | San Carlos City | 3rd District | Region I | 96 | 49,506 | 87.1% | 54,143 | -8.6% |
| Cavite | Cavite | 1st District | Region IV-A | 61 | 49,341 | 83.7% | 50,062 | -1.4% |
| Sorsogon | Sorsogon City | 1st District | Region V | 103 | 49,298 | 89.5% | 52,844 | -6.7% |
| Western Samar | Calbayog City | 1st District | Region VIII | 180 | 49,022 | 96.2% | 53,163 | -7.8% |
| Biliran | Biliran | Lone District | Region VIII | 155 | 48,707 | 96.1% | 49,403 | -1.4% |
| Masbate | Masbate | 1st District | Region V | 184 | 48,428 | 95.9% | 56,954 | -15.0% |
| Pangasinan | Dagupan City | 4th District | Region I | 72 | 48,133 | 69.3% | 54,846 | -12.2% |
| La Union | La Union | 1st District | Region I | 178 | 48,117 | 91.0% | 54,665 | -12.0% |
| NCR Third District | Navotas | Lone District | NCR | 37 | 47,848 | 92.6% | 52,912 | -9.6% |
| Quirino | Quirino | Lone District | Region II | 204 | 47,845 | 94.6% | 47,980 | -0.3% |
| Ifugao | Ifugao | Lone District | CAR | 280 | 47,116 | 85.0% | 48,618 | -3.1% |
| Laguna | Laguna | 2nd District | Region IV-A | 78 | 46,942 | 71.2% | 125,195 | -62.5% |
| Misamis Occidental | Misamis Occidental | 1st District | Region X | 235 | 45,435 | 82.2% | 46,626 | -2.6% |
| Ilocos Sur | Ilocos Sur | 1st District | Region I | 196 | 45,318 | 89.1% | 50,317 | -9.9% |
| Ilocos Norte | Ilocos Norte | 2nd District | Region I | 200 | 45,146 | 91.3% | 51,682 | -12.6% |
| Surigao del Sur | Surigao del Sur | 2nd District | CARAGA | 182 | 45,034 | 96.7% | 45,687 | -1.4% |
| North Cotabato | Kidapawan City | 2nd District | Region XII | 94 | 44,622 | 89.8% | 44,042 | +1.3% |
| NCR First District (Manila) | Manila | 2nd District | NCR | 34 | 44,179 | 81.8% | 50,809 | -13.0% |
| NCR Second District | Marikina City | 1st District | NCR | 54 | 43,502 | 68.0% | 66,007 | -34.1% |
| Negros Oriental | Bayawan City | 3rd District | NIR | 100 | 43,432 | 97.7% | 42,167 | +3.0% |
| Guimaras | Guimaras | Lone District | Region VI | 132 | 43,325 | 94.1% | 44,060 | -1.7% |
| Leyte | Leyte | 3rd District | Region VIII | 161 | 42,399 | 94.3% | 47,444 | -10.6% |
| Albay | Tabaco City | 1st District | Region V | 74 | 42,228 | 91.3% | 45,470 | -7.1% |
| Davao Oriental | Mati City | 2nd District | Region XI | 82 | 42,030 | 89.5% | 94,999 | -55.8% |
| Cagayan | Tuguegarao City | 3rd District | Region II | 58 | 41,851 | 79.6% | 44,930 | -6.9% |
| NCR Fourth District | Makati City | 1st District | NCR | 58 | 41,332 | 63.7% | 54,112 | -23.6% |
| Negros Occidental | Bago City | 4th District | NIR | 70 | 41,014 | 86.9% | 44,038 | -6.9% |
| Batangas | Sto. Tomas City | 3rd District | Region IV-A | 47 | 40,853 | 85.9% | ||
| Bulacan | City of Baliwag | 2nd District | Region III | 64 | 40,846 | 62.7% | ||
| Negros Occidental | Cadiz City | 2nd District | NIR | 81 | 40,736 | 94.9% | 42,026 | -3.1% |
| Negros Occidental | Sagay City | 2nd District | NIR | 80 | 39,386 | 95.4% | 42,497 | -7.3% |
| Cebu | Danao City | 5th District | Region VII | 72 | 39,317 | 87.5% | 37,974 | +3.5% |
| Negros Occidental | Negros Occidental | 1st District | NIR | 99 | 39,197 | 98.1% | 37,483 | +4.6% |
| Cebu | Carcar City | 1st District | Region VII | 64 | 38,467 | 88.4% | 35,388 | +8.7% |
| Western Samar | Samar (Western Samar) | 1st District | Region VIII | 245 | 38,415 | 99.0% | 43,392 | -11.5% |
| Capiz | Roxas City | 1st District | Region VI | 79 | 38,159 | 80.3% | 41,793 | -8.7% |
| Isabela | Cauayan City | 3rd District | Region II | 99 | 38,094 | 86.0% | 37,852 | +0.6% |
| Ilocos Norte | Ilocos Norte | 1st District | Region I | 200 | 37,919 | 94.2% | 43,368 | -12.6% |
| NCR First District (Manila) | Manila | 6th District | NCR | 43 | 37,851 | 80.0% | 53,161 | -28.8% |
| Misamis Oriental | Gingoog City | 1st District | Region X | 113 | 37,840 | 89.4% | 37,553 | +0.8% |
| Isabela | Santiago City | 4th District | Region II | 66 | 37,767 | 81.0% | 39,668 | -4.8% |
| Nueva Ecija | San Jose City | 2nd District | Region III | 81 | 37,766 | 82.7% | 38,675 | -2.4% |
| Zamboanga del Norte | Dipolog City | 2nd District | Region IX | 74 | 37,747 | 87.4% | 39,257 | -3.8% |
| Surigao del Norte | Surigao City | 2nd District | CARAGA | 111 | 36,851 | 88.0% | 39,888 | -7.6% |
| Isabela | City of Ilagan | 1st District | Region II | 109 | 36,710 | 89.3% | 36,844 | -0.4% |
| Zamboanga del Norte | Zamboanga del Norte | 1st District | Region IX | 171 | 36,428 | 97.2% | 35,425 | +2.8% |
| Pangasinan | Urdaneta City | 5th District | Region I | 82 | 36,179 | 84.6% | 41,306 | -12.4% |
| Bulacan | Meycauayan City | 4th District | Region III | 61 | 36,044 | 77.3% | 41,155 | -12.4% |
| Negros Oriental | Guihulngan City | 1st District | NIR | 108 | 35,986 | 95.2% | 34,956 | +2.9% |
| Surigao del Norte | Siargao | 1st District | CARAGA | 158 | 35,827 | 95.2% | 33,640 | +6.5% |
| Misamis Occidental | Ozamis City | 2nd District | Region X | 82 | 35,682 | 85.2% | 36,126 | -1.2% |
| Mountain Province | Mt. Province | Lone District | CAR | 279 | 35,355 | 92.3% | 39,554 | -10.6% |
| Oriental Mindoro | Calapan City | 1st District | MIMAROPA | 79 | 35,276 | 86.8% | 38,807 | -9.1% |
| Albay | Ligao City | 3rd District | Region V | 81 | 35,141 | 92.6% | 36,461 | -3.6% |
| Negros Oriental | Dumaguete City | 2nd District | NIR | 52 | 34,380 | 71.1% | 38,442 | -10.6% |
| Kalinga | Tabuk City | Lone District | CAR | 121 | 34,216 | 79.5% | 33,824 | +1.2% |
| City of Isabela | Isabela City | Lone District | Region IX | 75 | 34,138 | 93.7% | 32,282 | +5.7% |
| Negros Occidental | San Carlos City | 1st District | NIR | 77 | 33,639 | 87.8% | 34,884 | -3.6% |
| Camarines Sur | Iriga City | 5th District | Region V | 73 | 32,847 | 73.0% | 36,054 | -8.9% |
| Cebu | City of Naga, Cebu | 1st District | Region VII | 63 | 32,729 | 91.7% | 30,513 | +7.3% |
| Masbate | Masbate City | 2nd District | Region V | 59 | 32,643 | 84.8% | 33,936 | -3.8% |
| Negros Occidental | Silay City | 3rd District | NIR | 53 | 31,566 | 88.2% | 31,828 | -0.8% |
| Pampanga | Pampanga | 1st District | Region III | 52 | 31,451 | 77.0% | 28,299 | +11.1% |
| Misamis Occidental | Misamis Occidental | 2nd District | Region X | 151 | 31,425 | 89.4% | 31,144 | +0.9% |
| Special Geographic Area (North Cotabato) | Special Geographic Area Division | 1st District | BARMM | 91 | 30,838 | 100.0% | ||
| Negros Occidental | Negros Occidental | 4th District | NIR | 75 | 30,779 | 89.9% | 32,400 | -5.0% |
| Nueva Ecija | Gapan City | 4th District | Region III | 52 | 30,366 | 91.7% | 31,609 | -3.9% |
| Davao del Norte | Island Garden City of Samal | 2nd District | Region XI | 86 | 30,032 | 94.3% | 28,208 | +6.5% |
| Sultan Kudarat | Tacurong City | 1st District | Region XII | 51 | 29,615 | 74.4% | 31,520 | -6.0% |
| Bataan | Balanga City | 2nd District | Region III | 37 | 28,989 | 87.3% | 27,452 | +5.6% |
| Bohol | Tagbilaran City | 1st District | Region VII | 50 | 28,811 | 65.7% | 34,533 | -16.6% |
| Western Samar | Catbalogan City | 2nd District | Region VIII | 64 | 28,713 | 92.5% | 31,963 | -10.2% |
| Negros Oriental | Tanjay City | 2nd District | NIR | 104 | 28,507 | 88.6% | 29,481 | -3.3% |
| Dinagat Islands | Dinagat Island | Lone District | CARAGA | 147 | 28,498 | 97.4% | 30,493 | -6.5% |
| Negros Occidental | Himamaylan City | 5th District | NIR | 64 | 28,450 | 95.5% | ||
| Apayao | Apayao | Lone District | CAR | 207 | 28,036 | 95.4% | 30,620 | -8.4% |
| Basilan | Lamitan City | Lone District | BARMM | 67 | 27,967 | 77.4% | 24,451 | +14.4% |
| La Union | San Fernando City | 1st District | Region I | 60 | 27,591 | 71.6% | 30,723 | -10.2% |
| Bukidnon | Bukidnon | 4th District | Region X | 67 | 27,243 | 92.3% | 19,441 | +40.1% |
| Leyte | Baybay City | 5th District | Region VIII | 93 | 27,051 | 92.2% | 29,911 | -9.6% |
| Surigao del Sur | Bislig City | 2nd District | CARAGA | 78 | 26,505 | 76.3% | 27,757 | -4.5% |
| Negros Occidental | Escalante City | 1st District | NIR | 49 | 25,487 | 95.5% | 26,267 | -3.0% |
| Agusan del Sur | Bayugan City | 1st District | CARAGA | 73 | 25,303 | 96.9% | 28,656 | -11.7% |
| Ilocos Norte | Laoag City | 1st District | Region I | 65 | 25,121 | 81.6% | 29,898 | -16.0% |
| Kalinga | Kalinga | Lone District | CAR | 200 | 24,473 | 94.3% | 26,164 | -6.5% |
| Negros Occidental | Victorias City | 3rd District | NIR | 39 | 24,299 | 90.4% | ||
| Pangasinan | Alaminos City | 1st District | Region I | 59 | 24,193 | 88.7% | 26,468 | -8.6% |
| Quezon | Tayabas City | 1st District | Region IV-A | 48 | 23,689 | 92.8% | 21,218 | +11.6% |
| Camiguin | Camiguin | Lone District | Region X | 79 | 23,380 | 93.3% | 25,759 | -9.2% |
| Agusan del Norte | Cabadbaran City | 2nd District | CARAGA | 46 | 23,013 | 79.3% | 22,303 | +3.2% |
| NCR Second District | City of San Juan | Lone District | NCR | 33 | 22,633 | 50.8% | 25,089 | -9.8% |
| Iloilo | Passi City | 4th District | Region VI | 55 | 22,412 | 91.6% | 23,682 | -5.4% |
| Siquijor | Siquijor | Lone District | NIR | 92 | 22,392 | 90.1% | 23,496 | -4.7% |
| Cebu | Bogo City | 4th District | Region VII | 44 | 22,192 | 79.8% | 22,621 | -1.9% |
| Zamboanga del Norte | Dapitan City | 1st District | Region IX | 66 | 21,752 | 94.0% | 22,263 | -2.3% |
| Davao del Sur | Davao del Sur | 2nd District | Region XI | 81 | 20,844 | 89.1% | 27,053 | -23.0% |
| Cavite | Cavite City | 1st District | Region IV-A | 29 | 20,704 | 88.8% | 23,602 | -12.3% |
| Batangas | Calaca City | 1st District | Region IV-A | 42 | 20,469 | 92.9% | ||
| Cavite | Carmona City | 5th District | Region IV-A | 20 | 20,361 | 91.2% | ||
| Nueva Ecija | Science City of Muñoz | 2nd District | Region III | 52 | 20,357 | 89.7% | 21,865 | -6.9% |
| Negros Oriental | Bais City | 2nd District | NIR | 56 | 19,475 | 96.1% | 20,909 | -6.9% |
| Negros Occidental | Sipalay City | 6th District | NIR | 51 | 19,216 | 93.2% | ||
| Misamis Occidental | Tangub City | 2nd District | Region X | 71 | 18,590 | 91.8% | 18,601 | -0.1% |
| Eastern Samar | Borongan City | Lone District | Region VIII | 65 | 18,537 | 94.6% | 20,151 | -8.0% |
| Southern Leyte | Maasin City | Lone District | Region VIII | 81 | 18,537 | 76.2% | 21,572 | -14.1% |
| Surigao del Sur | Tandag City | 1st District | CARAGA | 39 | 17,972 | 88.8% | 17,492 | +2.7% |
| Misamis Occidental | Oroquieta City | 1st District | Region X | 64 | 17,913 | 86.5% | 19,673 | -8.9% |
| Negros Occidental | La Carlota City | 4th District | NIR | 36 | 17,306 | 96.7% | 18,987 | -8.9% |
| Ilocos Sur | Vigan City | 1st District | Region I | 34 | 15,983 | 84.0% | 20,023 | -20.2% |
| Negros Oriental | Canlaon City | 1st District | NIR | 43 | 15,354 | 93.2% | ||
| Misamis Oriental | El Salvador | 2nd District | Region X | 28 | 13,765 | 90.1% | 12,332 | +11.6% |
| Ilocos Sur | Candon City | 2nd District | Region I | 46 | 13,176 | 87.4% | 14,948 | -11.9% |
| Negros Occidental | Negros Occidental | 2nd District | NIR | 23 | 12,045 | 91.8% | 15,418 | -21.9% |
| Ilocos Norte | Batac City | 2nd District | Region I | 40 | 11,491 | 77.2% | 12,987 | -11.5% |
| Cavite | Dasmarinas City | 2nd District | Region IV-A | 13 | 11,470 | 22.4% | 12,852 | -10.8% |
| Maguindanao | Maguindanao I | 1st District | BARMM | 36 | 10,640 | 33.5% | 3,139 | +239.0% |
| Davao Occidental | Davao Occidental | Lone District | Region XI | 56 | 10,396 | 87.6% | ||
| Negros Occidental | Negros Occidental | Lone District | NIR | 1 | 9,137 | 100.0% | 7,003 | +30.5% |
| Camarines Sur | Naga City | 2nd District | Region V | 15 | 9,126 | 0.0% | 6,355 | +43.6% |
| NCR Fourth District | Makati City | 2nd District | NCR | 16 | 9,097 | 47.6% | 59,223 | -84.6% |
| Agusan del Norte | Agusan del Norte | 1st District | CARAGA | 35 | 8,931 | 100.0% | 9,431 | -5.3% |
| Agusan del Sur | Agusan del Sur | Lone District | CARAGA | 30 | 8,517 | 0.0% | 7,917 | +7.6% |
| Maguindanao | Maguindanao II | 2nd District | BARMM | 25 | 6,520 | 65.0% | 2,313 | +181.9% |
| Bulacan | Meycauayan City | 3rd District | Region III | 3 | 6,339 | 100.0% | 3,512 | +80.5% |
| Iloilo | Iloilo | Lone District | Region VI | 1 | 6,198 | 100.0% | 5,596 | +10.8% |
| Agusan del Sur | Bayugan City | Lone District | CARAGA | 11 | 6,029 | 20.0% | 4,735 | +27.3% |
| Special Geographic Area (North Cotabato) | Special Geographic Area Division | 3rd District | BARMM | 18 | 5,355 | 100.0% | ||
| Benguet | Baguio City | 1st District | CAR | 9 | 4,924 | 32.0% | 3,238 | +52.1% |
| Lanao del Sur | Lanao del Sur - I | 2nd District | BARMM | 11 | 4,460 | 83.2% | 4,636 | -3.8% |
| Davao del Norte | Tagum City | 2nd District | Region XI | 11 | 4,271 | 45.5% | 2,369 | +80.3% |
| Cavite | General Trias City | 2nd District | Region IV-A | 2 | 4,170 | 96.6% | ||
| Batanes | Batanes | Lone District | Region II | 28 | 4,048 | 96.4% | 4,465 | -9.3% |
| Camarines Norte | Camarines Norte | Lone District | Region V | 9 | 3,419 | 0.0% | 14,582 | -76.6% |
| Laguna | San Pablo City | 2nd District | Region IV-A | 2 | 3,123 | 0.0% | ||
| Cavite | Imus City | 2nd District | Region IV-A | 6 | 2,847 | 92.8% | 2,987 | -4.7% |
| Cebu | Mandaue City | 1st District | Region VII | 10 | 2,574 | 93.0% | ||
| Cavite | Dasmarinas City | 7th District | Region IV-A | 1 | 2,524 | 100.0% | 1,858 | +35.8% |
| Cebu | Lapu-Lapu City | 1st District | Region VII | 12 | 2,027 | 46.6% | 987 | +105.4% |
| Laguna | Laguna | 1st District | Region IV-A | 5 | 1,733 | 91.0% | 75,174 | -97.7% |
| Negros Oriental | Bayawan City | 1st District | NIR | 9 | 1,583 | 100.0% | ||
| Laguna | Calamba City | 1st District | Region IV-A | 5 | 1,546 | 0.0% | 196 | +688.8% |
| Cebu | Toledo City | 1st District | Region VII | 3 | 1,495 | 0.0% | ||
| Bulacan | Meycauayan City | 1st District | Region III | 2 | 1,468 | 0.0% | 669 | +119.4% |
| Negros Occidental | Sipalay City | 3rd District | NIR | 3 | 1,363 | 100.0% | ||
| Cebu | Danao City | 1st District | Region VII | 4 | 1,323 | 23.6% | ||
| Special Geographic Area (North Cotabato) | Special Geographic Area Division | No Legislative District | BARMM | 7 | 1,260 | 67.4% | ||
| Negros Oriental | Dumaguete City | 3rd District | NIR | 3 | 1,255 | 0.0% | ||
| Nueva Ecija | Cabanatuan City | 2nd District | Region III | 1 | 1,238 | 0.0% | ||
| Pangasinan | San Carlos City | 1st District | Region I | 1 | 1,184 | 0.0% | 1,140 | +3.9% |
| City of Cotabato | Cotabato City | 2nd District | BARMM | 3 | 1,133 | 0.0% | 1,621 | -30.1% |
| Negros Oriental | Bais City | 1st District | NIR | 4 | 1,097 | 100.0% | ||
| Cebu | Bogo City | 1st District | Region VII | 1 | 1,084 | 100.0% | ||
| Cavite | Bacoor City | 1st District | Region IV-A | 5 | 1,032 | 0.0% | 4,895 | -78.9% |
How to read the tables
- Province names are written as the files give them, in title case. The Metro Manila “provinces” are the file’s four districts: First (Manila), Second (Quezon City, Pasig, Marikina, Mandaluyong, San Juan), Third (Caloocan, Malabon, Navotas, Valenzuela) and Fourth (Las Piñas, Makati, Muntinlupa, Parañaque, Pasay, Taguig and Pateros).
- Growth is the compound annual rate from SY 2017-2018 to SY 2025-2026 over all sectors. The column “since SY 2022-23” is the three-year change.
- Inputs are SY 2023-2024 public school aggregates: total learners divided by total teachers or by total instructional rooms, and the share of learners in schools with any internet connection.
- Legislative districts are keyed by schools division and district label. Districts with fewer than 1,000 learners are left out as mislabels.
- Regions are on SY 2025-2026 boundaries, so Sulu appears under Region IX and the Negros provinces under NIR.
What the province table means for aspiring school heads
Domain 5 of the Philippine Professional Standards for School Heads (PPSSH) asks school heads to build relationships with “local government units and other stakeholders” (Strand 5.2). Domain 2, Strand 2.4, asks them to manage “school resources from internal and external sources”. The province table gives the facts a school head needs before that conversation.
A school head in Rizal or Cavite asks a provincial board for classrooms in a province that is growing and already has 57 to 61 learners per room. A school head in Ilocos Norte asks for something different, because the province has 19 learners per room and is losing learners at 1.75% a year.
The Special Education Fund is levied on real property. The provinces with the most private learners and the fastest growth therefore tend to have the most to spend, and the islands with the least private enrollment have the least. The DepEd schools division rankings carry the same comparison at the division level, and the PPSSH Domain 5 guide works through the competency.
Frequently asked questions
Which Philippine province has the most school learners in SY 2025-2026?
Cebu, with 1,300,304 learners in SY 2025-2026 across the provincial and city divisions on the island. Cavite (1,010,719) and Metro Manila’s Second District (967,894) are next.
Which provinces have growing enrollment?
Over nine years, 26 of 87 provinces have grown, led by Maguindanao, Lanao del Sur, Tawi-Tawi, Sulu, and Basilan, then Cavite, Rizal, Bataan, and Bukidnon. Since the SY 2022-2023 peak only Maguindanao and Tawi-Tawi have grown.
How many legislative districts are in the DepEd enrollment data?
The data holds 385 legislative districts with at least 1,000 learners, keyed by schools division and district label. The largest are Rizal’s 2nd District (305,538 learners), Caloocan’s 1st District (268,215), and Rizal’s 1st District (263,830).
Download the data
The cleaned, harmonized DepEd files behind this series are free to download in CSV and Parquet, with a codebook and checksums, under the terms of use set out in the release. Download Cleaned DepEd School Data, SY 2017-18 to 2025-26 documents every file and column. The files themselves are at data.nash.com.ph, starting with the README, the SY 2023-24 school master file (CSV, 8.0 MB) and the nine-year enrollment panel (Parquet, 17.2 MB).
More in this series
- DepEd Schools Division Rankings: Growth and School Inputs
- DepEd Enrollment Trends SY 2017-2018 to SY 2025-2026
- Enrollment by school year: SY 2017-18, SY 2018-19, SY 2019-20, SY 2020-21, SY 2021-22, SY 2022-23, SY 2023-24, SY 2024-25, SY 2025-26
- LGU-Funded Teachers and Staff in DepEd Schools, SY 2023-2024
- DepEd Data for Aspiring School Heads: Where to Start
- For aspiring school heads: How to Read DepEd Data and the full report, Philippine basic education in numbers
Analysis and charts by Mark Anthony Llego for NASH Reviewer. Data: Department of Education enrollment datasets SY 2017-18 to SY 2025-26 and the SY 2023-24 school personnel, facilities and ICT files. Charts may be reused only with written permission from support@nash.com.ph.