Every DepEd schools division is ranked below by enrollment growth from SY 2017-2018 to SY 2025-2026 and by nine school input indicators from the SY 2023-2024 school files. Among the 180 divisions with stable boundaries, 57 grew and 123 shrank, and the divisions with the best inputs are the ones losing learners fastest.
The schools division is the unit that matters most to a school head’s working life. The schools division superintendent allocates teacher items and ranks classroom construction requests. The superintendent also assigns the principals who come through the National Assessment for School Heads (NASH) process and approves the School Improvement Plan. The National Education Plan 2026-2035 (NatPlan) also places its “right-sizing” of resources at this level.
Yet most public discussion of DepEd data stops at the region, where seventeen or eighteen averages hide the 231 divisions that run the system.
The first table is about demand: how enrollment changed over the nine files from SY 2017-2018 to SY 2025-2026. The second is about supply: what the SY 2023-2024 school files say about teachers, classrooms, toilets, water, electricity, internet, computers, head positions, and makeshift rooms in each division’s public schools. The two rankings do not match, and the mismatch is the main finding.
Key findings
- Among the 180 divisions with stable boundaries, 57 have more learners than in SY 2017-2018 and 123 have fewer. The median change is −0.45% a year, and since the SY 2022-2023 peak only seven of the 180 grew.
- The fastest growth is in the Bangsamoro and the Sulu archipelago. Maguindanao I added 43,076 learners (+3.24% a year), and seven of BARMM’s nine comparable divisions grew. Marawi City’s +17.33% a year is recovery from the 2017 siege, not population growth.
- The steepest declines are on the Ilocos coast and in the small cities of the Visayas, led by Vigan City (−2.78% a year). Not one of Region I’s fourteen comparable divisions grew.
- School inputs vary widely between divisions. Learners per instructional room run from 12.1 in Batanes to 82.3 in General Trias City, and the share of schools with no head position runs from zero to 74% in Basilan.
- The divisions with the best inputs are losing learners fastest, and those with the worst inputs are gaining learners. Vigan, Laoag, Urdaneta, and Alaminos are in the top twelve on inputs and the bottom twenty on growth. Maguindanao I and II, Tawi-Tawi, Basilan, and Sulu are in the top ten on growth and the bottom twelve on inputs.
Which schools divisions can be compared across the nine years
The SY 2025-2026 file lists 231 schools divisions outside the overseas group. Thirteen of them did not exist in SY 2017-2018. One of the thirteen, Lanao del Sur - IB, appeared only in SY 2019-2020 and then disappeared. Twelve new divisions survive to the latest file:
| Division | Region | First appears | Learners, SY 2025-26 |
|---|---|---|---|
| Sipalay City | NIR | SY 2018-19 | 20,696 |
| Himamaylan City | NIR | SY 2018-19 | 29,130 |
| Cabuyao City | Region IV-A | SY 2018-19 | 83,138 |
| General Trias City | Region IV-A | SY 2019-20 | 104,636 |
| Special Geographic Area Division | BARMM | SY 2021-22 | 38,387 |
| Victorias City | NIR | SY 2022-23 | 24,299 |
| San Pedro City | Region IV-A | SY 2022-23 | 69,143 |
| Canlaon City | NIR | SY 2023-24 | 15,354 |
| Sto. Tomas City | Region IV-A | SY 2023-24 | 41,714 |
| City of Baliwag | Region III | SY 2024-25 | 40,846 |
| Calaca City | Region IV-A | SY 2025-26 | 20,469 |
| Carmona City | Region IV-A | SY 2025-26 | 20,569 |
Every new city division was cut out of an existing provincial or city division. The original division’s enrollment therefore falls by exactly the enrollment of the schools that moved, although no learner left school.
Laguna lost Cabuyao and San Pedro; Cavite lost General Trias and Carmona; Batangas lost Sto. Tomas and Calaca; Negros Occidental lost Himamaylan, Sipalay, and Victorias; Negros Oriental lost Canlaon; Bulacan lost Baliwag; and the Cotabato division gave 63 barangays to the Special Geographic Area Division in BARMM. Three other transfers moved schools from one division to another. Mati City’s schools moved to Davao Oriental in SY 2019-2020, Makati’s ten disputed barangays moved to Taguig in SY 2023-2024, and the Special Geographic Area took its schools from Cotabato.
Thirty-nine of the 219 divisions present in both end years are affected by one of these changes. The full table keeps them, with a note in the last column. The rankings and the chart use only the 180 divisions whose boundaries did not change.
Enrollment growth by schools division: 57 up, 123 down
Across the 180 comparable divisions, the median change is −0.45% a year. Fifty-seven divisions have more learners in SY 2025-2026 than in SY 2017-2018, and 123 have fewer. Since the SY 2022-2023 peak the count is lower still: only seven of the 180 grew.
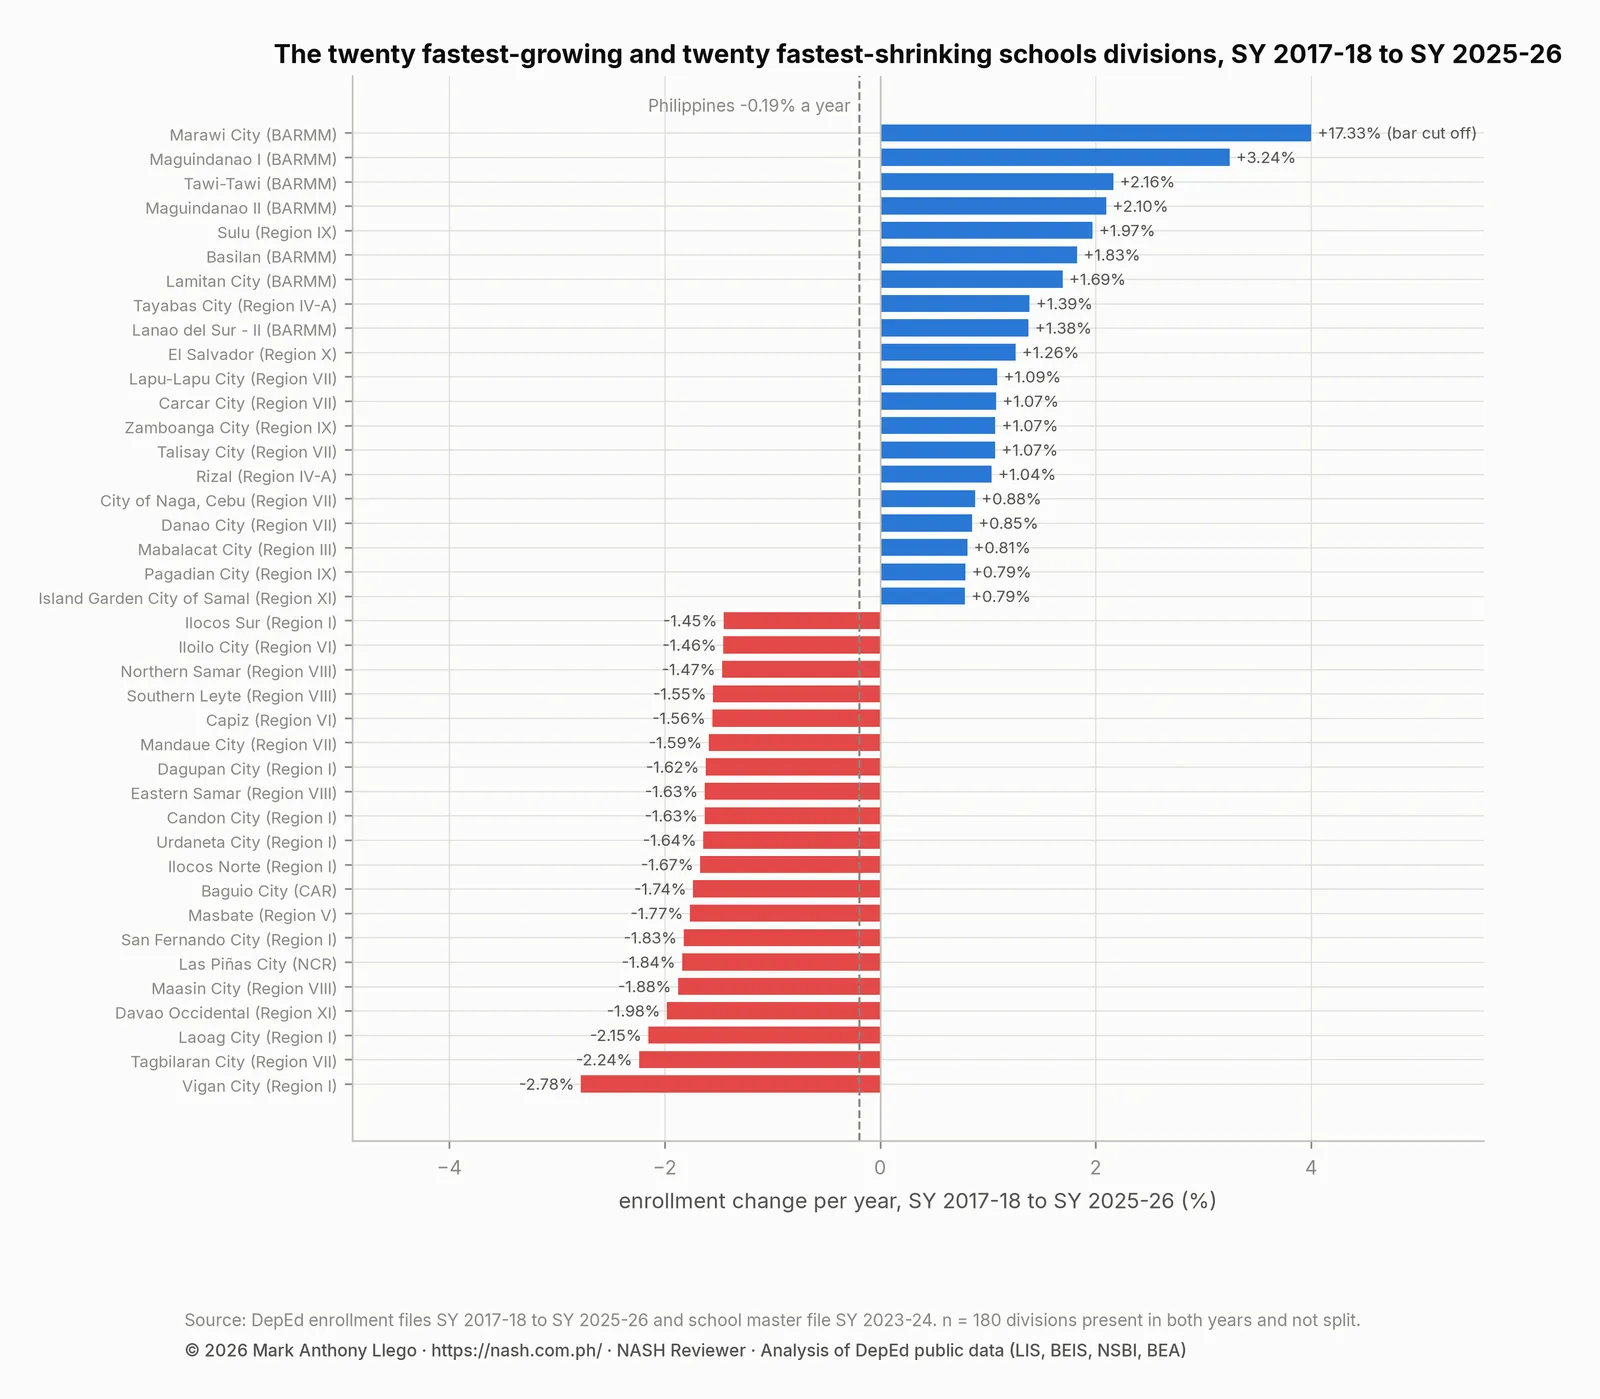
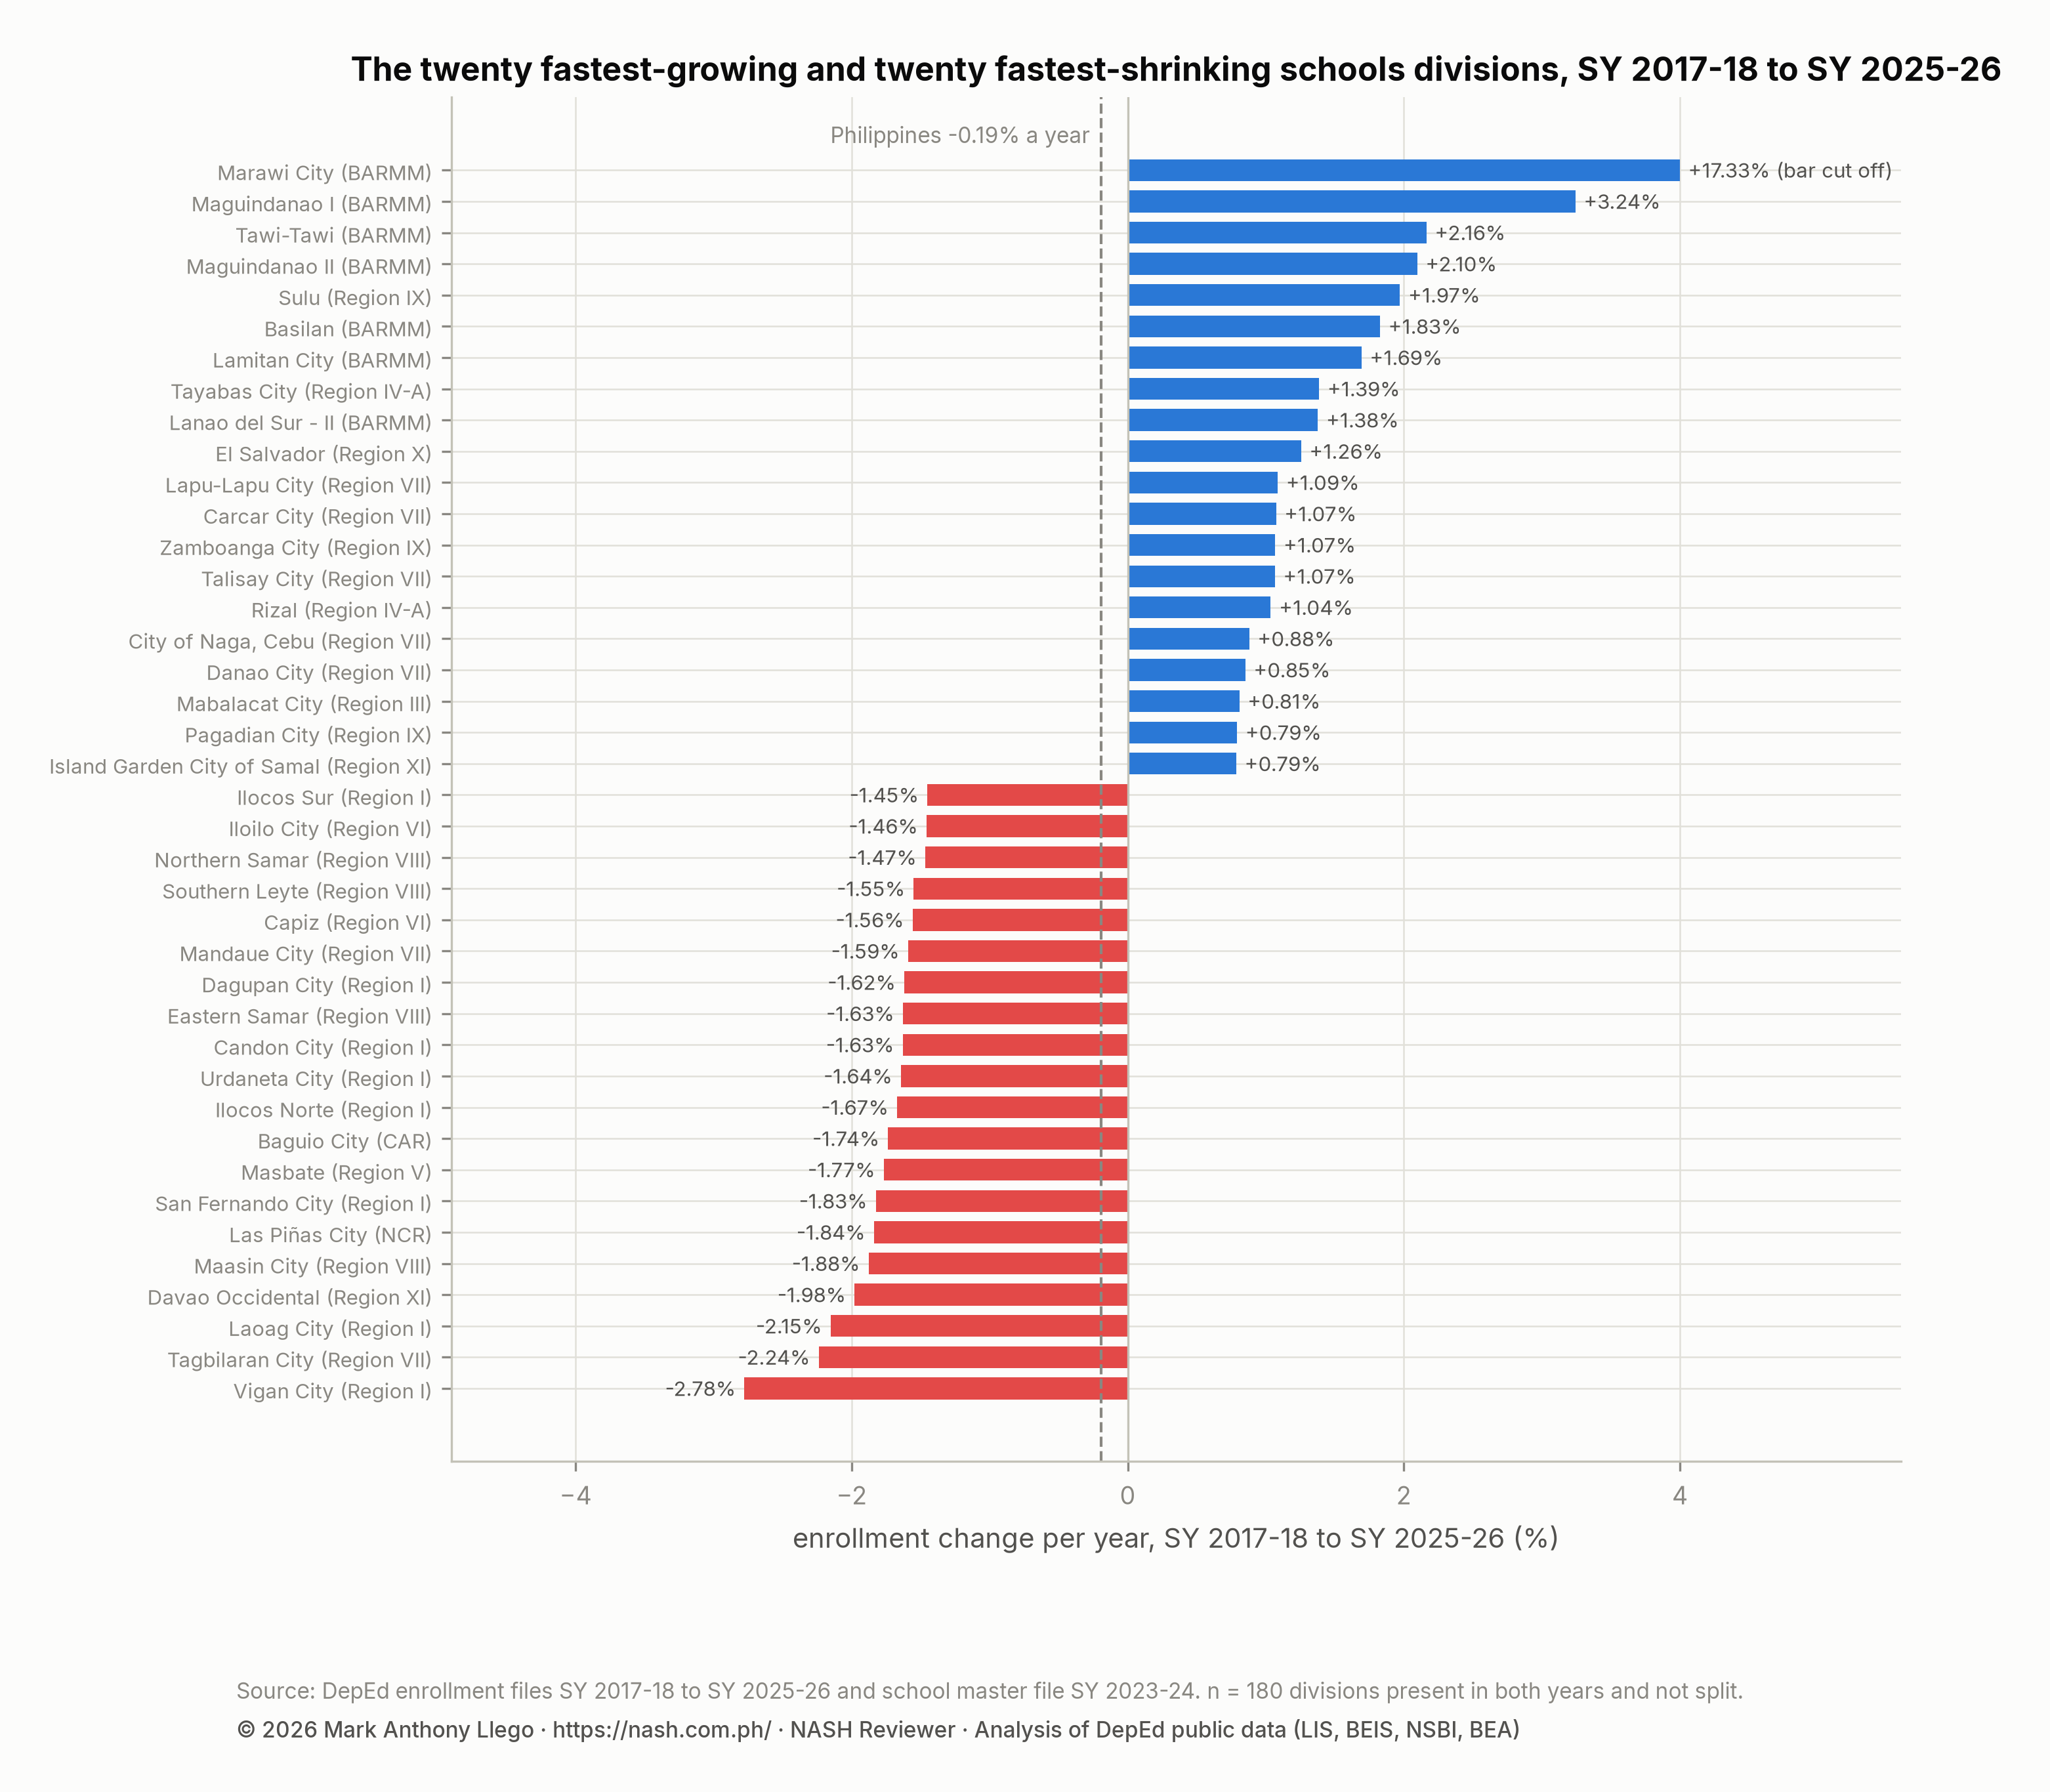
The growth list is almost entirely the Bangsamoro and the Sulu archipelago. Marawi City is a special case. The SY 2017-2018 file was collected months after the siege emptied the city, and the 15,662 learners it recorded had become 56,244 by SY 2025-2026. That is recovery, not population growth.
The rest of the list is growth. Maguindanao I added 43,076 learners (+3.24% a year), Tawi-Tawi 14,834 (+2.16%), Maguindanao II 21,054 (+2.10%), Sulu 23,087 (+1.97%), Basilan 8,010 (+1.83%), Lamitan City 3,516 (+1.69%), and Lanao del Sur - II 12,268 (+1.38%). Seven of BARMM’s nine comparable divisions grew. The only divisions outside Mindanao in the top ten are Tayabas City in Quezon (+1.39%) and El Salvador in Misamis Oriental (+1.26%).
The decline list is the Ilocos coast and the small cities of the Visayas. Vigan City lost 4,040 learners (−2.78% a year), Tagbilaran City 5,722 (−2.24%), Laoag City 4,777 (−2.15%), Maasin City 3,035 (−1.88%), San Fernando City in La Union 4,387 (−1.83%), Urdaneta City 5,127 (−1.64%), and Candon City 1,852 (−1.63%). Baguio City lost 13,026 learners (−1.74%) and Las Piñas 19,909 (−1.84%).
The regional pattern is clear. Not one of Region I’s fourteen comparable divisions grew, and none of Region V’s thirteen or Region VI’s eight did. Only one of Region VIII’s thirteen grew. In contrast, seven of BARMM’s nine grew, eight of Region VII’s twelve, six of Region XI’s nine, and four of Region XII’s seven.
Counts of learners added or lost give a slightly different ranking, because large divisions move more learners at small rates. Rizal added the most learners of any stable division, 45,065, at a modest 1.04% a year. Maguindanao I, Marawi City, Sulu, Zamboanga City (+21,313), Maguindanao II, Davao City (+19,780), and Cebu (+18,621) follow. The largest losses are Quezon City (−62,894), Manila (−36,227), Iloilo (−35,900), Masbate (−33,811), Pangasinan I (−26,684), Camarines Sur (−26,323), Bohol (−24,125), and Leyte (−23,970).
Enrollment change since the SY 2022-2023 peak
The nine-year rate hides a turn that happened in SY 2022-2023. Measured from that peak, the steepest falls are Davao Occidental (−16.1% in three years), Vigan City (−13.9%), Masbate (−12.7%), Alaminos City (−12.0%), Ilocos Norte (−11.8%), Navotas (−11.8%), Samar (−11.6%), and Capiz (−11.5%). These are not divisions that lost learners to private schools or to a neighboring city. They are divisions where the kindergarten intake has shrunk for three years in a row, which the enrollment projection to SY 2031-2032 ties to falling registered births.
The full table ranks all 219 divisions present in both end years, including the flagged ones:
| Rank | Division | Region | SY 2017-18 | SY 2022-23 | SY 2025-26 | Change | Per year, 2017-18 to 2025-26 | Since SY 2022-23 | Boundary change since SY 2017-18 |
|---|---|---|---|---|---|---|---|---|---|
| 1 | Marawi City | BARMM | 15,662 | 54,232 | 56,244 | +40,582 | +17.33% | +3.7% | |
| 2 | Davao Oriental | Region XI | 61,751 | 124,322 | 112,995 | +51,244 | +7.85% | -9.1% | received schools from Mati City in SY 2019-20 |
| 3 | Maguindanao I | BARMM | 148,073 | 166,471 | 191,149 | +43,076 | +3.24% | +14.8% | |
| 4 | Taguig City and Pateros | NCR | 196,496 | 207,368 | 243,370 | +46,874 | +2.71% | +17.4% | received ten Makati barangays in SY 2023-24 |
| 5 | Tawi-Tawi | BARMM | 79,403 | 93,932 | 94,237 | +14,834 | +2.16% | +0.3% | |
| 6 | Maguindanao II | BARMM | 116,554 | 135,884 | 137,608 | +21,054 | +2.10% | +1.3% | |
| 7 | Sulu | Region IX | 136,549 | 166,353 | 159,636 | +23,087 | +1.97% | -4.0% | |
| 8 | Basilan | BARMM | 51,374 | 60,957 | 59,384 | +8,010 | +1.83% | -2.6% | |
| 9 | Lamitan City | BARMM | 24,451 | 29,155 | 27,967 | +3,516 | +1.69% | -4.1% | |
| 10 | Tayabas City | Region IV-A | 21,218 | 24,639 | 23,689 | +2,471 | +1.39% | -3.9% | |
| 11 | Lanao del Sur - II | BARMM | 106,079 | 117,186 | 118,347 | +12,268 | +1.38% | +1.0% | |
| 12 | El Salvador | Region X | 12,457 | 14,934 | 13,765 | +1,308 | +1.26% | -7.8% | |
| 13 | Lapu-Lapu City | Region VII | 113,481 | 128,943 | 123,729 | +10,248 | +1.09% | -4.0% | |
| 14 | Carcar City | Region VII | 35,388 | 39,862 | 38,547 | +3,159 | +1.07% | -3.3% | |
| 15 | Zamboanga City | Region IX | 240,179 | 278,048 | 261,492 | +21,313 | +1.07% | -6.0% | |
| 16 | Talisay City | Region VII | 60,599 | 72,407 | 65,964 | +5,365 | +1.07% | -8.9% | |
| 17 | Rizal | Region IV-A | 524,303 | 583,340 | 569,368 | +45,065 | +1.04% | -2.4% | |
| 18 | City of Naga, Cebu | Region VII | 30,513 | 34,352 | 32,729 | +2,216 | +0.88% | -4.7% | |
| 19 | Tanauan City | Region IV-A | 54,181 | 57,162 | 58,077 | +3,896 | +0.87% | +1.6% | a new division was carved out of the province |
| 20 | Danao City | Region VII | 37,974 | 41,389 | 40,640 | +2,666 | +0.85% | -1.8% | |
| 21 | Bayawan City | NIR | 42,167 | 43,642 | 45,015 | +2,848 | +0.82% | +3.1% | a new division was carved out of the province |
| 22 | Mabalacat City | Region III | 60,003 | 65,317 | 63,995 | +3,992 | +0.81% | -2.0% | |
| 23 | Pagadian City | Region IX | 53,892 | 60,974 | 57,403 | +3,511 | +0.79% | -5.9% | |
| 24 | Island Garden City of Samal | Region XI | 28,208 | 32,059 | 30,032 | +1,824 | +0.79% | -6.3% | |
| 25 | Siargao | CARAGA | 33,659 | 35,475 | 35,827 | +2,168 | +0.78% | +1.0% | |
| 26 | City of San Jose Del Monte | Region III | 157,922 | 175,392 | 167,865 | +9,943 | +0.77% | -4.3% | a new division was carved out of the province |
| 27 | Malaybalay City | Region X | 53,425 | 60,704 | 56,753 | +3,328 | +0.76% | -6.5% | |
| 28 | Bataan | Region III | 166,883 | 184,953 | 177,140 | +10,257 | +0.75% | -4.2% | |
| 29 | Imus City | Region IV-A | 104,093 | 117,672 | 109,960 | +5,867 | +0.69% | -6.6% | a new division was carved out of the province |
| 30 | Lipa City | Region IV-A | 98,514 | 106,178 | 103,933 | +5,419 | +0.67% | -2.1% | a new division was carved out of the province |
| 31 | Calamba City | Region IV-A | 127,165 | 135,976 | 133,644 | +6,479 | +0.62% | -1.7% | a new division was carved out of the province |
| 32 | Puerto Princesa City | MIMAROPA | 73,151 | 80,459 | 76,742 | +3,591 | +0.60% | -4.6% | |
| 33 | Davao City | Region XI | 428,124 | 474,708 | 447,904 | +19,780 | +0.57% | -5.6% | |
| 34 | Bukidnon | Region X | 290,985 | 318,273 | 303,678 | +12,693 | +0.54% | -4.6% | |
| 35 | Valencia City | Region X | 57,102 | 65,219 | 59,553 | +2,451 | +0.53% | -8.7% | |
| 36 | Antipolo City | Region IV-A | 213,648 | 231,263 | 222,713 | +9,065 | +0.52% | -3.7% | |
| 37 | Cagayan de Oro City | Region X | 179,837 | 193,982 | 187,299 | +7,462 | +0.51% | -3.4% | |
| 38 | Panabo City | Region XI | 53,260 | 58,873 | 55,417 | +2,157 | +0.50% | -5.9% | |
| 39 | Tarlac City | Region III | 83,719 | 89,542 | 87,042 | +3,323 | +0.49% | -2.8% | |
| 40 | Sta. Rosa City | Region IV-A | 83,761 | 92,221 | 86,972 | +3,211 | +0.47% | -5.7% | a new division was carved out of the province |
| 41 | Ormoc City | Region VIII | 59,995 | 65,996 | 62,095 | +2,100 | +0.43% | -5.9% | |
| 42 | Pasig City | NCR | 181,831 | 197,833 | 187,800 | +5,969 | +0.40% | -5.1% | |
| 43 | Cebu | Region VII | 581,098 | 639,448 | 599,719 | +18,621 | +0.40% | -6.2% | |
| 44 | General Santos City | Region XII | 169,936 | 185,634 | 175,363 | +5,427 | +0.39% | -5.5% | |
| 45 | Isabela City | Region IX | 33,147 | 37,577 | 34,205 | +1,058 | +0.39% | -9.0% | |
| 46 | Cabadbaran City | CARAGA | 22,347 | 24,408 | 23,013 | +666 | +0.37% | -5.7% | |
| 47 | Lanao del Norte | Region X | 148,873 | 164,656 | 153,268 | +4,395 | +0.36% | -6.9% | |
| 48 | Sultan Kudarat | Region XII | 167,554 | 186,220 | 172,469 | +4,915 | +0.36% | -7.4% | |
| 49 | Bogo City | Region VII | 22,621 | 24,639 | 23,276 | +655 | +0.36% | -5.5% | |
| 50 | Toledo City | Region VII | 54,713 | 59,492 | 56,272 | +1,559 | +0.35% | -5.4% | |
| 51 | San Pablo City | Region IV-A | 71,219 | 74,801 | 73,227 | +2,008 | +0.35% | -2.1% | a new division was carved out of the province |
| 52 | Tandag City | CARAGA | 17,492 | 18,828 | 17,972 | +480 | +0.34% | -4.5% | |
| 53 | South Cotabato | Region XII | 204,862 | 225,956 | 210,300 | +5,438 | +0.33% | -6.9% | |
| 54 | Nueva Vizcaya | Region II | 113,421 | 126,088 | 116,174 | +2,753 | +0.30% | -7.9% | |
| 55 | Balanga City | Region III | 28,915 | 30,696 | 29,607 | +692 | +0.30% | -3.5% | |
| 56 | Palawan | MIMAROPA | 257,246 | 278,683 | 262,240 | +4,994 | +0.24% | -5.9% | |
| 57 | Digos City | Region XI | 49,667 | 54,486 | 50,576 | +909 | +0.23% | -7.2% | |
| 58 | Surigao del Sur | CARAGA | 125,826 | 136,383 | 128,094 | +2,268 | +0.22% | -6.1% | |
| 59 | Binan City | Region IV-A | 85,737 | 89,966 | 87,254 | +1,517 | +0.22% | -3.0% | a new division was carved out of the province |
| 60 | Kidapawan City | Region XII | 44,042 | 48,617 | 44,772 | +730 | +0.21% | -7.9% | |
| 61 | Tarlac | Region III | 268,826 | 288,108 | 272,208 | +3,382 | +0.16% | -5.5% | |
| 62 | Tabuk City | CAR | 33,824 | 36,698 | 34,216 | +392 | +0.14% | -6.8% | |
| 63 | Gingoog City | Region X | 37,553 | 40,909 | 37,840 | +287 | +0.10% | -7.5% | |
| 64 | Cauayan City | Region II | 37,931 | 40,462 | 38,189 | +258 | +0.08% | -5.6% | |
| 65 | Zambales | Region III | 156,917 | 167,747 | 157,841 | +924 | +0.07% | -5.9% | |
| 66 | Occidental Mindoro | MIMAROPA | 143,131 | 154,267 | 143,619 | +488 | +0.04% | -6.9% | |
| 67 | Davao del Norte | Region XI | 123,719 | 134,618 | 124,016 | +297 | +0.03% | -7.9% | |
| 68 | Davao del Sur | Region XI | 114,923 | 125,278 | 114,949 | +26 | +0.00% | -8.2% | |
| 69 | Guihulngan City | NIR | 36,122 | 38,072 | 36,121 | -1 | -0.00% | -5.1% | a new division was carved out of the province |
| 70 | Nueva Ecija | Region III | 354,957 | 385,969 | 354,168 | -789 | -0.03% | -8.2% | |
| 71 | Benguet | CAR | 96,414 | 103,139 | 96,181 | -233 | -0.03% | -6.7% | |
| 72 | Misamis Oriental | Region X | 202,471 | 217,193 | 201,909 | -562 | -0.03% | -7.0% | |
| 73 | Quirino | Region II | 47,980 | 52,682 | 47,845 | -135 | -0.04% | -9.2% | |
| 74 | Zamboanga del Norte | Region IX | 218,334 | 233,910 | 217,677 | -657 | -0.04% | -6.9% | |
| 75 | City of Ilagan | Region II | 36,844 | 39,781 | 36,710 | -134 | -0.05% | -7.7% | |
| 76 | Surigao del Norte | CARAGA | 64,459 | 70,492 | 64,223 | -236 | -0.05% | -8.9% | |
| 77 | Camarines Norte | Region V | 172,180 | 184,788 | 170,803 | -1,377 | -0.10% | -7.6% | |
| 78 | Silay City | NIR | 31,828 | 34,345 | 31,566 | -262 | -0.10% | -8.1% | a new division was carved out of the province |
| 79 | Misamis Occidental | Region X | 77,770 | 82,848 | 76,860 | -910 | -0.15% | -7.2% | |
| 80 | Pampanga | Region III | 386,279 | 401,897 | 380,844 | -5,435 | -0.18% | -5.2% | |
| 81 | Biliran | Region VIII | 49,403 | 52,801 | 48,707 | -696 | -0.18% | -7.8% | |
| 82 | Muntinlupa City | NCR | 111,882 | 113,088 | 110,239 | -1,643 | -0.18% | -2.5% | |
| 83 | Lanao del Sur - I | BARMM | 144,341 | 146,649 | 142,158 | -2,183 | -0.19% | -3.1% | |
| 84 | Bais City | NIR | 20,909 | 21,929 | 20,572 | -337 | -0.20% | -6.2% | a new division was carved out of the province |
| 85 | Ozamis City | Region X | 36,280 | 39,323 | 35,682 | -598 | -0.21% | -9.3% | |
| 86 | Guimaras | Region VI | 44,060 | 46,544 | 43,325 | -735 | -0.21% | -6.9% | |
| 87 | Pasay City | NCR | 80,212 | 83,491 | 78,844 | -1,368 | -0.21% | -5.6% | |
| 88 | Sarangani | Region XII | 151,760 | 160,753 | 149,075 | -2,685 | -0.22% | -7.3% | |
| 89 | Davao De Oro | Region XI | 195,936 | 209,709 | 192,044 | -3,892 | -0.25% | -8.4% | |
| 90 | Tangub City | Region X | 19,170 | 20,386 | 18,761 | -409 | -0.27% | -8.0% | |
| 91 | Dapitan City | Region IX | 22,263 | 23,638 | 21,752 | -511 | -0.29% | -8.0% | |
| 92 | San Fernando City | Region III | 80,594 | 83,275 | 78,723 | -1,871 | -0.29% | -5.5% | |
| 93 | San Jose City | Region III | 38,675 | 40,281 | 37,766 | -909 | -0.30% | -6.2% | |
| 94 | Bulacan | Region III | 568,834 | 622,486 | 554,223 | -14,611 | -0.32% | -11.0% | a new division was carved out of the province |
| 95 | Cabanatuan City | Region III | 75,338 | 79,184 | 73,375 | -1,963 | -0.33% | -7.3% | |
| 96 | Isabela | Region II | 286,806 | 305,374 | 279,233 | -7,573 | -0.33% | -8.6% | |
| 97 | Caloocan City | NCR | 341,959 | 350,129 | 332,797 | -9,162 | -0.34% | -5.0% | |
| 98 | Cavite | Region IV-A | 488,243 | 497,139 | 474,184 | -14,059 | -0.36% | -4.6% | a new division was carved out of the province |
| 99 | Naga City | Region V | 69,854 | 72,297 | 67,842 | -2,012 | -0.36% | -6.2% | |
| 100 | Tagum City | Region XI | 76,453 | 79,568 | 74,232 | -2,221 | -0.37% | -6.7% | |
| 101 | Escalante City | NIR | 26,267 | 27,727 | 25,487 | -780 | -0.38% | -8.1% | a new division was carved out of the province |
| 102 | Cadiz City | NIR | 42,026 | 44,691 | 40,736 | -1,290 | -0.39% | -8.8% | a new division was carved out of the province |
| 103 | Ifugao | CAR | 48,618 | 51,461 | 47,116 | -1,502 | -0.39% | -8.4% | |
| 104 | Quezon | Region IV-A | 482,450 | 508,018 | 467,431 | -15,019 | -0.39% | -8.0% | |
| 105 | Oriental Mindoro | MIMAROPA | 203,206 | 213,508 | 196,873 | -6,333 | -0.39% | -7.8% | |
| 106 | Valenzuela City | NCR | 164,133 | 164,639 | 159,010 | -5,123 | -0.40% | -3.4% | |
| 107 | Koronadal City | Region XII | 53,559 | 56,421 | 51,873 | -1,686 | -0.40% | -8.1% | |
| 108 | Meycauayan City | Region III | 45,336 | 46,028 | 43,851 | -1,485 | -0.42% | -4.7% | a new division was carved out of the province |
| 109 | Tanjay City | NIR | 29,481 | 30,235 | 28,507 | -974 | -0.42% | -5.7% | a new division was carved out of the province |
| 110 | Agusan del Norte | CARAGA | 80,008 | 85,297 | 77,271 | -2,737 | -0.43% | -9.4% | |
| 111 | San Carlos City | NIR | 34,884 | 35,750 | 33,639 | -1,245 | -0.45% | -5.9% | a new division was carved out of the province |
| 112 | Ligao City | Region V | 36,461 | 37,981 | 35,141 | -1,320 | -0.46% | -7.5% | |
| 113 | Zamboanga Sibugay | Region IX | 177,268 | 191,116 | 170,500 | -6,768 | -0.49% | -10.8% | |
| 114 | Dipolog City | Region IX | 39,257 | 39,776 | 37,747 | -1,510 | -0.49% | -5.1% | |
| 115 | Marikina City | NCR | 111,946 | 113,145 | 107,587 | -4,359 | -0.50% | -4.9% | |
| 116 | Gapan City | Region III | 31,609 | 32,751 | 30,366 | -1,243 | -0.50% | -7.3% | |
| 117 | Kabankalan City | NIR | 57,107 | 60,403 | 54,780 | -2,327 | -0.52% | -9.3% | a new division was carved out of the province |
| 118 | Malabon City | NCR | 95,938 | 102,185 | 91,998 | -3,940 | -0.52% | -10.0% | |
| 119 | Aurora | Region III | 62,822 | 64,222 | 60,134 | -2,688 | -0.55% | -6.4% | |
| 120 | Angeles City | Region III | 118,234 | 119,025 | 113,162 | -5,072 | -0.55% | -4.9% | |
| 121 | Agusan del Sur | CARAGA | 177,711 | 185,064 | 169,974 | -7,737 | -0.55% | -8.2% | |
| 122 | Bislig City | CARAGA | 27,757 | 28,842 | 26,505 | -1,252 | -0.58% | -8.1% | |
| 123 | Siquijor | NIR | 23,496 | 23,716 | 22,392 | -1,104 | -0.60% | -5.6% | |
| 124 | Butuan City | CARAGA | 101,271 | 108,139 | 96,512 | -4,759 | -0.60% | -10.8% | |
| 125 | Santiago City | Region II | 39,668 | 40,762 | 37,767 | -1,901 | -0.61% | -7.3% | |
| 126 | Cagayan | Region II | 259,190 | 273,276 | 246,705 | -12,485 | -0.62% | -9.7% | |
| 127 | Masbate City | Region V | 34,377 | 35,917 | 32,643 | -1,734 | -0.64% | -9.1% | |
| 128 | Cotabato City | BARMM | 72,581 | 72,271 | 68,892 | -3,689 | -0.65% | -4.7% | |
| 129 | Zamboanga del Sur | Region IX | 214,225 | 222,681 | 202,922 | -11,303 | -0.68% | -8.9% | |
| 130 | Bacolod City | NIR | 150,028 | 154,715 | 142,050 | -7,978 | -0.68% | -8.2% | a new division was carved out of the province |
| 131 | Camarines Sur | Region V | 491,725 | 511,294 | 465,402 | -26,323 | -0.69% | -9.0% | |
| 132 | Passi City | Region VI | 23,682 | 24,200 | 22,412 | -1,270 | -0.69% | -7.4% | |
| 133 | Antique | Region VI | 159,131 | 166,145 | 150,418 | -8,713 | -0.70% | -9.5% | |
| 134 | Bayugan City | CARAGA | 33,391 | 35,471 | 31,476 | -1,915 | -0.74% | -11.3% | |
| 135 | Pangasinan II, Binalonan | Region I | 270,491 | 283,141 | 254,759 | -15,732 | -0.75% | -10.0% | |
| 136 | Iligan City | Region X | 100,817 | 103,484 | 94,904 | -5,913 | -0.75% | -8.3% | |
| 137 | Mandaluyong City | NCR | 78,530 | 77,670 | 73,911 | -4,619 | -0.75% | -4.8% | |
| 138 | Tacurong City | Region XII | 31,520 | 31,179 | 29,615 | -1,905 | -0.78% | -5.0% | |
| 139 | Negros Oriental | NIR | 191,198 | 207,215 | 179,478 | -11,720 | -0.79% | -13.4% | a new division was carved out of the province |
| 140 | Leyte | Region VIII | 382,119 | 398,665 | 358,149 | -23,970 | -0.81% | -10.2% | |
| 141 | Kalinga | CAR | 26,164 | 27,071 | 24,473 | -1,691 | -0.83% | -9.6% | |
| 142 | Dinagat Island | CARAGA | 30,493 | 31,680 | 28,498 | -1,995 | -0.84% | -10.0% | |
| 143 | Dasmarinas City | Region IV-A | 175,391 | 176,919 | 163,839 | -11,552 | -0.85% | -7.4% | a new division was carved out of the province |
| 144 | Sorsogon City | Region V | 52,844 | 53,417 | 49,298 | -3,546 | -0.86% | -7.7% | |
| 145 | Cebu City | Region VII | 252,401 | 249,811 | 235,325 | -17,076 | -0.87% | -5.8% | |
| 146 | Bago City | NIR | 44,038 | 45,930 | 41,014 | -3,024 | -0.89% | -10.7% | a new division was carved out of the province |
| 147 | Tabaco City | Region V | 45,470 | 46,057 | 42,228 | -3,242 | -0.92% | -8.3% | |
| 148 | Dumaguete City | NIR | 38,475 | 37,352 | 35,661 | -2,814 | -0.94% | -4.5% | a new division was carved out of the province |
| 149 | Sagay City | NIR | 42,497 | 43,806 | 39,386 | -3,111 | -0.95% | -10.1% | a new division was carved out of the province |
| 150 | Bohol | Region VII | 327,454 | 335,615 | 303,329 | -24,125 | -0.95% | -9.6% | |
| 151 | Tuguegarao City | Region II | 45,321 | 44,056 | 41,977 | -3,344 | -0.95% | -4.7% | |
| 152 | Legaspi City | Region V | 59,146 | 58,343 | 54,781 | -4,365 | -0.95% | -6.1% | |
| 153 | Iloilo | Region VI | 480,402 | 497,775 | 444,502 | -35,900 | -0.97% | -10.7% | |
| 154 | Tacloban City | Region VIII | 69,415 | 71,466 | 64,206 | -5,209 | -0.97% | -10.2% | |
| 155 | Surigao City | CARAGA | 39,916 | 38,461 | 36,895 | -3,021 | -0.98% | -4.1% | |
| 156 | Pangasinan I, Lingayen | Region I | 348,388 | 355,604 | 321,704 | -26,684 | -0.99% | -9.5% | |
| 157 | Sorsogon | Region V | 188,267 | 190,790 | 173,813 | -14,454 | -0.99% | -8.9% | |
| 158 | Calbayog City | Region VIII | 53,163 | 53,767 | 49,022 | -4,141 | -1.01% | -8.8% | |
| 159 | Lucena City | Region IV-A | 72,944 | 71,799 | 67,166 | -5,778 | -1.03% | -6.5% | |
| 160 | La Carlota City | NIR | 18,987 | 19,343 | 17,477 | -1,510 | -1.03% | -9.6% | a new division was carved out of the province |
| 161 | Borongan City | Region VIII | 20,151 | 19,995 | 18,537 | -1,614 | -1.04% | -7.3% | |
| 162 | San Carlos City | Region I | 55,283 | 55,571 | 50,690 | -4,593 | -1.08% | -8.8% | |
| 163 | Apayao | CAR | 30,620 | 31,161 | 28,036 | -2,584 | -1.10% | -10.0% | |
| 164 | Alaminos City | Region I | 26,468 | 27,488 | 24,193 | -2,275 | -1.12% | -12.0% | |
| 165 | Catanduanes | Region V | 79,270 | 79,987 | 72,449 | -6,821 | -1.12% | -9.4% | |
| 166 | Roxas City | Region VI | 41,793 | 41,857 | 38,159 | -3,634 | -1.13% | -8.8% | |
| 167 | Batangas City | Region IV-A | 85,175 | 83,829 | 77,564 | -7,611 | -1.16% | -7.5% | a new division was carved out of the province |
| 168 | Olongapo City | Region III | 64,161 | 62,447 | 58,404 | -5,757 | -1.17% | -6.5% | |
| 169 | Abra | CAR | 61,653 | 61,171 | 56,049 | -5,604 | -1.18% | -8.4% | |
| 170 | Calapan City | MIMAROPA | 38,807 | 38,843 | 35,276 | -3,531 | -1.19% | -9.2% | |
| 171 | Albay | Region V | 244,525 | 243,990 | 222,254 | -22,271 | -1.19% | -8.9% | |
| 172 | North Cotabato | Region XII | 331,851 | 319,718 | 301,569 | -30,282 | -1.19% | -5.7% | 63 barangays became the Special Geographic Area Division in SY 2021-22 |
| 173 | Camiguin | Region X | 25,759 | 25,792 | 23,380 | -2,379 | -1.20% | -9.4% | |
| 174 | Manila | NCR | 389,141 | 389,853 | 352,914 | -36,227 | -1.21% | -9.5% | |
| 175 | Batanes | Region II | 4,465 | 4,307 | 4,048 | -417 | -1.22% | -6.0% | |
| 176 | Baybay City | Region VIII | 29,911 | 29,844 | 27,051 | -2,860 | -1.25% | -9.4% | |
| 177 | Navotas | NCR | 52,912 | 54,248 | 47,848 | -5,064 | -1.25% | -11.8% | |
| 178 | Bacoor City | Region IV-A | 129,202 | 126,505 | 116,827 | -12,375 | -1.25% | -7.7% | a new division was carved out of the province |
| 179 | Oroquieta City | Region X | 19,820 | 19,630 | 17,913 | -1,907 | -1.26% | -8.7% | |
| 180 | Aklan | Region VI | 156,136 | 155,759 | 140,862 | -15,274 | -1.28% | -9.6% | |
| 181 | City of San Juan | NCR | 25,089 | 21,813 | 22,633 | -2,456 | -1.28% | +3.8% | |
| 182 | Science City of Muñoz | Region III | 22,719 | 22,733 | 20,492 | -2,227 | -1.28% | -9.9% | |
| 183 | Romblon | MIMAROPA | 88,437 | 87,242 | 79,762 | -8,675 | -1.28% | -8.6% | |
| 184 | Quezon City | NCR | 638,857 | 618,066 | 575,963 | -62,894 | -1.29% | -6.8% | |
| 185 | Iriga City | Region V | 36,434 | 36,153 | 32,847 | -3,587 | -1.29% | -9.1% | |
| 186 | Catbalogan City | Region VIII | 31,963 | 31,707 | 28,713 | -3,250 | -1.33% | -9.4% | |
| 187 | Paranaque City | NCR | 141,541 | 137,655 | 126,689 | -14,852 | -1.38% | -8.0% | |
| 188 | Mt. Province | CAR | 39,554 | 39,104 | 35,355 | -4,199 | -1.39% | -9.6% | |
| 189 | Marinduque | MIMAROPA | 67,871 | 66,610 | 60,594 | -7,277 | -1.41% | -9.0% | |
| 190 | Samar (Western Samar) | Region VIII | 144,859 | 146,189 | 129,303 | -15,556 | -1.41% | -11.6% | |
| 191 | Batac City | Region I | 13,002 | 12,567 | 11,589 | -1,413 | -1.43% | -7.8% | |
| 192 | La Union | Region I | 156,527 | 155,388 | 139,290 | -17,237 | -1.45% | -10.4% | |
| 193 | Ilocos Sur | Region I | 128,019 | 126,523 | 113,889 | -14,130 | -1.45% | -10.0% | |
| 194 | Iloilo City | Region VI | 118,942 | 116,157 | 105,759 | -13,183 | -1.46% | -9.0% | |
| 195 | Northern Samar | Region VIII | 190,299 | 189,810 | 169,076 | -21,223 | -1.47% | -10.9% | |
| 196 | Southern Leyte | Region VIII | 88,506 | 87,121 | 78,103 | -10,403 | -1.55% | -10.4% | |
| 197 | Capiz | Region VI | 152,497 | 152,030 | 134,487 | -18,010 | -1.56% | -11.5% | |
| 198 | Mandaue City | Region VII | 95,620 | 89,863 | 84,103 | -11,517 | -1.59% | -6.4% | |
| 199 | Dagupan City | Region I | 54,846 | 53,685 | 48,133 | -6,713 | -1.62% | -10.3% | |
| 200 | Cavite City | Region IV-A | 23,602 | 23,255 | 20,704 | -2,898 | -1.62% | -11.0% | a new division was carved out of the province |
| 201 | Eastern Samar | Region VIII | 115,312 | 112,780 | 101,115 | -14,197 | -1.63% | -10.3% | |
| 202 | Candon City | Region I | 15,028 | 14,817 | 13,176 | -1,852 | -1.63% | -11.1% | |
| 203 | Urdaneta City | Region I | 41,306 | 40,088 | 36,179 | -5,127 | -1.64% | -9.8% | |
| 204 | Ilocos Norte | Region I | 95,050 | 94,185 | 83,065 | -11,985 | -1.67% | -11.8% | |
| 205 | Malolos City | Region III | 66,425 | 62,778 | 58,026 | -8,399 | -1.68% | -7.6% | a new division was carved out of the province |
| 206 | Baguio City | CAR | 99,637 | 95,264 | 86,611 | -13,026 | -1.74% | -9.1% | |
| 207 | Masbate | Region V | 254,312 | 252,630 | 220,501 | -33,811 | -1.77% | -12.7% | |
| 208 | San Fernando City | Region I | 32,019 | 30,411 | 27,632 | -4,387 | -1.83% | -9.1% | |
| 209 | Las Piñas City | NCR | 144,271 | 136,018 | 124,362 | -19,909 | -1.84% | -8.6% | |
| 210 | Maasin City | Region VIII | 21,572 | 20,864 | 18,537 | -3,035 | -1.88% | -11.2% | |
| 211 | Davao Occidental | Region XI | 85,768 | 87,144 | 73,090 | -12,678 | -1.98% | -16.1% | |
| 212 | Batangas | Region IV-A | 445,658 | 467,160 | 376,962 | -68,696 | -2.07% | -19.3% | a new division was carved out of the province |
| 213 | Laoag City | Region I | 29,898 | 28,167 | 25,121 | -4,777 | -2.15% | -10.8% | |
| 214 | Tagbilaran City | Region VII | 34,533 | 32,107 | 28,811 | -5,722 | -2.24% | -10.3% | |
| 215 | Vigan City | Region I | 20,023 | 18,560 | 15,983 | -4,040 | -2.78% | -13.9% | |
| 216 | Negros Occidental | NIR | 396,858 | 337,847 | 307,957 | -88,901 | -3.12% | -8.8% | a new division was carved out of the province |
| 217 | Laguna | Region IV-A | 402,732 | 268,283 | 249,353 | -153,379 | -5.82% | -7.1% | a new division was carved out of the province |
| 218 | Makati City | NCR | 113,335 | 96,828 | 50,429 | -62,906 | -9.63% | -47.9% | ten barangays moved to Taguig in SY 2023-24 |
| 219 | Mati City | Region XI | 95,052 | 45,128 | 42,165 | -52,887 | -9.66% | -6.6% | schools moved to Davao Oriental in SY 2019-20 |
Public school inputs by division: nine indicators, SY 2023-2024
The second ranking uses the SY 2023-2024 school master file. It therefore covers the 228 divisions that existed that year, and only their public schools with learners. The nine indicators are division aggregates, not averages of school ratios: a division’s learners-per-teacher figure is its total learners divided by its total teachers. The indicators are:
- learners per teacher
- learners per instructional room
- learners per functional toilet bowl (total bowls minus the non-functional ones each school reported)
- share of learners in schools with any water source, with any electricity, and with any internet connection
- academic computers per 100 learners (desktops, laptops and tablets for learners, not the administrative units)
- share of schools with no principal, head teacher or assistant principal position in the personnel file
- share of schools reporting at least one makeshift classroom
The spread between divisions is wider than any regional table suggests. Learners per teacher run from 9.6 in Batanes to 38.1 in General Trias City, with a median of 25.6. Learners per instructional room run from 12.1 in Batanes to 82.3 in General Trias, with a median of 34.5. Learners per functional toilet bowl run from 14.7 in Ilocos Norte to 136.2 in Sulu, with a median of 30.7.
The share of learners in schools with internet runs from 40% in Kidapawan City to 100% in several urban divisions. Academic computers per 100 learners run from 1.2 in Kabankalan City to 52.6 in Batangas City. The share of schools with no head position is zero in Vigan City, Makati City, Cavite City, Dagupan City, and Cabanatuan City. It is 74% in Basilan, 73% in the Special Geographic Area, 72% in Sulu, and 69% in Maguindanao II.
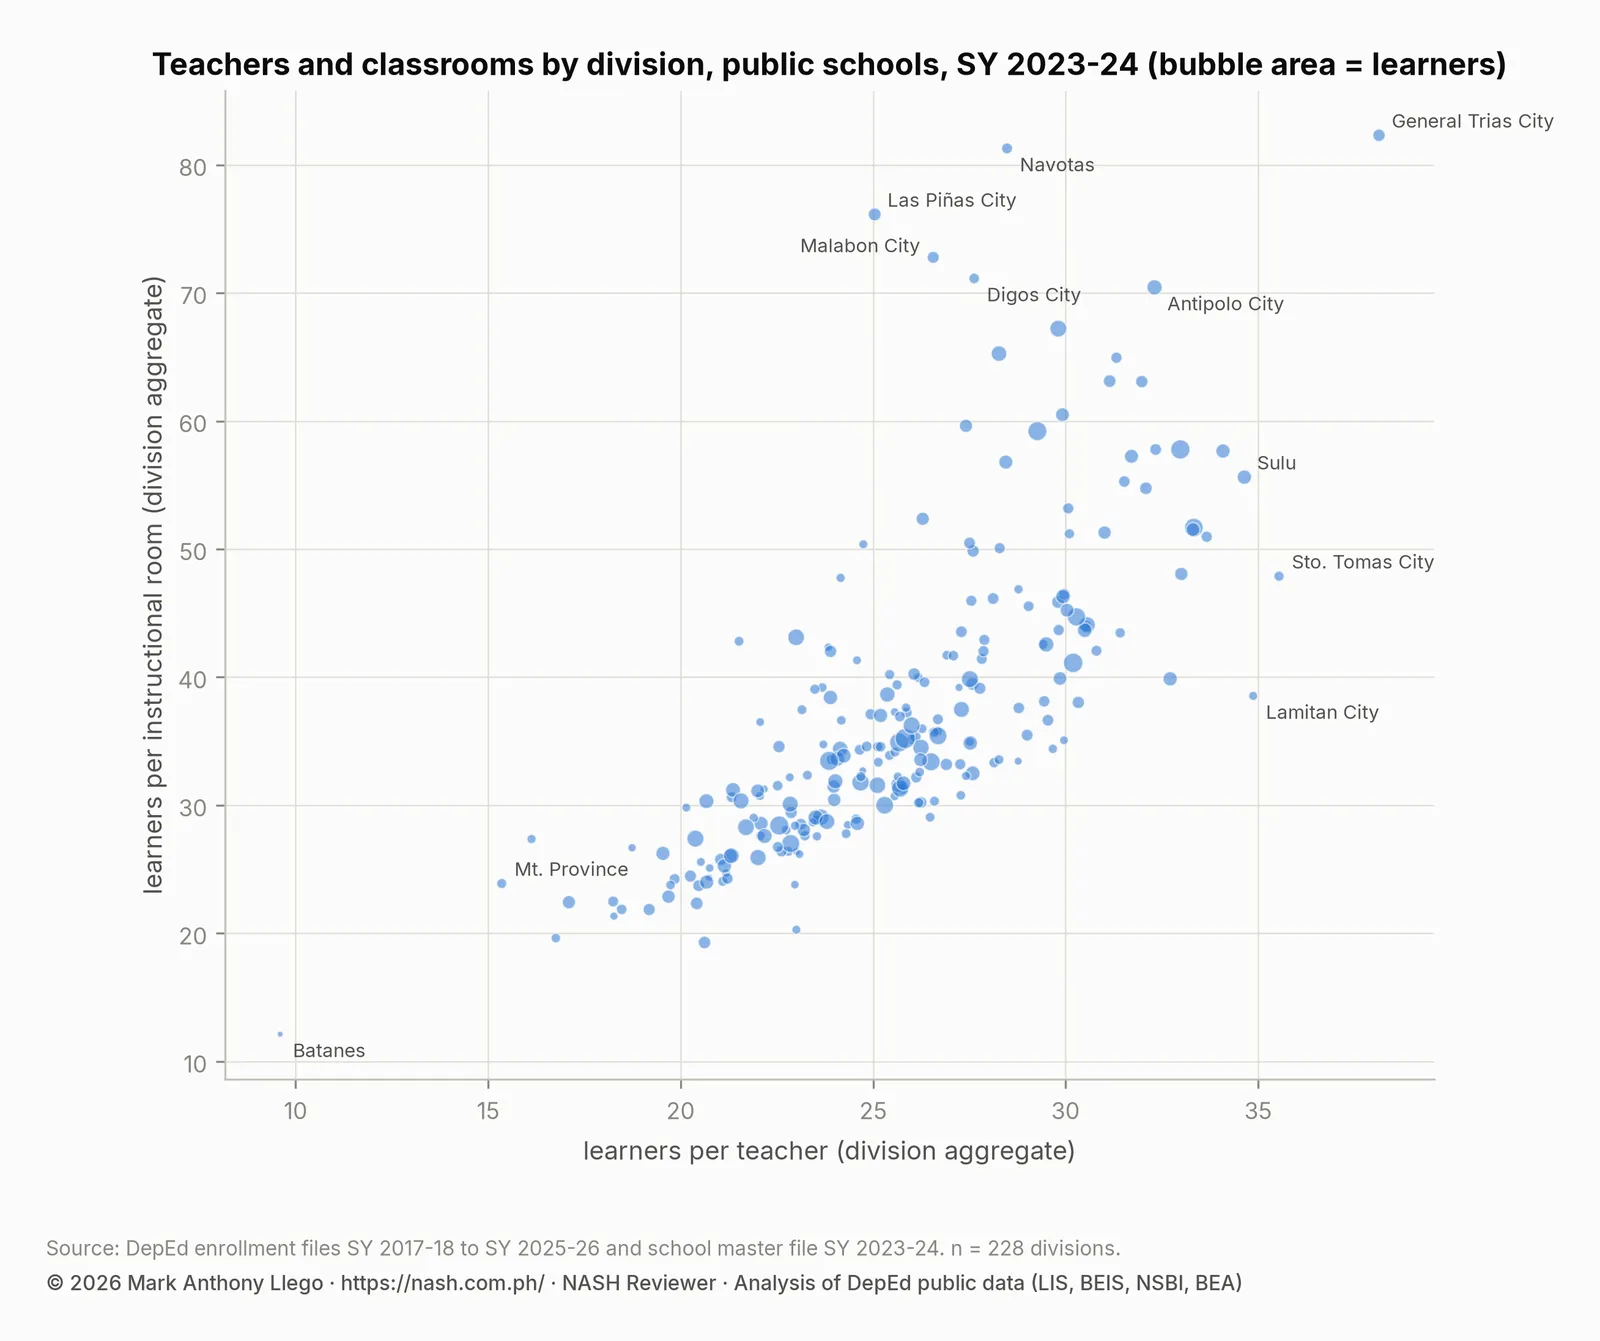
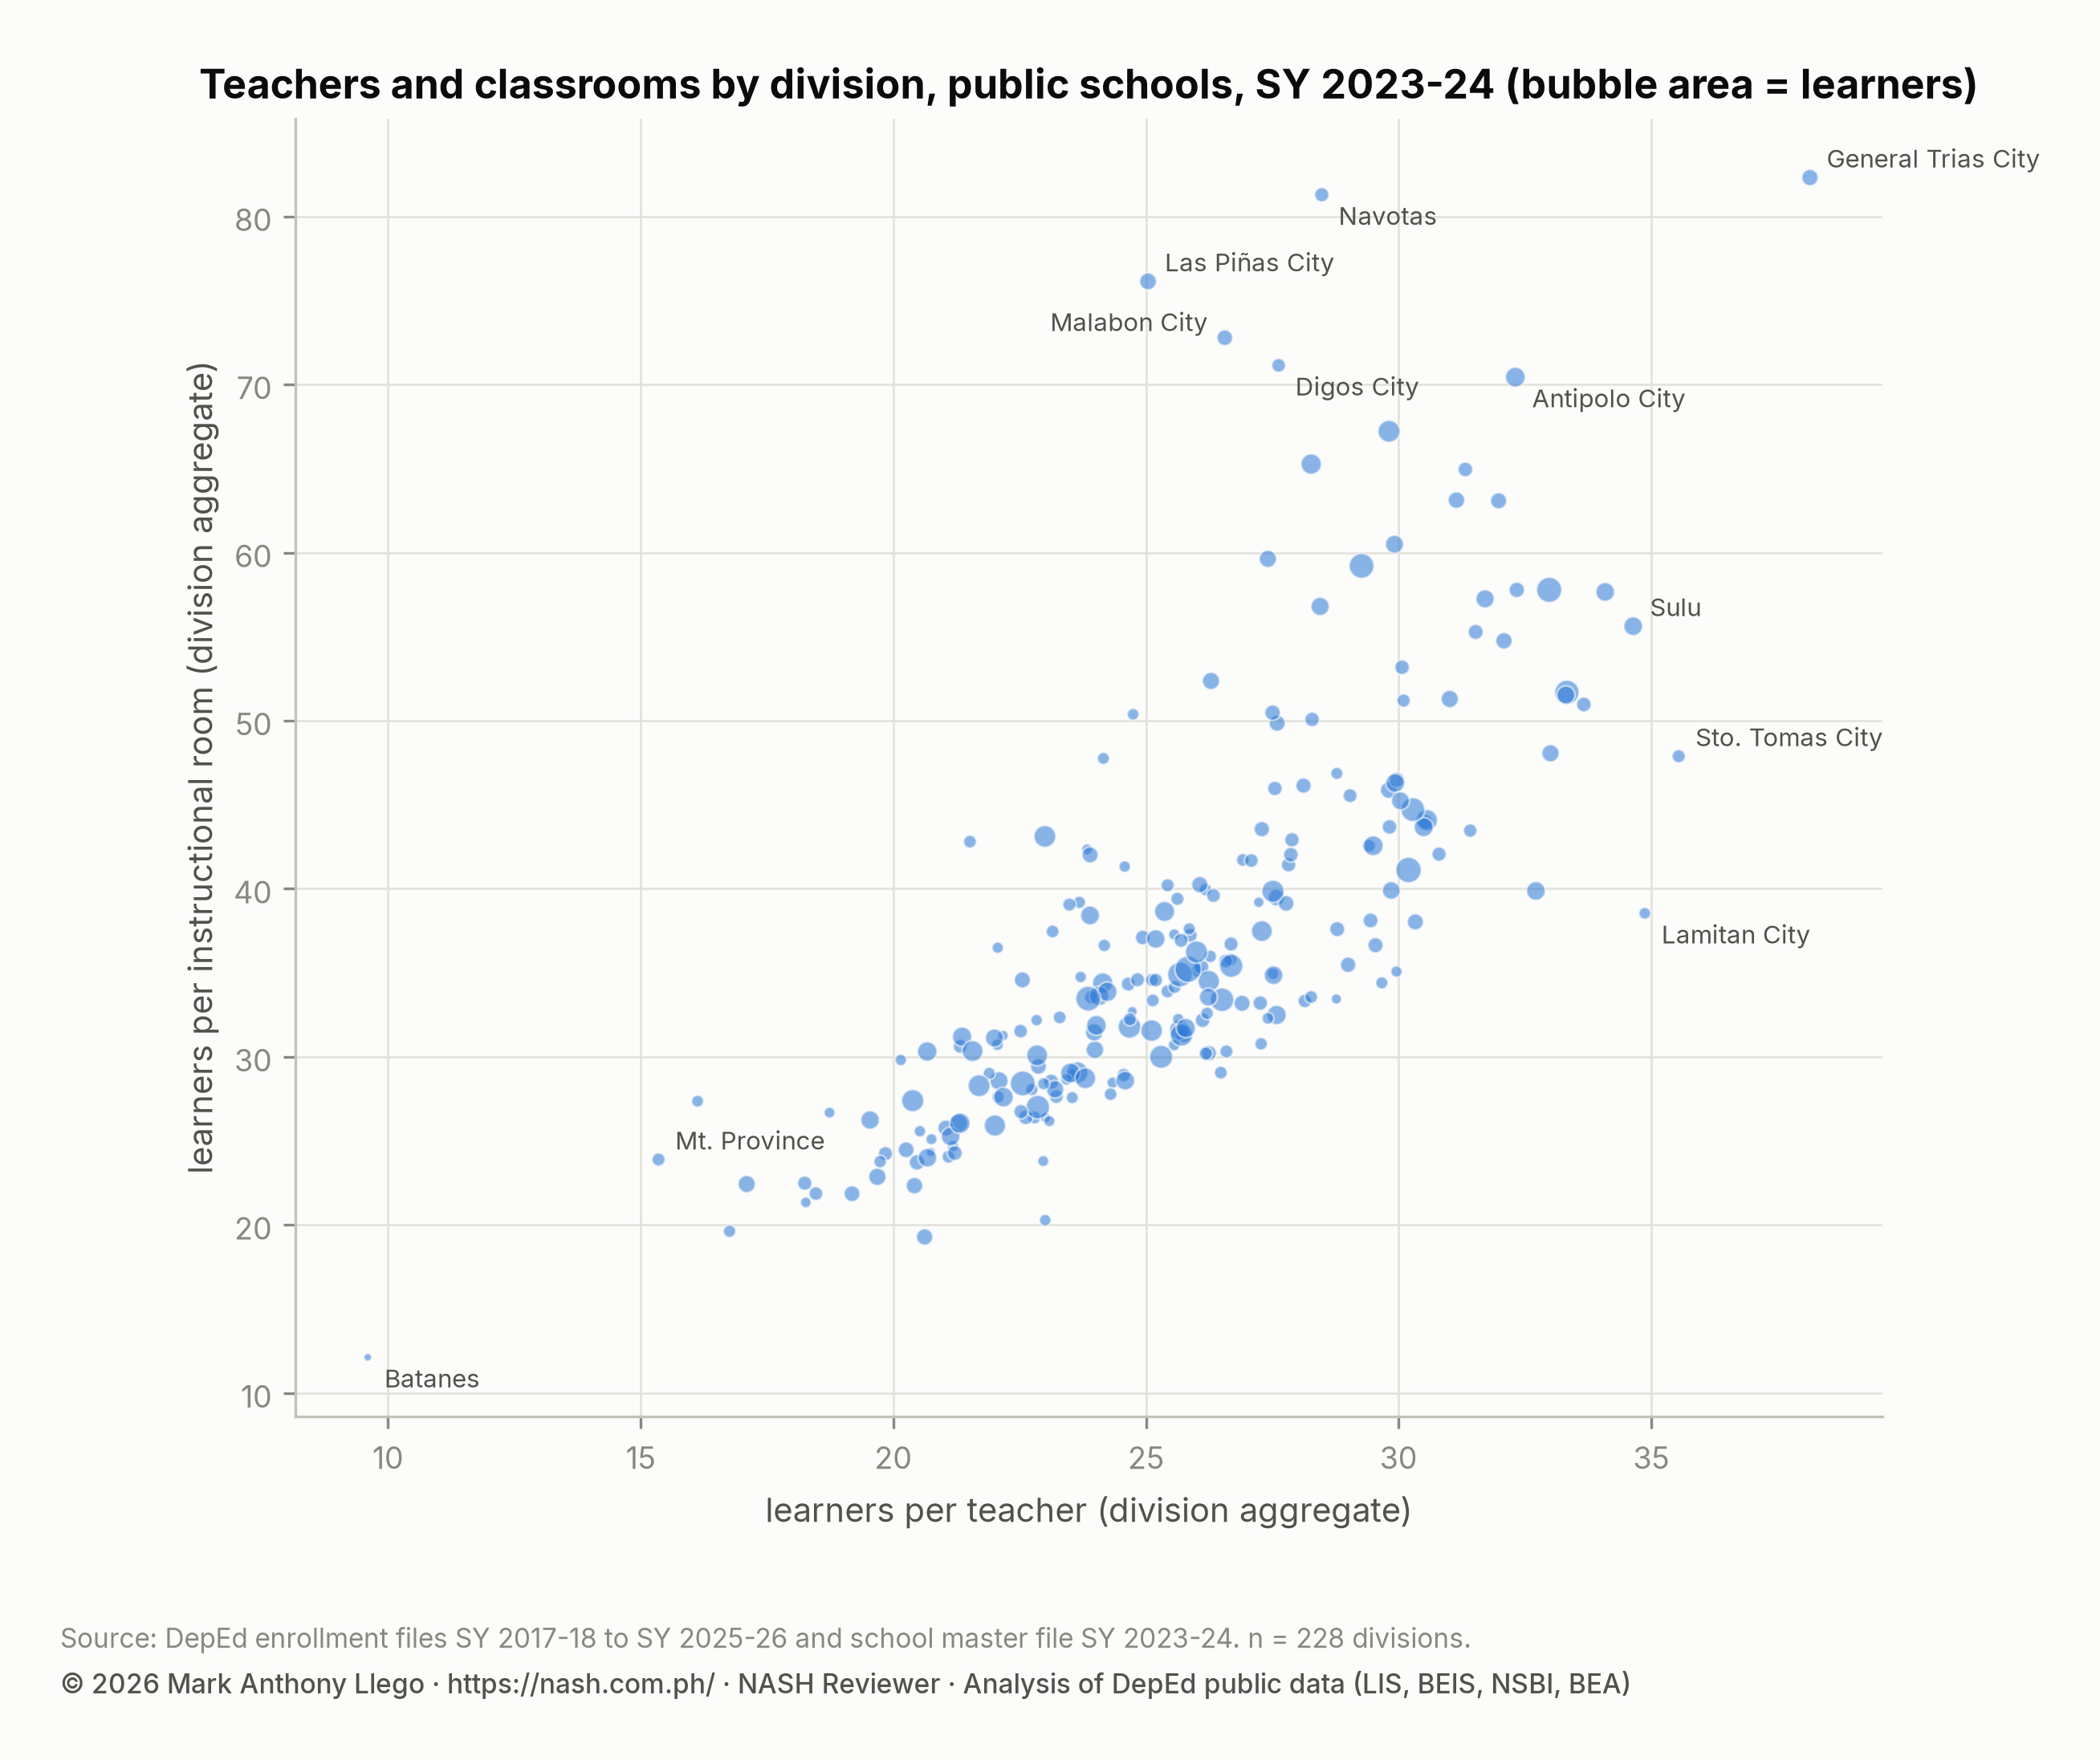
The scatter plot shows that teacher and classroom shortages occur together. General Trias City is highest on both. Navotas, Las Piñas, Malabon, and Digos City are shorter of rooms than of teachers; Sto. Tomas City, Lamitan City, and Sulu are shorter of teachers than of rooms.
The makeshift-classroom indicator selects a different set again: Digos City (87% of schools), Canlaon City (81%), San Carlos City in Pangasinan (71%), Himamaylan City (70%), and Guihulngan City (66%).
Composite rank of schools divisions on inputs
The composite rank is the average of a division’s nine ranks, with 1 the best on each. It is deliberately simple: equal weights, no adjustment for geography, and a toilet counts the same as a teacher. Its value is in the pattern at the two ends of the ranking.
The twelve best-placed divisions are Laoag City, Vigan City, Alaminos City, Ilocos Norte, the City of San Juan, Batac City, Tanauan City, Makati City, Urdaneta City, Cavite City, Gapan City, and the Science City of Muñoz. Eight of the best thirty are in Region I, five in NCR, and four in Region II. The twelve worst-placed are the Special Geographic Area, Basilan, Sulu, Maguindanao I, Lanao del Sur - II, Maguindanao II, Kidapawan City, Lanao del Sur - I, Pagadian City, the City of Naga in Cebu, Tawi-Tawi, and Guihulngan City. Eight of the worst thirty are in BARMM, and four each are in NIR, Region XII, and Region X.
Compared together, the two rankings do not match. The divisions with the best inputs are the ones losing learners fastest. Vigan, Laoag, Urdaneta, and Alaminos are in the top twelve on inputs and the bottom twenty on growth.
The divisions with the worst inputs are the ones gaining learners. Maguindanao I and II, Tawi-Tawi, Basilan, and Sulu are in the top ten on growth and the bottom twelve on inputs. Resources were built where enrollment used to be, and enrollment has moved. This supports the NatPlan’s position that classroom and teacher allocation should follow projected demand rather than historical shares.
| Composite rank (1 = best) | Division | Region | Public schools | Learners | Learners per teacher | Learners per instructional room | Learners per functional toilet bowl | Learners in schools with water | With electricity | With internet | Academic computers per 100 learners | Schools with no head position | Schools with makeshift rooms |
|---|---|---|---|---|---|---|---|---|---|---|---|---|---|
| 1 | Laoag City | Region I | 39 | 21,603 | 23 | 20.3 | 16.6 | 100.0% | 100.0% | 100.0% | 14.7 | 2.6% | 2.6% |
| 2 | Vigan City | Region I | 21 | 14,633 | 22.2 | 31.3 | 26.7 | 100.0% | 100.0% | 100.0% | 11.7 | 0.0% | 0.0% |
| 3 | Alaminos City | Region I | 46 | 23,029 | 25.6 | 30.7 | 22.4 | 100.0% | 100.0% | 100.0% | 13.2 | 10.9% | 2.2% |
| 4 | Ilocos Norte | Region I | 364 | 83,838 | 20.6 | 19.3 | 14.7 | 100.0% | 100.0% | 97.5% | 20.3 | 33.5% | 3.0% |
| 5 | City of San Juan | NCR | 13 | 11,870 | 24.7 | 32.7 | 18.2 | 100.0% | 100.0% | 100.0% | 43.5 | 23.1% | 0.0% |
| 6 | Batac City | Region I | 33 | 9,127 | 20.7 | 24.3 | 16.1 | 100.0% | 100.0% | 100.0% | 10.3 | 36.4% | 12.1% |
| 7 | Tanauan City | Region IV-A | 59 | 40,189 | 28.1 | 33.3 | 22.1 | 100.0% | 100.0% | 100.0% | 16.3 | 5.1% | 0.0% |
| 8 | Makati City | NCR | 23 | 31,931 | 21.5 | 42.8 | 30.5 | 100.0% | 100.0% | 100.0% | 20.4 | 0.0% | 4.3% |
| 9 | Urdaneta City | Region I | 64 | 32,363 | 23.6 | 28.9 | 25 | 100.0% | 100.0% | 100.0% | 9.1 | 4.7% | 23.4% |
| 10 | Cavite City | Region IV-A | 14 | 19,706 | 22.1 | 36.5 | 32.5 | 100.0% | 100.0% | 100.0% | 11.3 | 0.0% | 7.1% |
| 11 | Gapan City | Region III | 41 | 29,527 | 26.2 | 40 | 28.8 | 100.0% | 100.0% | 100.0% | 42.6 | 2.4% | 7.3% |
| 12 | Science City of Muñoz | Region III | 36 | 19,497 | 24.3 | 28.5 | 28.1 | 100.0% | 100.0% | 100.0% | 7.5 | 16.7% | 5.6% |
| 13 | City of Ilagan | Region II | 98 | 34,895 | 22.8 | 26.4 | 19.8 | 100.0% | 100.0% | 98.6% | 6.1 | 20.4% | 5.1% |
| 14 | Batanes | Region II | 27 | 4,050 | 9.6 | 12.1 | 17.2 | 100.0% | 100.0% | 75.5% | 28 | 18.5% | 29.6% |
| 15 | Batangas City | Region IV-A | 109 | 64,064 | 26.2 | 30.2 | 23.2 | 100.0% | 100.0% | 99.4% | 52.6 | 19.3% | 9.2% |
| 16 | Maasin City | Region VIII | 77 | 15,601 | 18.3 | 21.3 | 20 | 99.4% | 100.0% | 92.6% | 21.2 | 14.3% | 14.3% |
| 17 | Bislig City | CARAGA | 70 | 21,012 | 21.2 | 24.7 | 23 | 100.0% | 100.0% | 83.0% | 10.6 | 11.4% | 22.9% |
| 17 | Candon City | Region I | 34 | 12,563 | 23 | 26.4 | 22 | 100.0% | 100.0% | 98.3% | 8.9 | 11.8% | 32.4% |
| 19 | Mandaluyong City | NCR | 24 | 54,834 | 24.9 | 37.1 | 39.6 | 100.0% | 100.0% | 100.0% | 29.7 | 12.5% | 0.0% |
| 20 | Siargao | CARAGA | 145 | 32,884 | 21.1 | 24.1 | 22.6 | 100.0% | 100.0% | 94.7% | 8.9 | 25.5% | 23.4% |
| 21 | Iloilo City | Region VI | 66 | 79,280 | 26.9 | 33.2 | 25.6 | 100.0% | 100.0% | 100.0% | 4.8 | 3.0% | 6.1% |
| 22 | Dagupan City | Region I | 39 | 36,656 | 26 | 35.1 | 31.1 | 100.0% | 100.0% | 96.5% | 16.6 | 0.0% | 7.7% |
| 23 | Manila | NCR | 105 | 264,082 | 23 | 43.1 | 48.2 | 100.0% | 100.0% | 100.0% | 22.1 | 2.9% | 22.9% |
| 24 | Santiago City | Region II | 41 | 32,034 | 26.7 | 35.8 | 22.4 | 100.0% | 100.0% | 100.0% | 18.5 | 7.3% | 41.5% |
| 25 | Tuguegarao City | Region II | 36 | 34,610 | 25.1 | 34.6 | 29.7 | 100.0% | 100.0% | 100.0% | 6.2 | 13.9% | 2.8% |
| 26 | Ifugao | CAR | 266 | 42,532 | 18.5 | 21.9 | 21.5 | 100.0% | 100.0% | 93.2% | 9.4 | 36.5% | 35.3% |
| 27 | Malolos City | Region III | 57 | 44,508 | 26.3 | 39.6 | 35.1 | 100.0% | 100.0% | 98.3% | 15.8 | 7.0% | 1.8% |
| 28 | Pasay City | NCR | 29 | 65,514 | 28.1 | 46.1 | 39 | 100.0% | 100.0% | 100.0% | 11.5 | 3.4% | 6.9% |
| 29 | Ozamis City | Region X | 58 | 32,228 | 26.5 | 29.1 | 26.4 | 100.0% | 100.0% | 98.1% | 8.5 | 5.2% | 34.5% |
| 30 | Oroquieta City | Region X | 51 | 16,302 | 18.7 | 26.7 | 23.2 | 100.0% | 99.9% | 97.5% | 6.8 | 25.5% | 13.7% |
| 31 | Siquijor | NIR | 78 | 20,690 | 20.5 | 25.6 | 23.7 | 100.0% | 100.0% | 74.1% | 8.2 | 29.5% | 17.9% |
| 32 | San Pablo City | Region IV-A | 80 | 60,679 | 28.8 | 37.6 | 30.2 | 100.0% | 100.0% | 99.7% | 10.7 | 2.5% | 17.5% |
| 33 | Quirino | Region II | 187 | 47,705 | 19.8 | 24.2 | 21.8 | 100.0% | 99.4% | 97.8% | 9.5 | 31.0% | 25.1% |
| 34 | Iriga City | Region V | 50 | 25,589 | 23.5 | 27.6 | 27.2 | 100.0% | 100.0% | 99.6% | 4.8 | 6.0% | 40.0% |
| 35 | Pangasinan II, Binalonan | Region I | 559 | 244,455 | 23.6 | 29.1 | 23.2 | 99.7% | 99.9% | 99.5% | 12.2 | 9.1% | 17.9% |
| 36 | Tangub City | Region X | 65 | 17,731 | 23 | 23.8 | 18.8 | 99.5% | 100.0% | 97.1% | 7.8 | 30.8% | 16.9% |
| 37 | Bataan | Region III | 214 | 161,873 | 27.6 | 32.5 | 27.8 | 100.0% | 99.9% | 99.5% | 21.3 | 7.5% | 12.6% |
| 38 | Tacurong City | Region XII | 31 | 23,414 | 27.5 | 34.9 | 24.7 | 100.0% | 98.1% | 100.0% | 8.8 | 6.5% | 3.2% |
| 38 | Roxas City | Region VI | 50 | 32,424 | 25.1 | 33.4 | 31.9 | 100.0% | 100.0% | 100.0% | 5.9 | 0.0% | 42.0% |
| 40 | Surigao del Norte | CARAGA | 202 | 65,416 | 23.1 | 28.5 | 22.4 | 99.7% | 100.0% | 97.8% | 8.9 | 19.3% | 26.7% |
| 41 | Camiguin | Region X | 66 | 23,010 | 22.1 | 30.7 | 19.4 | 99.7% | 100.0% | 97.3% | 6.9 | 19.7% | 18.2% |
| 42 | Cauayan City | Region II | 80 | 34,504 | 25.4 | 33.9 | 21 | 99.8% | 100.0% | 100.0% | 7.1 | 26.2% | 13.8% |
| 43 | Baguio City | CAR | 68 | 63,437 | 26.1 | 35.3 | 31.2 | 100.0% | 100.0% | 100.0% | 7.2 | 10.3% | 29.4% |
| 44 | Malabon City | NCR | 42 | 70,597 | 26.6 | 72.8 | 52.2 | 100.0% | 100.0% | 100.0% | 22.5 | 4.8% | 19.0% |
| 44 | San Fernando City | Region III | 46 | 65,885 | 27.3 | 43.5 | 35.2 | 100.0% | 100.0% | 100.0% | 8 | 13.0% | 8.7% |
| 46 | Passi City | Region VI | 45 | 21,694 | 23.4 | 28.7 | 25.9 | 100.0% | 100.0% | 77.6% | 5.1 | 2.2% | 26.7% |
| 47 | Tacloban City | Region VIII | 60 | 55,672 | 25.8 | 31.3 | 30.7 | 100.0% | 100.0% | 89.9% | 6.3 | 1.7% | 20.0% |
| 48 | La Union | Region I | 386 | 135,650 | 22.1 | 28.6 | 22.3 | 99.7% | 99.7% | 93.8% | 9.3 | 12.2% | 10.1% |
| 49 | Victorias City | NIR | 26 | 23,412 | 27.4 | 32.3 | 27.3 | 100.0% | 100.0% | 92.9% | 10.4 | 23.1% | 7.7% |
| 50 | Nueva Ecija | Region III | 753 | 335,026 | 25.3 | 30 | 25.9 | 100.0% | 99.9% | 97.8% | 4.8 | 7.0% | 8.8% |
| 51 | Benguet | CAR | 428 | 87,491 | 20.4 | 22.3 | 22.6 | 99.6% | 100.0% | 88.5% | 12.7 | 42.1% | 25.5% |
| 52 | Batangas | Region IV-A | 737 | 363,448 | 26.5 | 33.4 | 24.6 | 99.4% | 100.0% | 96.7% | 10.5 | 10.2% | 7.2% |
| 53 | Ilocos Sur | Region I | 506 | 107,693 | 19.7 | 22.9 | 15.7 | 99.4% | 99.4% | 96.2% | 8.8 | 31.2% | 8.7% |
| 54 | Paranaque City | NCR | 43 | 103,566 | 27.4 | 59.6 | 73.4 | 100.0% | 100.0% | 100.0% | 26.1 | 14.0% | 2.3% |
| 55 | Angeles City | Region III | 53 | 91,235 | 29.8 | 45.9 | 44.1 | 100.0% | 100.0% | 99.7% | 8.4 | 1.9% | 0.0% |
| 56 | Bayugan City | CARAGA | 70 | 27,519 | 22.7 | 28.1 | 21.1 | 99.6% | 100.0% | 95.9% | 4.5 | 10.0% | 25.7% |
| 57 | Sta. Rosa City | Region IV-A | 28 | 66,619 | 32.3 | 57.8 | 52.9 | 100.0% | 100.0% | 100.0% | 21.1 | 0.0% | 14.3% |
| 58 | Sagay City | NIR | 66 | 39,468 | 24.6 | 28.9 | 27.1 | 100.0% | 100.0% | 97.8% | 7.8 | 25.8% | 37.9% |
| 59 | Aklan | Region VI | 379 | 128,626 | 21.3 | 26 | 21.8 | 98.9% | 100.0% | 92.5% | 7.4 | 30.3% | 16.6% |
| 60 | Navotas | NCR | 25 | 49,015 | 28.5 | 81.3 | 66.7 | 100.0% | 100.0% | 100.0% | 12.8 | 12.0% | 0.0% |
| 61 | Cabanatuan City | Region III | 65 | 58,772 | 29.4 | 38.1 | 34.7 | 100.0% | 100.0% | 99.6% | 6.6 | 0.0% | 18.5% |
| 62 | La Carlota City | NIR | 30 | 18,402 | 23.1 | 26.2 | 20.3 | 100.0% | 100.0% | 83.0% | 3.9 | 26.7% | 20.0% |
| 63 | Las Piñas City | NCR | 39 | 94,633 | 25 | 76.1 | 74.5 | 100.0% | 100.0% | 100.0% | 8.7 | 20.5% | 0.0% |
| 64 | Abra | CAR | 317 | 49,177 | 18.2 | 22.5 | 19.8 | 100.0% | 99.7% | 90.9% | 10.6 | 39.7% | 24.9% |
| 65 | Bacoor City | Region IV-A | 43 | 87,734 | 31.1 | 63.1 | 43.8 | 100.0% | 100.0% | 100.0% | 34.9 | 16.3% | 7.0% |
| 66 | Legaspi City | Region V | 56 | 44,637 | 25.9 | 37.2 | 44.1 | 100.0% | 100.0% | 96.8% | 6.1 | 7.1% | 3.6% |
| 67 | Mati City | Region XI | 72 | 39,561 | 23.9 | 33.6 | 24.7 | 97.2% | 100.0% | 98.1% | 10.4 | 2.8% | 40.3% |
| 68 | Mt. Province | CAR | 267 | 34,620 | 15.4 | 23.9 | 26.5 | 99.9% | 100.0% | 42.6% | 24.7 | 31.5% | 41.2% |
| 68 | Calapan City | MIMAROPA | 58 | 32,650 | 25.6 | 34.2 | 24.3 | 99.6% | 100.0% | 100.0% | 5.6 | 0.0% | 56.9% |
| 70 | Calamba City | Region IV-A | 72 | 105,061 | 33 | 48.1 | 42.6 | 100.0% | 100.0% | 100.0% | 11.8 | 4.2% | 27.8% |
| 71 | Dasmarinas City | Region IV-A | 44 | 124,135 | 29.9 | 60.5 | 65.2 | 100.0% | 100.0% | 100.0% | 14.8 | 2.3% | 27.3% |
| 72 | Ormoc City | Region VIII | 98 | 55,220 | 26.1 | 32.2 | 26.8 | 99.3% | 100.0% | 100.0% | 8.5 | 14.3% | 41.8% |
| 73 | Catanduanes | Region V | 268 | 74,636 | 20.3 | 24.5 | 23.2 | 99.1% | 100.0% | 84.5% | 6.8 | 24.3% | 26.9% |
| 74 | Zambales | Region III | 315 | 145,719 | 24.6 | 28.6 | 25.4 | 99.0% | 99.1% | 97.9% | 13.6 | 13.7% | 11.1% |
| 74 | Muntinlupa City | NCR | 27 | 86,503 | 32.1 | 54.7 | 44 | 100.0% | 100.0% | 100.0% | 11.5 | 18.5% | 7.4% |
| 76 | Tarlac | Region III | 505 | 248,917 | 26.2 | 34.5 | 29.7 | 100.0% | 99.8% | 98.1% | 6.9 | 12.9% | 11.7% |
| 77 | Bacolod City | NIR | 70 | 117,540 | 29.9 | 39.9 | 34.7 | 100.0% | 100.0% | 99.0% | 7 | 10.0% | 22.9% |
| 78 | Island Garden City of Samal | Region XI | 75 | 29,592 | 26.2 | 32.6 | 28.6 | 100.0% | 100.0% | 80.2% | 9.4 | 16.0% | 32.0% |
| 79 | Marinduque | MIMAROPA | 229 | 57,539 | 21.2 | 24.3 | 18.2 | 97.3% | 99.7% | 84.6% | 11.4 | 29.3% | 12.2% |
| 79 | El Salvador | Region X | 24 | 13,176 | 28.8 | 33.4 | 32.7 | 100.0% | 100.0% | 80.8% | 9.6 | 29.2% | 0.0% |
| 81 | Cagayan | Region II | 807 | 240,902 | 22 | 25.9 | 19.8 | 99.7% | 99.8% | 91.7% | 6.3 | 27.8% | 18.3% |
| 82 | San Jose City | Region III | 59 | 32,991 | 28.3 | 33.6 | 25.2 | 100.0% | 100.0% | 98.8% | 4.1 | 18.6% | 23.7% |
| 83 | Binan City | Region IV-A | 40 | 63,316 | 30 | 46.5 | 43.4 | 100.0% | 100.0% | 99.5% | 14.1 | 12.5% | 22.5% |
| 84 | Sorsogon City | Region V | 83 | 46,861 | 24.7 | 34.3 | 34 | 100.0% | 100.0% | 97.4% | 4.4 | 14.5% | 25.3% |
| 85 | Taguig City and Pateros | NCR | 62 | 200,291 | 28.3 | 65.3 | 49 | 100.0% | 100.0% | 100.0% | 6.8 | 12.9% | 11.3% |
| 86 | Balanga City | Region III | 22 | 25,871 | 29.7 | 34.4 | 36.5 | 100.0% | 98.3% | 100.0% | 6.1 | 9.1% | 4.5% |
| 87 | Meycauayan City | Region III | 31 | 36,451 | 30.1 | 51.2 | 42.4 | 100.0% | 98.0% | 100.0% | 22.2 | 6.5% | 6.5% |
| 88 | Romblon | MIMAROPA | 270 | 78,338 | 21 | 25.8 | 19.6 | 99.3% | 98.8% | 85.5% | 6.8 | 15.6% | 18.5% |
| 88 | Dinagat Island | CARAGA | 144 | 29,094 | 19.7 | 23.8 | 20.5 | 98.3% | 96.1% | 80.0% | 33.5 | 23.6% | 16.7% |
| 90 | Baybay City | Region VIII | 82 | 26,344 | 21.9 | 29 | 25.5 | 100.0% | 98.3% | 95.4% | 6.1 | 12.2% | 41.5% |
| 91 | Southern Leyte | Region VIII | 343 | 74,909 | 19.2 | 21.9 | 17.5 | 99.7% | 99.8% | 84.2% | 7.9 | 34.7% | 35.3% |
| 92 | Tagum City | Region XI | 39 | 63,753 | 29.5 | 36.6 | 39.3 | 100.0% | 100.0% | 100.0% | 5.3 | 5.1% | 43.6% |
| 93 | Valenzuela City | NCR | 70 | 131,253 | 28.4 | 56.8 | 51.7 | 99.2% | 100.0% | 100.0% | 8.5 | 5.7% | 2.9% |
| 94 | Isabela | Region II | 881 | 269,911 | 21.7 | 28.3 | 21.4 | 99.4% | 99.6% | 98.7% | 5.1 | 34.4% | 14.0% |
| 95 | Cabadbaran City | CARAGA | 35 | 19,273 | 25.6 | 37.3 | 33.5 | 100.0% | 100.0% | 95.6% | 7.6 | 11.4% | 54.3% |
| 96 | Aurora | Region III | 176 | 54,923 | 22.6 | 26.4 | 22.8 | 99.7% | 99.3% | 92.0% | 6.7 | 34.1% | 10.8% |
| 97 | San Carlos City | Region I | 76 | 46,314 | 24.8 | 34.6 | 32.3 | 99.3% | 100.0% | 100.0% | 4.8 | 0.0% | 71.1% |
| 98 | Tabuk City | CAR | 103 | 28,473 | 22.1 | 27.6 | 26.9 | 100.0% | 91.4% | 92.3% | 5.5 | 15.5% | 29.1% |
| 99 | San Fernando City | Region I | 33 | 20,816 | 23.7 | 34.8 | 28.6 | 99.3% | 90.7% | 100.0% | 7.8 | 15.2% | 12.1% |
| 100 | Pangasinan I, Lingayen | Region I | 661 | 312,422 | 24.7 | 31.8 | 28.7 | 98.1% | 98.7% | 96.9% | 8.5 | 8.2% | 9.5% |
| 101 | Cavite | Region IV-A | 333 | 410,143 | 33.3 | 51.7 | 43 | 100.0% | 100.0% | 99.3% | 5.6 | 7.5% | 9.6% |
| 102 | Silay City | NIR | 39 | 29,543 | 27.3 | 30.8 | 28.7 | 100.0% | 100.0% | 76.0% | 4.2 | 20.5% | 12.8% |
| 103 | Apayao | CAR | 201 | 28,204 | 16.8 | 19.6 | 16.4 | 98.9% | 99.6% | 71.4% | 15.3 | 41.3% | 38.3% |
| 104 | Escalante City | NIR | 41 | 25,882 | 25.9 | 37.6 | 32.7 | 100.0% | 100.0% | 87.6% | 6.5 | 24.4% | 19.5% |
| 105 | Panabo City | Region XI | 62 | 49,251 | 30.8 | 42.1 | 35.8 | 100.0% | 100.0% | 100.0% | 5.2 | 8.1% | 41.9% |
| 106 | Sto. Tomas City | Region IV-A | 31 | 35,722 | 35.5 | 47.9 | 42.8 | 100.0% | 100.0% | 100.0% | 6.3 | 25.8% | 9.7% |
| 107 | Samar (Western Samar) | Region VIII | 738 | 136,718 | 19.5 | 26.2 | 22.6 | 99.5% | 100.0% | 81.6% | 6.7 | 45.0% | 45.1% |
| 108 | Surigao City | CARAGA | 87 | 32,540 | 23.3 | 32.3 | 28.4 | 99.8% | 99.9% | 96.0% | 16.2 | 34.5% | 29.9% |
| 109 | Dumaguete City | NIR | 25 | 25,727 | 28.8 | 46.9 | 33 | 100.0% | 100.0% | 100.0% | 3.8 | 8.0% | 40.0% |
| 110 | Agusan del Norte | CARAGA | 207 | 74,995 | 22.9 | 29.4 | 26.1 | 99.5% | 99.9% | 91.9% | 6 | 22.2% | 19.8% |
| 111 | Bogo City | Region VII | 38 | 19,712 | 30 | 35.1 | 25.4 | 100.0% | 98.1% | 100.0% | 6.1 | 18.4% | 26.3% |
| 111 | Misamis Occidental | Region X | 337 | 68,613 | 20.5 | 23.7 | 22.3 | 97.3% | 99.1% | 95.5% | 6.2 | 27.3% | 25.5% |
| 113 | Tarlac City | Region III | 98 | 67,689 | 29 | 35.5 | 30.9 | 100.0% | 100.0% | 97.5% | 3.7 | 3.1% | 44.9% |
| 114 | Leyte | Region VIII | 1,275 | 361,536 | 22.9 | 27 | 24.5 | 99.8% | 99.9% | 95.0% | 5.8 | 35.1% | 29.3% |
| 115 | Catbalogan City | Region VIII | 58 | 27,944 | 23.7 | 39.2 | 38.2 | 100.0% | 100.0% | 82.3% | 7.1 | 24.1% | 27.6% |
| 115 | Masbate City | Region V | 44 | 29,610 | 26.3 | 36 | 34.1 | 100.0% | 100.0% | 88.2% | 7.2 | 11.4% | 52.3% |
| 117 | Tabaco City | Region V | 50 | 40,687 | 25.2 | 34.6 | 37.3 | 100.0% | 100.0% | 98.6% | 2.5 | 12.0% | 46.0% |
| 118 | Cabuyao City | Region IV-A | 29 | 60,750 | 31.5 | 55.3 | 56.2 | 99.2% | 100.0% | 100.0% | 7.9 | 10.3% | 3.4% |
| 118 | Cadiz City | NIR | 69 | 41,302 | 26.6 | 35.7 | 32.5 | 100.0% | 100.0% | 83.5% | 5.8 | 18.8% | 23.2% |
| 120 | Lipa City | Region IV-A | 85 | 78,528 | 30.3 | 38 | 23.9 | 95.0% | 97.7% | 97.7% | 36.4 | 3.5% | 4.7% |
| 121 | City of San Jose Del Monte | Region III | 58 | 130,809 | 31.7 | 57.2 | 57.9 | 100.0% | 99.9% | 99.8% | 6.4 | 3.4% | 3.4% |
| 121 | Pasig City | NCR | 44 | 147,118 | 29.9 | 46.3 | 54 | 99.0% | 99.0% | 100.0% | 31.7 | 4.5% | 2.3% |
| 123 | Laguna | Region IV-A | 344 | 220,429 | 27.3 | 37.5 | 30.2 | 99.2% | 99.8% | 98.9% | 8 | 11.3% | 11.6% |
| 124 | Antipolo City | Region IV-A | 67 | 182,005 | 32.3 | 70.4 | 63.7 | 100.0% | 100.0% | 96.9% | 7.3 | 9.0% | 10.4% |
| 125 | Tagbilaran City | Region VII | 25 | 21,114 | 24.6 | 41.3 | 34.5 | 99.9% | 100.0% | 99.9% | 5.7 | 8.0% | 56.0% |
| 126 | Guimaras | Region VI | 115 | 42,251 | 23.2 | 27.6 | 21.4 | 99.4% | 99.6% | 94.0% | 4.4 | 13.0% | 34.8% |
| 127 | Antique | Region VI | 537 | 143,331 | 21.1 | 25.3 | 22.1 | 99.7% | 99.6% | 94.1% | 5.3 | 46.2% | 30.4% |
| 128 | Biliran | Region VIII | 143 | 49,041 | 22.5 | 26.7 | 24.5 | 99.4% | 98.6% | 97.3% | 4.3 | 17.5% | 28.7% |
| 129 | Bais City | NIR | 57 | 20,632 | 20.1 | 29.8 | 39.9 | 97.1% | 100.0% | 98.8% | 5.8 | 21.1% | 42.1% |
| 130 | Bago City | NIR | 47 | 37,654 | 26.2 | 30.2 | 25.7 | 99.3% | 100.0% | 91.8% | 3.6 | 17.0% | 23.4% |
| 131 | Iloilo | Region VI | 1,172 | 452,809 | 22.6 | 28.4 | 21.9 | 99.6% | 99.8% | 90.5% | 4.4 | 29.6% | 27.6% |
| 132 | Naga City | Region V | 42 | 50,415 | 27.8 | 41.4 | 32.6 | 100.0% | 100.0% | 99.3% | 4 | 23.8% | 28.6% |
| 133 | Lucena City | Region IV-A | 54 | 55,079 | 29.8 | 43.7 | 41.6 | 99.7% | 100.0% | 100.0% | 6.3 | 5.6% | 51.9% |
| 134 | Danao City | Region VII | 61 | 35,973 | 25.6 | 39.4 | 43 | 100.0% | 100.0% | 96.9% | 6.2 | 19.7% | 55.7% |
| 135 | Dipolog City | Region IX | 49 | 33,959 | 26.6 | 30.3 | 29.4 | 99.1% | 97.1% | 98.5% | 5.6 | 8.2% | 16.3% |
| 136 | Davao De Oro | Region XI | 419 | 191,086 | 25.7 | 31.6 | 28.3 | 99.6% | 99.9% | 86.6% | 9.7 | 35.6% | 22.9% |
| 137 | Talisay City | Region VII | 44 | 54,750 | 31.3 | 64.9 | 51.7 | 100.0% | 100.0% | 100.0% | 4.4 | 13.6% | 31.8% |
| 138 | Marikina City | NCR | 33 | 78,016 | 27.6 | 49.9 | 48.8 | 99.4% | 99.4% | 99.4% | 12.2 | 12.1% | 3.0% |
| 139 | Koronadal City | Region XII | 55 | 45,128 | 29 | 45.5 | 30.4 | 99.8% | 99.8% | 99.7% | 8.9 | 5.5% | 45.5% |
| 140 | Surigao del Sur | CARAGA | 452 | 124,678 | 22 | 31.1 | 26.7 | 97.3% | 98.6% | 94.0% | 15.4 | 36.9% | 31.0% |
| 141 | Zamboanga del Sur | Region IX | 807 | 198,886 | 21.3 | 26.1 | 23.2 | 98.7% | 99.4% | 78.3% | 7.2 | 22.6% | 45.2% |
| 142 | Pampanga | Region III | 565 | 338,501 | 26.7 | 35.4 | 29.7 | 98.7% | 98.8% | 98.8% | 4.2 | 5.3% | 9.0% |
| 143 | Valencia City | Region X | 65 | 51,623 | 27.9 | 42.9 | 36.9 | 100.0% | 100.0% | 88.2% | 6.5 | 9.2% | 61.5% |
| 144 | Sipalay City | NIR | 48 | 21,152 | 25.6 | 32.2 | 37.2 | 100.0% | 100.0% | 82.7% | 6.8 | 56.2% | 43.8% |
| 144 | Dapitan City | Region IX | 61 | 21,465 | 22.8 | 32.2 | 30 | 97.4% | 99.7% | 86.8% | 6 | 9.8% | 27.9% |
| 146 | Kalinga | CAR | 194 | 24,270 | 16.1 | 27.4 | 27.1 | 99.8% | 97.0% | 75.1% | 8.9 | 33.5% | 51.0% |
| 147 | Capiz | Region VI | 471 | 140,299 | 20.7 | 24 | 20 | 98.1% | 98.3% | 68.0% | 5.1 | 34.4% | 20.6% |
| 148 | Eastern Samar | Region VIII | 466 | 101,888 | 17.1 | 22.4 | 21 | 97.8% | 99.2% | 64.9% | 6.1 | 44.0% | 30.0% |
| 149 | Nueva Vizcaya | Region II | 382 | 110,731 | 23.2 | 28.1 | 25.3 | 94.2% | 95.4% | 91.9% | 7.9 | 39.5% | 17.3% |
| 150 | Ligao City | Region V | 67 | 34,358 | 24.7 | 32.2 | 27.4 | 99.0% | 98.8% | 96.9% | 2.4 | 17.9% | 11.9% |
| 151 | Isabela City | Region IX | 64 | 32,737 | 23.2 | 37.5 | 40.9 | 99.8% | 100.0% | 81.1% | 8.8 | 23.4% | 65.6% |
| 151 | General Trias City | Region IV-A | 36 | 82,309 | 38.1 | 82.3 | 74.1 | 100.0% | 100.0% | 100.0% | 5.3 | 16.7% | 36.1% |
| 153 | San Carlos City | NIR | 65 | 31,056 | 24.3 | 27.8 | 32.2 | 99.2% | 97.4% | 87.3% | 10 | 13.8% | 40.0% |
| 153 | Lapu-Lapu City | Region VII | 71 | 104,886 | 31 | 51.3 | 42.1 | 99.8% | 100.0% | 99.6% | 13.8 | 15.5% | 56.3% |
| 155 | Tanjay City | NIR | 95 | 26,468 | 23 | 28.4 | 31.6 | 99.7% | 99.7% | 88.2% | 6.2 | 38.9% | 37.9% |
| 156 | Borongan City | Region VIII | 58 | 18,098 | 20.8 | 25.1 | 27 | 95.2% | 98.2% | 86.0% | 7 | 29.3% | 37.9% |
| 156 | Oriental Mindoro | MIMAROPA | 540 | 180,202 | 23.5 | 29 | 20.5 | 98.1% | 98.1% | 89.7% | 7.3 | 23.5% | 54.8% |
| 158 | Bayawan City | NIR | 100 | 41,998 | 22.5 | 31.5 | 30.3 | 99.8% | 98.8% | 94.6% | 5.7 | 57.0% | 33.0% |
| 159 | Olongapo City | Region III | 40 | 48,459 | 26.7 | 36.7 | 36.6 | 94.6% | 85.6% | 94.6% | 8.1 | 10.0% | 2.5% |
| 160 | Davao Oriental | Region XI | 331 | 112,555 | 24 | 30.4 | 24.5 | 98.5% | 97.6% | 85.5% | 5.3 | 23.0% | 23.6% |
| 161 | Digos City | Region XI | 47 | 42,184 | 27.6 | 71.1 | 73.1 | 100.0% | 99.8% | 99.8% | 10.1 | 14.9% | 87.2% |
| 162 | Albay | Region V | 555 | 223,687 | 22.8 | 30.1 | 32 | 99.6% | 99.5% | 77.5% | 5.5 | 25.9% | 30.8% |
| 163 | Misamis Oriental | Region X | 422 | 191,509 | 25.4 | 38.6 | 31.4 | 99.5% | 99.9% | 91.9% | 6.1 | 36.5% | 17.1% |
| 164 | Sorsogon | Region V | 531 | 176,244 | 22.2 | 27.6 | 31.3 | 99.6% | 99.4% | 85.8% | 4.2 | 30.7% | 35.6% |
| 165 | South Cotabato | Region XII | 382 | 197,740 | 24.1 | 34.4 | 26.1 | 98.8% | 99.3% | 87.8% | 7.8 | 34.6% | 33.0% |
| 166 | Butuan City | CARAGA | 139 | 91,708 | 27.6 | 39.5 | 28.6 | 99.3% | 99.4% | 97.4% | 5.7 | 8.6% | 36.7% |
| 167 | Bohol | Region VII | 1,115 | 284,471 | 20.4 | 27.4 | 25.2 | 98.6% | 98.7% | 90.3% | 3.8 | 43.9% | 34.2% |
| 168 | Negros Occidental | NIR | 576 | 302,300 | 25.7 | 31.3 | 25 | 99.7% | 99.2% | 90.0% | 4.2 | 29.3% | 32.1% |
| 169 | Quezon | Region IV-A | 958 | 443,054 | 25.7 | 34.9 | 30.5 | 99.4% | 99.9% | 86.7% | 7.6 | 19.9% | 48.1% |
| 170 | Davao del Norte | Region XI | 263 | 122,908 | 26.2 | 33.6 | 32.1 | 99.8% | 99.3% | 97.5% | 7.3 | 24.7% | 65.0% |
| 171 | Davao del Sur | Region XI | 261 | 108,560 | 24 | 31.5 | 44.7 | 98.2% | 99.5% | 96.6% | 7 | 19.9% | 40.2% |
| 172 | Mandaue City | Region VII | 48 | 67,334 | 27.5 | 50.5 | 47.2 | 90.5% | 91.1% | 100.0% | 25.1 | 16.7% | 22.9% |
| 173 | Calbayog City | Region VIII | 174 | 48,581 | 21.3 | 30.6 | 32.1 | 100.0% | 99.6% | 86.5% | 5 | 40.8% | 47.7% |
| 174 | Camarines Norte | Region V | 319 | 160,279 | 25.8 | 31.7 | 26 | 98.4% | 99.7% | 89.7% | 3.9 | 26.3% | 23.5% |
| 175 | Agusan del Sur | CARAGA | 517 | 164,907 | 21.4 | 31.2 | 30.8 | 99.0% | 98.9% | 85.1% | 7.8 | 37.0% | 50.3% |
| 176 | Malaybalay City | Region X | 85 | 54,593 | 27.9 | 42 | 45 | 99.4% | 100.0% | 93.0% | 5.9 | 11.8% | 55.3% |
| 177 | Carcar City | Region VII | 49 | 34,767 | 29.4 | 42.6 | 43.9 | 99.7% | 99.3% | 99.2% | 8.1 | 12.2% | 46.9% |
| 178 | Mabalacat City | Region III | 55 | 51,991 | 27.6 | 46 | 41.8 | 98.7% | 98.7% | 98.6% | 3.5 | 7.3% | 9.1% |
| 179 | Sultan Kudarat | Region XII | 403 | 162,322 | 24.1 | 33.6 | 22.5 | 99.3% | 98.9% | 87.7% | 5.3 | 42.7% | 41.2% |
| 180 | Tayabas City | Region IV-A | 35 | 22,469 | 24.7 | 50.4 | 101.2 | 100.0% | 99.1% | 99.7% | 2.3 | 11.4% | 62.9% |
| 180 | Zamboanga del Norte | Region IX | 759 | 220,095 | 23.8 | 28.7 | 27.4 | 97.3% | 97.6% | 63.1% | 5.2 | 21.7% | 27.3% |
| 182 | Toledo City | Region VII | 62 | 52,927 | 28.3 | 50.1 | 83 | 99.7% | 100.0% | 93.4% | 3 | 0.0% | 56.5% |
| 183 | Zamboanga Sibugay | Region IX | 507 | 167,561 | 24.2 | 33.9 | 32.2 | 97.2% | 99.7% | 79.9% | 7.3 | 22.7% | 44.8% |
| 184 | Tandag City | CARAGA | 31 | 16,470 | 23.8 | 42.3 | 34.8 | 99.4% | 99.7% | 99.0% | 4.1 | 22.6% | 51.6% |
| 185 | Cotabato City | BARMM | 44 | 53,762 | 30.5 | 44 | 96 | 100.0% | 89.1% | 93.1% | 6.5 | 22.7% | 13.6% |
| 186 | Cebu | Region VII | 1,135 | 566,292 | 25.8 | 35.2 | 35.6 | 99.4% | 99.8% | 90.0% | 4.1 | 31.6% | 25.3% |
| 187 | Puerto Princesa City | MIMAROPA | 101 | 71,019 | 27.8 | 39.1 | 37 | 99.8% | 99.5% | 89.6% | 6.6 | 26.7% | 31.7% |
| 188 | Masbate | Region V | 700 | 225,060 | 21.6 | 30.3 | 24.2 | 98.4% | 95.7% | 46.4% | 3.7 | 28.6% | 39.0% |
| 189 | Quezon City | NCR | 159 | 441,283 | 29.3 | 59.2 | 54.7 | 90.7% | 90.1% | 93.2% | 41.1 | 5.7% | 23.3% |
| 190 | Occidental Mindoro | MIMAROPA | 363 | 139,721 | 25.2 | 37 | 27.6 | 97.4% | 98.9% | 85.8% | 4.3 | 14.9% | 36.1% |
| 191 | Kabankalan City | NIR | 91 | 51,990 | 27.3 | 33.2 | 27.9 | 100.0% | 99.7% | 76.0% | 1.2 | 41.8% | 52.7% |
| 192 | Zamboanga City | Region IX | 217 | 241,967 | 30.6 | 44.1 | 79.3 | 99.8% | 99.7% | 92.2% | 5.6 | 10.1% | 28.1% |
| 193 | Bulacan | Region III | 540 | 489,966 | 30.2 | 41.1 | 36.6 | 98.0% | 98.2% | 98.4% | 3.3 | 12.2% | 11.7% |
| 194 | Lamitan City | BARMM | 55 | 22,737 | 34.9 | 38.5 | 39.7 | 100.0% | 100.0% | 53.4% | 4.1 | 63.6% | 34.5% |
| 195 | Palawan | MIMAROPA | 821 | 257,926 | 25.1 | 31.6 | 30.9 | 91.9% | 91.1% | 58.2% | 12.3 | 43.1% | 29.7% |
| 196 | Imus City | Region IV-A | 35 | 80,364 | 32 | 63.1 | 58.2 | 98.5% | 97.6% | 100.0% | 3.2 | 11.4% | 11.4% |
| 197 | Camarines Sur | Region V | 1,097 | 449,266 | 23.9 | 33.5 | 27.6 | 98.1% | 98.8% | 80.0% | 4 | 37.7% | 35.5% |
| 198 | Iligan City | Region X | 112 | 82,417 | 26.1 | 40.2 | 40.5 | 99.0% | 98.2% | 89.7% | 2.8 | 17.0% | 23.2% |
| 199 | Negros Oriental | NIR | 515 | 180,143 | 24 | 31.9 | 36.8 | 96.8% | 98.2% | 83.0% | 6.7 | 43.3% | 39.6% |
| 199 | General Santos City | Region XII | 105 | 157,636 | 30.5 | 43.7 | 36.5 | 99.4% | 99.4% | 98.9% | 4.2 | 18.1% | 47.6% |
| 201 | Northern Samar | Region VIII | 607 | 170,264 | 20.7 | 30.3 | 33.6 | 96.2% | 97.1% | 69.5% | 3.4 | 36.1% | 34.1% |
| 202 | Cebu City | Region VII | 107 | 182,742 | 29.5 | 42.6 | 62.8 | 97.8% | 98.1% | 98.4% | 4.7 | 10.3% | 28.0% |
| 203 | San Pedro City | Region IV-A | 28 | 53,973 | 30.1 | 53.2 | 56.3 | 99.1% | 87.7% | 99.1% | 6 | 7.1% | 39.3% |
| 204 | Sarangani | Region XII | 326 | 147,895 | 23.9 | 38.4 | 40.2 | 99.4% | 98.5% | 83.2% | 7.5 | 44.8% | 51.2% |
| 205 | Gingoog City | Region X | 97 | 35,580 | 23.5 | 39.1 | 29.2 | 96.2% | 81.5% | 68.7% | 4.8 | 12.4% | 43.3% |
| 206 | Davao City | Region XI | 435 | 381,042 | 30.3 | 44.7 | 41.5 | 99.6% | 99.5% | 87.0% | 5.4 | 27.6% | 25.3% |
| 206 | Cagayan de Oro City | Region X | 115 | 142,584 | 32.7 | 39.9 | 40.6 | 98.6% | 98.7% | 95.6% | 4.3 | 21.7% | 22.6% |
| 208 | Bukidnon | Region X | 651 | 286,937 | 27.5 | 39.8 | 23.2 | 99.2% | 98.6% | 73.7% | 5.6 | 31.6% | 48.2% |
| 209 | Rizal | Region IV-A | 303 | 468,426 | 33 | 57.8 | 65.3 | 93.4% | 95.1% | 94.4% | 4.7 | 8.3% | 5.6% |
| 210 | Lanao del Norte | Region X | 383 | 142,909 | 27.5 | 34.9 | 30.7 | 98.0% | 98.1% | 90.9% | 5.2 | 35.0% | 46.2% |
| 211 | Davao Occidental | Region XI | 214 | 78,286 | 22.6 | 34.6 | 42.6 | 98.3% | 98.4% | 53.1% | 5.2 | 33.6% | 54.7% |
| 212 | North Cotabato | Region XII | 777 | 285,500 | 26 | 36.2 | 30.7 | 97.9% | 98.1% | 84.2% | 4.9 | 43.4% | 39.8% |
| 213 | Caloocan City | NCR | 89 | 271,479 | 29.8 | 67.2 | 84.6 | 92.8% | 92.8% | 93.1% | 4.2 | 10.1% | 10.1% |
| 214 | Canlaon City | NIR | 36 | 14,542 | 27.2 | 39.2 | 39.7 | 98.5% | 97.5% | 94.8% | 6.6 | 52.8% | 80.6% |
| 215 | Himamaylan City | NIR | 54 | 29,010 | 24.2 | 36.6 | 30.6 | 98.4% | 96.0% | 78.3% | 5.1 | 44.4% | 70.4% |
| 216 | Marawi City | BARMM | 51 | 24,641 | 24.2 | 47.8 | 80.5 | 96.5% | 84.2% | 84.2% | 4 | 29.4% | 21.6% |
| 217 | Guihulngan City | NIR | 103 | 35,422 | 25.4 | 40.2 | 56.7 | 95.1% | 96.7% | 53.5% | 10.2 | 43.7% | 66.0% |
| 218 | Tawi-Tawi | BARMM | 263 | 78,063 | 23.9 | 42 | 92.9 | 94.7% | 92.3% | 84.3% | 2.1 | 55.9% | 25.9% |
| 219 | City of Naga, Cebu | Region VII | 55 | 31,494 | 26.9 | 41.7 | 50.6 | 91.6% | 88.5% | 91.2% | 1.9 | 41.8% | 27.3% |
| 220 | Pagadian City | Region IX | 82 | 45,198 | 25.7 | 36.9 | 38.6 | 63.2% | 64.5% | 62.9% | 3.4 | 41.5% | 45.1% |
| 221 | Lanao del Sur - I | BARMM | 415 | 123,753 | 30 | 45.2 | 52.8 | 96.4% | 93.7% | 77.4% | 5.2 | 62.9% | 35.7% |
| 222 | Kidapawan City | Region XII | 76 | 42,470 | 27.1 | 41.7 | 38.4 | 39.6% | 39.6% | 39.6% | 2.3 | 68.4% | 36.8% |
| 223 | Maguindanao II | BARMM | 313 | 125,417 | 33.3 | 51.5 | 54 | 99.2% | 98.5% | 82.2% | 2.3 | 68.7% | 45.4% |
| 224 | Lanao del Sur - II | BARMM | 392 | 103,731 | 26.3 | 52.4 | 122.2 | 90.6% | 98.5% | 68.2% | 3 | 60.5% | 55.9% |
| 225 | Maguindanao I | BARMM | 334 | 142,355 | 34.1 | 57.7 | 59 | 97.5% | 96.9% | 91.5% | 2.6 | 68.3% | 54.2% |
| 226 | Sulu | Region IX | 447 | 144,392 | 34.6 | 55.6 | 136.2 | 84.0% | 84.4% | 69.9% | 2 | 72.0% | 29.8% |
| 227 | Basilan | BARMM | 177 | 55,448 | 33.7 | 51 | 102.9 | 86.3% | 84.8% | 66.0% | 2.2 | 74.0% | 32.8% |
| 228 | Special Geographic Area Division | BARMM | 111 | 39,115 | 31.4 | 43.5 | 60.9 | 94.5% | 85.7% | 64.7% | 1.4 | 73.0% | 56.8% |
How to read the tables
- A division aggregate hides the spread inside it. A division with 30 learners per room can contain schools at 70 and schools at 15; the SY 2023-2024 school facilities report shows the school-level distribution.
- The head-position indicator counts plantilla positions in the SY 2023-2024 personnel file. A school with no position may still have a teacher-in-charge; see the report on who leads public schools.
- Toilet bowls are those the school reported as functional. A bowl with no water is still counted if the school did not flag it.
- The growth ranking excludes the 39 divisions affected by boundary changes, and Marawi’s rate reflects recovery from the siege year.
- The 231 divisions include the 12 created since SY 2017-2018 and exclude the overseas schools group.
What the division rankings mean for aspiring school heads
The NASH asks whether a candidate can read context before leading. These tables support two exercises. First, an aspiring school head can locate their own division on both lists and ask what the combination implies.
A shrinking division with good inputs will be consolidating small schools and reassigning teachers. A growing division with poor inputs will be running double shifts and seeking classroom funding.
Second, Domain 1 of the Philippine Professional Standards for School Heads (PPSSH) asks school heads to use “research and data” in school planning (Strand 1.3). The division’s position relative to its neighbors is the first comparison a School Improvement Plan should make. The NatPlan guide for aspiring school heads covers the policy side, and the PPSSH Domain 2 guide covers resources.
Frequently asked questions
How many schools divisions does DepEd have?
The SY 2025-2026 enrollment file lists 231 schools divisions outside the overseas schools group. Twelve of them were created after SY 2017-2018, most by separating city divisions from Laguna, Cavite, Negros Occidental, and Bulacan.
Which DepEd schools division grew the most from SY 2017-2018 to SY 2025-2026?
Marawi City, at +17.33% a year, among divisions with stable boundaries; it was recovering from the 2017 siege. Maguindanao I (+3.24%), Tawi-Tawi (+2.16%), Maguindanao II (+2.10%), and Sulu (+1.97%) follow. By learners added, Rizal (+45,065) leads.
Which schools division has the most crowded classrooms?
General Trias City in Cavite, at 82.3 learners per instructional room in public schools in SY 2023-2024. Navotas (81.3), Las Piñas (76.1), Malabon (72.8), and Digos City (71.1) follow.
Download the data
The cleaned, harmonized DepEd files behind this series are free to download in CSV and Parquet, with a codebook and checksums, under the terms of use set out in the release. Download Cleaned DepEd School Data, SY 2017-18 to 2025-26 documents every file and column. The files themselves are at data.nash.com.ph, starting with the README, the SY 2023-24 school master file (CSV, 8.0 MB) and the nine-year enrollment panel (Parquet, 17.2 MB).
More in this series
- Enrollment by school year: SY 2017-18, SY 2018-19, SY 2019-20, SY 2020-21, SY 2021-22, SY 2022-23, SY 2023-24, SY 2024-25, SY 2025-26
- DepEd Enrollment by Province and Legislative District
- DepEd Schools per District Supervisor, SY 2023-2024
- DepEd Enrollment Trends SY 2017-2018 to SY 2025-2026
- DepEd Classroom and School Building Data, SY 2023-2024 and DepEd Teachers and School Personnel Data, SY 2023-2024
- DepEd Data for Aspiring School Heads: Where to Start
- For aspiring school heads: How to Read DepEd Data and the full report, Philippine basic education in numbers
Analysis and charts by Mark Anthony Llego for NASH Reviewer. Data: Department of Education enrollment datasets SY 2017-18 to SY 2025-26 and the SY 2023-24 school personnel, facilities, WASH and ICT files. Charts may be reused only with written permission from support@nash.com.ph.