DepEd’s SY 2023-2024 learner file counts Indigenous Peoples (IP), Arabic Language and Islamic Values Education (ALIVE) and Balik-Aral learners in public schools, grade by grade. Nationally, 9.3% of public school learners are tagged IP, 1.4% are in ALIVE and 0.6% are Balik-Aral returnees. The file also records, for each grade, how many learners sit in multigrade classes and how many are served through an alternative delivery mode (ADM) such as the Open High School Program.
The SY 2023-2024 learner data report has the school-level totals. The grade-level columns add the pattern across grades, which shows what each program is for and whom it reaches.
All figures are for public schools outside the overseas group: 23,143,080 learners in 47,818 schools. Of these, 2,158,460 are tagged IP (9.3%). Another 329,828 are in ALIVE (1.4%), and 143,558 are Balik-Aral (0.6%).
Key findings
- IP learners are 9.3% of public school learners, and their share rises through elementary. The share is 9.2% in kindergarten and 10.0% in Grade 4, then falls to 8.4% in Grade 10.
- ALIVE is an elementary program concentrated in four regions. Nine in ten of the 329,828 ALIVE learners are in kindergarten to Grade 6, and BARMM, Region IX, Region XII and Region X hold 90% of them.
- Balik-Aral returnees re-enter at Grade 1, Grade 7 and Grade 11. Returnees are 1.22% of Grade 1, 1.19% of Grade 7 and 1.15% of Grade 11, against 0.3% to 0.7% in other grades.
- Alternative delivery modes reach about 25,000 learners. The Open High School Program, the largest, has 13,060 learners in 586 schools.
- Multigrade classes hold 280,087 learners in 5,974 schools. That is 2.0% of public elementary enrollment.
| Grade | Learners | IP learners | IP share | Balik-Aral | Balik-Aral share | ALIVE | ALIVE share |
|---|---|---|---|---|---|---|---|
| Kindergarten | 1,833,526 | 167,967 | 9.2% | 1,551 | 0.08% | 33,004 | 1.80% |
| Grade 1 | 1,985,658 | 185,290 | 9.3% | 24,141 | 1.22% | 56,826 | 2.86% |
| Grade 2 | 2,039,272 | 188,159 | 9.2% | 14,979 | 0.73% | 48,860 | 2.40% |
| Grade 3 | 2,021,227 | 193,823 | 9.6% | 11,366 | 0.56% | 44,660 | 2.21% |
| Grade 4 | 1,885,869 | 188,330 | 10.0% | 8,764 | 0.46% | 40,359 | 2.14% |
| Grade 5 | 2,144,866 | 210,221 | 9.8% | 7,367 | 0.34% | 41,492 | 1.93% |
| Grade 6 | 2,024,504 | 201,003 | 9.9% | 6,233 | 0.31% | 35,919 | 1.77% |
| Grade 7 | 1,526,454 | 149,055 | 9.8% | 18,108 | 1.19% | 8,465 | 0.55% |
| Grade 8 | 1,649,191 | 148,640 | 9.0% | 10,580 | 0.64% | 7,289 | 0.44% |
| Grade 9 | 1,708,844 | 146,572 | 8.6% | 10,209 | 0.60% | 6,372 | 0.37% |
| Grade 10 | 1,717,023 | 144,279 | 8.4% | 10,568 | 0.62% | 6,582 | 0.38% |
| Grade 11 | 1,299,417 | 121,126 | 9.3% | 14,961 | 1.15% | ||
| Grade 12 | 1,307,229 | 113,995 | 8.7% | 4,731 | 0.36% |
IP learners by grade: the share rises through elementary
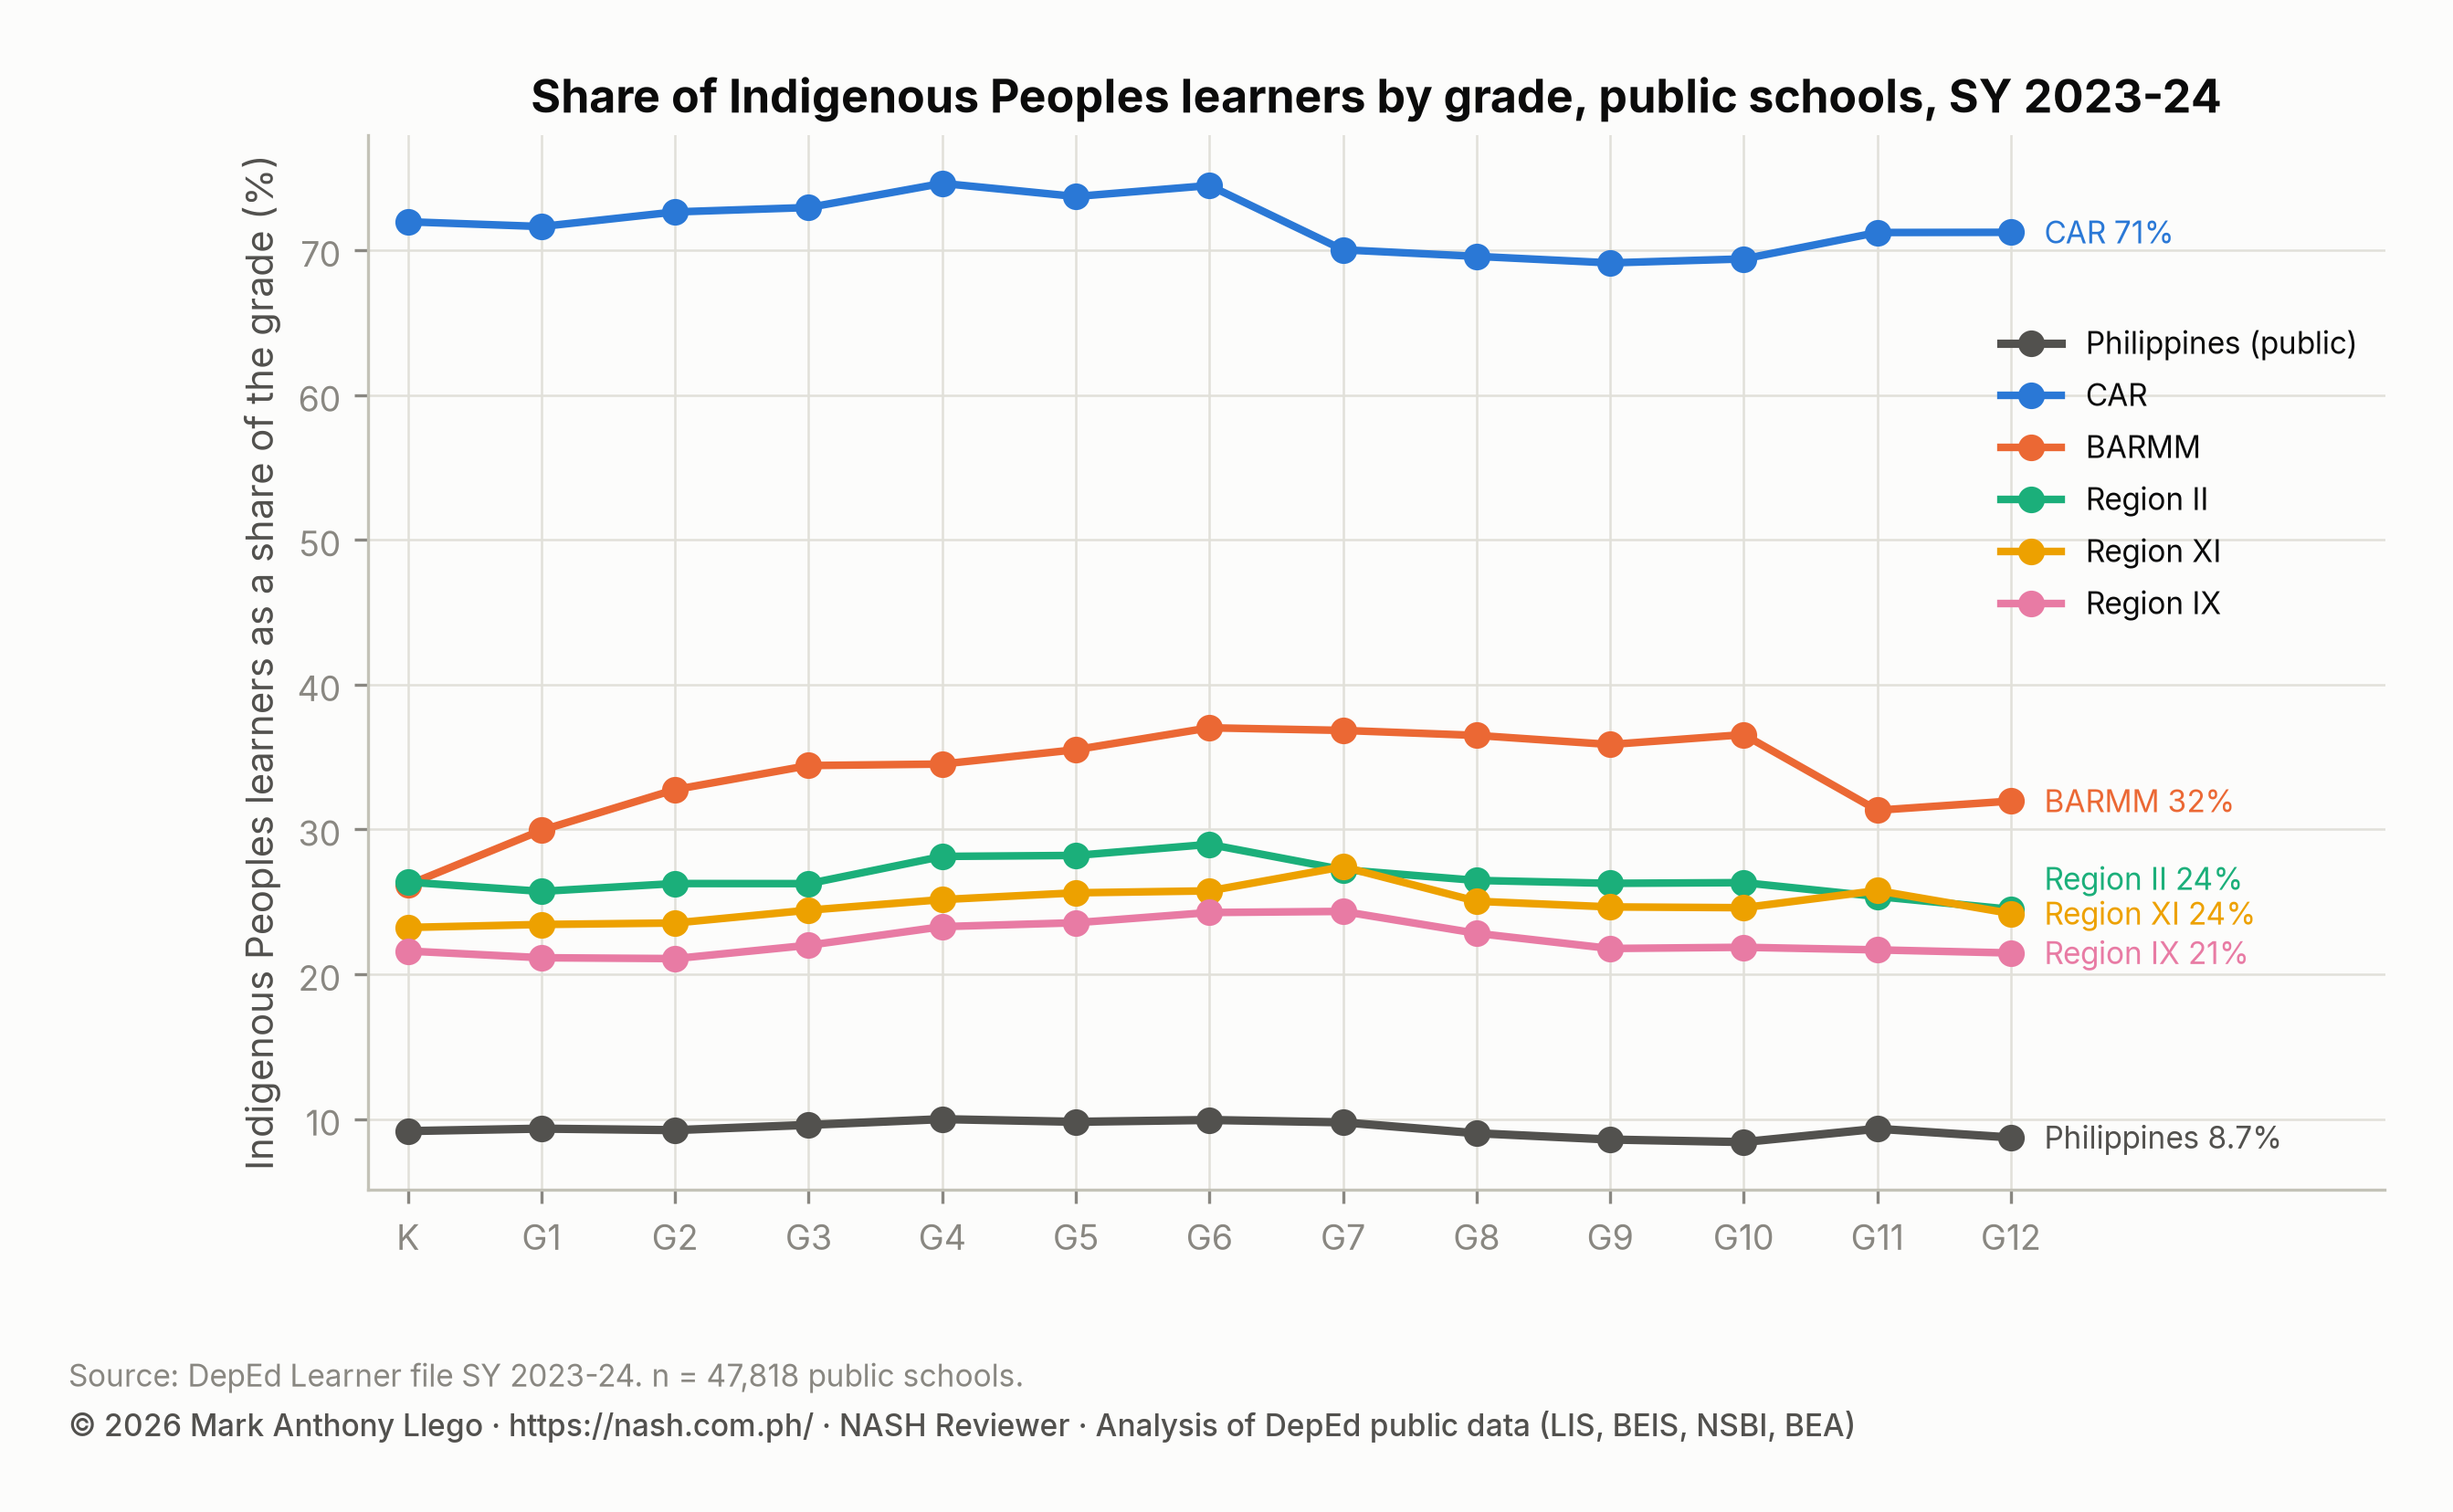
The share of IP learners is 9.2% in kindergarten and 9.3% in Grade 1. It rises to 10.0% in Grade 4 and is 9.9% in Grade 6. Across junior high it falls, from 9.8% in Grade 7 to 8.4% in Grade 10. In senior high it is 9.3% in Grade 11 and 8.7% in Grade 12.
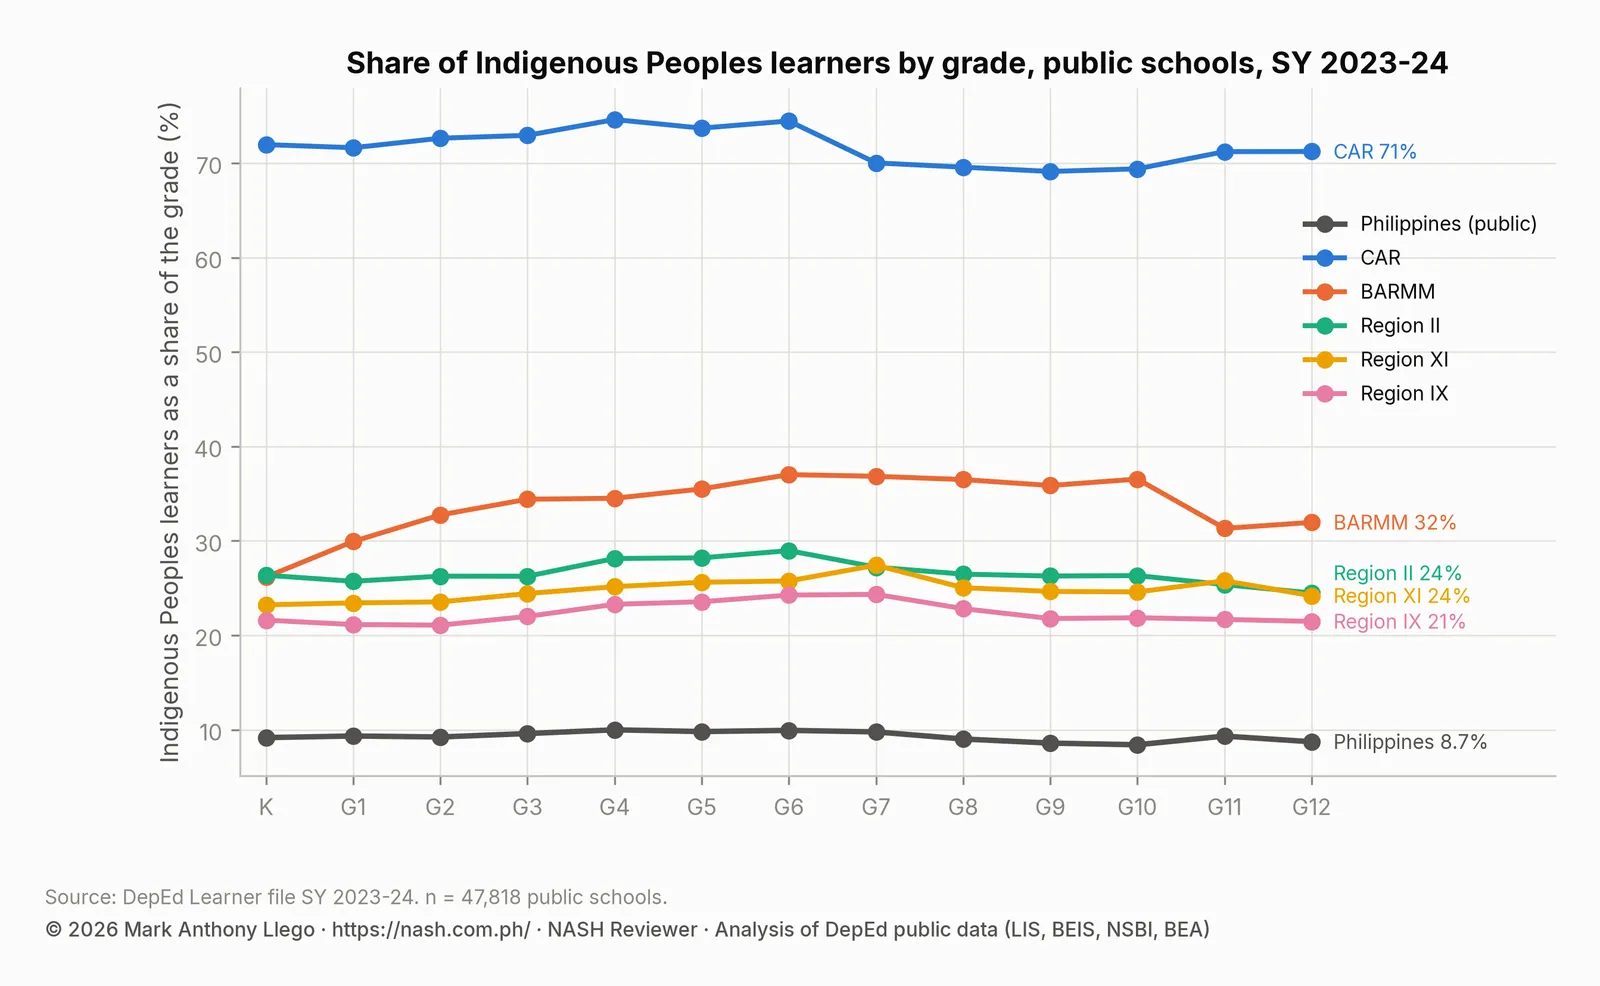
A share that rises with grade is not what early dropout would produce. If IP learners left school earlier than other learners, their share would fall from Grade 1 onward. Instead, the IP count grows from 167,967 in kindergarten to 201,003 in Grade 6, a rise of a fifth. The count of all learners moves only from 1.83 million to 2.02 million over the same grades.
Two explanations fit this pattern. IP children enter school later and repeat grades more often, so a grade’s IP count includes children from more than one birth year. Schools may also tag learners as IP more completely the longer they stay enrolled. The data cannot separate the two. Either way, the elementary grades are not where IP learners leave school.
Junior high is where IP learners leave. The IP share falls by 1.4 points between Grade 7 and Grade 10, while the total number of learners in those grades rises. BARMM has the steepest elementary rise, from 26.2% in kindergarten to 37.0% in Grade 6. It then drops from 36.5% in Grade 10 to 31.3% in Grade 11, the transition at which senior high schools are fewer and farther away. MIMAROPA and Region XII show a steady fall across all thirteen grades, from 22.4% to 16.2% and from 21.2% to 15.0%.
| Region | Kindergarten | Grade 1 | Grade 2 | Grade 3 | Grade 4 | Grade 5 | Grade 6 | Grade 7 | Grade 8 | Grade 9 | Grade 10 | Grade 11 | Grade 12 |
|---|---|---|---|---|---|---|---|---|---|---|---|---|---|
| CAR | 72.0% | 71.6% | 72.6% | 72.9% | 74.6% | 73.7% | 74.5% | 70.0% | 69.6% | 69.1% | 69.4% | 71.2% | 71.2% |
| BARMM | 26.2% | 29.9% | 32.7% | 34.4% | 34.5% | 35.5% | 37.0% | 36.8% | 36.5% | 35.9% | 36.5% | 31.3% | 32.0% |
| Region II | 26.4% | 25.7% | 26.3% | 26.3% | 28.1% | 28.2% | 29.0% | 27.2% | 26.5% | 26.3% | 26.3% | 25.4% | 24.5% |
| Region XI | 23.2% | 23.4% | 23.5% | 24.4% | 25.1% | 25.6% | 25.8% | 27.4% | 25.0% | 24.6% | 24.6% | 25.8% | 24.2% |
| Region IX | 21.6% | 21.1% | 21.1% | 22.0% | 23.3% | 23.5% | 24.3% | 24.3% | 22.8% | 21.8% | 21.9% | 21.7% | 21.5% |
| MIMAROPA | 22.4% | 21.3% | 21.2% | 21.2% | 23.0% | 20.8% | 20.9% | 21.0% | 19.0% | 18.3% | 18.1% | 17.2% | 16.2% |
| Region XII | 21.2% | 20.7% | 21.2% | 20.8% | 20.6% | 20.0% | 19.7% | 20.7% | 18.3% | 17.8% | 16.8% | 16.6% | 15.0% |
| CARAGA | 11.9% | 12.6% | 13.3% | 13.4% | 14.6% | 14.5% | 14.9% | 15.9% | 14.9% | 14.3% | 14.2% | 11.8% | 11.4% |
| Region X | 13.1% | 13.2% | 13.0% | 13.8% | 14.0% | 14.1% | 14.6% | 15.0% | 14.2% | 13.3% | 13.3% | 14.1% | 13.9% |
CAR is the exception in the other direction. Seven in ten public school learners in CAR are IP in every grade, and the share is as high in Grade 12 (71.2%) as in kindergarten (72.0%). Where IP learners are the majority, being IP does not predict leaving school.
Girls are 49.8% of IP learners and 48.5% of all public school learners, so IP enrollment is slightly more female than enrollment as a whole. In senior high, the 2.6 million public school learners include 235,121 IP learners. Most of them are in the Technical-Vocational-Livelihood (TVL) strand (38.9%), the Humanities and Social Sciences (HUMSS) strand (27.2%) or the General Academic Strand (GAS) (21.9%). Only 7.1% are in Science, Technology, Engineering and Mathematics (STEM) and 4.4% in Accountancy, Business and Management (ABM).
Within each strand, the IP share is highest in GAS (11.3%) and lowest in ABM (4.8%). STEM is 6.4%, well below the 9.3% IP share of Grade 11 as a whole.
| Strand | Senior high learners | IP learners | IP share | Share of all IP senior high learners |
|---|---|---|---|---|
| ABM | 215,953 | 10,400 | 4.8% | 4.4% |
| HUMSS | 706,316 | 63,864 | 9.0% | 27.2% |
| STEM | 263,626 | 16,755 | 6.4% | 7.1% |
| GAS | 454,780 | 51,609 | 11.3% | 21.9% |
| Maritime | 442 | 34 | 7.7% | 0.0% |
| TVL | 950,960 | 91,575 | 9.6% | 38.9% |
| Sports | 6,050 | 453 | 7.5% | 0.2% |
| Arts | 8,519 | 431 | 5.1% | 0.2% |
ALIVE learners by grade: an elementary program in four regions
The learner file records ALIVE enrollment from kindergarten to Grade 10 only; the columns stop there. The 329,828 ALIVE learners are mostly in elementary. In Grade 1, 2.86% of all learners are in the program, falling to 1.77% by Grade 6. The share is 0.55% in Grade 7 and 0.38% in Grade 10. Nine in ten ALIVE learners are in kindergarten to Grade 6.
Four regions account for 90% of them. BARMM has 139,729 ALIVE learners, 18.2% of all its public school learners. Region IX has 61,536 (5.6%), Region XII 56,631 (5.3%) and Region X 39,004 (3.4%). Region XI (9,240), MIMAROPA (5,474) and NCR (4,636) follow. Every other region has fewer than 4,100, and four have fewer than 500.
| Region | ALIVE learners | Share of the region’s learners | Of which elementary |
|---|---|---|---|
| BARMM | 139,729 | 18.17% | 89.6% |
| Region IX | 61,536 | 5.56% | 95.8% |
| Region XII | 56,631 | 5.33% | 92.6% |
| Region X | 39,004 | 3.36% | 85.9% |
| Region XI | 9,240 | 0.76% | 98.0% |
| MIMAROPA | 5,474 | 0.67% | 98.4% |
| NCR | 4,636 | 0.22% | 93.2% |
| Region IV-A | 4,002 | 0.13% | 89.4% |
| Region VII | 3,344 | 0.23% | 95.3% |
| Region III | 1,867 | 0.08% | 89.2% |
| CARAGA | 1,268 | 0.18% | 88.4% |
| Region I | 714 | 0.06% | 87.4% |
| Region VI | 538 | 0.05% | 90.7% |
| Region V | 519 | 0.03% | 84.4% |
| Region VIII | 460 | 0.04% | 88.5% |
| CAR | 389 | 0.11% | 95.9% |
| NIR | 338 | 0.03% | 71.3% |
| Region II | 265 | 0.03% | 89.8% |
The drop between Grade 6 and Grade 7 comes from the program’s design, not from learners leaving. Asatidz deliver ALIVE within elementary schools, and little of the program is offered in junior high. For a school head in Mindanao, the ALIVE columns are also the clearest count the file gives of Muslim learners, because the file has no religion field.
Balik-Aral learners by grade: 143,558 returnees at the entry grades
Balik-Aral learners are learners who left school and came back. They are 0.6% of public school enrollment overall, but they concentrate in the three entry grades. Returnees are 1.22% of Grade 1, 1.19% of Grade 7 and 1.15% of Grade 11. In other grades the share is 0.3% to 0.7%, and in kindergarten it is 0.08%.
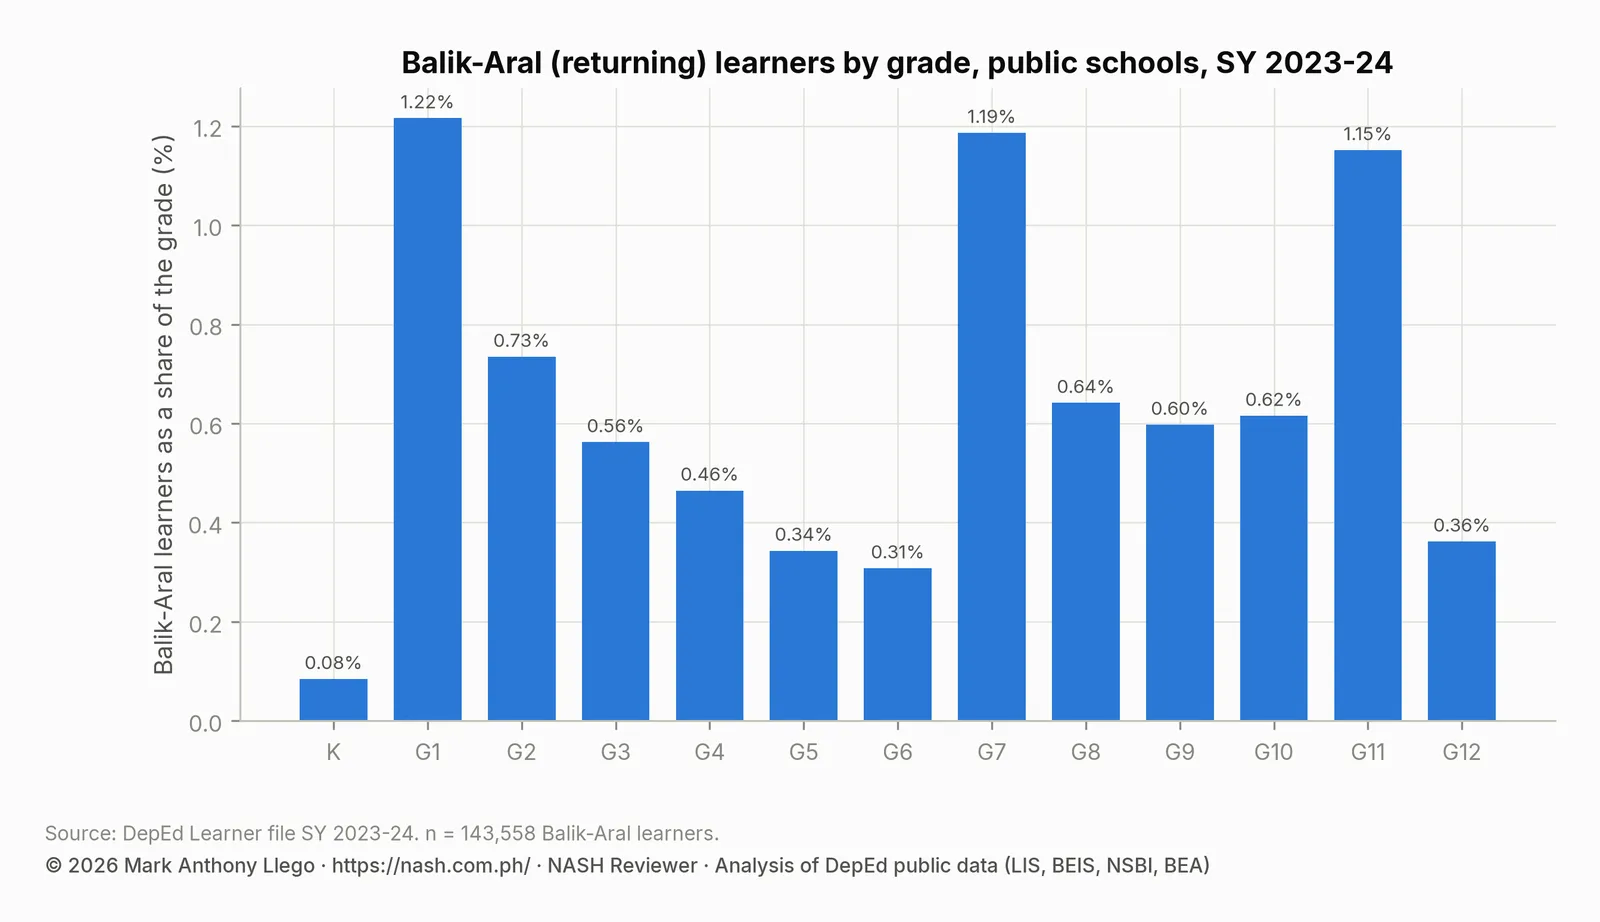
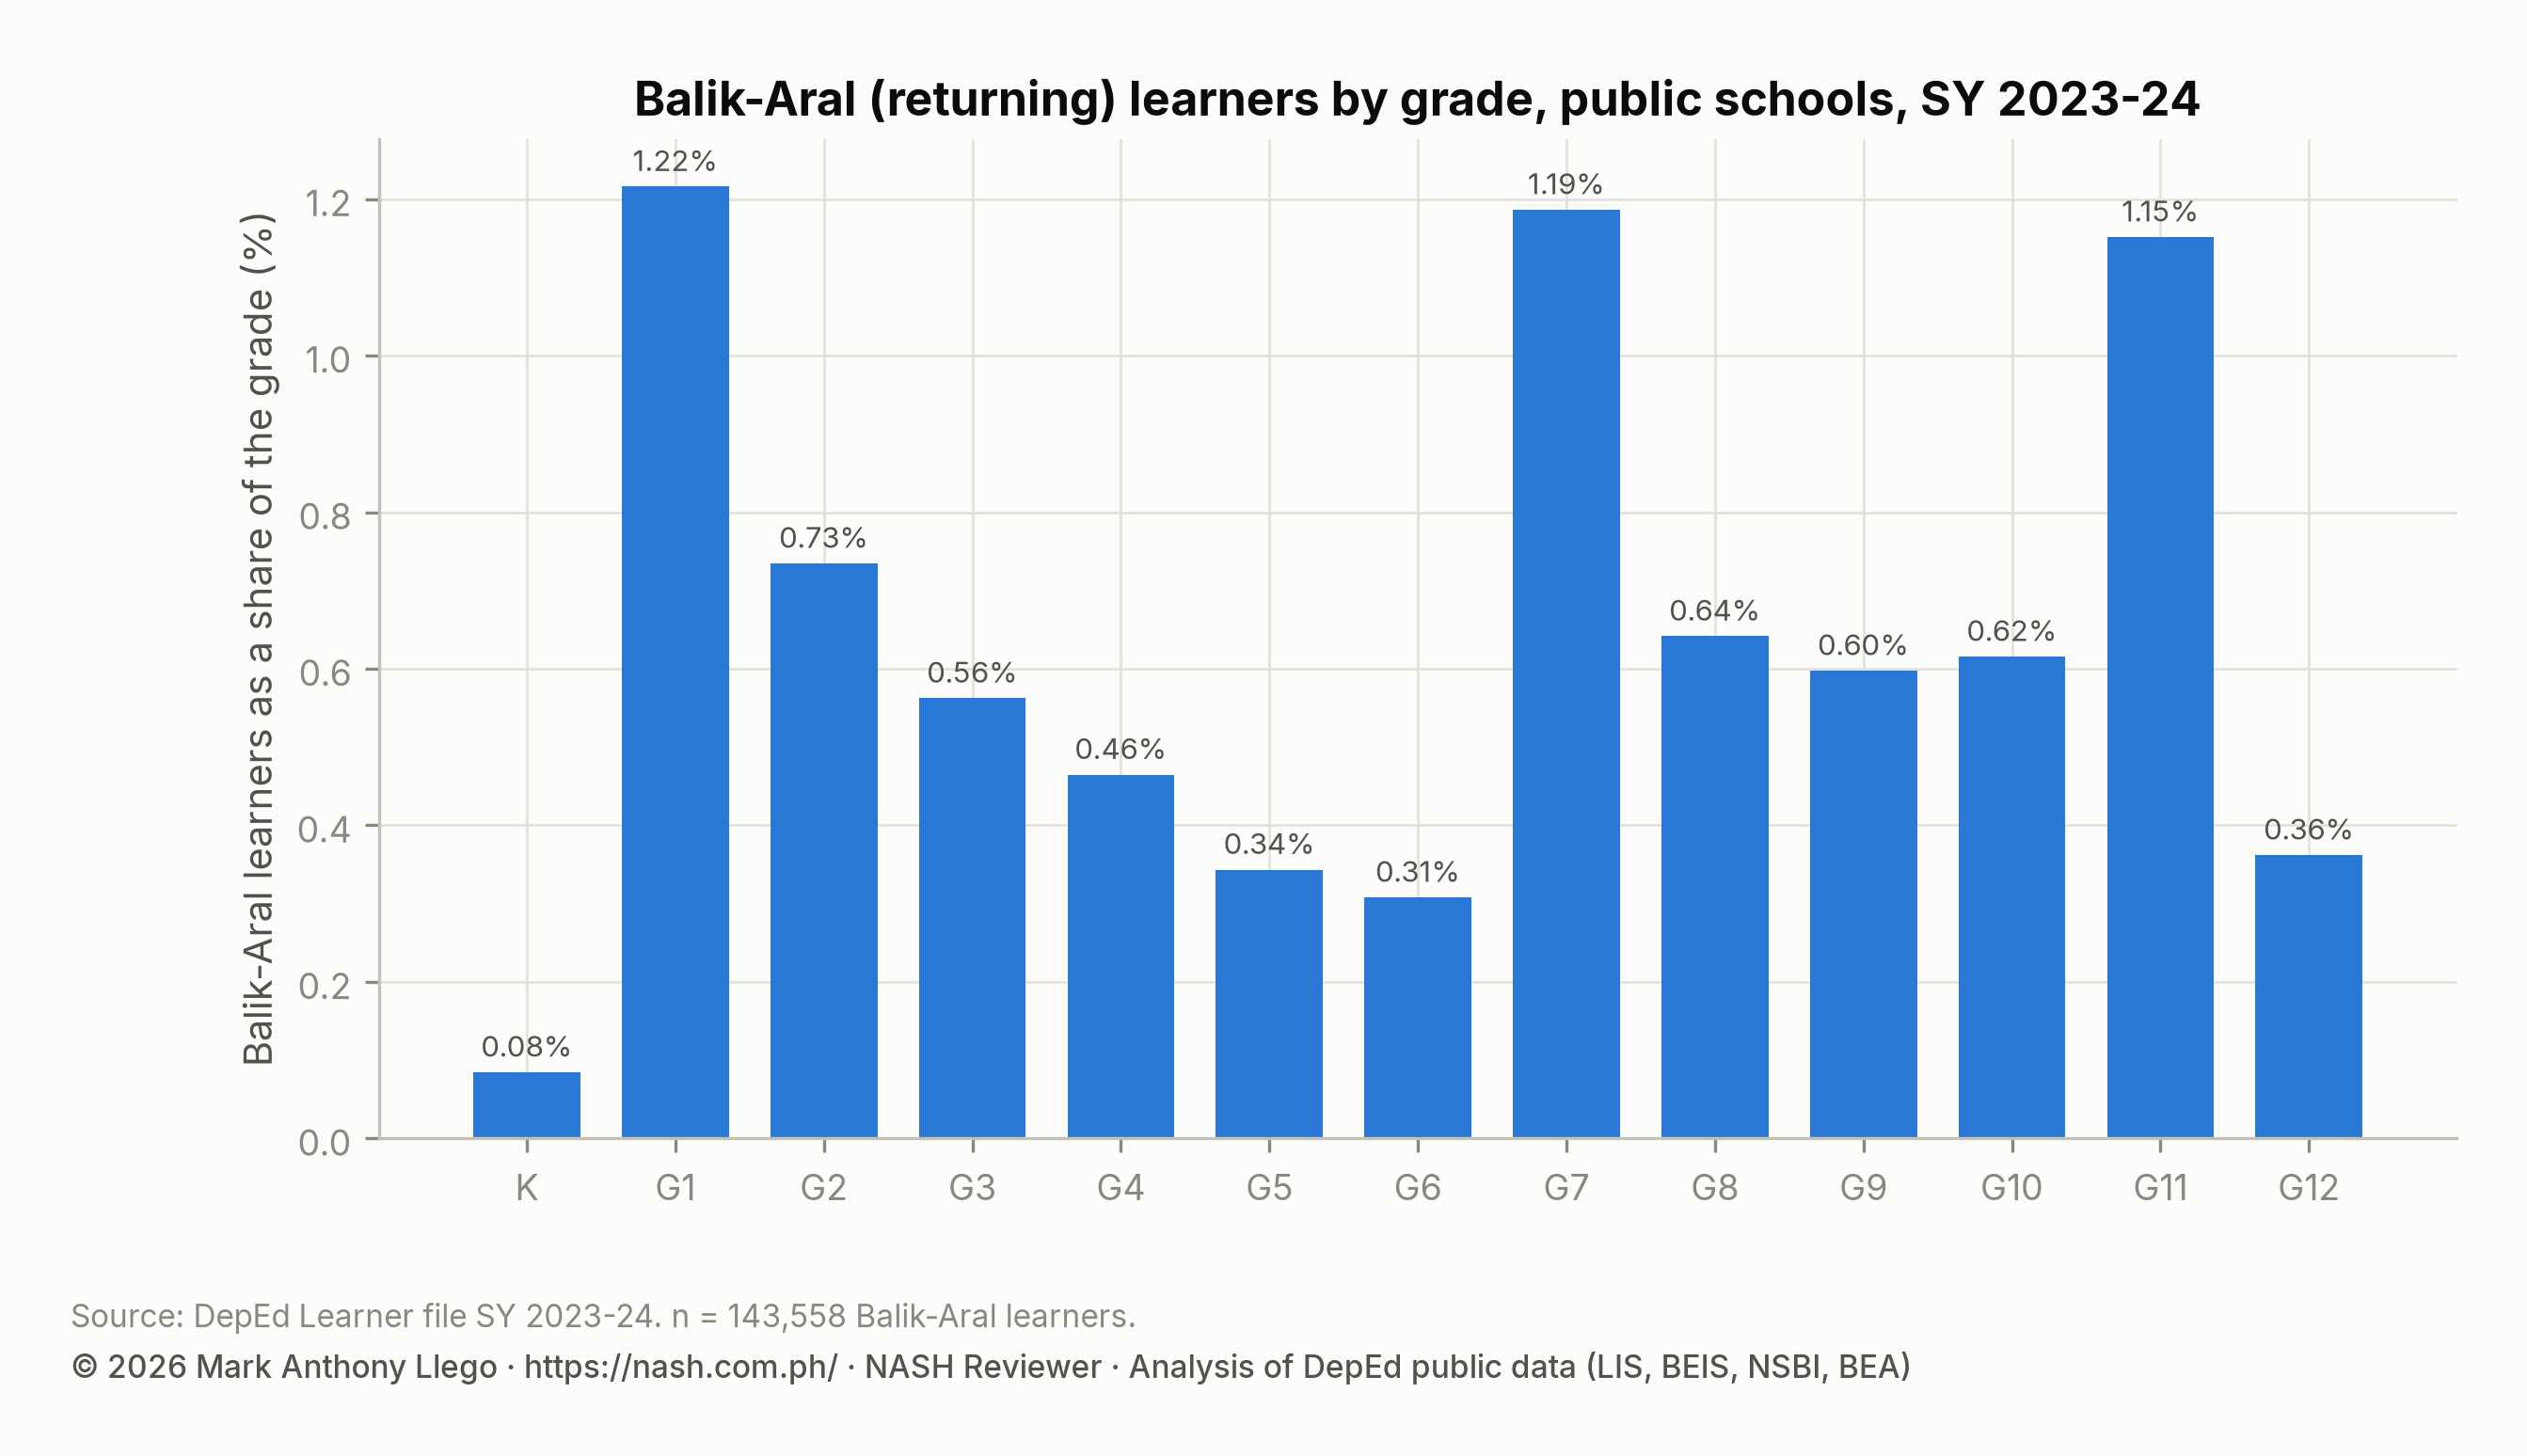
Returning learners re-enter at the start of a level. A learner who stopped after Grade 6 comes back into Grade 7, and one who stopped after Grade 10 comes back into Grade 11. The low Grade 12 figure (0.36%) shows the other side of the same pattern: few learners leave within senior high and return the following year. For a junior high principal, this means that Grade 7 holds the returnees, so guidance and bridging efforts belong in that grade.
By region, BARMM has the highest Balik-Aral share at 1.55%, followed by Region IX (0.96%). Region X and Region XII (0.73% each) and MIMAROPA (0.70%) come next. Region I (0.28%), Region VI (0.33%), Region II (0.36%) and CAR (0.37%) are lowest. By count, Region IV-A has the most returnees (20,400), then NCR (13,905) and Region III (13,313).
| Region | Learners | Balik-Aral | Balik-Aral share | Elementary | Junior high | Senior high |
|---|---|---|---|---|---|---|
| BARMM | 769,022 | 11,901 | 1.55% | 7,026 | 4,564 | 311 |
| CAR | 358,204 | 1,327 | 0.37% | 460 | 615 | 252 |
| CARAGA | 700,496 | 3,699 | 0.53% | 2,026 | 1,153 | 520 |
| MIMAROPA | 817,395 | 5,711 | 0.70% | 2,877 | 1,865 | 969 |
| NCR | 2,101,985 | 13,905 | 0.66% | 7,214 | 4,385 | 2,306 |
| NIR | 1,134,333 | 7,266 | 0.64% | 3,545 | 2,630 | 1,091 |
| Region I | 1,101,162 | 3,056 | 0.28% | 1,218 | 1,149 | 689 |
| Region II | 809,342 | 2,891 | 0.36% | 1,167 | 1,139 | 585 |
| Region III | 2,478,610 | 13,313 | 0.54% | 7,482 | 3,946 | 1,885 |
| Region IV-A | 3,188,202 | 20,400 | 0.64% | 10,833 | 6,376 | 3,191 |
| Region IX | 1,106,260 | 10,571 | 0.96% | 6,361 | 3,494 | 716 |
| Region V | 1,581,329 | 7,730 | 0.49% | 3,349 | 2,984 | 1,397 |
| Region VI | 1,040,714 | 3,391 | 0.33% | 1,194 | 1,508 | 689 |
| Region VII | 1,456,462 | 7,830 | 0.54% | 4,086 | 2,638 | 1,106 |
| Region VIII | 1,141,816 | 6,576 | 0.58% | 3,165 | 2,567 | 844 |
| Region X | 1,159,212 | 8,469 | 0.73% | 4,762 | 2,711 | 996 |
| Region XI | 1,218,778 | 7,789 | 0.64% | 4,024 | 2,629 | 1,136 |
| Region XII | 1,062,105 | 7,733 | 0.73% | 3,612 | 3,112 | 1,009 |
Alternative delivery mode (ADM) learners: about 25,000
The file names five ADM programs. Together they reach about 25,000 public school learners, one in a thousand.
| Program | Learners | Schools | Regions with most learners |
|---|---|---|---|
| Distance Education (elementary) | 681 | 242 | Region XI (76), CARAGA (67), MIMAROPA (63) |
| e-IMPACT (elementary) | 1,244 | 228 | MIMAROPA (186), Region IX (180), Region X (140) |
| MISOSA (Grades 4 to 6) | 1,568 | 81 | Region III (852), Region IV-A (351), MIMAROPA (112) |
| Other school-based ADM | 8,403 | 757 | Region III (3,000), Region V (993), CAR (628) |
| Open High School Program (Grades 7 to 10) | 13,060 | 586 | NCR (2,393), Region X (1,731), Region IV-A (1,356) |
The Open High School Program is the largest, with 13,060 learners in 586 schools. NCR (2,393 learners), Region X (1,731) and Region IV-A (1,356) have the most. “Other school-based ADM” has 8,403 learners in 757 schools, of whom 3,000 are in Region III. MISOSA (Modified In-School Off-School Approach, Grades 4 to 6) has 1,568 learners in 81 schools, 852 of them in Region III.
e-IMPACT, the Instructional Management by Parents, Community and Teachers model for small schools, has 1,244 learners in 228 schools. Most of them are in MIMAROPA, Region IX and Region X. Elementary distance education has 681 learners in 242 schools.
The small totals matter for how the Open High School Program is discussed. It is often described as DepEd’s program for working learners and for learners who cannot attend school daily. The file shows it reaching 13,060 of 6.6 million public junior high learners. The Alternative Learning System, which serves out-of-school youth and adults outside the formal grade structure, is not in this file at all.
Multigrade classes: 280,087 learners in 5,974 schools
Multigrade classes, in which one teacher teaches two or more grades in one room, are recorded for kindergarten to Grade 6. They hold 280,087 learners, 2.0% of public elementary enrollment, in 5,974 schools. The share is 0.6% in kindergarten, between 2.2% and 2.4% in Grades 1 to 5, and 1.9% in Grade 6.
| Grade | In monograde classes | In multigrade classes | Multigrade share |
|---|---|---|---|
| Kindergarten | 1,821,872 | 11,654 | 0.6% |
| Grade 1 | 1,940,369 | 45,289 | 2.3% |
| Grade 2 | 1,991,061 | 48,211 | 2.4% |
| Grade 3 | 1,972,856 | 48,371 | 2.4% |
| Grade 4 | 1,844,068 | 41,801 | 2.2% |
| Grade 5 | 2,098,015 | 46,851 | 2.2% |
| Grade 6 | 1,986,812 | 37,692 | 1.9% |
The kindergarten figure is low because small schools usually keep kindergarten as its own class. The Grade 6 figure is lower than Grades 1 to 5 because the smallest schools often end at Grade 4 or Grade 5 and send completers to a larger school. One in eight public schools runs at least one multigrade class. A school head posted to one needs the multigrade curriculum guides and teaching schedules that DepEd Order 21, s. 2019 and the orders before it set out.
Notes on reading the learner file
- Schools enter the IP, ALIVE and Balik-Aral tags in the Learner Information System (LIS). The “IP” tag follows the learner’s self-declaration or the parent’s, and completeness varies by division.
- ALIVE columns exist for kindergarten to Grade 10 only, so senior high ALIVE learners, if any, are not counted.
- The grade-level program columns are for public schools. Private school learners in the file have no program breakdown.
- “Share of the grade” divides program learners by all public school learners in that grade. For senior high, the strand columns are summed.
- The Alternative Learning System is not in the learner file.
For aspiring school heads
Domain 3 of the Philippine Professional Standards for School Heads (PPSSH) asks school heads to manage “learner discipline” and “inclusive practice”. Domain 5 asks them to work with “diverse community stakeholders”. The National Assessment for School Heads (NASH) tests whether a candidate can turn those phrases into decisions. Three such decisions can be read from these tables:
- Which grade a returnee program should be built around (Grade 7 and Grade 11).
- Whether an IP education program in the school should be an elementary or a junior high intervention (the IP share falls in junior high).
- Whether the ALIVE Asatidz the school needs are an elementary or a secondary staffing question (elementary).
The SY 2023-2024 learner data report has the school-level totals, and the PPSSH Domain 3 guide explains the competencies these decisions fall under. For inclusive practice, RA 11650 and Learners With Disabilities covers EDCOM II’s findings on learners with disabilities and on the exclusion of Indigenous and Muslim learners.
Frequently asked questions
How many Indigenous Peoples (IP) learners are in DepEd public schools in SY 2023-2024?
DepEd’s SY 2023-2024 learner file tags 2,158,460 public school learners as IP, 9.3% of the total. The share rises from 9.2% in kindergarten to 10.0% in Grade 4. It then falls to 8.4% in Grade 10 and is 8.7% in Grade 12.
Which region has the most ALIVE learners in DepEd public schools?
BARMM has the most, with 139,729 ALIVE learners, 18.2% of its public school enrollment. Region IX (61,536), Region XII (56,631) and Region X (39,004) follow. ALIVE is almost entirely an elementary program.
At which grade do Balik-Aral learners return to DepEd public schools?
Balik-Aral learners return at the entry grades. In SY 2023-2024, 1.22% of Grade 1, 1.19% of Grade 7 and 1.15% of Grade 11 learners were returnees. In other grades the share was 0.3% to 0.7%.
Download the data
The cleaned, harmonized DepEd files behind this series are free to download in CSV and Parquet, with a codebook and checksums, under the terms of use set out in the release. Download Cleaned DepEd School Data, SY 2017-18 to 2025-26 documents every file and column. The files themselves are at data.nash.com.ph, starting with the README, the SY 2023-24 school master file (CSV, 8.0 MB) and the nine-year enrollment panel (Parquet, 17.2 MB).
More in this series
- DepEd Learner Data SY 2023-2024: IP, ALIVE and School Size
- DepEd Senior High Strands by Sex, SY 2017-18 to 2025-26
- DepEd Data on School Access, Roads and Safety, SY 2023-2024
- Enrollment by school year: SY 2017-18, SY 2018-19, SY 2019-20, SY 2020-21, SY 2021-22, SY 2022-23, SY 2023-24, SY 2024-25, SY 2025-26
- DepEd Data for Aspiring School Heads: Where to Start
- For aspiring school heads: How to Read DepEd Data and the full report, Philippine basic education in numbers
Analysis and charts by Mark Anthony Llego for NASH Reviewer. Data: Department of Education learner dataset for SY 2023-24 (Learner Information System). Charts may be reused only with written permission from support@nash.com.ph.