A cohort-flow projection by grade from DepEd’s nine public enrollment files, SY 2017-2018 to SY 2025-2026, puts total enrollment at 23.1 to 24.1 million learners in SY 2031-2032, down from 25.8 million in kindergarten to Grade 12 in SY 2025-2026. Grade 7 and Grade 12 fall most.
Most of the learners who will be in school in SY 2031-2032 are already enrolled. The Grade 12 class of that year is this year’s Grade 6, and the Grade 7 class is this year’s Grade 1. Only the six kindergarten intakes between now and then are unknown, and those depend on children already born.
The method is simple. Each grade in a given year equals the grade below it in the previous year, multiplied by the ratio observed in the recent files. Kindergarten has no grade below it, so it follows three assumptions instead.
The projection is arithmetic, not a forecast: it shows the shape of the next six years, not any particular number. The SY 2017-2018 enrollment report used the same method to follow the small Grade 1 class of that year up to Grade 9; this post applies it forward.
Key findings
- Total enrollment falls to between 23.1 and 24.1 million learners by SY 2031-2032, from 25,832,313 in kindergarten to Grade 12 in SY 2025-2026. The 103,550 non-graded learners in that year’s total of 25,935,863 are not projected. With kindergarten held flat, the total is 24,067,357 (−6.8%). With kindergarten falling at the nine-year rate it is 23,416,802 (−9.4%), and at the three-year rate 23,071,633 (−10.7%).
- Grade 7 falls most, by 24.4%, from 2.23 million to 1.69 million, because the SY 2031-2032 Grade 7 is this year’s Grade 1, the smallest Grade 1 in the series. Grade 12 falls by 19.1%.
- Junior high and senior high fall in every scenario, to 7,062,429 (−8.9%) and 3,330,786 (−13.0%), because no projected kindergarten class reaches Grade 7 before SY 2032-2033.
- Grade 12 takes only 0.925 of the previous year’s Grade 11, the largest loss at any step. About one learner in seven who starts Grade 7 is not in Grade 10 three years later.
- The decline pauses in SY 2028-2029 and SY 2029-2030 while the large SY 2018-2019 Grade 1 class, 2.3 million learners, passes through senior high, then resumes.
Grade-to-grade flow ratios in the enrollment files
For each pair of adjacent grades, the flow ratio is this year’s enrollment in the upper grade divided by last year’s enrollment in the grade below. The ratios count learners in all sectors. The table gives the ratios for the eight school-year pairs in the files and the post-pandemic mean used in the projection:
| Transition | SY 2018-19 | SY 2019-20 | SY 2020-21 | SY 2021-22 | SY 2022-23 | SY 2023-24 | SY 2024-25 | SY 2025-26 | Post-pandemic mean used |
|---|---|---|---|---|---|---|---|---|---|
| Kindergarten to Grade 1 | 1.034 | 1.016 | 0.992 | 1.065 | 1.025 | 1.005 | 1.011 | 1.017 | 1.011 |
| Grade 1 to Grade 2 | 1.005 | 0.983 | 0.945 | 1.014 | 1.009 | 0.987 | 0.986 | 0.98 | 0.984 |
| Grade 2 to Grade 3 | 0.996 | 0.994 | 0.958 | 1.012 | 1.008 | 0.988 | 0.994 | 0.99 | 0.991 |
| Grade 3 to Grade 4 | 0.992 | 0.991 | 0.96 | 1.011 | 1.005 | 0.979 | 0.99 | 0.988 | 0.985 |
| Grade 4 to Grade 5 | 0.991 | 0.99 | 0.966 | 1.012 | 0.999 | 0.982 | 0.986 | 0.986 | 0.985 |
| Grade 5 to Grade 6 | 0.984 | 0.985 | 0.965 | 1.011 | 0.996 | 0.978 | 0.985 | 0.981 | 0.982 |
| Grade 6 to Grade 7 | 0.985 | 0.996 | 0.928 | 1.011 | 0.995 | 0.971 | 0.981 | 0.981 | 0.977 |
| Grade 7 to Grade 8 | 0.974 | 0.947 | 0.935 | 1.051 | 0.988 | 0.952 | 0.966 | 0.96 | 0.959 |
| Grade 8 to Grade 9 | 0.953 | 0.948 | 0.933 | 1.028 | 0.975 | 0.944 | 0.963 | 0.959 | 0.955 |
| Grade 9 to Grade 10 | 0.945 | 0.944 | 0.937 | 1.025 | 0.967 | 0.933 | 0.956 | 0.958 | 0.949 |
| Grade 10 to Grade 11 | 0.964 | 0.969 | 0.934 | 1.084 | 1.015 | 0.983 | 1.018 | 1.006 | 1.003 |
| Grade 11 to Grade 12 | 0.939 | 0.916 | 0.901 | 1.01 | 0.918 | 0.907 | 0.93 | 0.937 | 0.925 |
Three features of the recent ratios drive the projection. First, Grade 1 takes 1.011 of the previous year’s kindergarten, down from 1.025 before the pandemic. Fewer over-age children now enter Grade 1 without a kindergarten record.
Second, the junior high transitions lose learners at every step. Grade 8 takes 0.959 of the previous Grade 7, Grade 9 takes 0.955 of the previous Grade 8, and Grade 10 takes 0.949 of the previous Grade 9. About one learner in seven who starts Grade 7 is not in Grade 10 three years later.
Third, Grade 12 takes 0.925 of the previous Grade 11, the largest loss at any step. That ratio has barely moved in eight years.
The Grade 10 to Grade 11 ratio of 1.003 is above its pre-pandemic level of 0.967. It is high partly because learners who finish junior high in private schools enter public senior high. It is also high because the SY 2025-2026 reclassification under the Strengthened Senior High School program raised the ratio in the latest file. The projection uses the three-year mean (SY 2023-2024 to SY 2025-2026) for every transition, so that effect is averaged in.
Kindergarten enrollment under three scenarios
Kindergarten is the one grade the ratios cannot supply. The SY 2025-2026 kindergarten class was 1,993,117 learners, the second-smallest in the series. The smallest was the year before, at 1,827,258.
Over nine years the kindergarten intake has fallen at 1.60% a year. Over the last three years it has fallen at 2.49% a year. Registered births, as the Philippine Statistics Authority reports them, have fallen every year since 2017. The number of five-year-olds will therefore keep falling into the 2030s, whatever happens to enrollment rates.
The projection therefore runs three kindergarten scenarios: flat at the SY 2025-2026 level, falling at the nine-year rate, and falling at the three-year rate. The first is an upper bound. The third is closer to what births imply.
Projected total enrollment: 23.1 to 24.1 million by SY 2031-2032
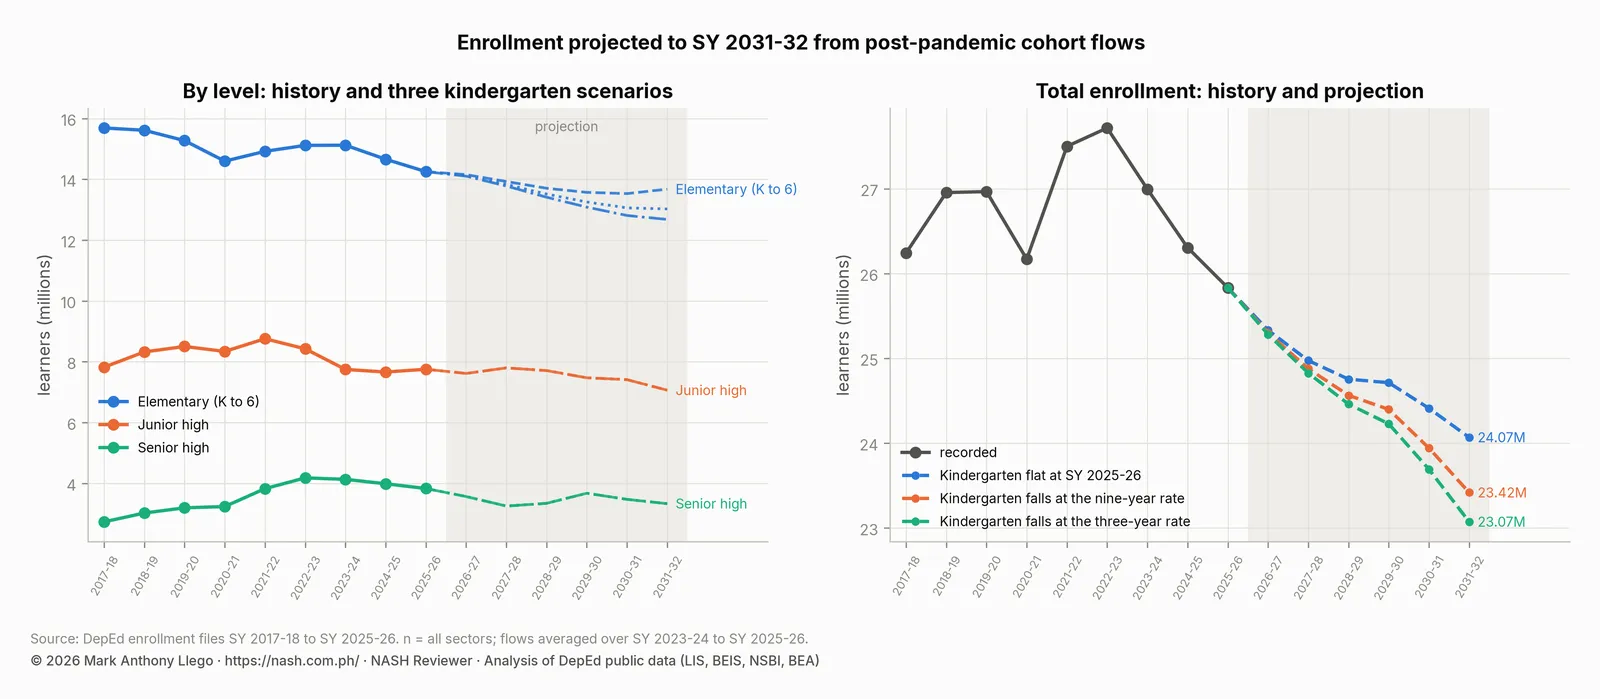
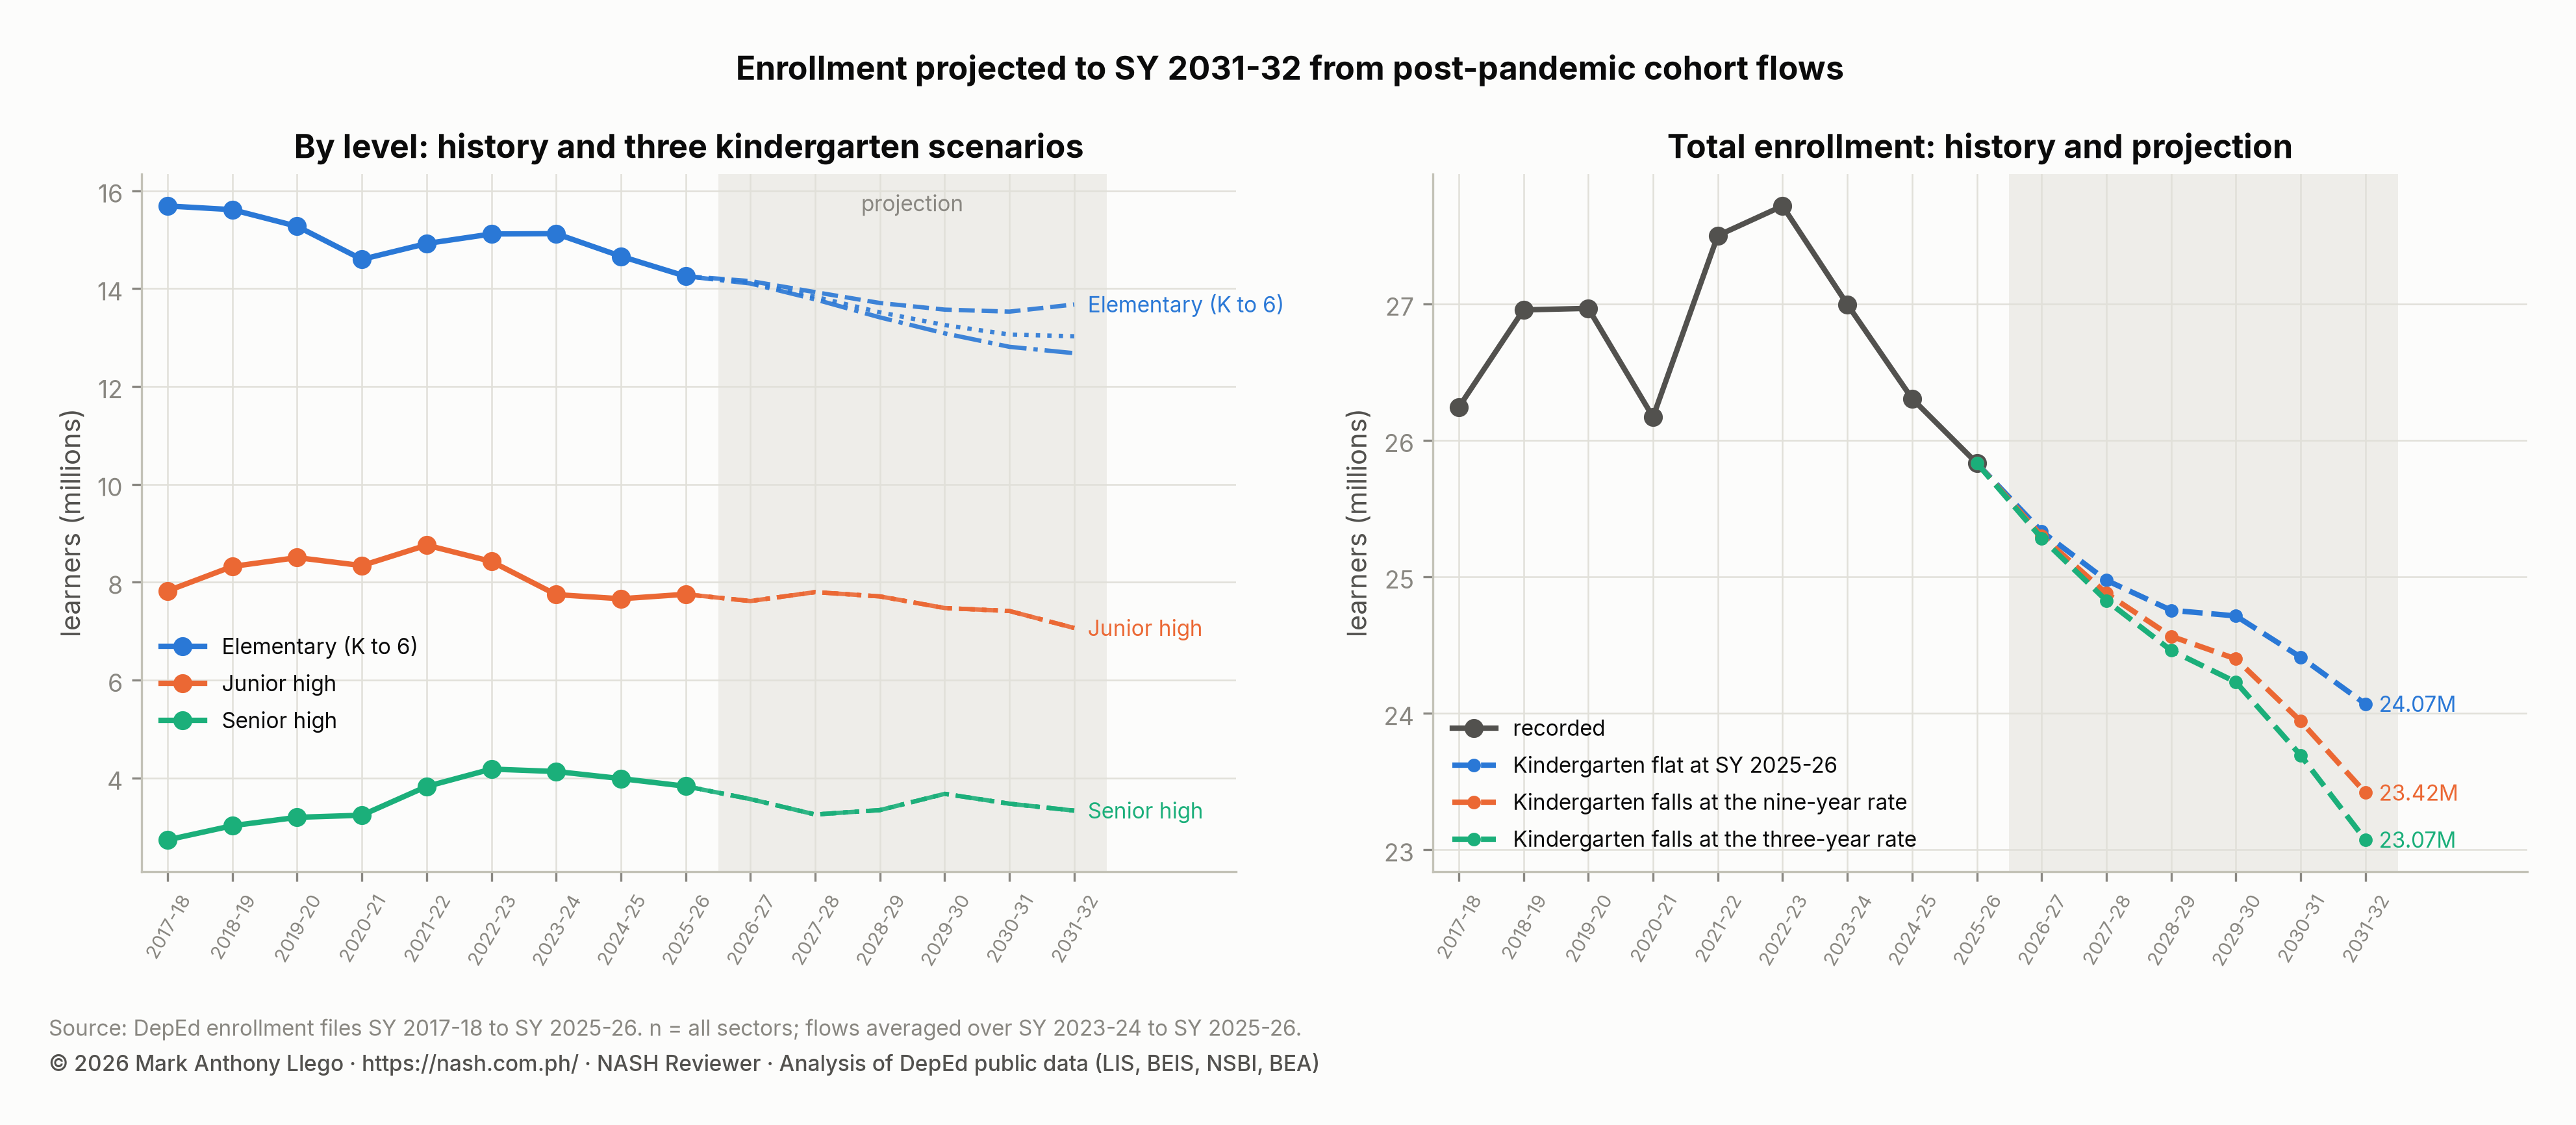
With kindergarten held flat, total enrollment falls from 25,832,313 in SY 2025-2026 to 24,067,357 in SY 2031-2032, a drop of 6.8%. With kindergarten falling at the nine-year rate, the total is 23,416,802 (−9.4%). At the three-year rate it is 23,071,633 (−10.7%).
The scenarios differ only in elementary, because none of the projected kindergarten classes reaches Grade 7 before SY 2032-2033. Junior high enrollment is 7,062,429 (−8.9%) and senior high enrollment is 3,330,786 (−13.0%) in every scenario.
| Scenario | School year | Elementary (K to 6) | Junior high | Senior high | Total | Change from SY 2025-26 |
|---|---|---|---|---|---|---|
| Kindergarten flat at SY 2025-26 | SY 2026-27 | 14,152,160 | 7,613,646 | 3,566,075 | 25,331,882 | -1.9% |
| Kindergarten flat at SY 2025-26 | SY 2027-28 | 13,926,108 | 7,795,929 | 3,251,858 | 24,973,895 | -3.3% |
| Kindergarten flat at SY 2025-26 | SY 2028-29 | 13,703,865 | 7,708,231 | 3,342,048 | 24,754,144 | -4.2% |
| Kindergarten flat at SY 2025-26 | SY 2029-30 | 13,568,621 | 7,470,423 | 3,673,634 | 24,712,679 | -4.3% |
| Kindergarten flat at SY 2025-26 | SY 2030-31 | 13,528,111 | 7,410,193 | 3,472,403 | 24,410,706 | -5.5% |
| Kindergarten flat at SY 2025-26 | SY 2031-32 | 13,674,142 | 7,062,429 | 3,330,786 | 24,067,357 | -6.8% |
| Kindergarten falls at the nine-year rate | SY 2026-27 | 14,120,181 | 7,613,646 | 3,566,075 | 25,299,903 | -2.1% |
| Kindergarten falls at the nine-year rate | SY 2027-28 | 13,830,327 | 7,795,929 | 3,251,858 | 24,878,114 | -3.7% |
| Kindergarten falls at the nine-year rate | SY 2028-29 | 13,513,474 | 7,708,231 | 3,342,048 | 24,563,753 | -4.9% |
| Kindergarten falls at the nine-year rate | SY 2029-30 | 13,253,605 | 7,470,423 | 3,673,634 | 24,397,662 | -5.6% |
| Kindergarten falls at the nine-year rate | SY 2030-31 | 13,059,393 | 7,410,193 | 3,472,403 | 23,941,989 | -7.3% |
| Kindergarten falls at the nine-year rate | SY 2031-32 | 13,023,587 | 7,062,429 | 3,330,786 | 23,416,802 | -9.4% |
| Kindergarten falls at the three-year rate | SY 2026-27 | 14,102,485 | 7,613,646 | 3,566,075 | 25,282,207 | -2.1% |
| Kindergarten falls at the three-year rate | SY 2027-28 | 13,777,767 | 7,795,929 | 3,251,858 | 24,825,554 | -3.9% |
| Kindergarten falls at the three-year rate | SY 2028-29 | 13,409,871 | 7,708,231 | 3,342,048 | 24,460,150 | -5.3% |
| Kindergarten falls at the three-year rate | SY 2029-30 | 13,083,622 | 7,470,423 | 3,673,634 | 24,227,679 | -6.2% |
| Kindergarten falls at the three-year rate | SY 2030-31 | 12,808,595 | 7,410,193 | 3,472,403 | 23,691,190 | -8.3% |
| Kindergarten falls at the three-year rate | SY 2031-32 | 12,678,419 | 7,062,429 | 3,330,786 | 23,071,633 | -10.7% |
The decline is not even from year to year. Total enrollment falls fastest in the first two projected years: by half a million in SY 2026-2027 and by another 360,000 in SY 2027-2028. It then almost stops falling in SY 2028-2029 and SY 2029-2030 before the decline resumes.
The pause comes from the large SY 2018-2019 Grade 1 class, 2.3 million learners, passing through senior high. The decline resumes because the cohorts behind that class are small.
Projected enrollment by grade, SY 2025-2026 to SY 2031-2032
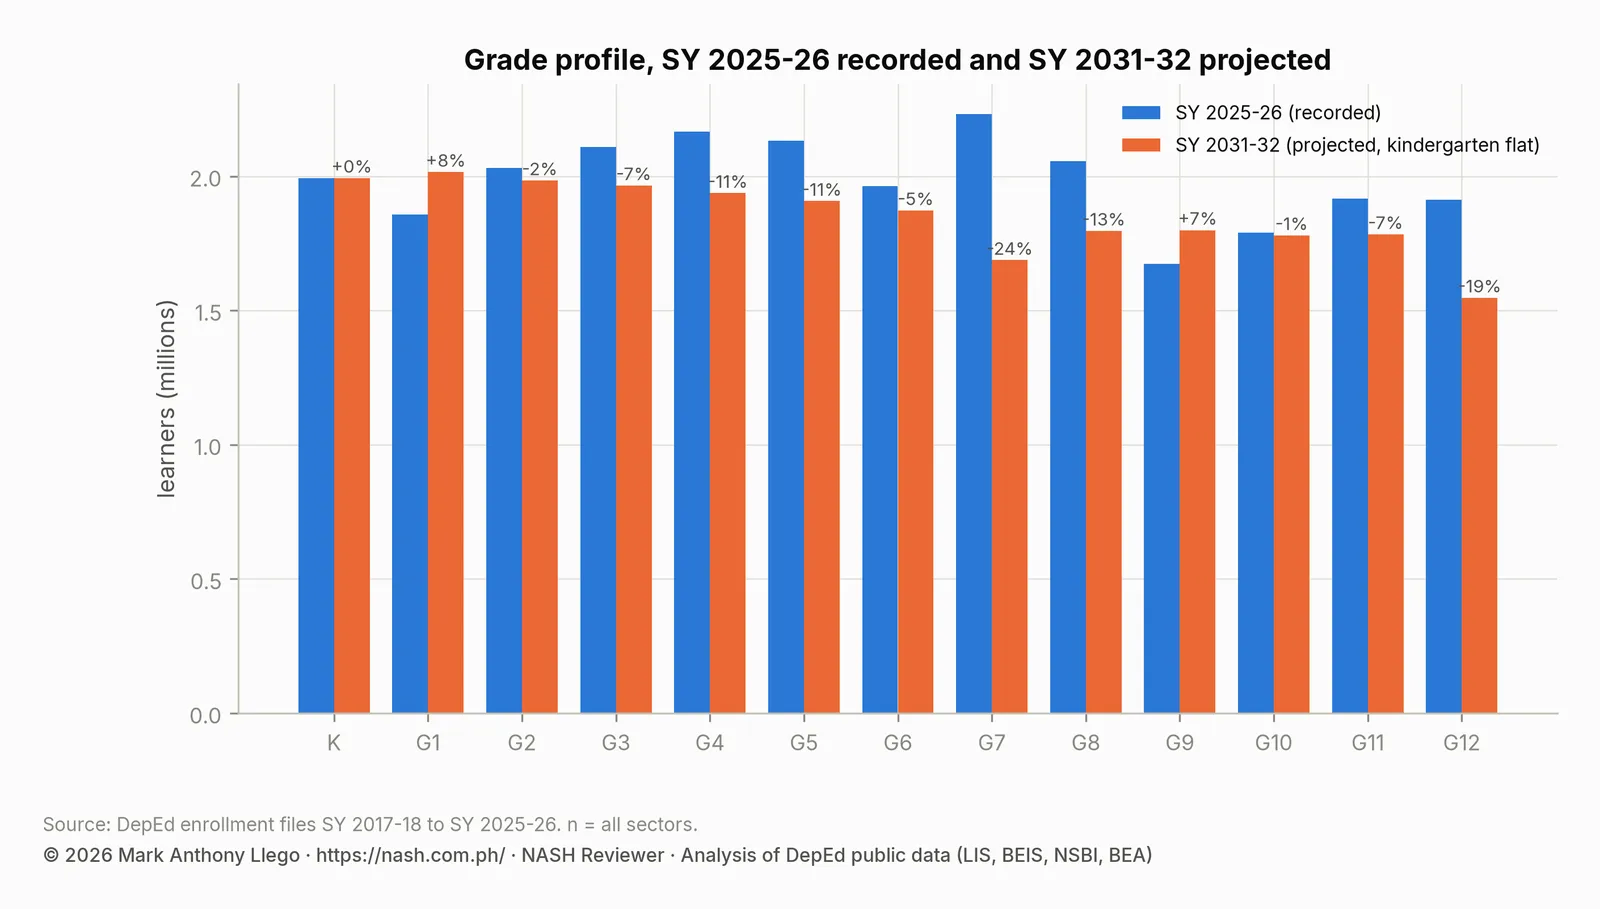
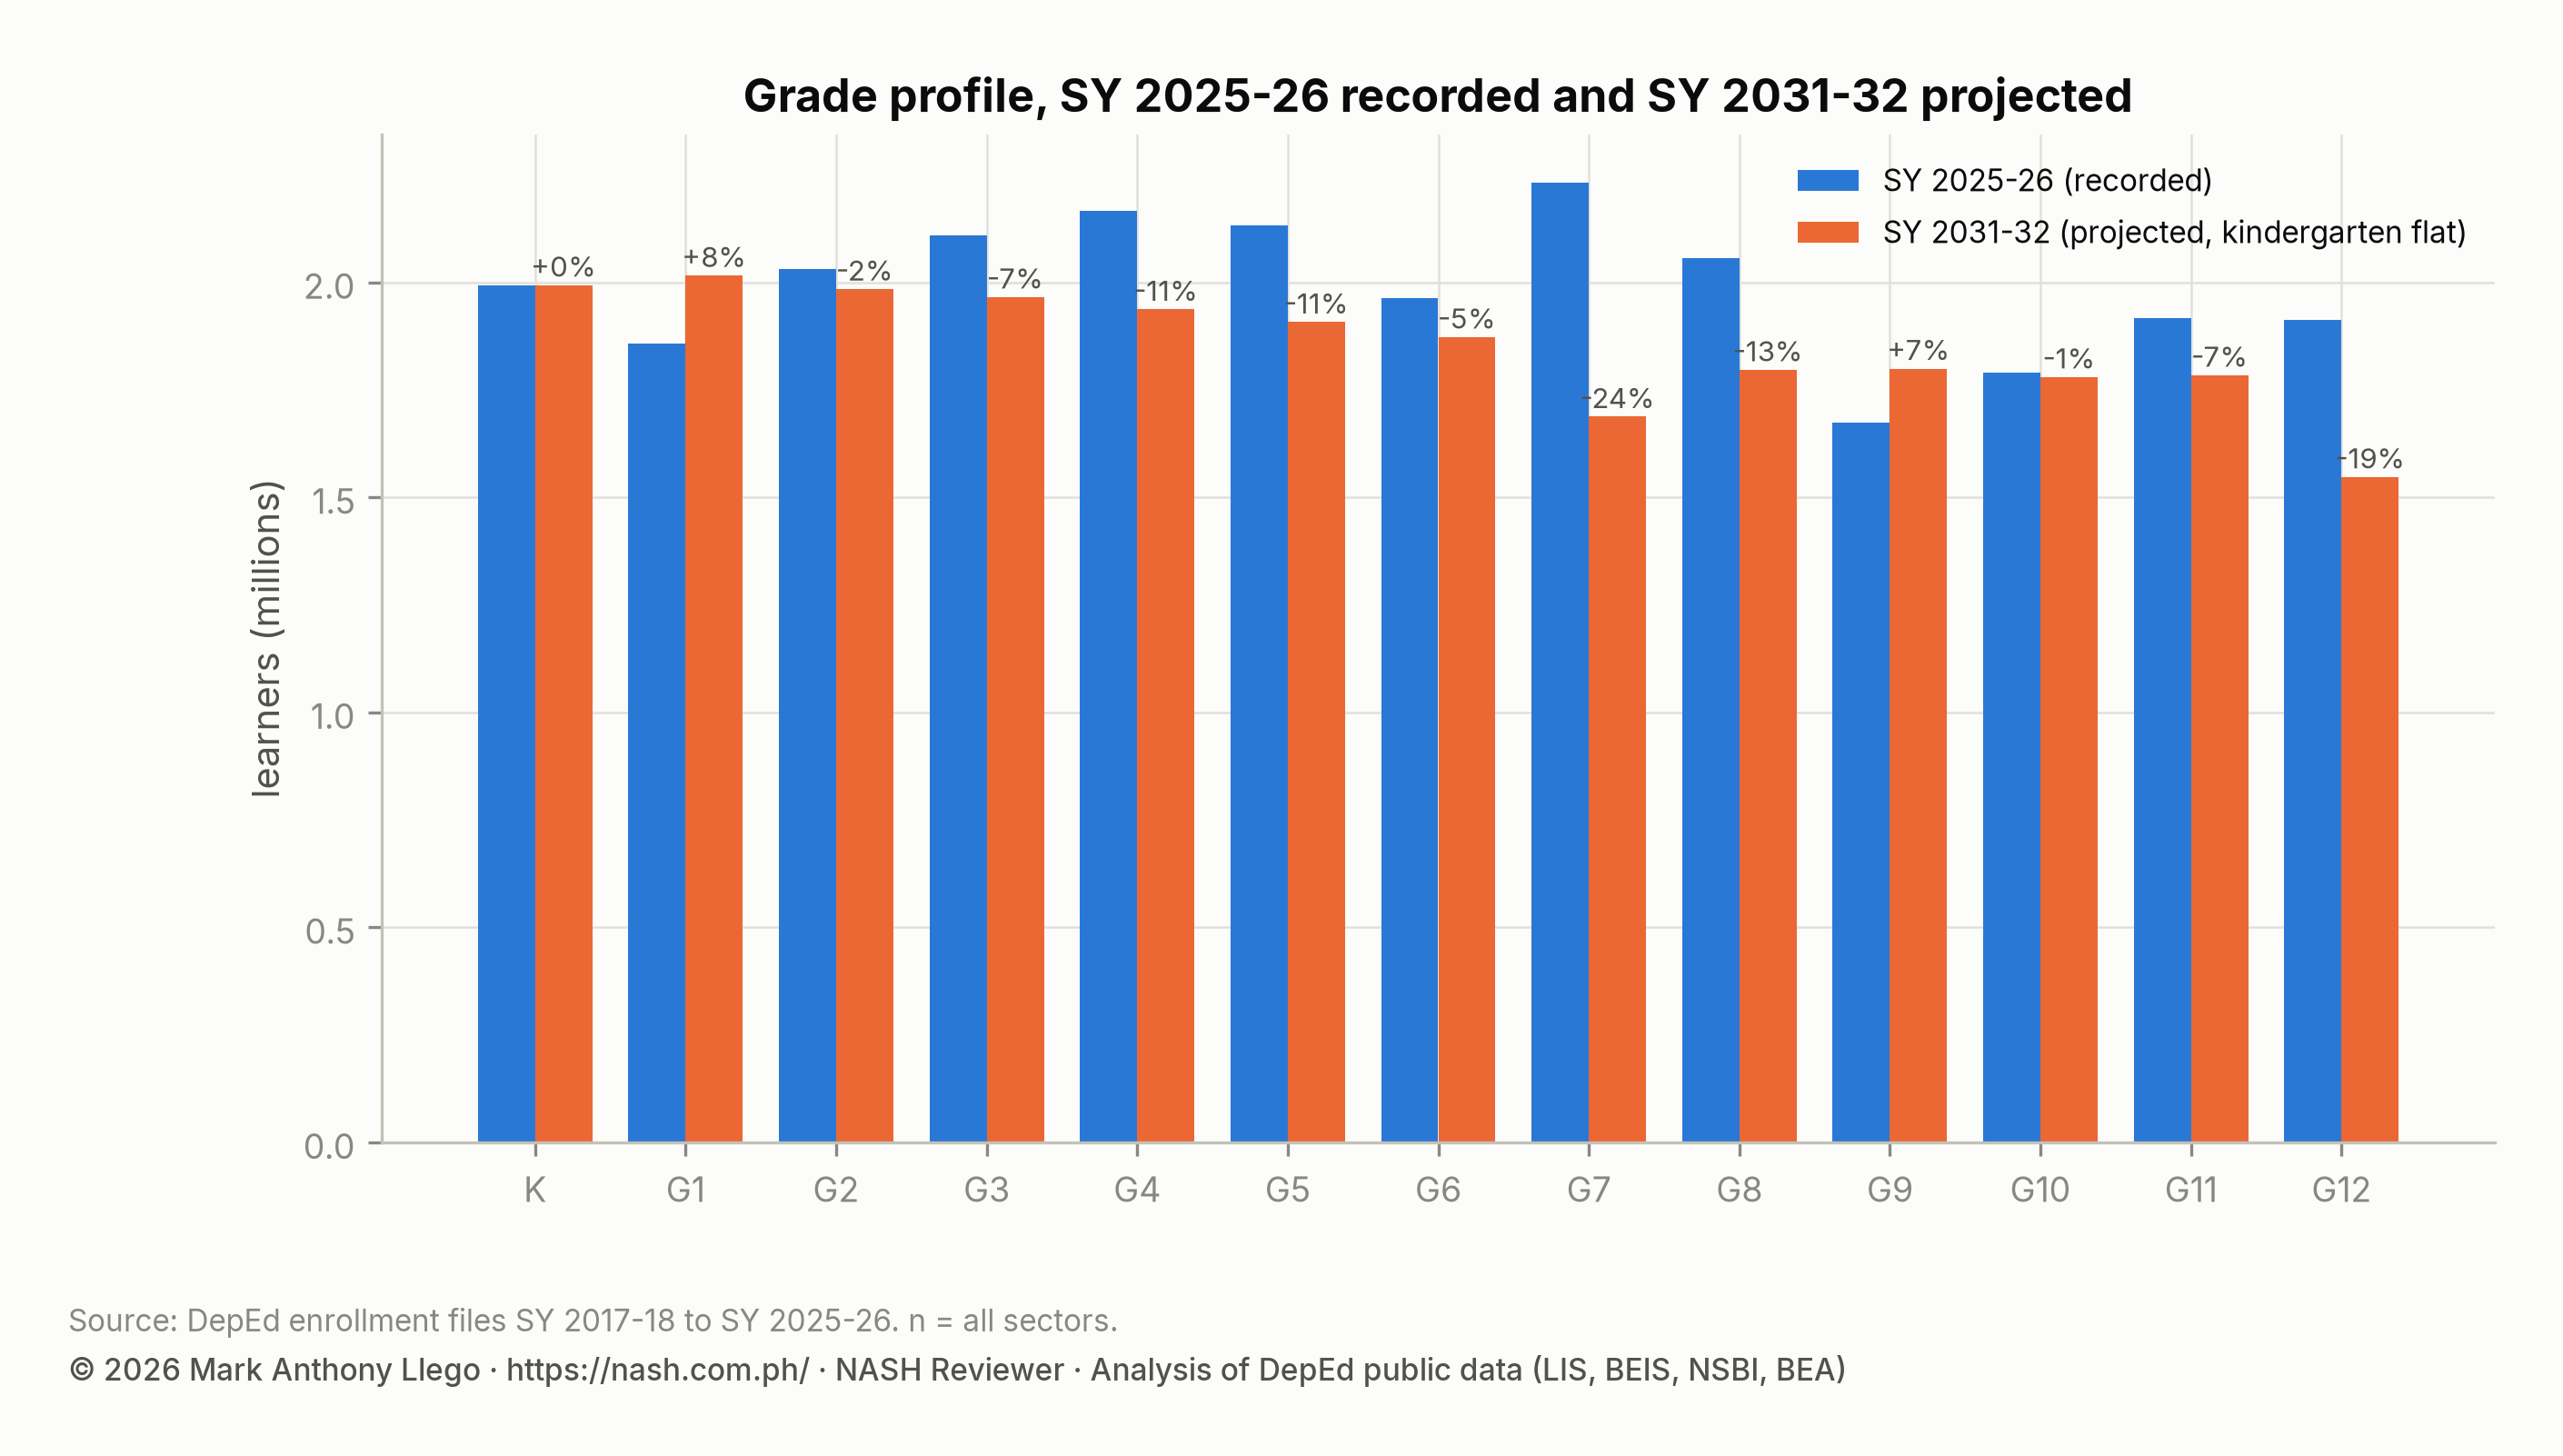
The grade profile in SY 2031-2032 is the current profile moved six grades up. Grade 7 falls from 2.23 million to 1.69 million (−24.4%, or 544,302 learners). It falls because the SY 2031-2032 Grade 7 is this year’s Grade 1, the smallest Grade 1 in the series.
Grade 12 falls from 1.91 million to 1.55 million (−19.1%). Grade 8 falls by 12.7%, and Grades 4 and 5 fall by about 10.5% each.
Two grades rise. Grade 1 rises by 8.5%, because a flat kindergarten of 1.99 million feeds a Grade 1 that is now only 1.86 million. Grade 9 rises by 7.5%, because this year’s Grade 9 is the small Grade 1 class of SY 2017-2018 and the class behind it is larger.
| Grade | SY 2025-26 | SY 2026-27 | SY 2027-28 | SY 2028-29 | SY 2029-30 | SY 2030-31 | SY 2031-32 |
|---|---|---|---|---|---|---|---|
| Kindergarten | 1,993,117 | 1,993,117 | 1,993,117 | 1,993,117 | 1,993,117 | 1,993,117 | 1,993,117 |
| Grade 1 | 1,858,183 | 2,015,373 | 2,015,373 | 2,015,373 | 2,015,373 | 2,015,373 | 2,015,373 |
| Grade 2 | 2,029,668 | 1,829,122 | 1,983,853 | 1,983,853 | 1,983,853 | 1,983,853 | 1,983,853 |
| Grade 3 | 2,108,943 | 2,010,797 | 1,812,115 | 1,965,408 | 1,965,408 | 1,965,408 | 1,965,408 |
| Grade 4 | 2,165,643 | 2,078,229 | 1,981,513 | 1,785,724 | 1,936,785 | 1,936,785 | 1,936,785 |
| Grade 5 | 2,131,958 | 2,132,669 | 2,046,586 | 1,951,342 | 1,758,535 | 1,907,295 | 1,907,295 |
| Grade 6 | 1,963,711 | 2,092,854 | 2,093,552 | 2,009,047 | 1,915,551 | 1,726,280 | 1,872,312 |
| Grade 7 | 2,231,667 | 1,919,444 | 2,045,675 | 2,046,357 | 1,963,758 | 1,872,369 | 1,687,365 |
| Grade 8 | 2,056,457 | 2,140,943 | 1,841,413 | 1,962,513 | 1,963,167 | 1,883,926 | 1,796,252 |
| Grade 9 | 1,674,391 | 1,964,012 | 2,044,701 | 1,758,635 | 1,874,291 | 1,874,916 | 1,799,237 |
| Grade 10 | 1,789,279 | 1,589,247 | 1,864,141 | 1,940,726 | 1,669,207 | 1,778,982 | 1,779,575 |
| Grade 11 | 1,916,843 | 1,793,894 | 1,593,346 | 1,868,949 | 1,945,732 | 1,673,513 | 1,783,571 |
| Grade 12 | 1,912,453 | 1,772,181 | 1,658,511 | 1,473,099 | 1,727,902 | 1,798,890 | 1,547,215 |
Three cohorts can be followed through the table. The small cohort now in Grade 9 (1,674,391 learners) reaches Grade 12 in SY 2028-2029 at 1,473,099. That would be the smallest Grade 12 since SY 2018-2019. The smallest kindergarten class, SY 2024-2025’s 1,827,258, reaches Grade 6 in SY 2030-2031 at 1,726,280.
The large SY 2018-2019 Grade 1 class reaches Grade 12 in SY 2029-2030 at 1,727,902. Senior high schools will see Grade 12 rise by 330,000 learners in one year, between SY 2028-2029 and SY 2029-2030, before enrollment falls again.
Limits of the projection
- The ratios are cross-sectional. They compare a grade this year with the grade below last year across the whole country. They therefore combine promotion, repetition, dropout, late entry, transfers between public and private schools, and migration. They are not DepEd’s cohort survival rates.
- Kindergarten is assumed, not derived. The three scenarios give an upper and a lower bound, but none includes a rise. A rise would require enrollment rates among five-year-olds to climb faster than births fall.
- Private schools are included in the totals and the ratios. The pandemic shift from private to public schools was large and partly reversed; the projection assumes no further shift.
- The senior high ratios include the SY 2025-2026 reclassification. If the Strengthened Senior High School program changes who is counted in Grade 11, the senior high numbers move with it.
- One country-level set of ratios says nothing about regions or divisions. BARMM’s kindergarten intake is growing while Region I’s is falling; the DepEd schools division rankings show where.
What the projection means for aspiring school heads
The National Education Plan 2026-2035 (NatPlan) covers the years to 2035, and the National Assessment for School Heads (NASH) expects a school head to plan beyond the current year. Three implications follow from this arithmetic.
- A junior high principal in SY 2031-2032 will run a Grade 7 about a quarter smaller than today’s. That changes section counts, teacher loading, and the case for new classrooms.
- A senior high principal will see Grade 12 rise in SY 2029-2030 and fall the year after. That argues against permanent capacity for the peak.
- An elementary principal in a province where kindergarten is falling at the three-year rate should expect two or three fewer sections across the school by the end of the decade. That implies consolidation of small schools.
This reasoning belongs to Domain 1 of the Philippine Professional Standards for School Heads (PPSSH), Strand 1.3 (research and data in planning). It also belongs to Domain 2, Strands 2.1 (records) and 2.2 (financial management). The PPSSH Domain 1 guide works through the competency.
Frequently asked questions
How many learners will Philippine basic education have in SY 2031-2032?
Between 23.1 and 24.1 million learners on the cohort-flow projection, against 25.8 million in kindergarten to Grade 12 in SY 2025-2026. The range depends on whether kindergarten stays flat or keeps falling at the recent rate.
Which grades will shrink most by SY 2031-2032?
Grade 7, by about 24%, and Grade 12, by about 19%. Grade 7 falls because this year’s small Grade 1 class reaches it in SY 2031-2032. Grade 1 and Grade 9 are projected to rise.
Is this DepEd’s official enrollment projection?
No. It is a cohort-flow projection from the public enrollment files, using the average SY 2023-2024 to SY 2025-2026 grade-to-grade ratios. DepEd’s planning projections use enrollment rates, population projections, and school-level data that are not public.
Download the data
The cleaned, harmonized DepEd files behind this series are free to download in CSV and Parquet, with a codebook and checksums, under the terms of use set out in the release. Download Cleaned DepEd School Data, SY 2017-18 to 2025-26 documents every file and column. The files themselves are at data.nash.com.ph, starting with the README, the SY 2023-24 school master file (CSV, 8.0 MB) and the nine-year enrollment panel (Parquet, 17.2 MB).
More in this series
- DepEd Enrollment Trends SY 2017-2018 to SY 2025-2026
- Enrollment by school year: SY 2017-18, SY 2018-19, SY 2019-20, SY 2020-21, SY 2021-22, SY 2022-23, SY 2023-24, SY 2024-25, SY 2025-26
- DepEd Schools Division Rankings: Growth and School Inputs
- National Education Plan 2026-2035: Guide for School Heads
- DepEd Data for Aspiring School Heads: Where to Start
- For aspiring school heads: How to Read DepEd Data and the full report, Philippine basic education in numbers
Analysis and charts by Mark Anthony Llego for NASH Reviewer. Data: Department of Education enrollment datasets SY 2017-18 to SY 2025-26 (Learner Information System). Charts may be reused only with written permission from support@nash.com.ph.