DepEd’s SY 2023-2024 facilities data show what public school sites have, what roads lead to them, and how learners reach them. Half of public schools have a permanent fence and 4.8% have a flood marker. Of the 10,609 schools that reported access, 178 can be reached only on foot or by boat.
The data come from the National School Building Inventory (NSBI). The NSBI asks every public school a set of questions that the classroom counts in the SY 2023-2024 facilities report do not cover. It asks whether the site has a gate, a fence, a flood marker, a playground, a covered court, or a solar panel.
It also asks what kind of road leads to the school and by which means a person can get there: a four-wheel vehicle, a habal-habal, a boat, or on foot.
These questions describe the school as a place rather than as a set of rooms. Strand 2.5 of the Philippine Professional Standards for School Heads (PPSSH) covers “school safety for disaster preparedness, mitigation and resiliency”. The questions record what that strand expects a school head to know about the site. They also point to the Last Mile Schools that the Second Congressional Commission on Education (EDCOM II) Final Report and the National Education Plan single out.
Two caveats apply to the numbers. All 47,813 public schools with learners and facilities data reported the site features. Only 10,609 schools, about one in five, answered the road and access questions, and they are not a cross-section of public schools.
Among the reporting schools, 71.5% offer senior high school, against 17.7% of all public schools. Their median enrollment is 498 against 232. The access section therefore indicates where hard-to-reach schools are, and it certainly undercounts small elementary schools.
Site features of public schools: gates, fences and flood markers
| Feature | Schools reporting | Schools with it | Share of reporting schools | Share of their learners |
|---|---|---|---|---|
| Flood marker | 47,813 | 2,287 | 4.8% | 7.3% |
| Entrance gate | 47,813 | 42,747 | 89.4% | 95.3% |
| Exit gate | 47,813 | 28,670 | 60.0% | 77.0% |
| Permanent perimeter fence | 47,813 | 23,716 | 49.6% | 70.7% |
| Temporary perimeter fence | 47,813 | 28,450 | 59.5% | 43.4% |
| Covered court | 47,813 | 18,169 | 38.0% | 59.8% |
| Gymnasium | 47,813 | 2,107 | 4.4% | 9.1% |
| Playground | 47,813 | 32,813 | 68.6% | 60.3% |
| Garden | 47,813 | 42,540 | 89.0% | 91.2% |
| Solar panel | 47,813 | 6,750 | 14.1% | 14.0% |
| Bike rack | 47,813 | 776 | 1.6% | 4.8% |
| Paved pathway | 47,813 | 18,447 | 38.6% | 47.8% |
| Covered pathway | 47,813 | 6,457 | 13.5% | 24.2% |
Almost every public school has an entrance gate (89.4%) and a garden (89.0%). About two thirds have a playground (68.6%) and an exit gate (60.0%). Half have a permanent perimeter fence (49.6%) and six in ten a temporary one (59.5%); the two overlap in schools that have fenced part of the site.
A covered court serves as an assembly ground, a gymnasium and an evacuation shelter. 38.0% of schools have one, and 4.4% have a gymnasium. Solar panels are on 14.1% of schools and bike racks on 1.6%. Only 4.8% of schools have a flood marker, the painted gauge that DepEd’s disaster-risk guidelines ask flood-prone schools to install.
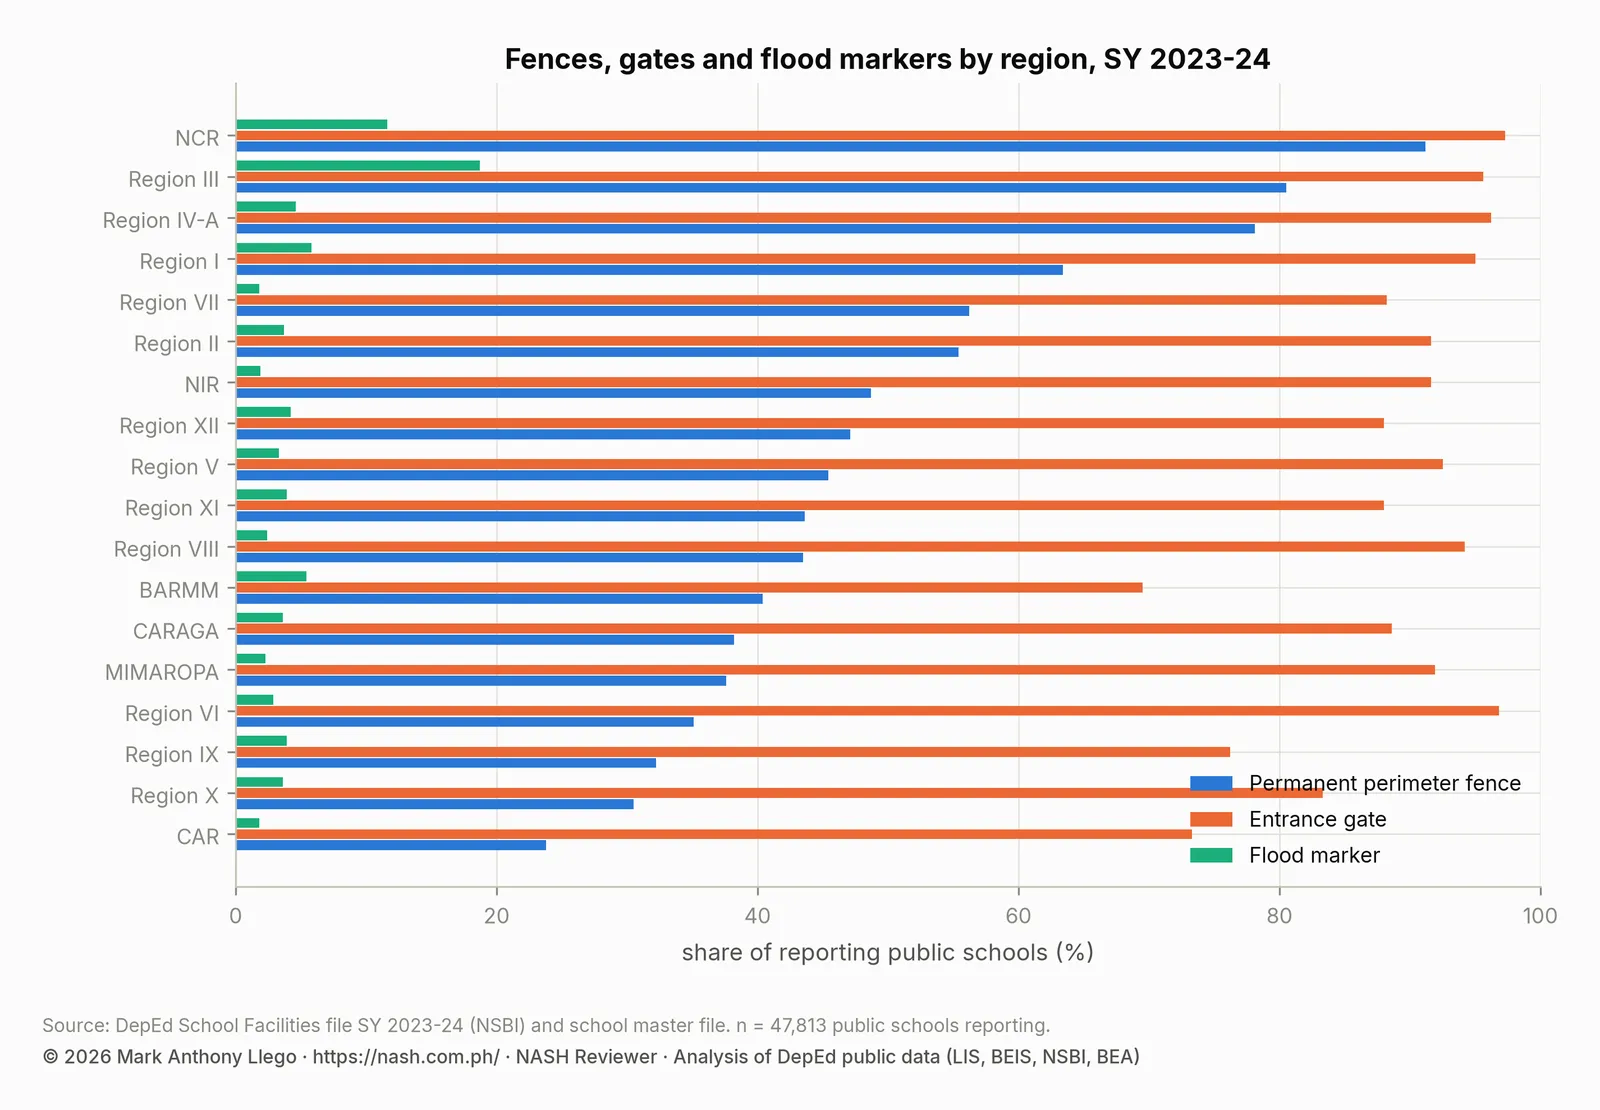
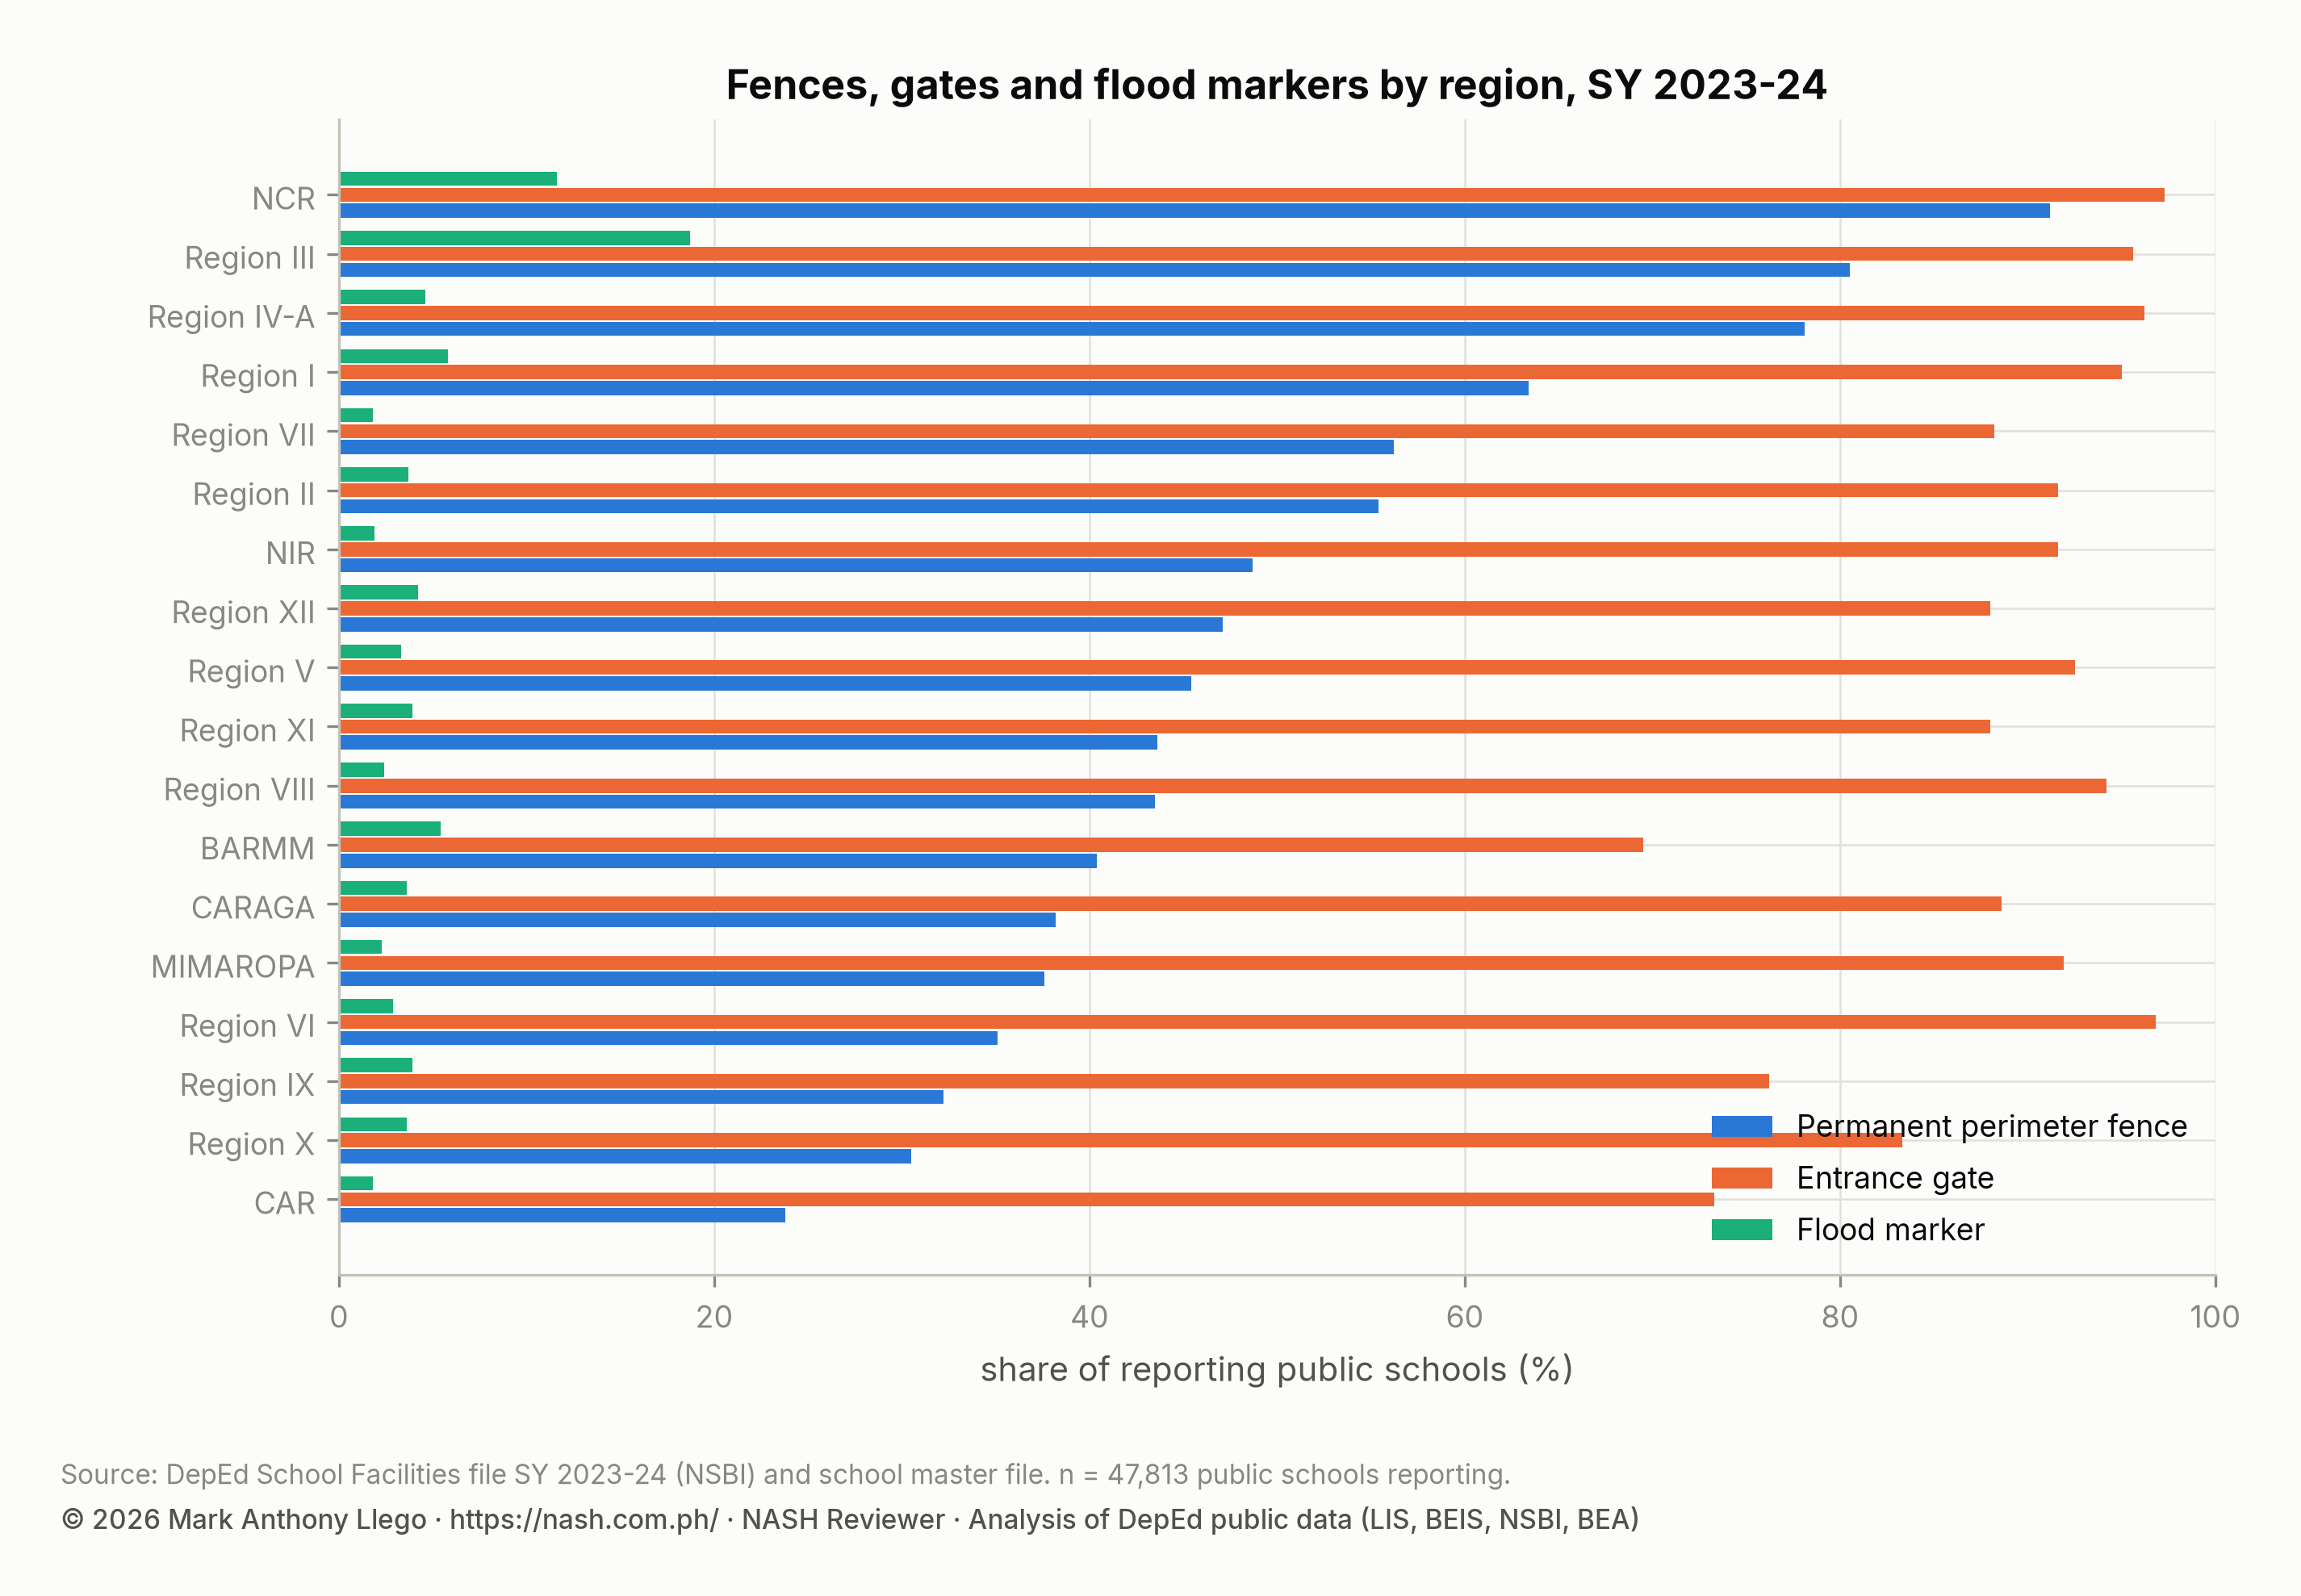
| Region | Schools reporting | Flood marker | Permanent perimeter fence | Entrance gate | Covered court | Playground | Solar panel |
|---|---|---|---|---|---|---|---|
| BARMM | 2,155 | 5.4% | 40.4% | 69.5% | 20.8% | 74.4% | 33.5% |
| CAR | 1,844 | 1.8% | 23.8% | 73.3% | 27.9% | 81.8% | 13.2% |
| CARAGA | 2,098 | 3.6% | 38.2% | 88.6% | 18.5% | 80.1% | 10.7% |
| MIMAROPA | 2,382 | 2.3% | 37.6% | 91.9% | 31.8% | 79.9% | 29.2% |
| NCR | 827 | 11.6% | 91.2% | 97.3% | 61.5% | 25.9% | 15.1% |
| NIR | 2,231 | 1.9% | 48.7% | 91.6% | 27.3% | 74.0% | 7.0% |
| Region I | 2,861 | 5.8% | 63.4% | 95.0% | 68.3% | 65.5% | 12.1% |
| Region II | 2,539 | 3.7% | 55.4% | 91.6% | 37.1% | 79.8% | 10.3% |
| Region III | 3,729 | 18.7% | 80.5% | 95.6% | 74.3% | 43.0% | 13.3% |
| Region IV-A | 3,564 | 4.6% | 78.1% | 96.2% | 63.4% | 48.9% | 15.9% |
| Region IX | 2,993 | 3.9% | 32.2% | 76.2% | 30.4% | 74.9% | 19.3% |
| Region V | 3,862 | 3.3% | 45.4% | 92.5% | 27.4% | 77.2% | 14.1% |
| Region VI | 2,835 | 2.9% | 35.1% | 96.8% | 45.7% | 80.9% | 8.6% |
| Region VII | 2,810 | 1.8% | 56.2% | 88.2% | 22.1% | 62.6% | 4.9% |
| Region VIII | 4,179 | 2.4% | 43.5% | 94.2% | 14.4% | 74.5% | 8.9% |
| Region X | 2,531 | 3.6% | 30.5% | 83.3% | 28.5% | 63.8% | 11.2% |
| Region XI | 2,218 | 3.9% | 43.6% | 88.0% | 44.0% | 59.0% | 21.6% |
| Region XII | 2,155 | 4.2% | 47.1% | 88.0% | 38.4% | 78.5% | 12.4% |
| Philippines (public) | 47,813 | 4.8% | 49.6% | 89.4% | 38.0% | 68.6% | 14.1% |
The regional order follows regional wealth. NCR’s schools have a permanent fence in 91.2% of cases, Region III’s in 80.5% and Region IV-A’s in 78.1%. CAR’s schools have one in 23.8%, Region X’s in 30.5% and Region IX’s in 32.2%.
Covered courts follow the same order: 74.3% of schools in Region III and 68.3% in Region I have one. Only 14.4% in Region VIII and 18.5% in CARAGA do.
Flood markers are most common in Region III (18.7%), which holds the Pampanga River basin, and in NCR (11.6%). They are below 4% in most of the Visayas and Mindanao.
Solar panels show the reverse order: 33.5% of schools in BARMM and 29.2% in MIMAROPA have one, against 4.9% in Region VII. Off-grid schools are where panels are needed. BARMM also has the lowest gate coverage, 69.5%.
| Learners in school | Schools reporting | Flood marker | Permanent perimeter fence | Entrance gate | Covered court | Playground | Solar panel |
|---|---|---|---|---|---|---|---|
| 1–100 | 8,530 | 2.2% | 25.8% | 77.0% | 12.7% | 68.4% | 17.4% |
| 101–200 | 12,528 | 3.8% | 38.3% | 87.3% | 27.8% | 72.9% | 13.9% |
| 201–500 | 15,288 | 5.0% | 53.4% | 92.6% | 41.2% | 71.7% | 13.5% |
| 501–1,000 | 6,185 | 6.8% | 68.5% | 96.0% | 57.1% | 65.5% | 12.4% |
| over 1,000 | 5,282 | 8.2% | 81.7% | 97.5% | 71.3% | 53.6% | 13.1% |
School size matters as much as region. A permanent fence surrounds 25.8% of schools with 100 learners or fewer and 81.7% of schools with more than 1,000. A covered court exists in 12.7% of the smallest schools and 71.3% of the largest. A playground is the one feature small schools are more likely to have: 68.4% of the smallest schools have one, against 53.6% of the largest.
Roads and transport to the schools that answered
| Road to the school | Schools with road data | Share with this road |
|---|---|---|
| Paved road | 10,553 | 84.4% |
| Unpaved road | 10,553 | 28.5% |
| Levelled road | 10,553 | 42.7% |
| Rough road | 10,553 | 34.7% |
| Road under construction | 10,553 | 13.2% |
Of the 10,553 schools that reported their road, 84.4% are on a paved road. An unpaved road leads to 28.5%, a rough road to 34.7%, and a road under construction to 13.2%. Many schools ticked more than one answer because the road changes along the way.
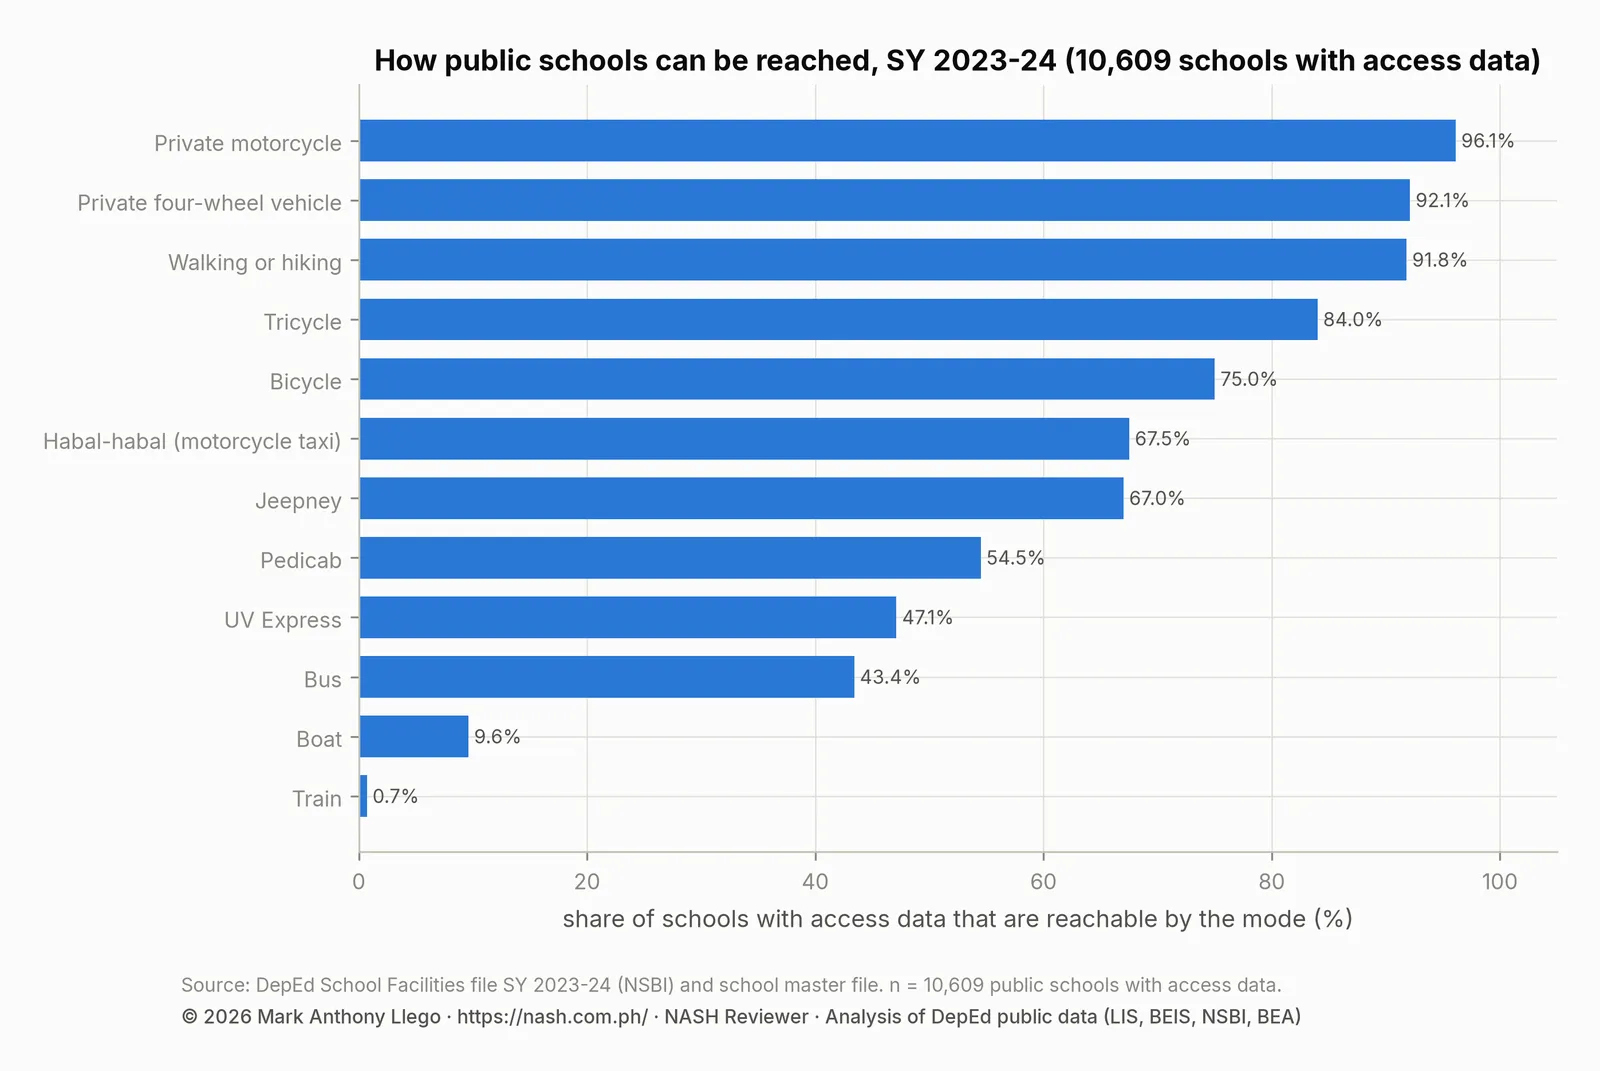
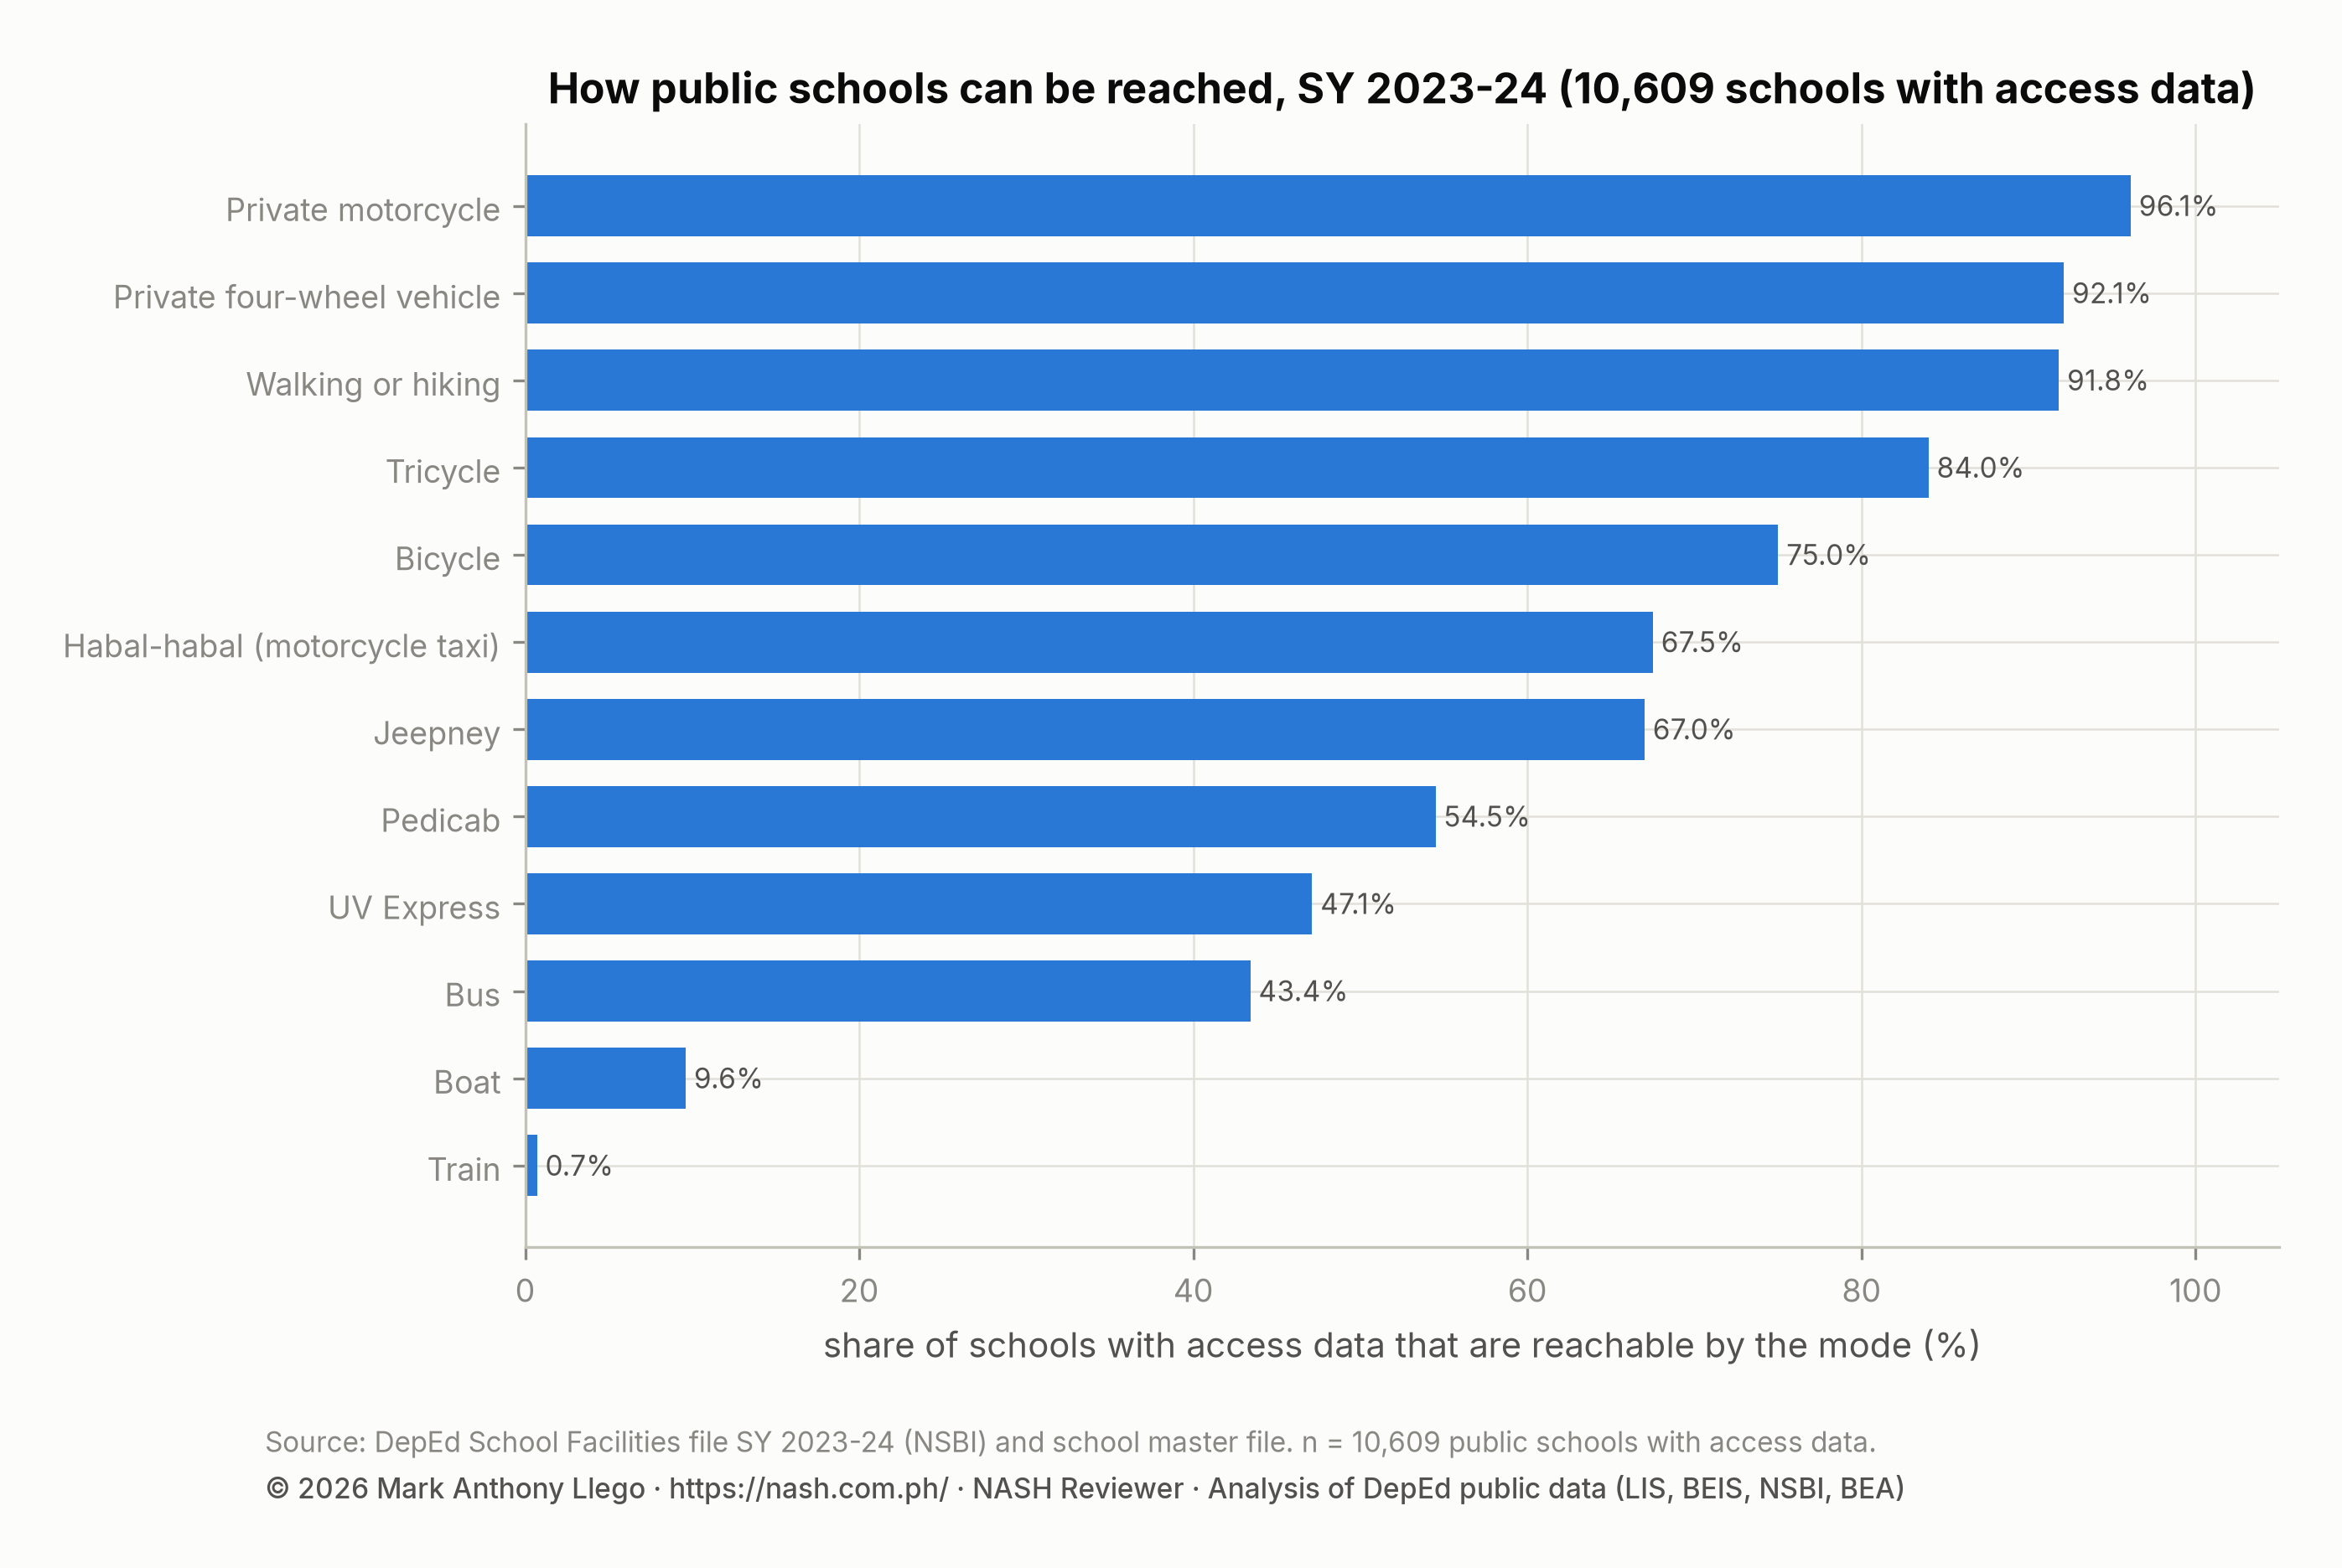
| Reachable by | Schools with access data | Share of reporting schools | Learners in those schools |
|---|---|---|---|
| Private motorcycle | 10,609 | 96.1% | 9,724,039 |
| Private four-wheel vehicle | 10,609 | 92.1% | 9,595,020 |
| Walking or hiking | 10,609 | 91.8% | 9,244,741 |
| Tricycle | 10,609 | 84.0% | 9,248,512 |
| Bicycle | 10,609 | 75.0% | 8,236,999 |
| Habal-habal (motorcycle taxi) | 10,609 | 67.5% | 6,199,621 |
| Jeepney | 10,609 | 67.0% | 7,826,717 |
| Pedicab | 10,609 | 54.5% | 6,565,165 |
| UV Express | 10,609 | 47.1% | 5,572,555 |
| Bus | 10,609 | 43.4% | 5,422,068 |
| Boat | 10,609 | 9.6% | 644,623 |
| Train | 10,609 | 0.7% | 131,884 |
A private motorcycle reaches 96.1% of the reporting schools and a four-wheel vehicle 92.1%; 91.8% can be reached on foot. The modes a learner without a vehicle uses reach fewer schools.
A tricycle reaches 84.0%, a jeepney 67.0% and a bus 43.4%. A habal-habal, the motorcycle taxi of rural Mindanao and the Visayas, reaches 67.5%. A boat reaches 9.6% of the reporting schools, which hold 644,623 learners, and a train 0.7%.
Schools reached only on foot or by boat
| Region | Schools with access data | Only on foot or by boat | Not reachable by a four-wheel vehicle | Reachable by boat | Reachable on foot | Reachable by habal-habal | Learners in foot-or-boat-only schools | Median size of those schools |
|---|---|---|---|---|---|---|---|---|
| Region VIII | 639 | 4.4% | 15.6% | 24.1% | 96.6% | 91.7% | 8,272 | 250 |
| MIMAROPA | 472 | 4.2% | 13.6% | 21.4% | 93.9% | 48.7% | 5,198 | 173 |
| CARAGA | 473 | 4.2% | 9.5% | 17.3% | 89.0% | 87.5% | 3,755 | 186 |
| Region V | 780 | 2.8% | 12.8% | 23.1% | 93.8% | 86.2% | 8,310 | 338 |
| CAR | 369 | 2.7% | 4.3% | 1.1% | 95.4% | 32.8% | 1,210 | 129 |
| Region VI | 572 | 2.3% | 6.8% | 8.0% | 98.1% | 82.2% | 3,320 | 241 |
| BARMM | 302 | 2.0% | 8.3% | 15.6% | 91.4% | 69.9% | 2,888 | 350 |
| Region VII | 758 | 1.5% | 7.0% | 8.2% | 71.9% | 94.5% | 3,620 | 262 |
| Region III | 910 | 1.4% | 3.2% | 5.4% | 86.2% | 16.8% | 2,942 | 229 |
| Region XI | 636 | 1.4% | 10.1% | 3.8% | 94.0% | 90.4% | 1,666 | 127 |
| Region IX | 526 | 1.3% | 9.1% | 11.4% | 94.1% | 91.3% | 2,534 | 282 |
| Region XII | 644 | 0.6% | 9.2% | 3.3% | 93.3% | 95.8% | 1,057 | 244 |
| Region X | 652 | 0.6% | 4.6% | 2.1% | 93.4% | 91.7% | 399 | 88 |
| Region II | 515 | 0.6% | 3.7% | 9.5% | 92.2% | 29.7% | 332 | 139 |
| NIR | 546 | 0.5% | 5.9% | 3.7% | 92.7% | 79.9% | 816 | 292 |
| Region IV-A | 880 | 0.3% | 4.4% | 7.7% | 95.6% | 34.3% | 818 | 155 |
| Region I | 604 | 0.3% | 1.8% | 5.0% | 93.9% | 39.9% | 502 | 251 |
| NCR | 331 | 0.0% | 0.6% | 2.7% | 94.3% | 56.5% | 0 |
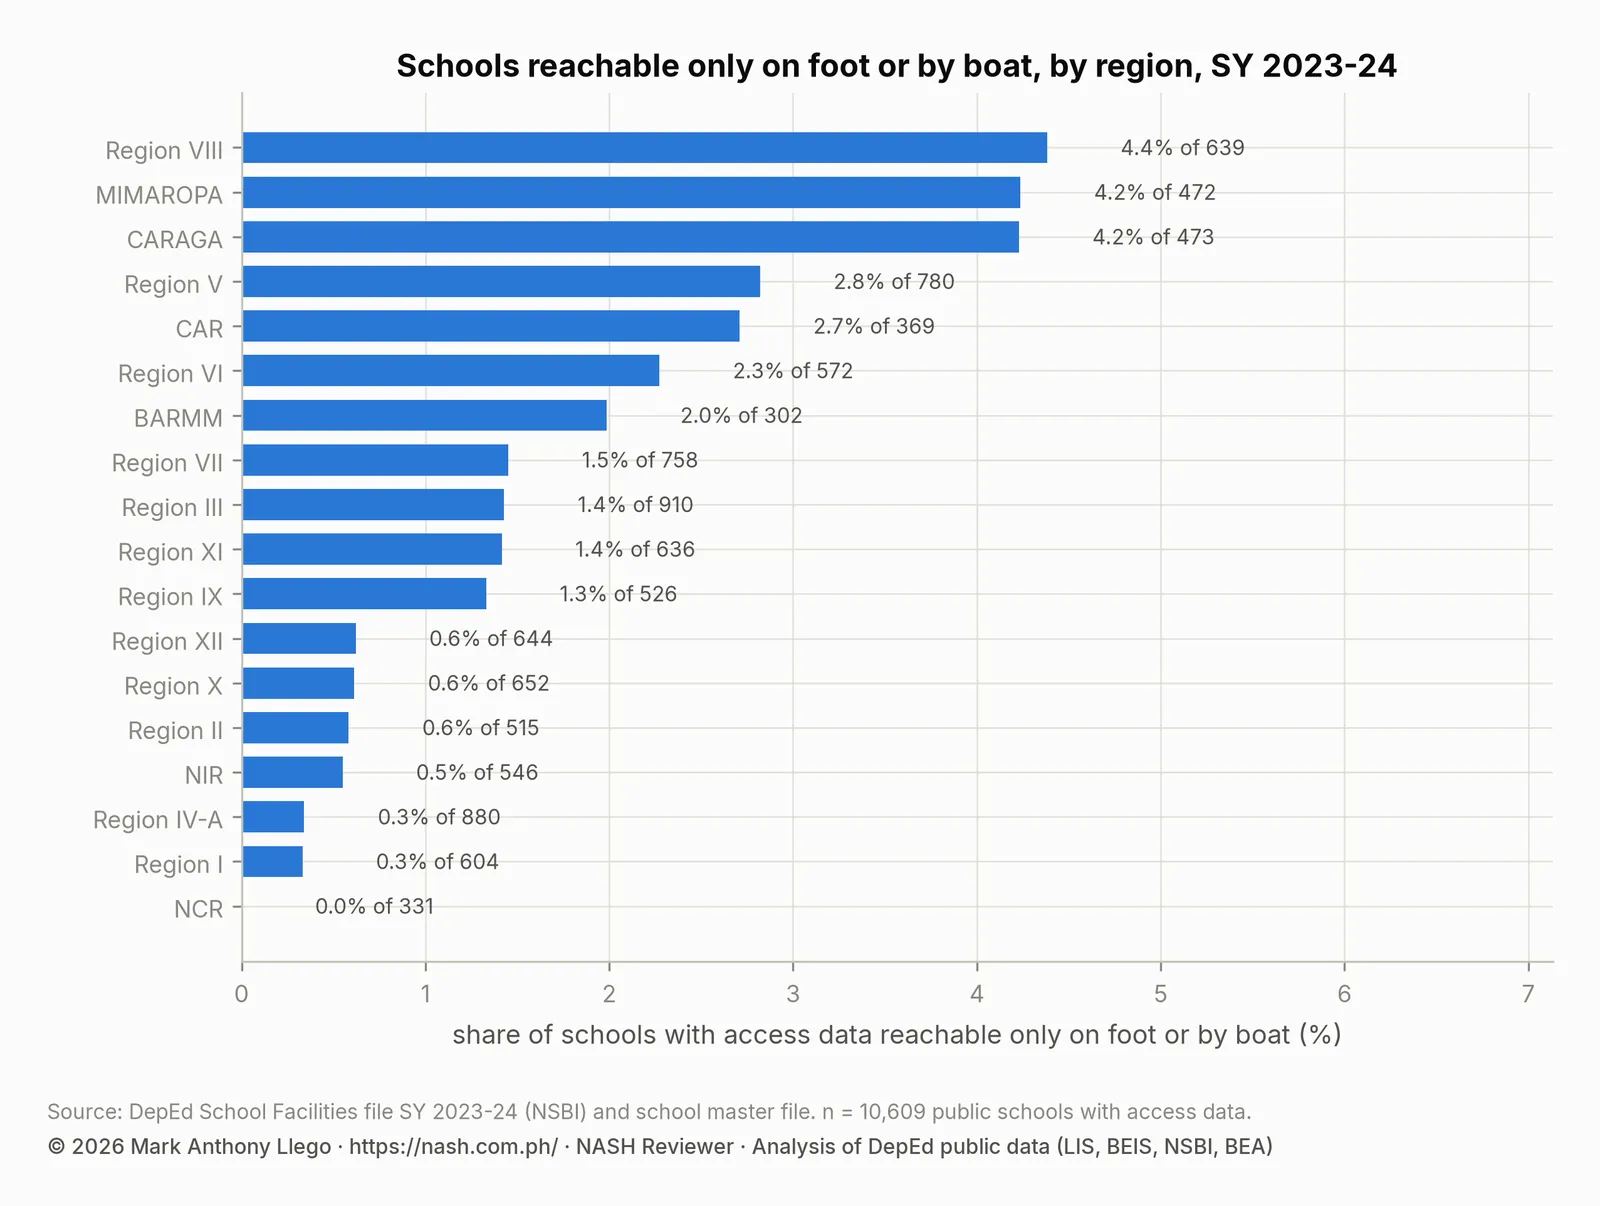
Among the 10,609 reporting schools, 178 (1.7%) cannot be reached by any motor vehicle, only on foot or by boat. They hold 47,639 learners and have a median enrollment of 216. Another 780 or so cannot be reached by a four-wheel vehicle but can be reached by motorcycle.
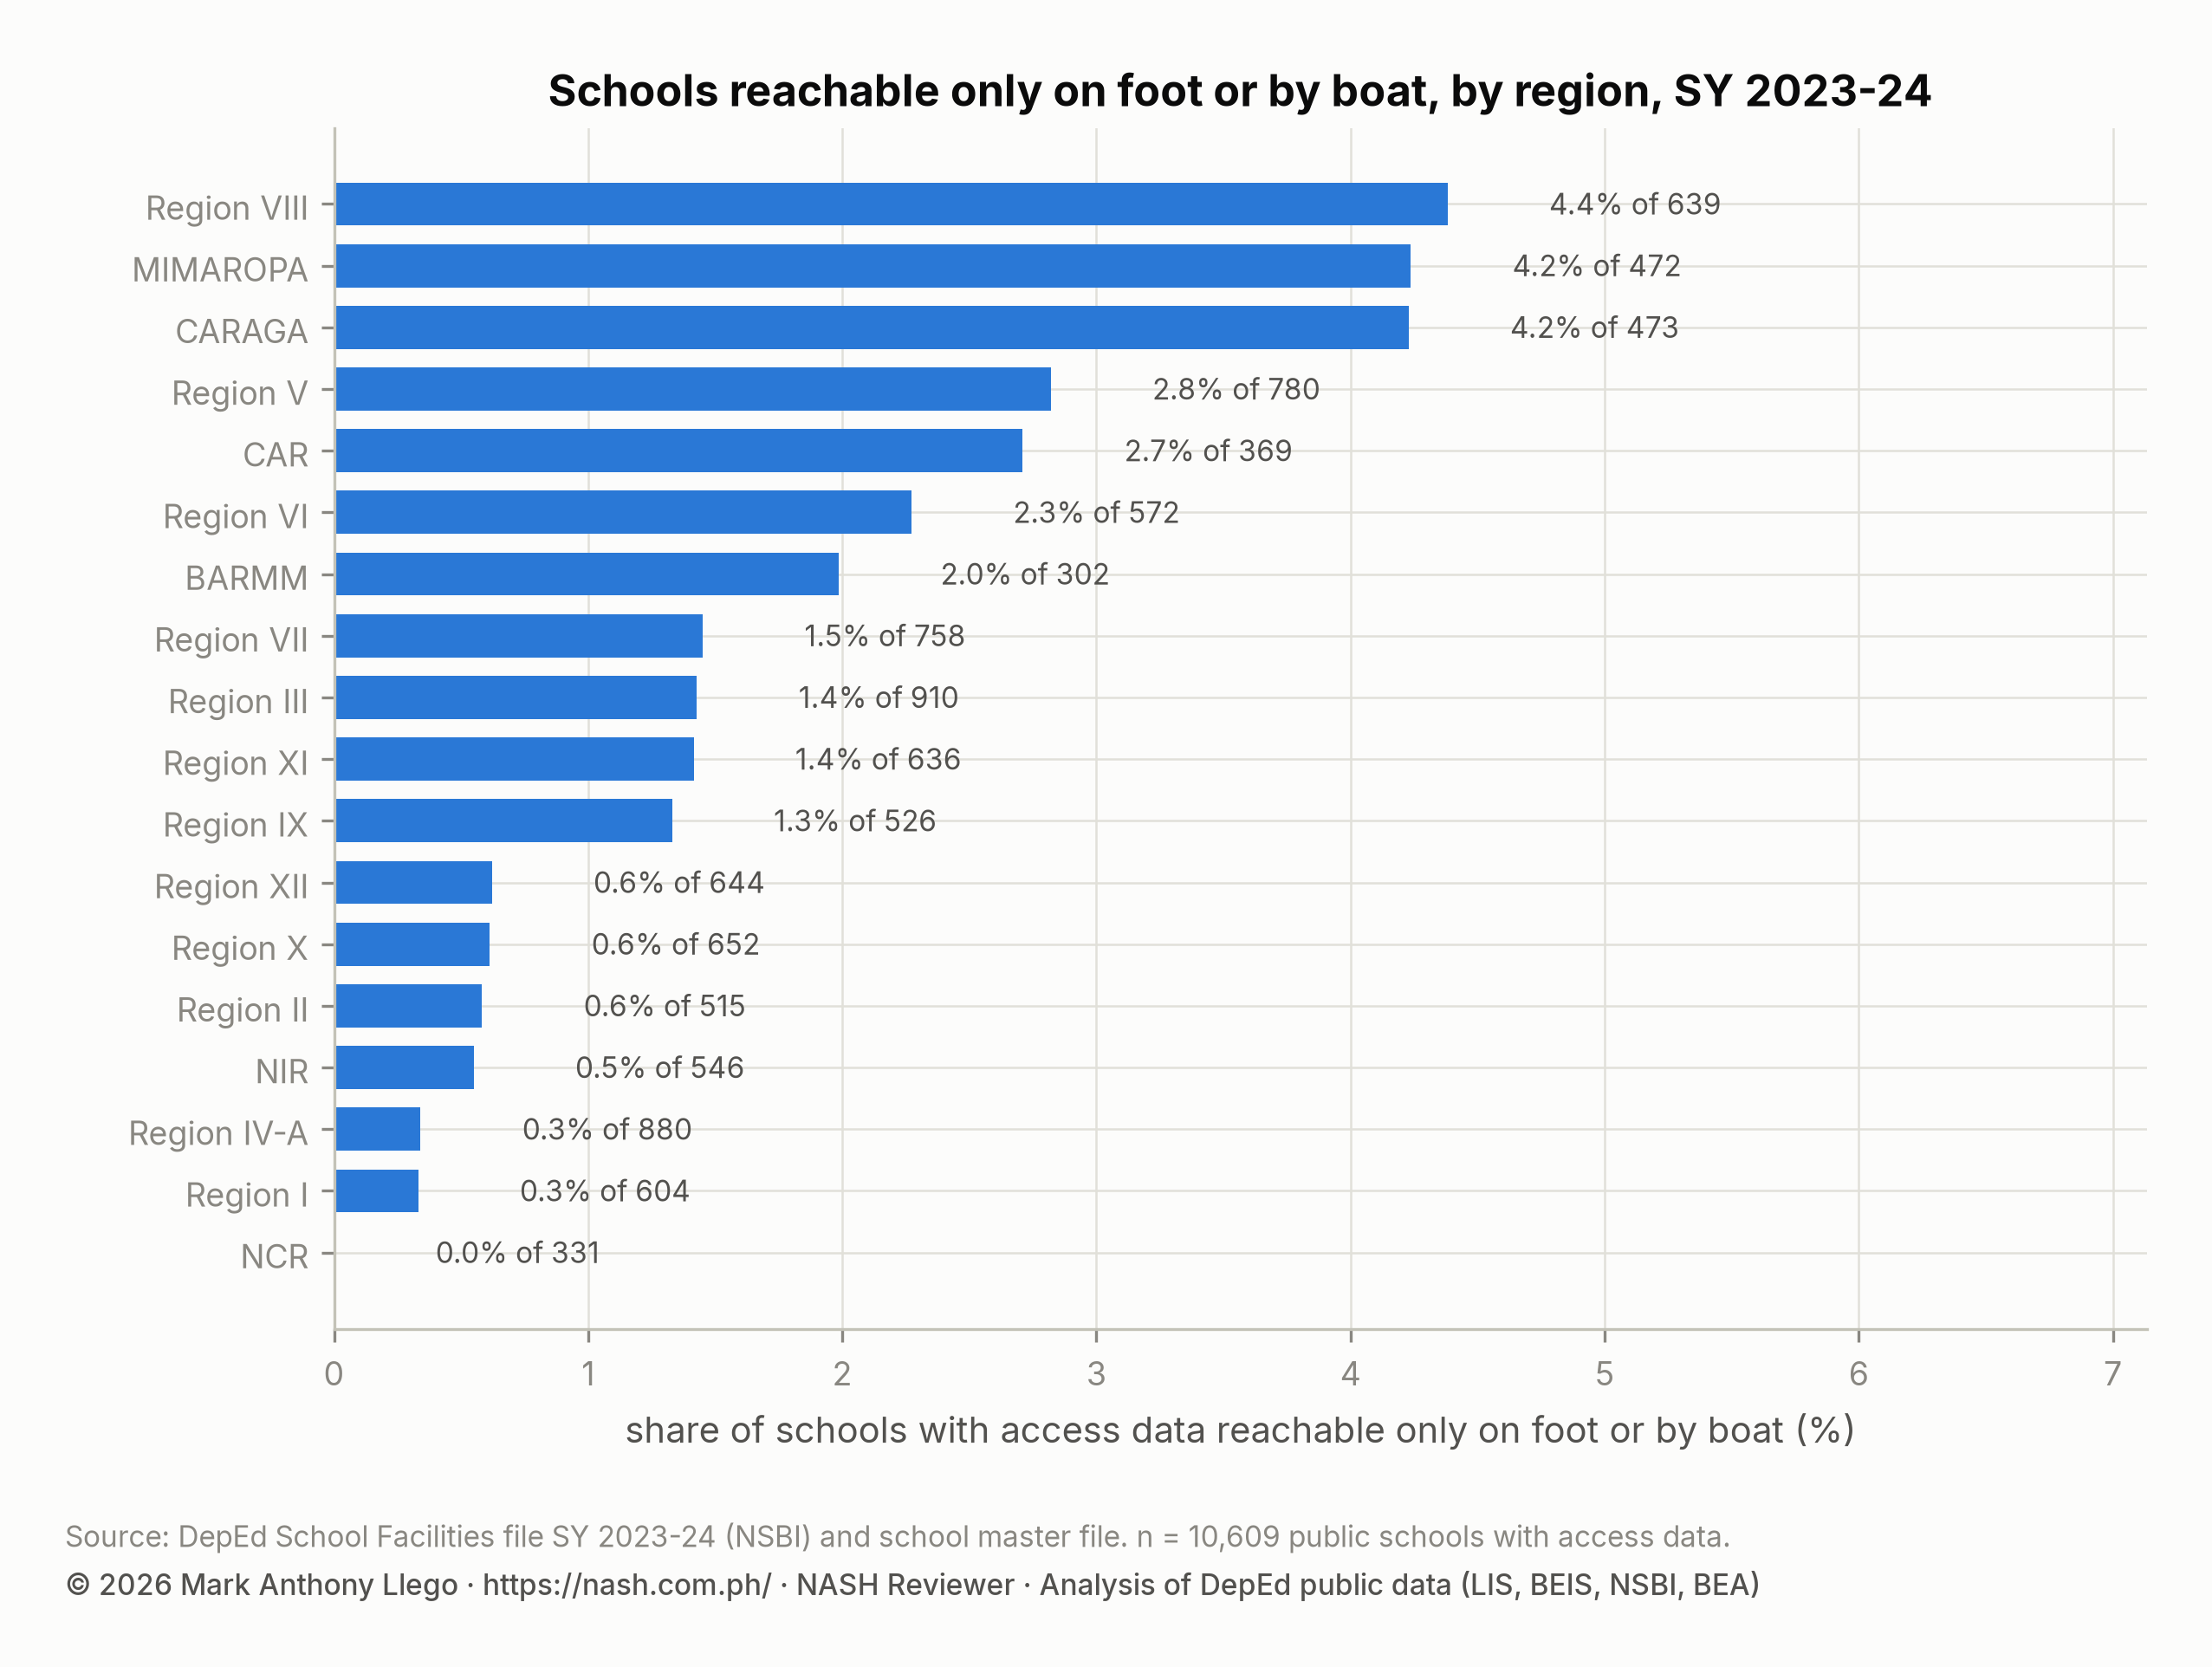
Region VIII (4.4% of its reporting schools), MIMAROPA (4.2%) and CARAGA (4.2%) have the highest shares. Region V follows at 2.8%. By division, Samar has 16 such schools, Palawan 14 and Camarines Sur 10; the table below lists the rest.
A boat reaches 24.1% of Region VIII’s reporting schools, 23.1% of Region V’s and 21.4% of MIMAROPA’s. The reporting schools are mostly large secondary schools, so the true number of foot-or-boat-only public schools is certainly a multiple of 178. What the file shows is where they are.
| Division | Region | Schools with access data | Only on foot or by boat | Learners in them |
|---|---|---|---|---|
| Samar (Western Samar) | Region VIII | 102 | 16 | 4,700 |
| Palawan | MIMAROPA | 176 | 14 | 3,159 |
| Camarines Sur | Region V | 231 | 10 | 4,100 |
| Iloilo | Region VI | 251 | 8 | 2,153 |
| Bohol | Region VII | 202 | 7 | 2,550 |
| Surigao City | CARAGA | 22 | 6 | 1,035 |
| Pampanga | Region III | 122 | 5 | 1,170 |
| Northern Samar | Region VIII | 87 | 5 | 1,224 |
| Tawi-Tawi | BARMM | 24 | 5 | 2,600 |
| Davao City | Region XI | 174 | 5 | 581 |
| Dinagat Island | CARAGA | 34 | 4 | 621 |
| Eastern Samar | Region VIII | 61 | 4 | 747 |
| Masbate | Region V | 156 | 4 | 1,411 |
| Surigao del Norte | CARAGA | 40 | 4 | 952 |
| Kalinga | CAR | 34 | 4 | 568 |
| Oriental Mindoro | MIMAROPA | 104 | 3 | 356 |
| Siargao | CARAGA | 25 | 3 | 481 |
| Lapu-Lapu City | Region VII | 28 | 3 | 619 |
| Sarangani | Region XII | 135 | 3 | 989 |
| Occidental Mindoro | MIMAROPA | 54 | 3 | 1,683 |
The 178 schools match the Last Mile Schools described in the policy literature. A permanent fence surrounds 24.2% of them, against 55.3% of the other reporting schools. An internet connection exists in 47.2% against 85.3%. Electricity reaches 92.1% against 97.6%.
Multigrade classes are held in 7.3% of the 178 schools against 1.3% of the others. Their learner-teacher ratio is lower, a median of 20.1 against 22.7, because they are small.
The National Education Plan’s Recommendation 2.1.1 sets a target of 9,542 Last Mile School classrooms, half of them by 2028. It also asks DepEd to “rationalize the definition and classification of Last-Mile Schools”. A list built from the access columns of this file, if every school filled them in, would be a start.
Classes held in makeshift rooms and temporary learning spaces
| Region | Classes in makeshift rooms | Schools with such classes | Classes in temporary learning spaces |
|---|---|---|---|
| BARMM | 2,687 | 15.6% | 910 |
| CAR | 1,357 | 8.3% | 363 |
| CARAGA | 1,473 | 15.2% | 789 |
| MIMAROPA | 1,820 | 6.2% | 412 |
| NCR | 496 | 3.9% | 185 |
| NIR | 1,751 | 7.0% | 456 |
| Region I | 700 | 5.2% | 503 |
| Region II | 797 | 6.2% | 352 |
| Region III | 1,273 | 5.3% | 469 |
| Region IV-A | 2,117 | 6.8% | 652 |
| Region IX | 2,293 | 11.0% | 874 |
| Region V | 2,335 | 14.6% | 1,207 |
| Region VI | 1,807 | 6.1% | 504 |
| Region VII | 2,003 | 9.9% | 717 |
| Region VIII | 2,391 | 6.6% | 675 |
| Region X | 2,232 | 8.5% | 600 |
| Region XI | 2,273 | 14.3% | 1,320 |
| Region XII | 3,024 | 21.3% | 1,395 |
The facilities file also records how many classes a school holds in makeshift rooms and temporary learning spaces, not only how many such rooms it has. In SY 2023-2024, 32,829 classes in 11,405 public schools met in makeshift rooms. Another 12,383 classes in 4,495 schools met in temporary learning spaces.
Region XII has the highest share of schools with classes in makeshift rooms, 21.3%, followed by BARMM (15.6%) and CARAGA (15.2%). NCR has the lowest share, 3.9%. These are the classes that the plan’s 40,000 new classrooms by 2028 are meant to house. The region order matches the ranking of building condition in the SY 2023-2024 facilities report.
What the file cannot say
- Only 22% of schools answered the access and road sections, and large secondary schools are overrepresented among them. Shares in those sections are shares of reporting schools, not of all public schools.
- A tick means the mode exists, not that it is affordable or frequent. A school that a jeepney reaches twice a day is counted the same as one on a city street.
- Features are reported as present or absent. A fence can be a meter of hollow block or a full enclosure; there is no condition rating.
- The file does not record distance to the nearest road, the nearest town or the division office, the variables DepEd’s hardship index uses.
What this means for school heads
Strand 2.5 of the PPSSH asks a Career Stage 1 school head to know “laws, policies, guidelines and issuances on managing school safety for disaster preparedness, mitigation and resiliency in ensuring continuous delivery of instruction”. The NSBI’s site questions are the inventory that this policy expects a school head to keep. The file shows the typical answers: a gate, a garden, a one-in-two chance of a permanent fence, and a one-in-twenty chance of a flood marker.
In Region VIII and MIMAROPA, more than one reporting school in five can be reached by boat. A school head there should write into the school’s continuity plan what happens when the boat does not run. The SY 2023-2024 facilities report covers buildings, the SY 2023-2024 WASH report covers water and power, and the PPSSH Domain 2 guide explains the strand.
Frequently asked questions
How many DepEd public schools have a perimeter fence?
49.6% of public schools reported a permanent perimeter fence in SY 2023-2024 and 59.5% a temporary one. Coverage ranges from 91.2% of schools in NCR to 23.8% in CAR. By size, it ranges from 25.8% of schools with 100 learners or fewer to 81.7% of schools with more than 1,000.
How many DepEd public schools can be reached only on foot or by boat?
178 of the 10,609 public schools that answered the access questions can be reached only on foot or by boat, and they hold 47,639 learners. The answering schools are mostly large secondary schools, so the national number is certainly higher. The shares are highest in Region VIII, MIMAROPA and CARAGA.
How many DepEd public schools have a flood marker?
2,287 public schools, or 4.8%, have a flood marker. Region III (18.7%) and NCR (11.6%) have the most; most regions are below 4%.
Download the data
The cleaned, harmonized DepEd files behind this series are free to download in CSV and Parquet, with a codebook and checksums, under the terms of use set out in the release. Download Cleaned DepEd School Data, SY 2017-18 to 2025-26 documents every file and column. The files themselves are at data.nash.com.ph, starting with the README, the SY 2023-24 school master file (CSV, 8.0 MB) and the nine-year enrollment panel (Parquet, 17.2 MB).
More in this series
- DepEd Classroom and School Building Data, SY 2023-2024
- DepEd WASH Data SY 2023-2024: Toilets, Water, Electricity
- DepEd School Toilets for Girls, Boys and PWD, SY 2023-2024
- DepEd Learner Data SY 2023-2024: IP, ALIVE and School Size
- DepEd Data for Aspiring School Heads: Where to Start
- For aspiring school heads: PPSSH Domain 2 Through the Data and the full report, Philippine basic education in numbers
Analysis and charts by Mark Anthony Llego for NASH Reviewer. Data: Department of Education school facilities and learner datasets SY 2023-24 (public datasets). Charts may be reused only with written permission from support@nash.com.ph.