DepEd’s SY 2023-2024 water, sanitation and hygiene (WASH) data count the toilets that public schools designate for girls, for boys and for learners with disabilities. Public schools have one female toilet for every 62 girls and one male toilet for every 78 boys, a sex gap that the whole-school ratio hides. A third of public schools have no toilet designated for girls at all, and seven in ten have none for learners with disabilities.
The SY 2023-2024 WASH report in this series counted toilet bowls per learner and found 27 learners per functional bowl nationally. That is the whole-school figure that DepEd’s technical notes define. The WASH file records much more.
It counts how many toilets a school designates for girls, for boys, for learners with disabilities and for shared use. It records whether they are attached to classrooms or stand in separate blocks, and how many are out of order.
The file also counts septic tanks, sinks, urinals and faucets, and how many faucets have no water. It records whether handwashing stations are shared or individual and whether they have soap. It records whether electricity comes from the grid or from an off-grid source, and whether the school’s internet connection is used for teaching or for paperwork. The figures below cover the 47,814 public schools with learners.
Public schools report 181,340 toilets designated for girls and 153,012 for boys, against 467,622 shared ones. The designated counts, not the shared ones, give the ratios above.
Toilets in public schools by designation
The file counts 836,572 toilets in public schools. Shared toilets are 55.9% of them, toilets for girls 21.7% and toilets for boys 18.3%. Toilets for learners with disabilities (PWD toilets in the tables below) are 4.1%.
83.0% of all toilets are attached to classrooms and 17.0% stand alone. 104,058 toilets, or 12.4 per 100, are non-functional.
The schools also report 711,296 sinks, 64,709 urinals and 42,599 urinal troughs. They report 277,116 septic tanks and 1,714,666 faucets. 240,584 faucets (14.0%) have no water.
Dividing learners by the toilets designated for their sex gives 62.2 girls per female toilet and 78.1 boys per male toilet nationally. Counting urinals as male facilities brings the boys’ figure to 54.9.
The median school has 50 girls per female toilet and 59 boys per male toilet. 16,000 schools (33.5%) have more than 50 girls per female toilet. 7,179 schools have more than 100.
Shared toilets are the majority, and counting them lowers all of these ratios. The earlier report’s 27 learners per bowl is the figure that counts every toilet. The designated counts show how much of a school’s provision is sex-specific. DepEd’s WASH in Schools program plans on one toilet bowl for every 50 learners.
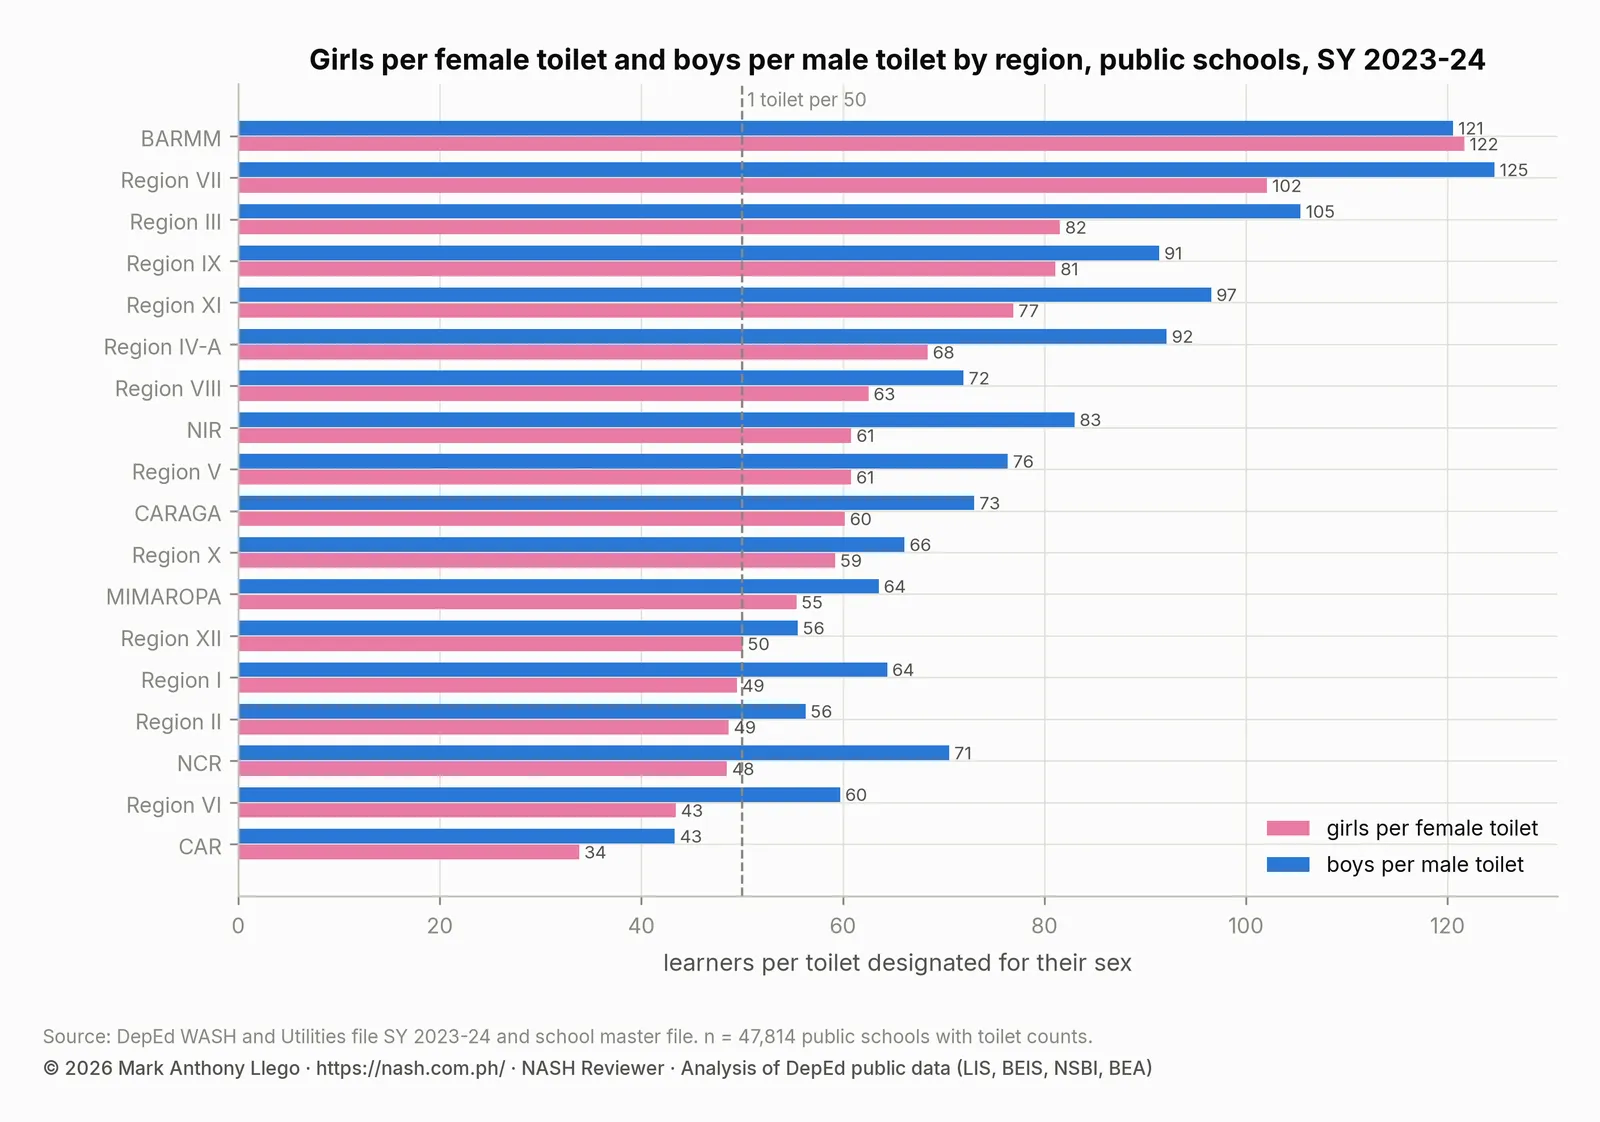
Girls and boys per toilet by region
| Region | Schools | Girls per female toilet | Boys per male toilet | Schools with no female toilet | Schools with a PWD toilet | PWD toilets, share of all | Shared toilets, share of all | Non-functional per 100 toilets | Schools with a septic tank | Faucets without water | Toilets attached to classrooms |
|---|---|---|---|---|---|---|---|---|---|---|---|
| BARMM | 2,155 | 121.7 | 120.6 | 49.9% | 10.1% | 2.6% | 50.9% | 21.4 | 69.5% | 23.9% | 64.9% |
| CAR | 1,844 | 33.8 | 43.3 | 23.3% | 17.8% | 3.4% | 43.6% | 14.2 | 96.9% | 17.1% | 68.6% |
| CARAGA | 2,099 | 60.2 | 73 | 38.8% | 25.8% | 5.4% | 59.7% | 14.7 | 97.0% | 16.6% | 84.6% |
| MIMAROPA | 2,382 | 55.4 | 63.5 | 27.5% | 21.8% | 3.7% | 58.2% | 10.2 | 96.9% | 13.2% | 81.1% |
| NCR | 827 | 48.5 | 70.5 | 1.9% | 69.0% | 4.6% | 12.8% | 11.7 | 98.3% | 9.2% | 89.4% |
| NIR | 2,231 | 60.8 | 83 | 26.8% | 40.5% | 4.8% | 57.0% | 10.7 | 96.5% | 13.7% | 80.7% |
| Region I | 2,861 | 49.5 | 64.4 | 30.5% | 35.1% | 4.0% | 60.1% | 11 | 98.5% | 8.3% | 83.9% |
| Region II | 2,539 | 48.7 | 56.3 | 34.5% | 15.3% | 2.3% | 61.0% | 11 | 98.5% | 9.7% | 84.7% |
| Region III | 3,729 | 81.5 | 105.4 | 33.7% | 37.5% | 4.1% | 65.7% | 12 | 98.1% | 8.7% | 85.0% |
| Region IV-A | 3,564 | 68.4 | 92.1 | 19.8% | 45.3% | 4.7% | 52.5% | 12.8 | 98.5% | 12.9% | 87.2% |
| Region IX | 2,993 | 81.1 | 91.4 | 44.5% | 13.5% | 3.1% | 60.1% | 16.2 | 89.3% | 24.6% | 79.3% |
| Region V | 3,862 | 60.8 | 76.4 | 29.6% | 33.2% | 4.7% | 58.8% | 13.6 | 98.4% | 20.2% | 77.6% |
| Region VI | 2,835 | 43.4 | 59.7 | 15.6% | 42.6% | 5.0% | 54.5% | 7.5 | 98.9% | 8.0% | 80.9% |
| Region VII | 2,810 | 102.1 | 124.7 | 46.7% | 26.0% | 3.8% | 67.6% | 13.3 | 97.1% | 15.4% | 85.7% |
| Region VIII | 4,179 | 62.5 | 72 | 40.8% | 19.9% | 3.6% | 63.2% | 11.6 | 97.2% | 16.2% | 81.5% |
| Region X | 2,531 | 59.2 | 66.1 | 36.3% | 25.5% | 4.0% | 54.9% | 11.8 | 95.9% | 22.5% | 86.2% |
| Region XI | 2,218 | 76.9 | 96.6 | 40.4% | 28.4% | 4.6% | 60.7% | 16.3 | 96.5% | 20.7% | 83.6% |
| Region XII | 2,155 | 50.1 | 55.5 | 25.0% | 20.1% | 3.7% | 46.8% | 13 | 95.6% | 14.4% | 83.9% |
| Philippines (public) | 47,814 | 62.2 | 78.1 | 32.6% | 28.6% | 4.1% | 55.9% | 12.4 | 95.7% | 14.0% | 83.0% |
BARMM has the worst ratios: 121.7 girls per female toilet and 120.6 boys per male toilet. Half of its schools (49.9%) have no female toilet, and 21.4 of every 100 of its toilets are out of order. Only 10.1% of its schools have a toilet for learners with disabilities.
Region VII is next, with 102.1 girls per female toilet and 124.7 boys per male toilet; 46.7% of its schools lack a female toilet. Region IX and Region III follow; the table shows their ratios.
CAR has the best ratios, 33.8 girls per female toilet and 43.3 boys per male toilet. Region VI and NCR are the next best, and NCR has a female toilet in 98.1% of its schools.
Non-functional toilets are 7.5 per 100 in Region VI and above 16 per 100 in BARMM, Region XI and Region IX. Faucets without water are a problem in specific regions rather than everywhere; the by-region table has each region’s share.
Toilets for learners with disabilities
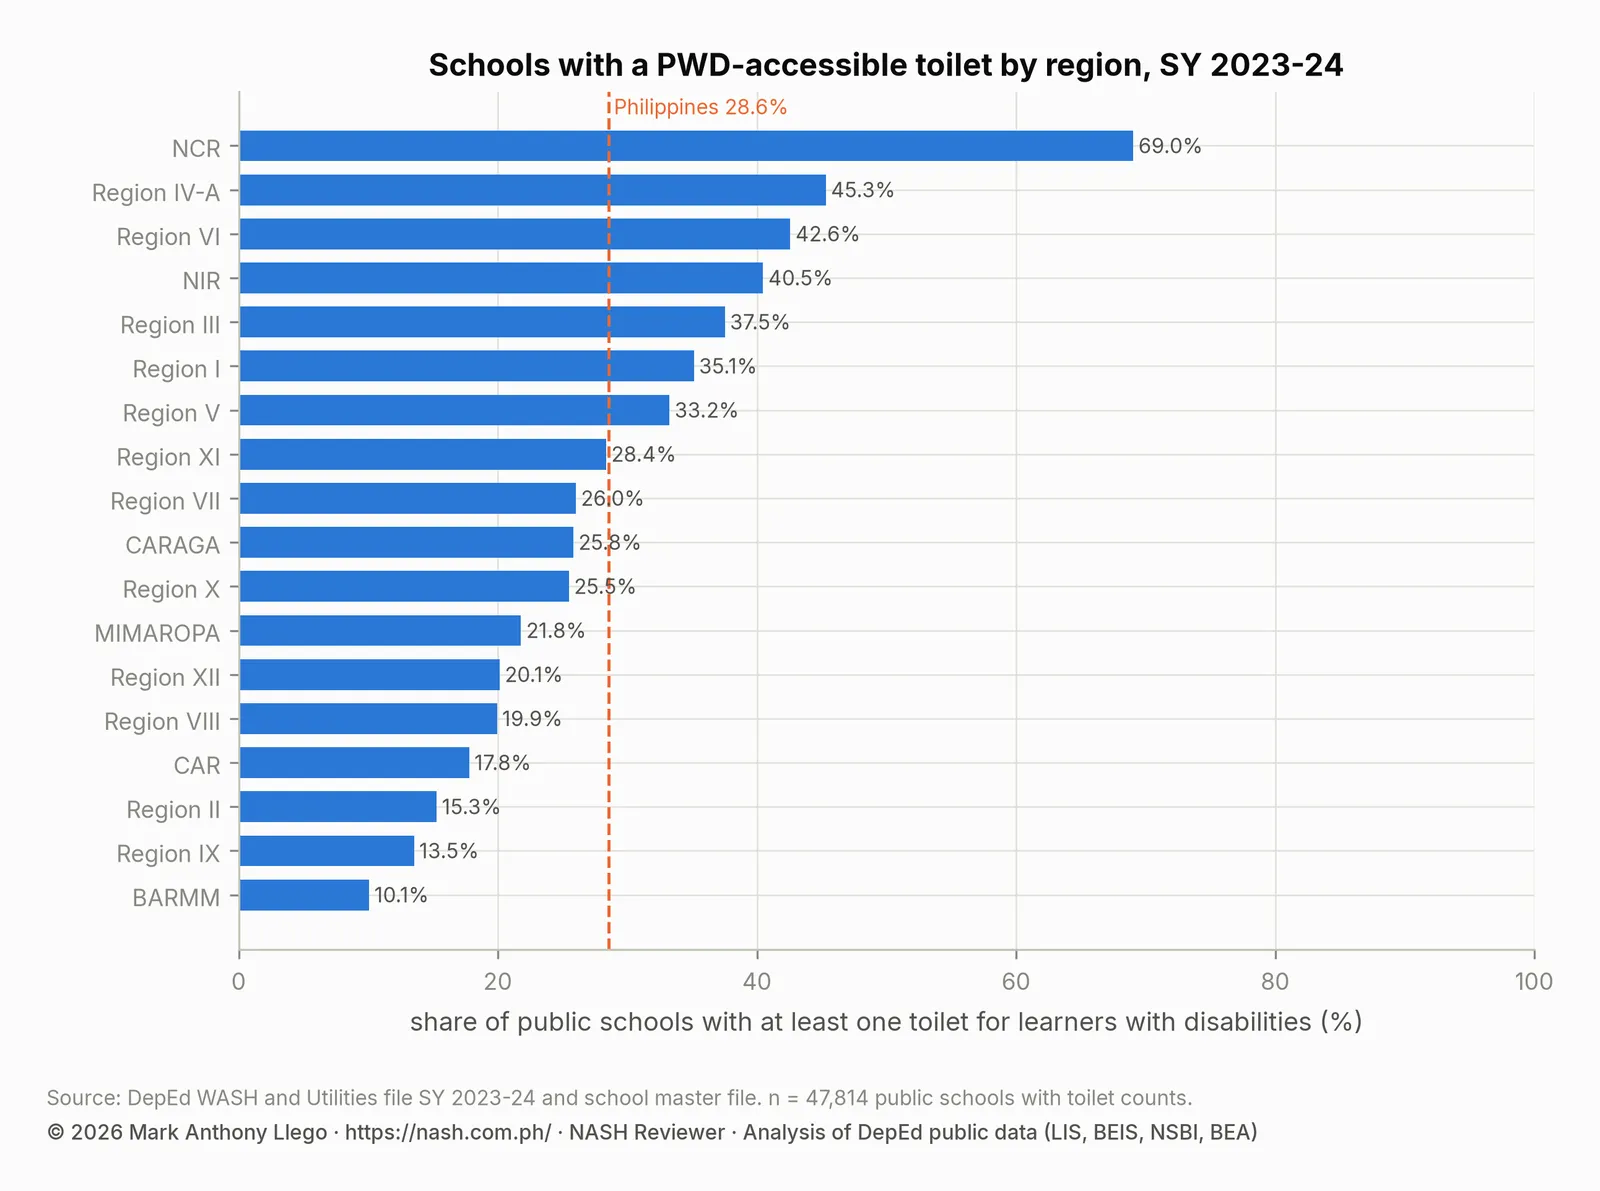
Only 13,655 public schools (28.6%) report a toilet for learners with disabilities, and those toilets are 4.1% of all toilets. NCR leads with 69.0% of schools, followed by Region IV-A (45.3%) and Region VI (42.6%). BARMM (10.1%) and Region IX (13.5%) have the lowest shares.
Key Priority Area (KPA) 4 of the National Education Plan wants enrollment of children with disabilities to rise from 7.8% to 34% by 2028 through a Child Find System. That will bring hundreds of thousands of learners into schools, seven in ten of which have no accessible toilet. Republic Act No. 11650 requires inclusive learning resource centers. The WASH file is where a division can see which schools are physically ready. RA 11650 and Learners With Disabilities covers EDCOM II’s findings on enrollment and ILRCs, and the plan’s targets for Key Priority Area 4.
| Level offered | Schools | Girls per female toilet | Boys per male toilet | Schools with no female toilet | Schools with a PWD toilet | Schools with a septic tank | Non-functional per 100 toilets |
|---|---|---|---|---|---|---|---|
| Elementary and secondary | 2,347 | 63.7 | 78.8 | 24.8% | 34.5% | 98.3% | 11.8 |
| Elementary only | 36,997 | 71.8 | 88.3 | 37.7% | 22.3% | 95.4% | 10.7 |
| Secondary only | 8,470 | 51.7 | 66.1 | 12.5% | 54.4% | 96.5% | 16.2 |
| Learners in school | Schools | Girls per female toilet | Boys per male toilet | Schools with no female toilet | Schools with a PWD toilet | Schools with a septic tank | Non-functional per 100 toilets |
|---|---|---|---|---|---|---|---|
| 1–100 | 8,530 | 34.1 | 39 | 48.9% | 9.4% | 91.5% | 12.4 |
| 101–200 | 12,528 | 48.5 | 57.5 | 39.8% | 16.7% | 95.0% | 11.6 |
| 201–500 | 15,289 | 59.1 | 72.3 | 31.1% | 28.8% | 96.4% | 11.9 |
| 501–1,000 | 6,185 | 60.6 | 75.9 | 19.1% | 47.2% | 98.3% | 12.5 |
| over 1,000 | 5,282 | 69.9 | 91.9 | 9.4% | 65.0% | 99.4% | 13.1 |
Level and size explain the pattern. Secondary-only schools have a PWD toilet in 54.4% of cases and a female toilet in 87.5%. Elementary-only schools, which are 36,997 of all public schools, have a PWD toilet in 22.3% and no female toilet in 37.7%.
Among schools with 100 learners or fewer, 48.9% have no female toilet and 9.4% have a PWD toilet. Among schools with more than 1,000 learners, the shares are 9.4% and 65.0%. The smallest schools have the best ratios where they do have designated toilets, 34.1 girls per female toilet, because a single toilet serves few children. They are simply more likely to have none designated at all and to rely on shared ones.
Septic tanks, handwashing facilities and faucets without water
95.7% of public schools report at least one septic tank. 2,040 schools (4.3%) report none; in a school with toilets, that means a pit or a connection the file does not describe. Septic coverage is above 95% at every level and above 91% in every size band.
Handwashing is the one indicator on which public schools are well provided. 42,502 schools report 747,277 handwashing facilities. Of these, 706,156 (94.5%) are functional, and 94.7% of the functional ones have soap.
Three quarters of the facilities are individual stations and a quarter are group facilities. No school with handwashing data reported having no functional facility. The SY 2023-2024 WASH report found 3.3 handwashing facilities per 100 learners nationally, with lower rates in NCR and BARMM.
Water at the tap is less reliable than the “has water supply” flag suggests. 240,584 of 1.71 million faucets, 14.0%, have no water. A school with a water supply and dry faucets has water somewhere on the site, but not where the learners are.
Off-grid electricity and internet use in public schools
| Region | Schools | Grid electricity | Off-grid only | No electricity reported | Schools with internet | Internet used for instruction (of connected) | Administration only (of connected) | Learners in schools where internet is used for instruction |
|---|---|---|---|---|---|---|---|---|
| BARMM | 2,155 | 74.4% | 18.0% | 7.6% | 73.8% | 58.7% | 39.7% | 49.4% |
| CAR | 1,844 | 93.4% | 5.9% | 0.7% | 71.5% | 87.1% | 11.3% | 76.5% |
| CARAGA | 2,099 | 94.9% | 3.1% | 2.1% | 83.4% | 86.5% | 12.6% | 81.9% |
| MIMAROPA | 2,382 | 78.1% | 16.9% | 5.0% | 69.1% | 79.0% | 19.5% | 60.7% |
| NCR | 827 | 96.9% | 0.4% | 2.8% | 97.8% | 79.7% | 20.3% | 78.4% |
| NIR | 2,231 | 94.4% | 2.5% | 3.0% | 72.3% | 86.6% | 12.0% | 75.3% |
| Region I | 2,861 | 99.4% | 0.1% | 0.5% | 93.2% | 92.5% | 7.4% | 90.6% |
| Region II | 2,539 | 95.6% | 3.2% | 1.2% | 91.7% | 92.8% | 7.0% | 86.1% |
| Region III | 3,729 | 97.3% | 1.4% | 1.3% | 95.0% | 87.2% | 12.7% | 83.0% |
| Region IV-A | 3,564 | 96.3% | 2.7% | 1.0% | 87.9% | 84.6% | 14.9% | 80.8% |
| Region IX | 2,993 | 83.1% | 10.2% | 6.7% | 62.3% | 77.0% | 20.2% | 58.8% |
| Region V | 3,862 | 92.2% | 5.8% | 2.0% | 63.4% | 87.5% | 10.7% | 70.5% |
| Region VI | 2,835 | 96.1% | 3.0% | 0.9% | 75.8% | 88.5% | 10.9% | 79.6% |
| Region VII | 2,810 | 96.6% | 1.8% | 1.6% | 82.6% | 91.6% | 7.7% | 85.7% |
| Region VIII | 4,179 | 96.7% | 1.7% | 1.7% | 72.6% | 88.3% | 10.6% | 71.8% |
| Region X | 2,531 | 94.0% | 2.3% | 3.7% | 73.8% | 85.6% | 12.5% | 76.5% |
| Region XI | 2,218 | 86.4% | 10.8% | 2.8% | 73.2% | 81.5% | 16.9% | 72.3% |
| Region XII | 2,155 | 89.7% | 5.1% | 5.2% | 76.3% | 85.3% | 13.6% | 75.2% |
92.4% of public schools have grid electricity and 8.7% have an off-grid source (solar, generator or battery). 2,392 schools (5.0%) run on off-grid power only, and 1,250 report neither. Off-grid-only schools are 18.0% of BARMM’s and 16.9% of MIMAROPA’s. They are 10.2% of Region IX’s and 10.8% of Region XI’s, and below 1% in NCR and Region I.
The SY 2023-2024 access and safety report counts the solar panels of these schools. Their smart TVs and computers, which the classroom technology report counts, depend on how long the batteries last.
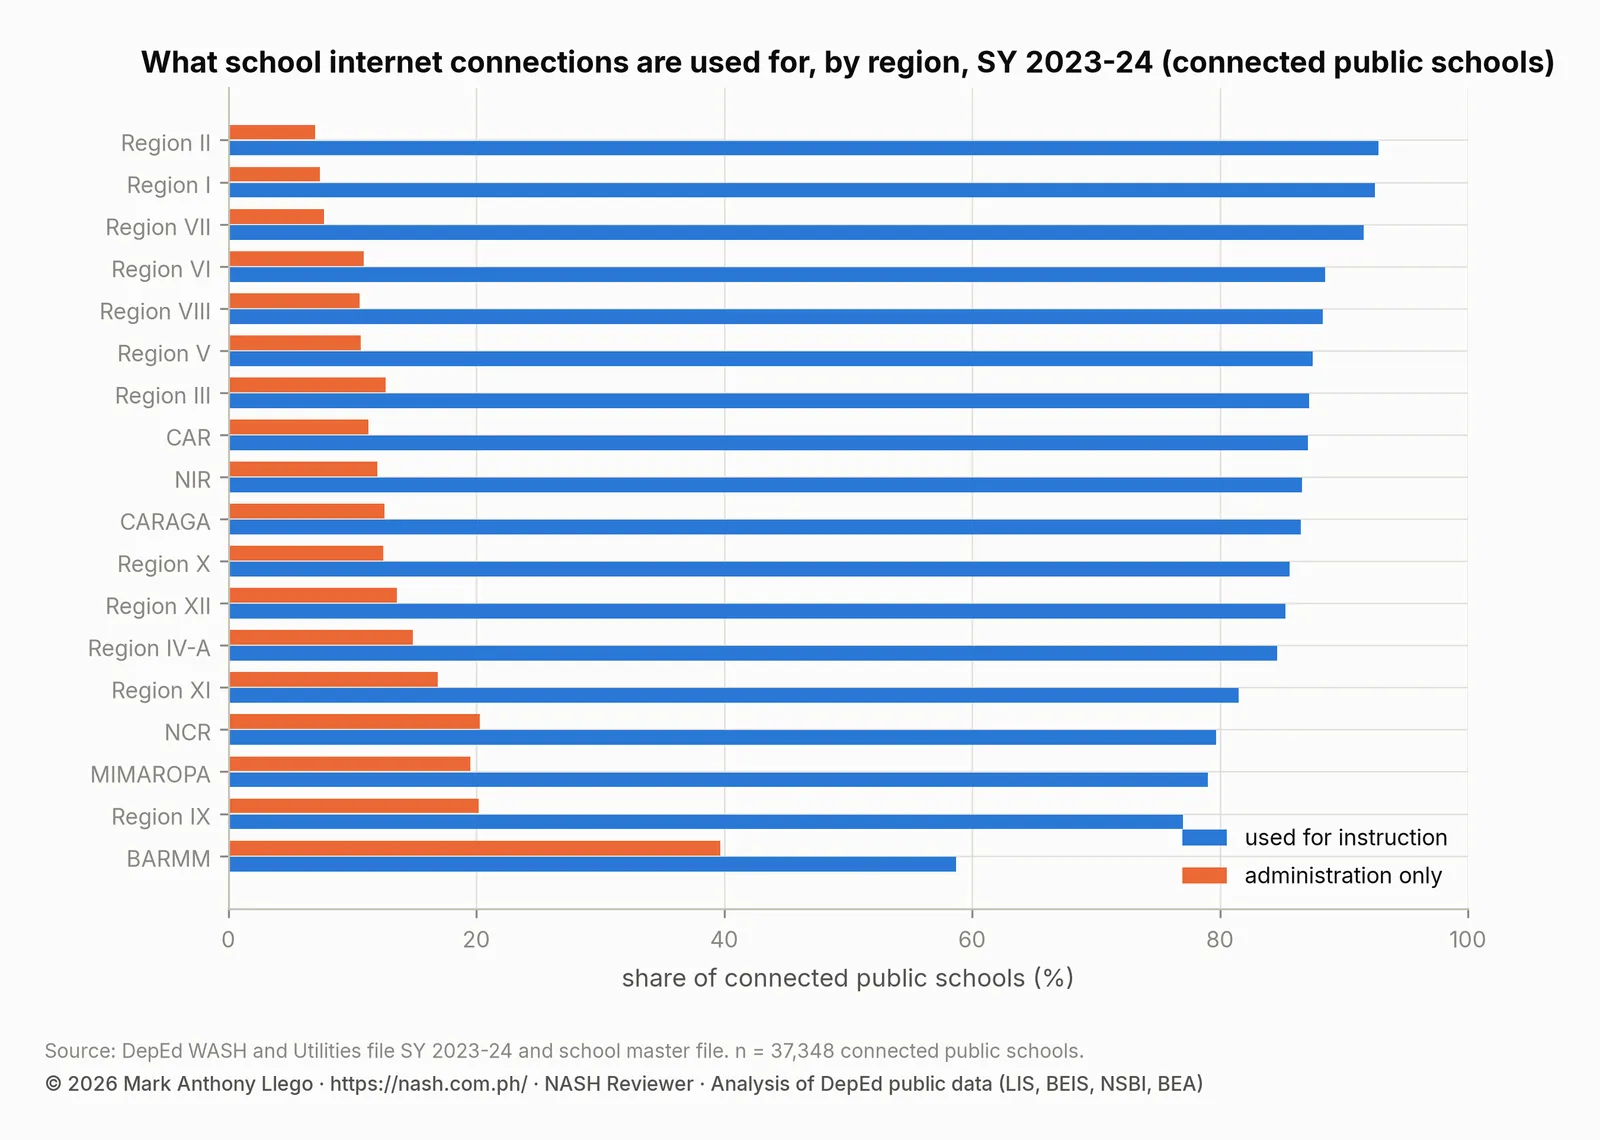
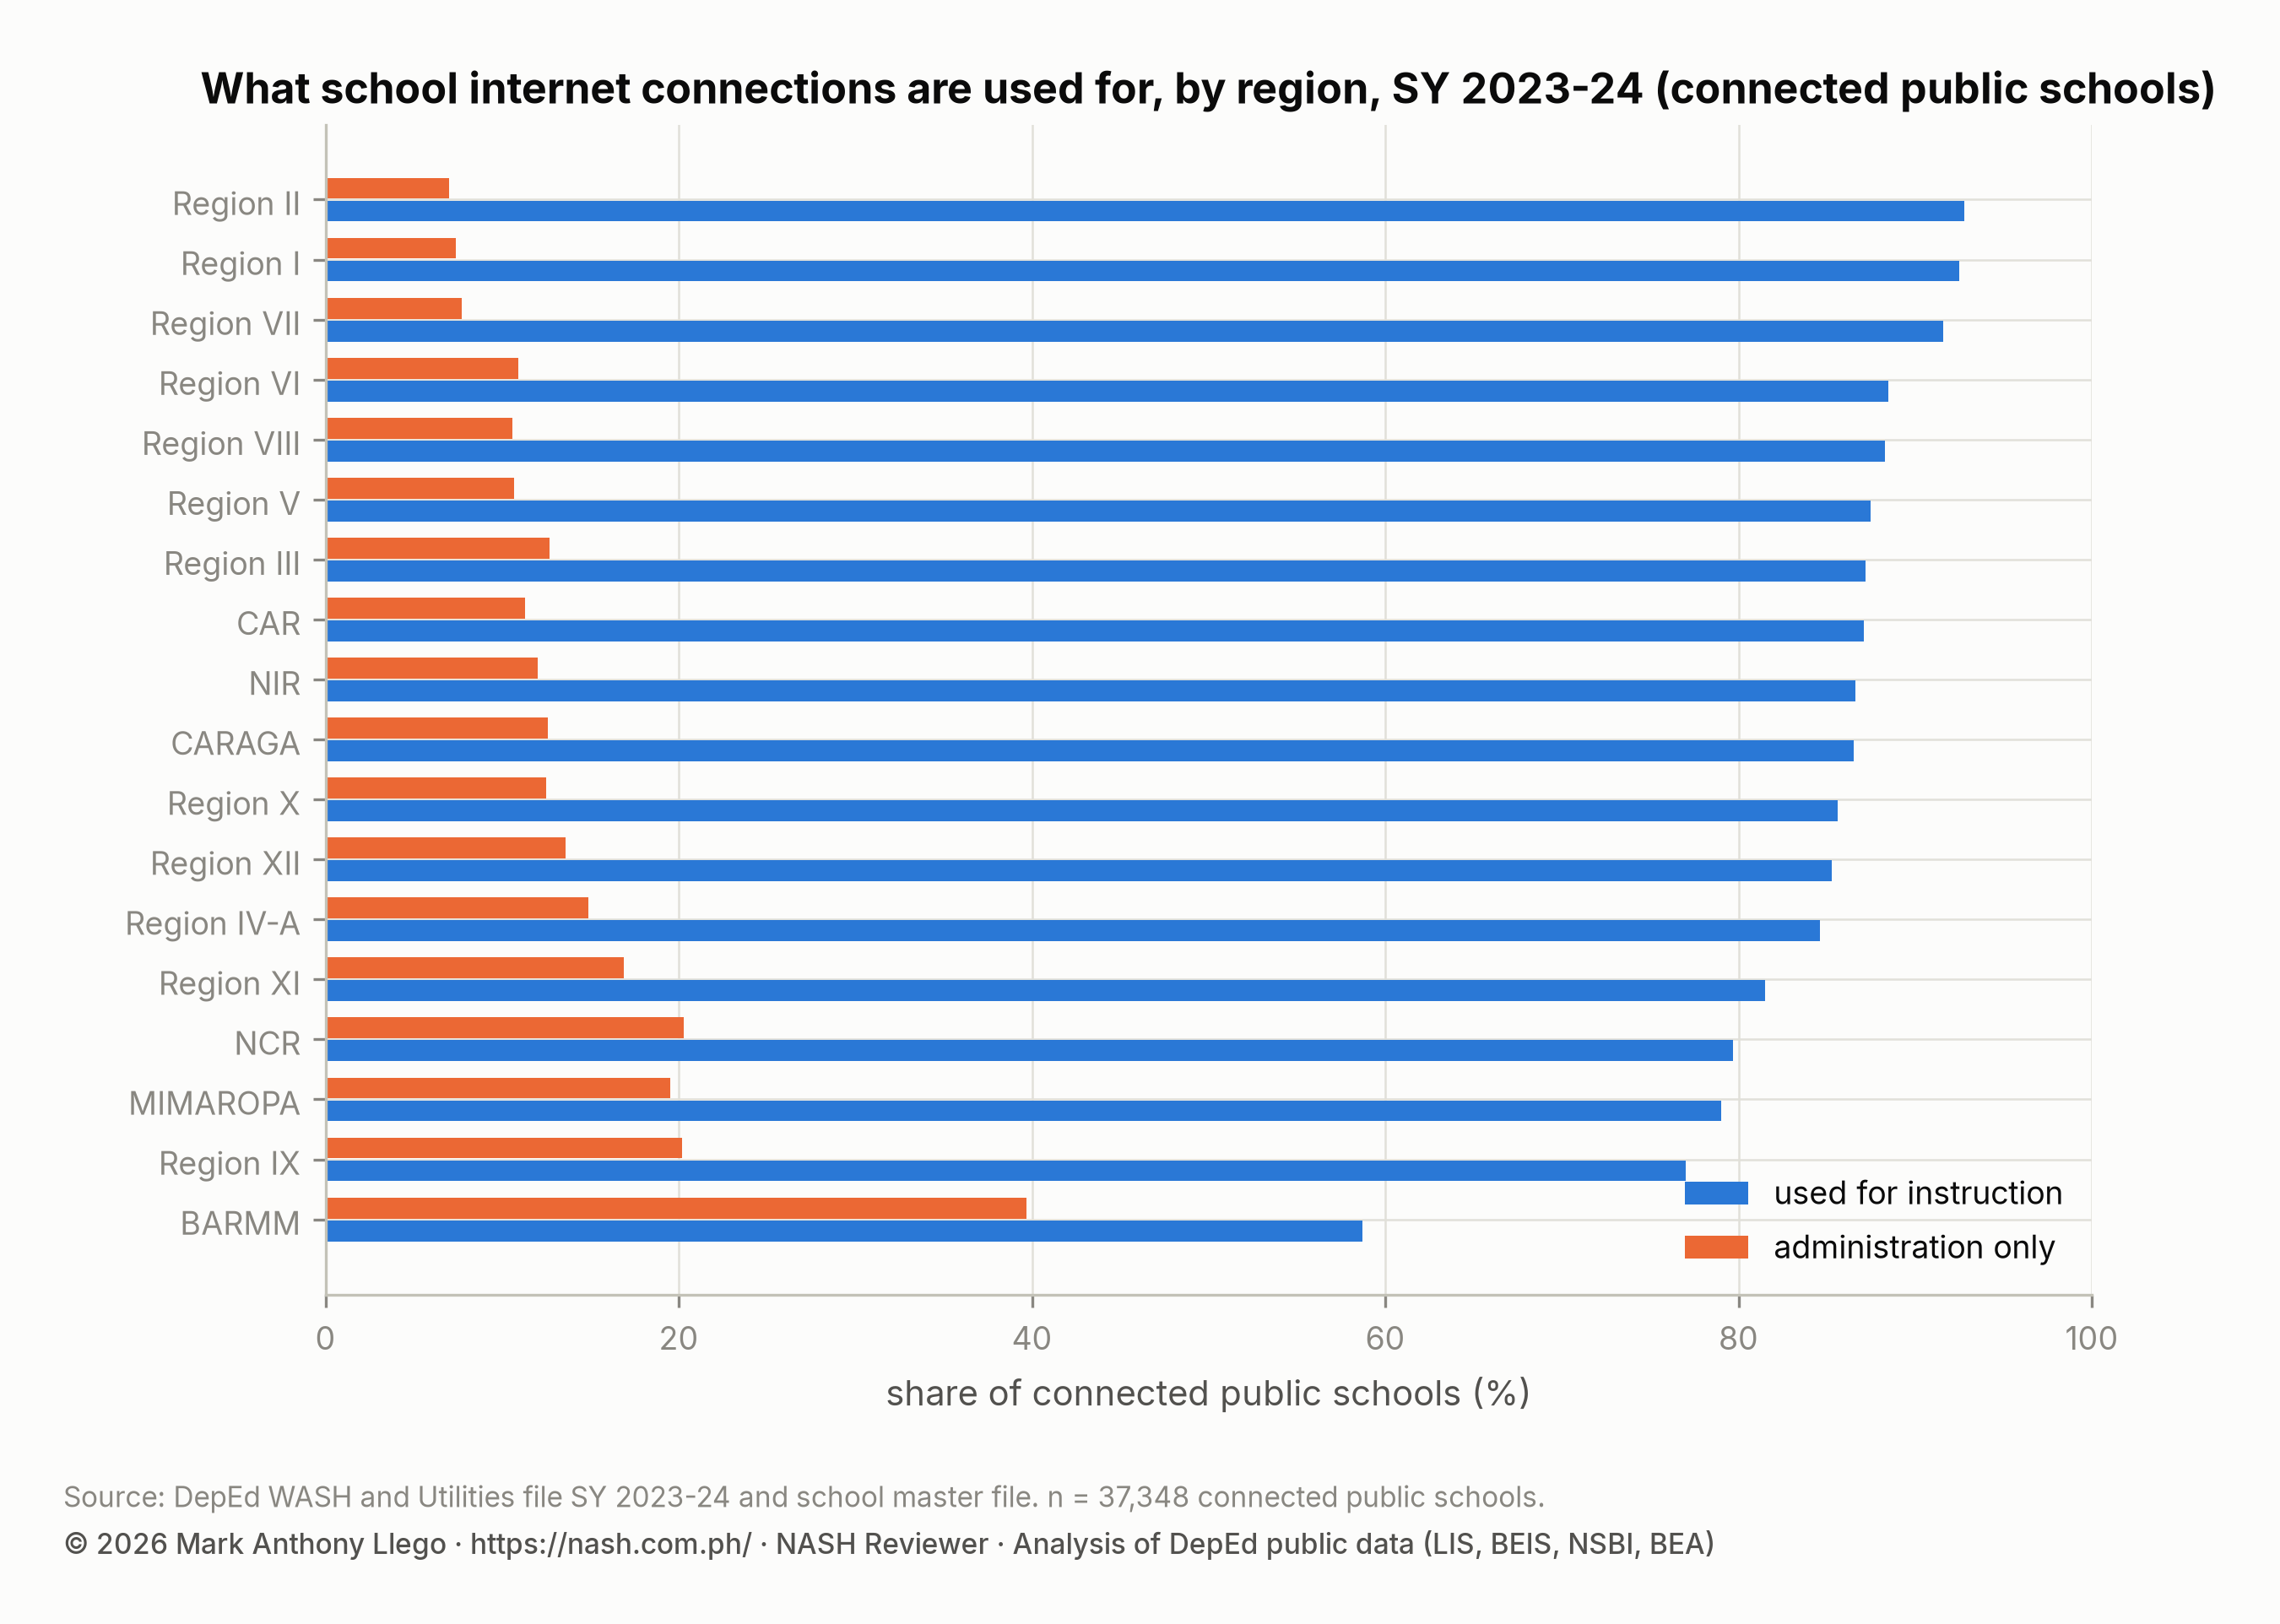
Of the 37,348 public schools with an internet connection, 98.2% use it for administration and 85.4% for instruction. 31,621 use it for both, and 5,061 (13.6%) use it for administration only.
The administration-only share is 39.7% in BARMM, where only 58.7% of connected schools use the connection to teach. It is 20.3% in NCR and 20.2% in Region IX. In Regions I, II and VII it is 7.0% to 7.7%.
Counting unconnected schools too, the share of a region’s learners in a school that uses the internet for instruction ranges from 49.4% in BARMM to 90.6% in Region I. The National Education Plan’s target of internet for 100% of elementary schools by 2028 is a target for connections. The file shows that a connection is used in the classroom in six schools out of seven.
What the file cannot say
- The school reports the designation. A toilet counted as shared may be used by one sex in practice, and a “female” toilet in an elementary school may be the only toilet.
- The counts are bowls and cubicles as the National School Building Inventory (NSBI) form asks for them. They do not record condition, privacy, locks, lighting or water inside the cubicle, which make a toilet usable by an adolescent girl.
- The file does not record menstrual hygiene facilities.
- Only connected schools answer the internet-purpose questions, which say nothing about speed or reliability.
What this means for school heads
Strand 3.6 of the Philippine Professional Standards for School Heads (PPSSH) asks a school head to manage “a learner-friendly, inclusive and healthy learning environment”. Strand 5.3 asks for “gender sensitivity, physical and mental health awareness” as inclusive practice.
A school in which a third of learners are adolescent girls and the toilets are shared has a sanitation problem that is also an attendance problem. So does a school in which the one female toilet serves 120 girls. The Filipino Learner chapter of the Second Congressional Commission on Education (EDCOM II) Final Report lists unsupportive school environments among the six barriers to learners’ aspirations.
The WASH file gives a school head the counts to compare with the WASH in Schools standard. The by-region and by-size tables above give the comparison a division will understand. The SY 2023-2024 WASH report has the whole-school ratios, and the PPSSH Domain 3 guide explains the strand.
Frequently asked questions
How many girls per toilet are there in DepEd public schools?
Public schools report one toilet designated for girls for every 62.2 girls nationally, and the median school has 50. 33.5% of schools have more than 50 girls per female toilet. 15,588 schools (32.6%) have no toilet designated for girls at all. Counting shared toilets, the whole-school ratio is about 27 learners per functional bowl.
How many DepEd public schools have a toilet for learners with disabilities?
13,655 public schools, or 28.6%, have a toilet for learners with disabilities. NCR has one in 69.0% of its schools and BARMM in 10.1%. Secondary schools (54.4%) are far more likely to have one than elementary schools (22.3%).
Do DepEd public schools use their internet connection for teaching?
Mostly yes. Of 37,348 connected public schools, 85.4% use the connection for instruction. 5,061 (13.6%) use it for administration only, a share that reaches 39.7% in BARMM.
Download the data
The cleaned, harmonized DepEd files behind this series are free to download in CSV and Parquet, with a codebook and checksums, under the terms of use set out in the release. Download Cleaned DepEd School Data, SY 2017-18 to 2025-26 documents every file and column. The files themselves are at data.nash.com.ph, starting with the README, the SY 2023-24 school master file (CSV, 8.0 MB) and the nine-year enrollment panel (Parquet, 17.2 MB).
More in this series
- DepEd WASH Data SY 2023-2024: Toilets, Water, Electricity
- DepEd Data on School Access, Roads and Safety, SY 2023-2024
- DepEd Smart TVs and Computers vs National Education Plan
- DepEd Classroom and School Building Data, SY 2023-2024
- DepEd Data for Aspiring School Heads: Where to Start
- For aspiring school heads: PPSSH Domain 3 Through the Data and the full report, Philippine basic education in numbers
Analysis and charts by Mark Anthony Llego for NASH Reviewer. Data: Department of Education WASH and utilities and learner datasets SY 2023-24 (public datasets). Charts may be reused only with written permission from support@nash.com.ph.