DepEd’s SY 2023-2024 information and communications technology (ICT) data for public schools show how far schools stand from the technology targets of the National Education Plan 2026-2035. Smart TVs are already in two thirds of public schools, but only 27% have the five-TV package that the plan counts, and 37.0% of schools have no computer for administration.
Recommendation 2.1.3 of the plan turns “equitable internet connectivity and digital resources” into six numbered targets. They are internet in every elementary school by 2028, a laptop for every teacher, and an eLearning cart in 3.97% of elementary schools by 2028 and in all by 2035. They also include a five-smart-TV package in 72% of schools by 2028 and in all by 2031, full electrification, and electrical upgrading for 6,435 schools.
The SY 2023-2024 ICT report in this series counted computers. DepEd’s ICT file also counts, for every public school, its smart and LED televisions, projectors, printers, routers, switches, uninterruptible power supply (UPS) units, external drives and lapel microphones. It separates computers for teaching from computers for administration, and it records who paid for every unit.
Key findings
- Two thirds of public schools have a smart TV, but only 27.1% have five or more. Five TVs is the package the National Education Plan counts.
- The typical school has one television for every two classrooms. The file counts 0.57 televisions per instructional room.
- 17,708 public schools (37.0%) have no computer for administration. 6,125 have no computer of any kind.
- Parents and local governments bought a third of the televisions. The DepEd Computerization Program bought the computing core: 49.3% of computers and 68.5% of projectors.
Smart TVs, projectors, printers and routers in public schools
| Equipment | Units | Academic use | Administrative use | Schools with at least one | Share of schools | Units per 100 schools | Share of learners in schools with one |
|---|---|---|---|---|---|---|---|
| Smart TV | 188,373 | 175,919 | 12,454 | 31,524 | 65.9% | 394 | 72.1% |
| LED TV | 186,355 | 176,176 | 10,179 | 24,970 | 52.2% | 390 | 67.0% |
| Projector | 60,326 | 53,758 | 6,568 | 26,158 | 54.7% | 126 | 70.4% |
| Printer | 367,743 | 288,900 | 78,843 | 40,223 | 84.1% | 769 | 87.9% |
| Router | 39,409 | 28,997 | 10,412 | 14,302 | 29.9% | 82 | 49.4% |
| Network switch | 33,552 | 30,168 | 3,384 | 6,244 | 13.1% | 70 | 33.6% |
| UPS | 80,638 | 72,076 | 8,562 | 11,474 | 24.0% | 169 | 42.7% |
| External hard drive | 72,596 | 56,492 | 16,104 | 15,494 | 32.4% | 152 | 37.5% |
| Lapel microphone | 50,402 | 50,402 | 0 | 14,456 | 30.2% | 105 | 40.7% |
Public schools reported 188,373 smart TVs and 186,355 LED TVs; the table lists the other equipment. Printers are the one item nearly every school has (84.1%). Smart TVs are in 65.9% of schools, projectors in 54.7% and LED TVs in 52.2%.
Routers turn a connection into classroom access; they are in 29.9% of schools, although 78.1% report an internet connection. UPS units keep a computer running through a brownout; they are in 24.0%.
Smart TVs in public schools against the five-TV package
| Region | Schools | At least one smart TV | Five or more smart TVs | Any TV (smart or LED) | TVs per instructional room | Projector | Router | Printer | UPS | Any administrative computer | Administrative share of computers |
|---|---|---|---|---|---|---|---|---|---|---|---|
| BARMM | 2,155 | 11.9% | 2.1% | 23.6% | 0.1 | 48.1% | 10.1% | 77.2% | 7.3% | 73.3% | 16.4% |
| CAR | 1,844 | 67.6% | 26.7% | 87.6% | 0.69 | 62.3% | 25.5% | 87.1% | 27.3% | 52.6% | 6.2% |
| CARAGA | 2,098 | 57.9% | 21.4% | 79.7% | 0.48 | 47.1% | 32.9% | 80.0% | 20.0% | 60.3% | 5.9% |
| MIMAROPA | 2,382 | 55.9% | 19.0% | 79.3% | 0.58 | 55.7% | 22.0% | 78.7% | 22.6% | 58.7% | 6.1% |
| NCR | 827 | 70.9% | 49.1% | 94.9% | 0.67 | 85.9% | 56.1% | 88.4% | 54.3% | 90.8% | 3.3% |
| NIR | 2,231 | 71.8% | 38.2% | 89.2% | 0.53 | 61.6% | 35.5% | 83.8% | 30.0% | 52.9% | 5.2% |
| Region I | 2,861 | 74.4% | 33.7% | 93.0% | 0.69 | 59.9% | 34.6% | 86.9% | 26.4% | 71.0% | 6.0% |
| Region II | 2,539 | 77.0% | 24.8% | 92.4% | 0.69 | 40.3% | 26.7% | 82.1% | 17.5% | 61.9% | 8.1% |
| Region III | 3,729 | 77.6% | 32.1% | 95.4% | 0.62 | 76.7% | 41.1% | 86.1% | 32.0% | 76.3% | 6.3% |
| Region IV-A | 3,564 | 69.8% | 26.9% | 93.9% | 0.68 | 69.2% | 38.1% | 89.2% | 28.8% | 79.4% | 5.6% |
| Region IX | 2,993 | 56.5% | 22.9% | 71.4% | 0.48 | 37.7% | 23.5% | 75.8% | 18.5% | 54.5% | 6.9% |
| Region V | 3,862 | 70.8% | 26.4% | 88.2% | 0.43 | 60.0% | 27.4% | 87.0% | 25.5% | 60.3% | 9.0% |
| Region VI | 2,835 | 74.1% | 31.1% | 92.3% | 0.52 | 48.7% | 29.9% | 88.5% | 22.1% | 69.5% | 10.1% |
| Region VII | 2,810 | 68.0% | 37.6% | 82.6% | 0.59 | 51.4% | 29.6% | 85.9% | 23.7% | 54.1% | 6.0% |
| Region VIII | 4,179 | 61.5% | 22.1% | 77.3% | 0.47 | 39.0% | 22.2% | 83.3% | 17.2% | 46.8% | 7.0% |
| Region X | 2,531 | 65.1% | 25.0% | 83.6% | 0.51 | 51.4% | 29.2% | 81.8% | 23.1% | 58.2% | 7.4% |
| Region XI | 2,218 | 65.3% | 23.3% | 86.7% | 0.53 | 61.3% | 35.7% | 88.2% | 34.3% | 63.7% | 5.9% |
| Region XII | 2,155 | 80.0% | 36.9% | 90.7% | 0.65 | 43.9% | 31.7% | 82.5% | 19.6% | 64.6% | 8.1% |
| Philippines (public) | 47,813 | 65.9% | 27.1% | 83.8% | 0.57 | 54.7% | 29.9% | 84.1% | 24.0% | 63.0% | 6.0% |
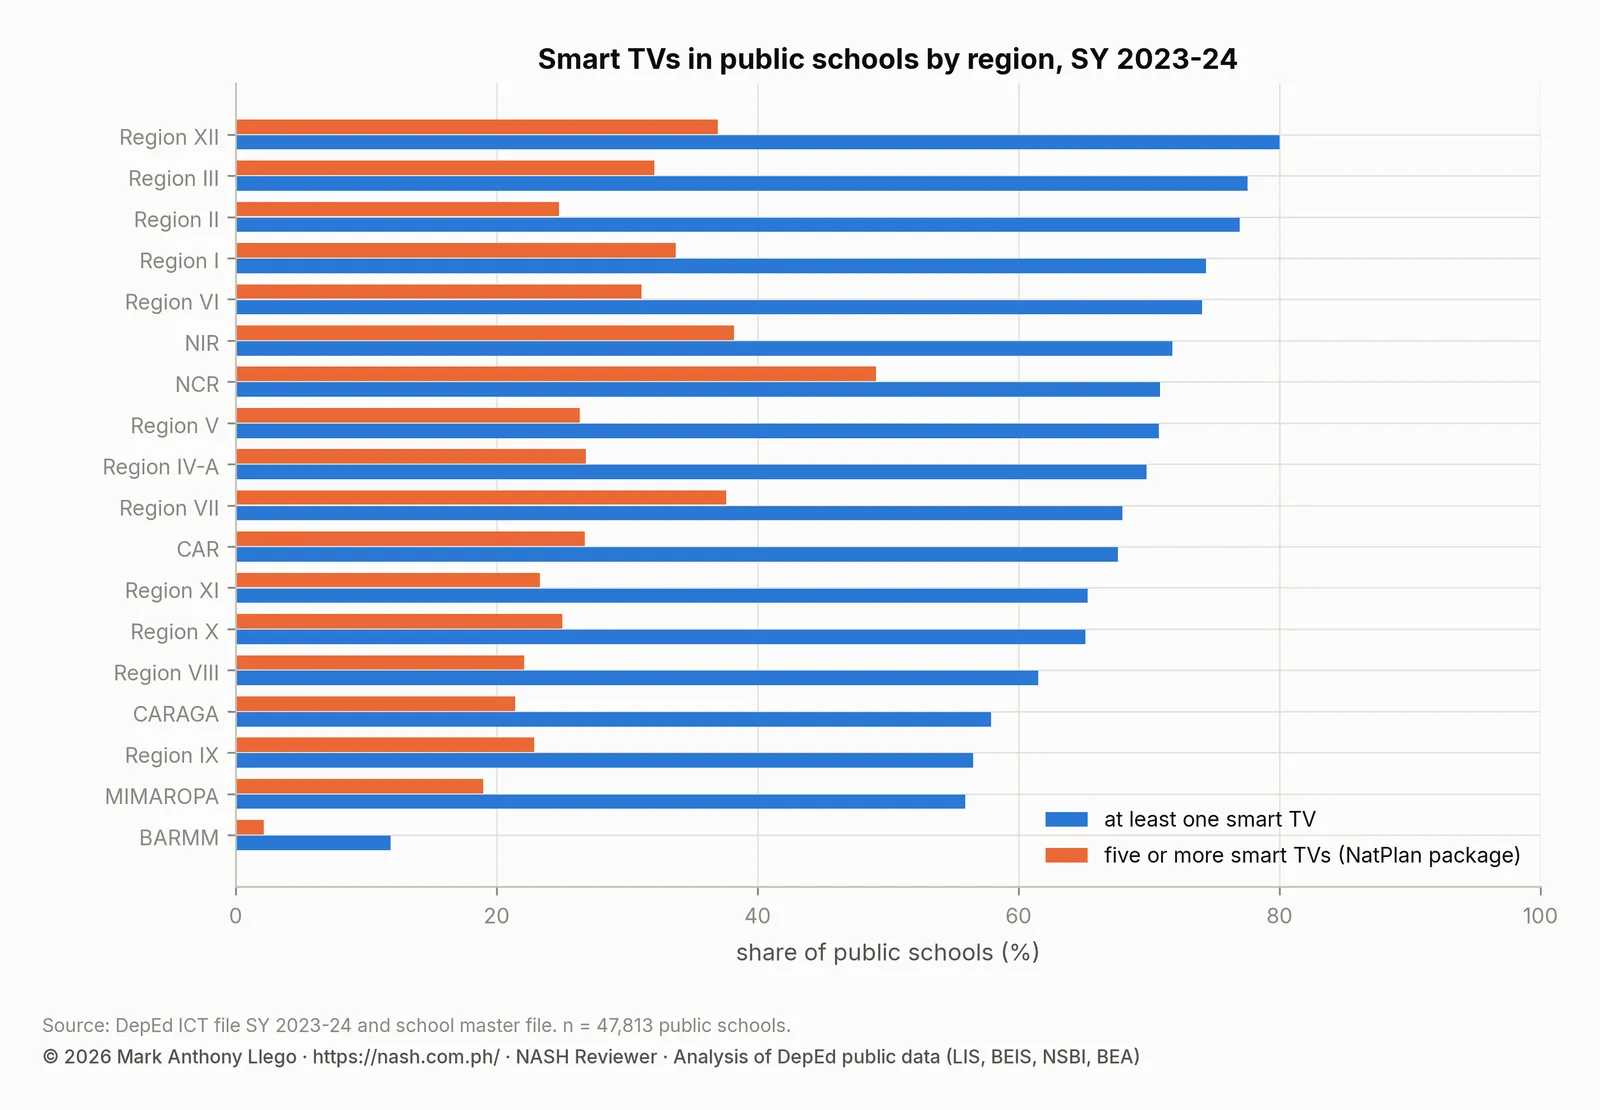
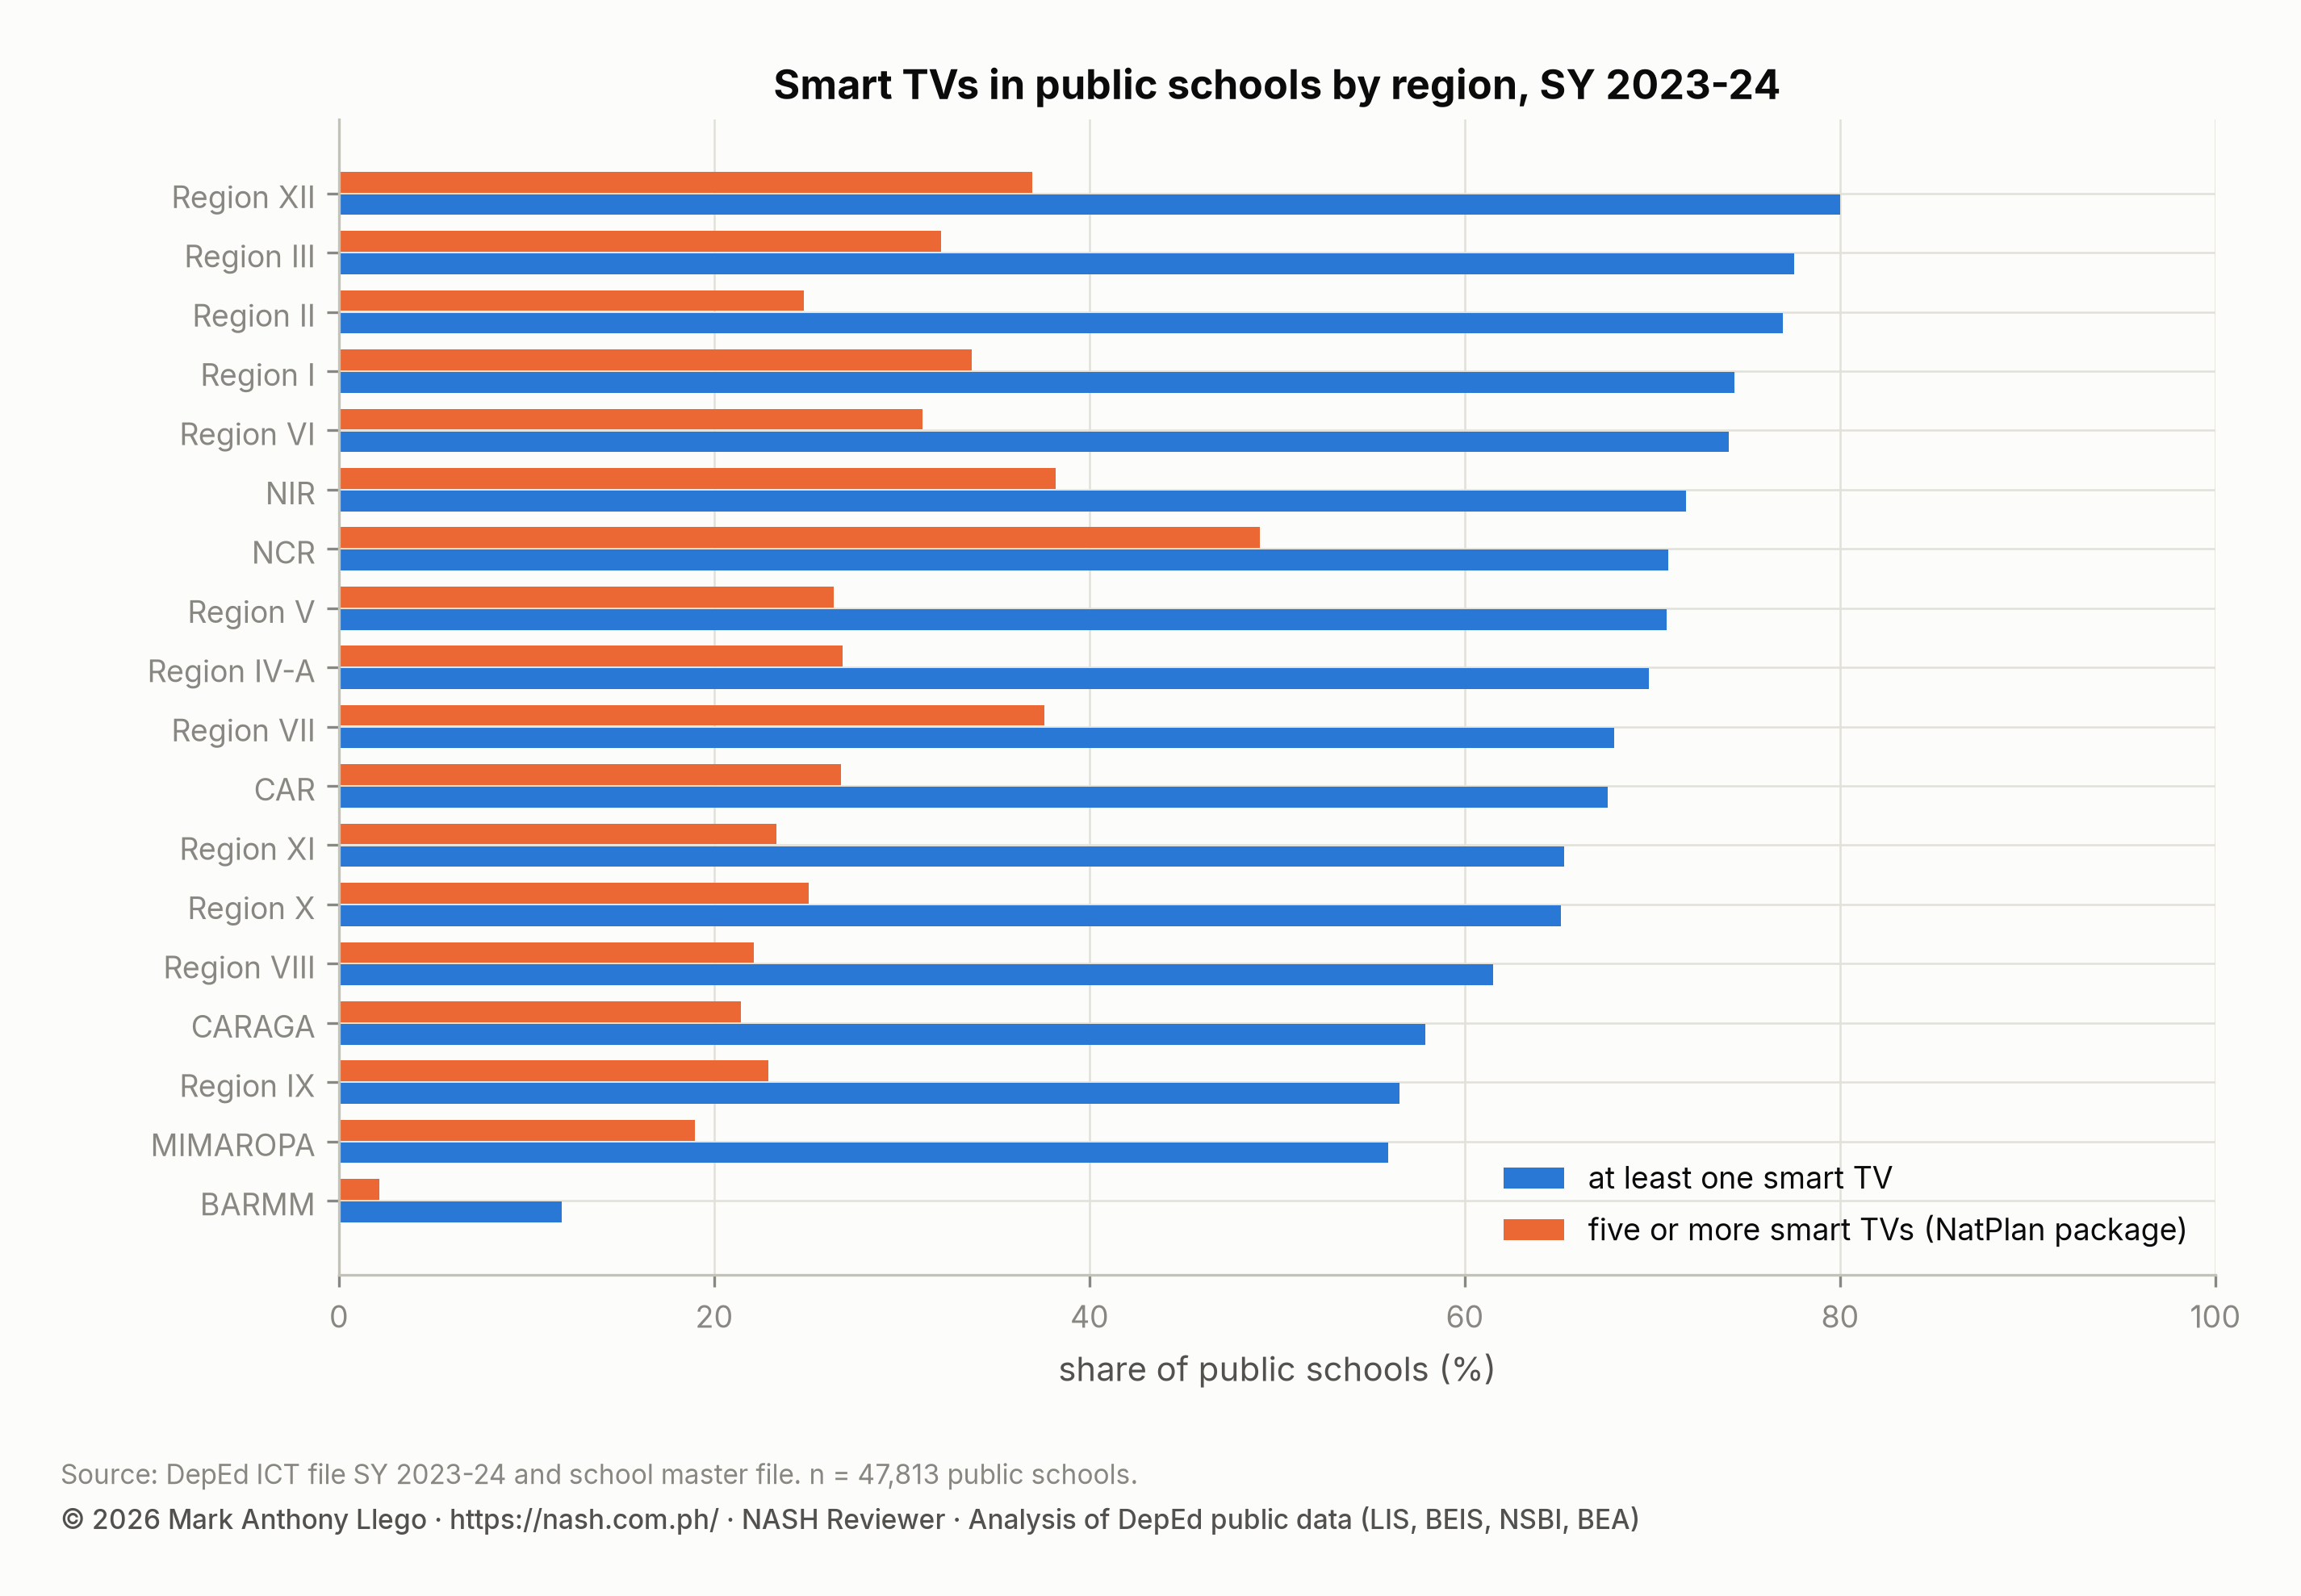
The plan’s baseline for output 2.1.3.d is 34% of schools with a smart TV package in 2025, or 15,404 of 45,794 schools. The target rises to 72% by 2028 and 100% by 2031, with five TVs per package. In the SY 2023-2024 file, 31,524 public schools (65.9%) have at least one smart TV. 12,958 schools (27.1%) have five or more, and the median school that has any has four.
Counting LED TVs as well, 83.8% of schools have a television of some kind. The two measures, a TV in the school and a package of five, rank the regions very differently.
BARMM has a smart TV in 11.9% of its schools and five in 2.1%. NCR has one in 70.9% and five in 49.1%. Region XII has one in 80.0% of schools and five in 36.9%.
The file counts 0.57 televisions per instructional room in schools whose rooms are known, and 28.9% of schools have at least one TV per room. The ratio is higher in small schools (0.65 in schools of 200 learners or fewer) than in large ones (0.49 in schools above 2,000 learners). A single donated TV covers a small school’s few rooms. By region, the ratio ranges from 0.69 in CAR, Region I and Region II to 0.10 in BARMM.
| Learners in school | Schools | At least one smart TV | Five or more smart TVs | TVs per instructional room | Projector | Router | Any administrative computer | Academic computers per 100 learners |
|---|---|---|---|---|---|---|---|---|
| 1–100 | 8,530 | 54.9% | 8.1% | 0.65 | 40.1% | 17.2% | 47.4% | 10.2 |
| 101–200 | 12,528 | 64.4% | 23.5% | 0.65 | 45.9% | 20.2% | 55.4% | 6.6 |
| 201–500 | 15,288 | 67.4% | 30.1% | 0.6 | 56.4% | 27.5% | 65.0% | 6.9 |
| 501–1,000 | 6,185 | 72.9% | 38.3% | 0.57 | 67.6% | 46.3% | 75.3% | 8.1 |
| 1,001–2,000 | 3,248 | 74.8% | 42.1% | 0.53 | 76.2% | 57.7% | 83.3% | 8.3 |
| over 2,000 | 2,034 | 75.4% | 47.7% | 0.49 | 84.1% | 67.1% | 89.4% | 9.9 |
School size orders everything else. Among schools with more than 2,000 learners, 47.7% have five smart TVs, 84.1% a projector and 67.1% a router. Among schools with 100 learners or fewer, the shares are 8.1%, 40.1% and 17.2%.
If the plan’s 100% target means five TVs in every school, it is mostly a target for the 36,346 schools with 500 learners or fewer. In those schools a package of five would also be more than one TV per classroom.
Computers for teaching and computers for administration
| Type | Academic | Administrative | Administrative share |
|---|---|---|---|
| Desktop | 261,803 | 36,666 | 12.3% |
| Laptop | 231,798 | 58,486 | 20.1% |
| All-in-one | 55,735 | 2,231 | 3.8% |
| Tablet | 926,796 | 21,222 | 2.2% |
| Tablet PC | 286,627 | 5,262 | 1.8% |
| Thin client | 185,381 | 0 | 0.0% |
Public schools have 2,072,007 computers. 1,948,140 are for academic use and 123,867 (6.0%) for administration. Tablets dominate the academic count: 926,796 tablets plus 286,627 tablet PCs, supplied by the tablet packages of the DepEd Computerization Program (DCP).
Laptops (231,798) and desktops (261,803) are a quarter of the academic total. 185,381 thin clients from the older packages are still counted. Administrative computers are almost entirely laptops (58,486) and desktops (36,666).
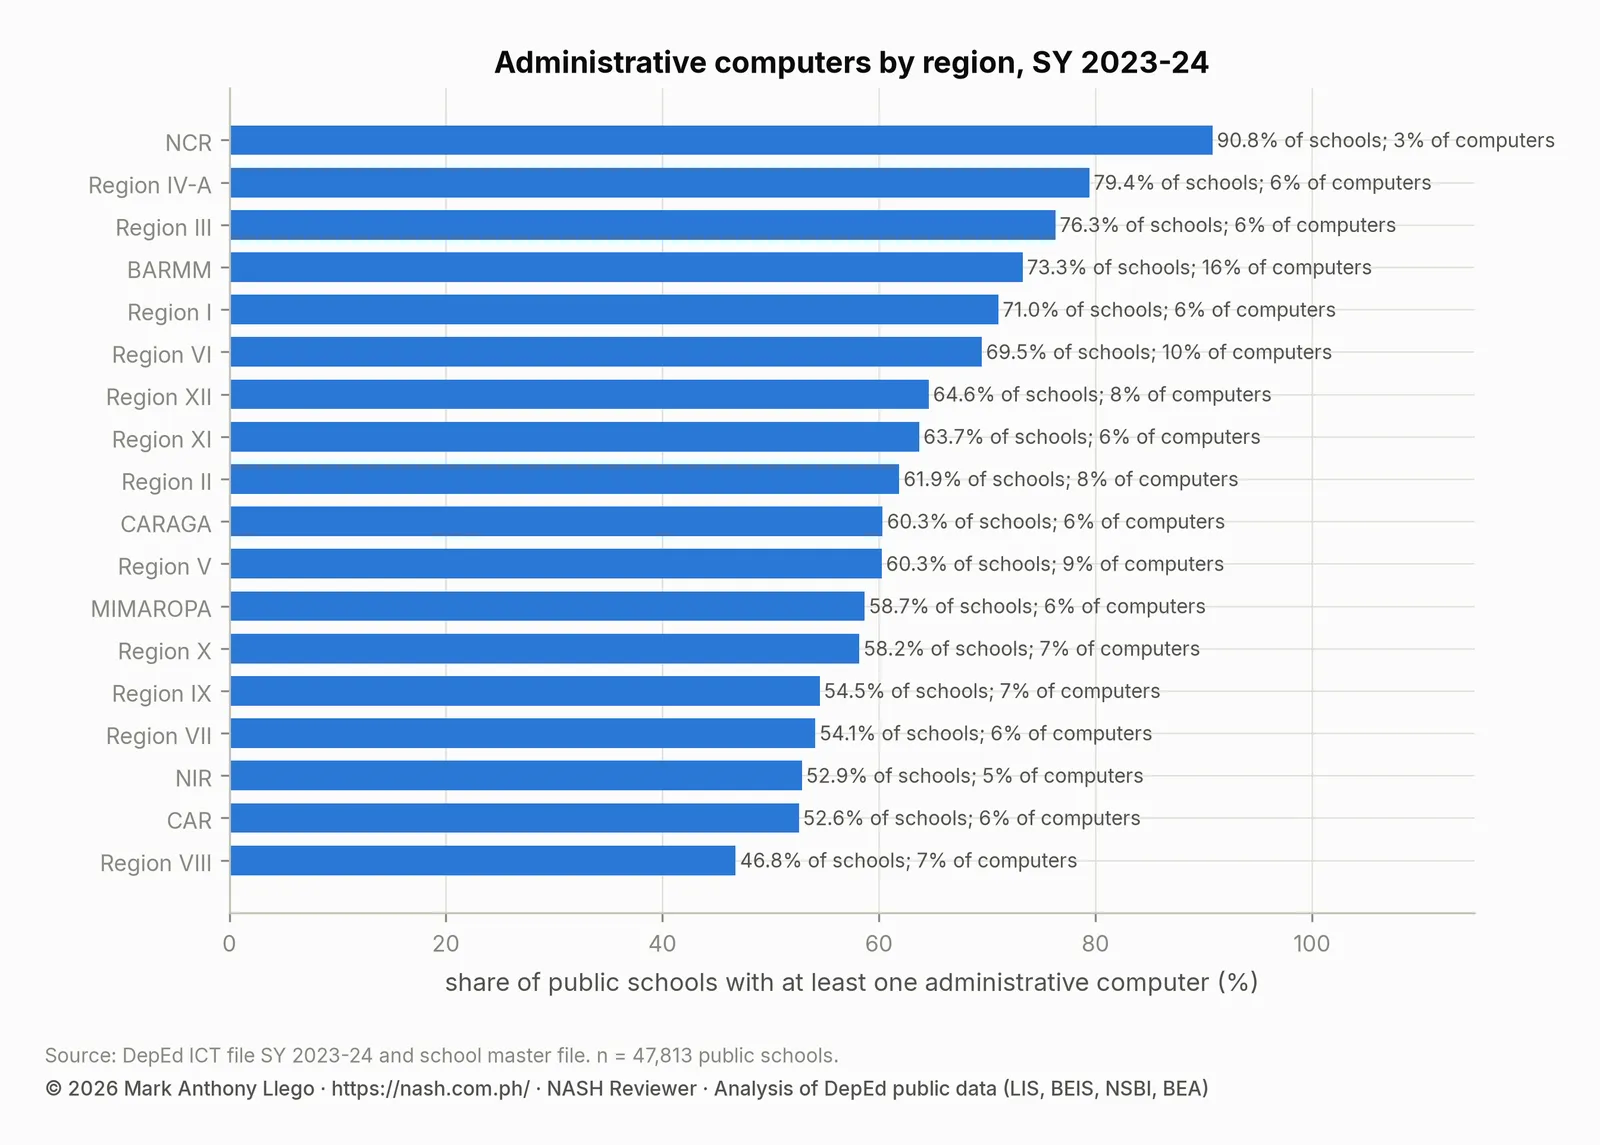
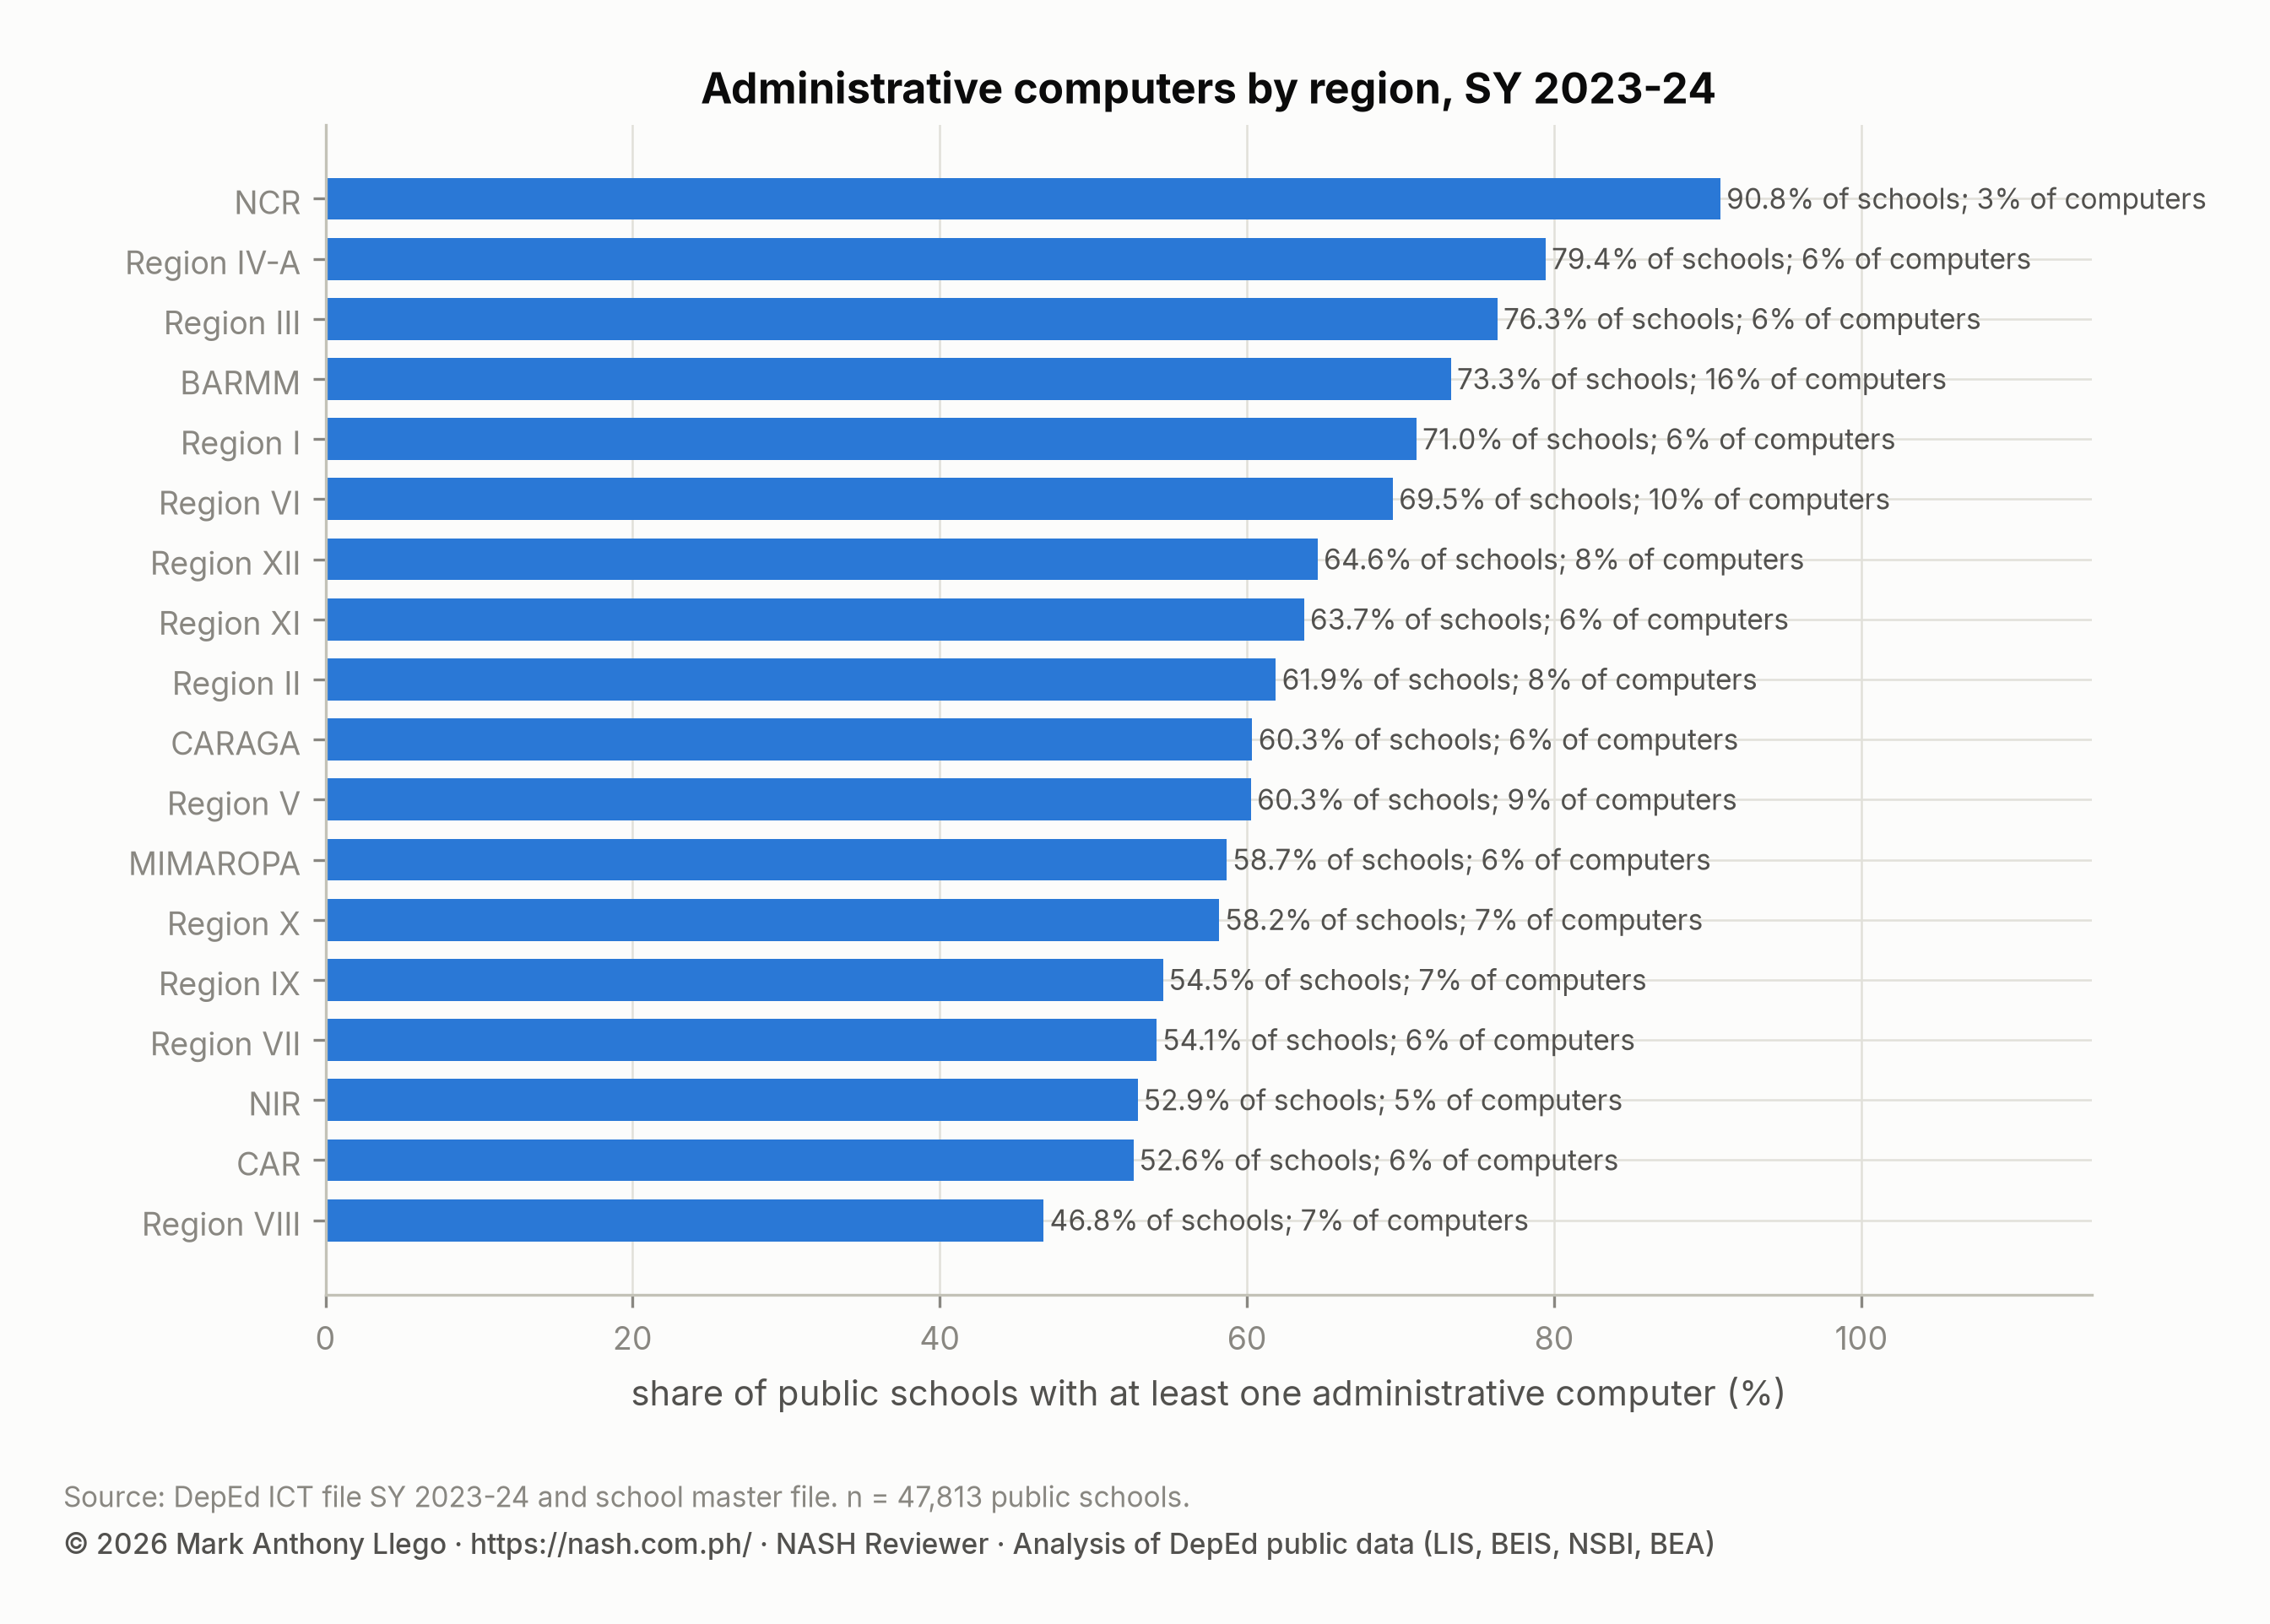
30,105 schools (63.0%) have at least one computer for administration. 11,583 schools have academic computers but none for administration, and 6,125 have no computer of any kind. The share with an administrative computer is 90.8% in NCR, 79.4% in Region IV-A and 76.3% in Region III. It is lowest in Region VIII (46.8%) and CAR (52.6%).
BARMM has an administrative computer in 73.3% of its schools, more than most regions. Administrative machines are 16.4% of all its computers because it has so few for teaching. The plan promises Administrative Officers, a learner information system, e-SF7 and school dashboards. The 17,708 schools without an administrative computer are the first constraint on all of these.
Who paid for school technology: DepEd, LGUs, PTAs and donors
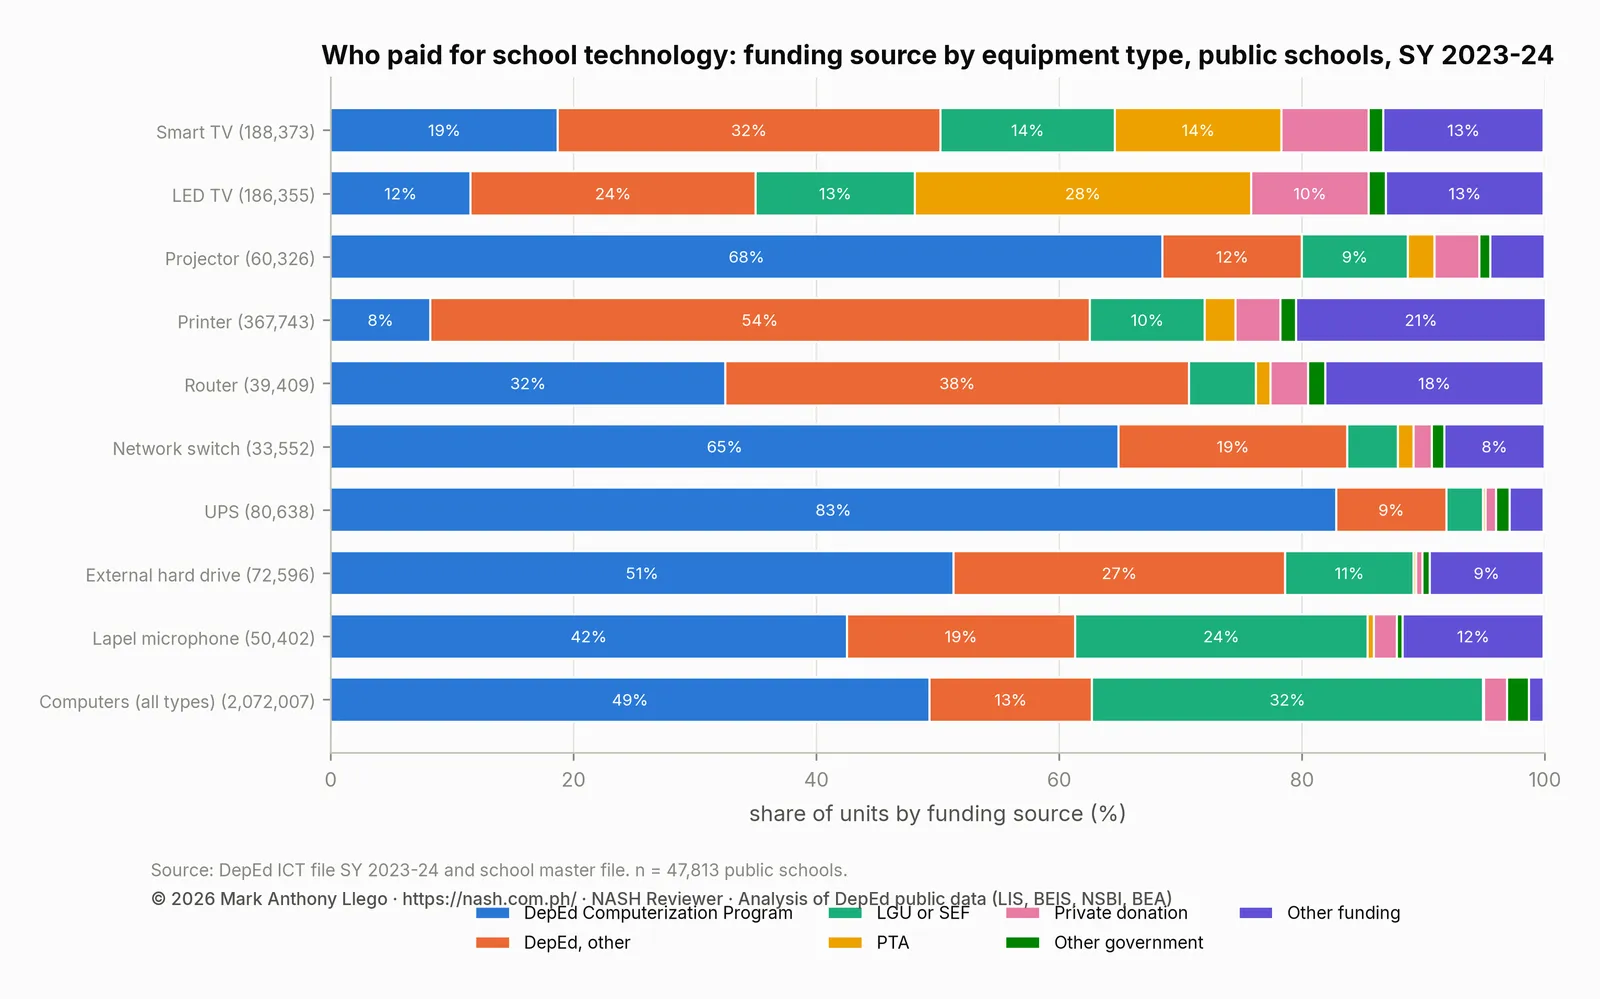
| Equipment | DepEd Computerization Program | DepEd, other | LGU or SEF | PTA | Private donation | Other government | Other funding | Units |
|---|---|---|---|---|---|---|---|---|
| Smart TV | 18.7% | 31.5% | 14.4% | 13.7% | 7.2% | 1.2% | 13.2% | 188,373 |
| LED TV | 11.5% | 23.5% | 13.1% | 27.7% | 9.7% | 1.4% | 13.0% | 186,355 |
| Projector | 68.5% | 11.5% | 8.7% | 2.2% | 3.7% | 0.9% | 4.5% | 60,326 |
| Printer | 8.2% | 54.3% | 9.5% | 2.5% | 3.7% | 1.3% | 20.6% | 367,743 |
| Router | 32.5% | 38.2% | 5.5% | 1.2% | 3.1% | 1.4% | 18.0% | 39,409 |
| Network switch | 64.9% | 18.8% | 4.2% | 1.3% | 1.5% | 1.0% | 8.3% | 33,552 |
| UPS | 82.8% | 9.1% | 3.0% | 0.2% | 0.9% | 1.1% | 2.8% | 80,638 |
| External hard drive | 51.3% | 27.3% | 10.6% | 0.2% | 0.5% | 0.6% | 9.4% | 72,596 |
| Lapel microphone | 42.5% | 18.8% | 24.1% | 0.5% | 1.9% | 0.5% | 11.6% | 50,402 |
| Computers (all types) | 49.3% | 13.4% | 32.2% | 0.1% | 1.9% | 1.8% | 1.2% | 2,072,007 |
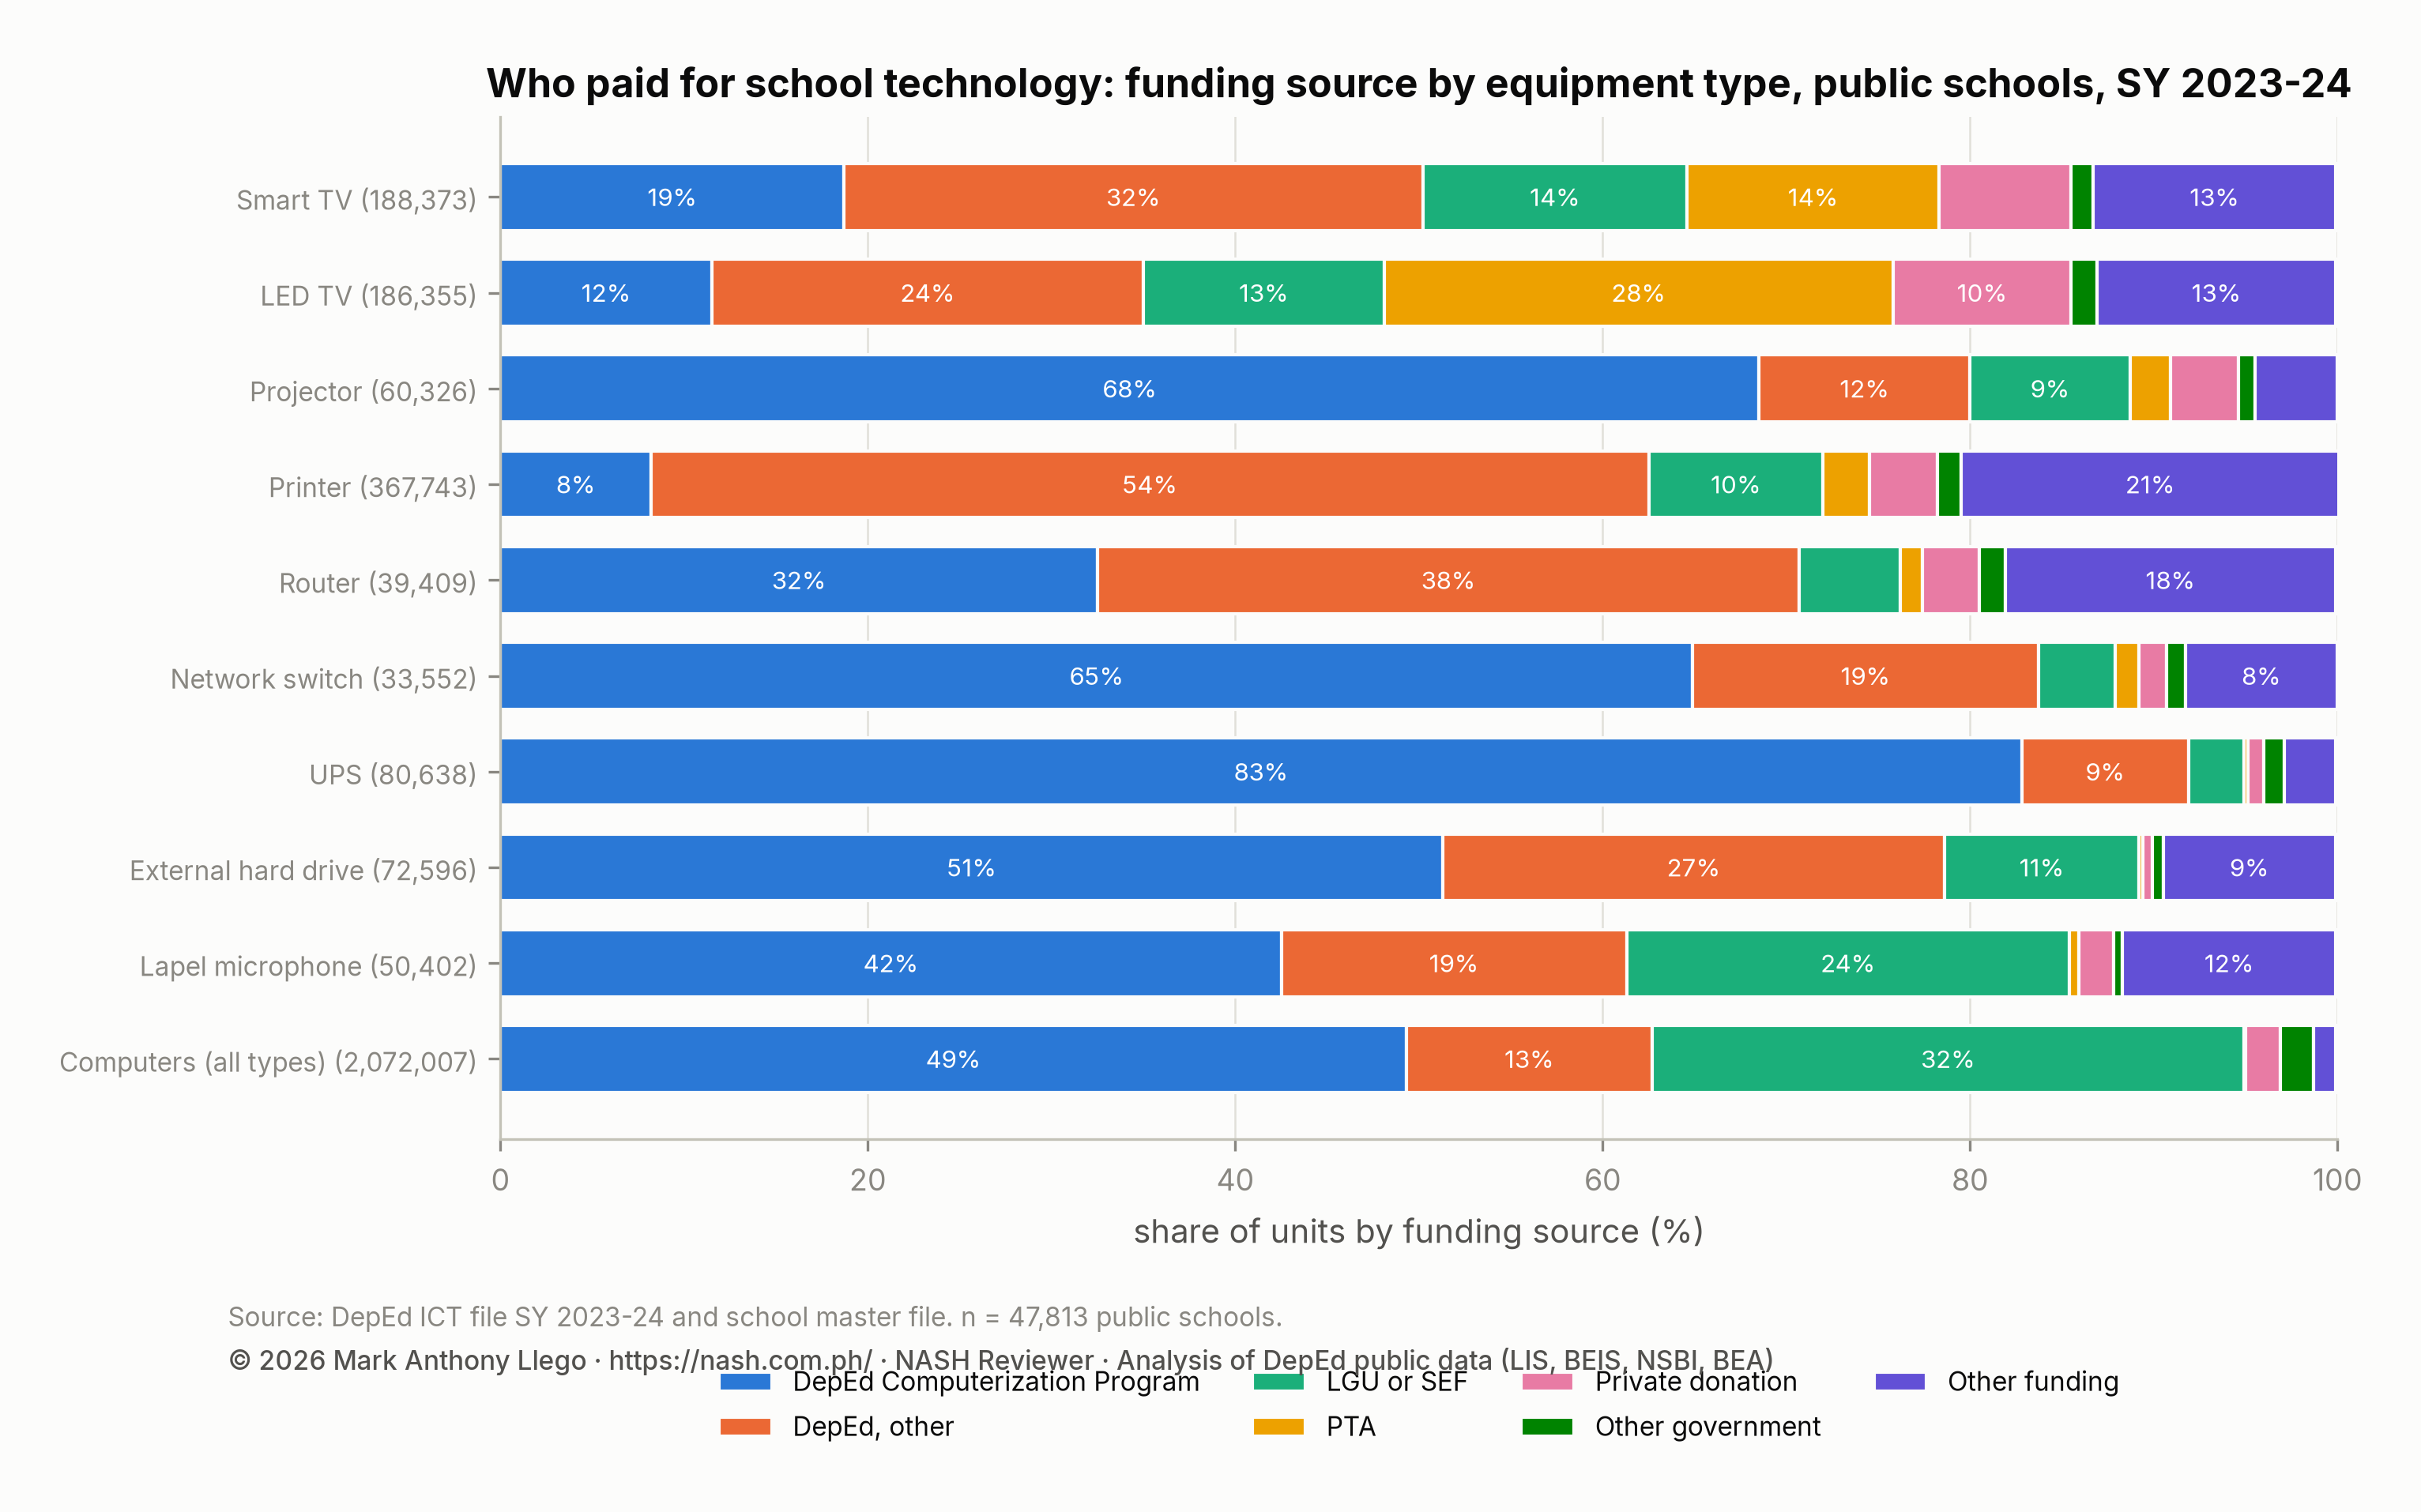
The funding columns show that the national program bought the computing core and everyone else bought the screens. The DepEd Computerization Program paid for 49.3% of computers, 68.5% of projectors and 82.8% of UPS units; the table shows the rest. Local government units (LGUs) and the Special Education Fund (SEF) paid for 32.2% of computers, the second-largest source, and 24.1% of lapel microphones.
Televisions came from every source. The Computerization Program bought 18.7% of smart TVs and 11.5% of LED TVs. Other DepEd funds bought 31.5% and 23.5%. Parent-teacher associations (PTAs) bought 13.7% of smart TVs and 27.7% of LED TVs; the table shows the shares of local governments, private donors and other sources.
Printers are the most “other DepEd” item (54.3%, that is, school Maintenance and Other Operating Expenses, or MOOE) and the most “other funding” item (20.6%). A third of the country’s school televisions were bought by parents or local councils, which is one reason the televisions are in the places that have money.
DepEd data against each National Education Plan target
- Internet in every elementary school by 2028. The plan’s baseline is 79.2% of elementary schools in 2025. The SY 2023-2024 WASH file has 76.2% of public elementary schools connected, covering 87.7% of elementary learners. The school toilets and utilities report shows that 13.6% of connected schools use the connection for administration only.
- A laptop for every teacher. The file counts 231,798 academic laptops and 58,486 administrative ones against 909,348 public school teachers. It does not say which laptops are assigned to teachers. The plan’s own baseline is 16.03%.
- Five smart TVs per school, 72% by 2028. In SY 2023-2024, 27.1% of public schools had five or more and 65.9% had at least one.
- eLearning carts. The file cannot identify them. The plan’s baseline is 383 elementary schools.
- Electrification. 97.4% of public schools report electricity of some kind, and 5.0% run on off-grid power only. The plan’s baseline is 93% of schools on the grid and 3,358 schools to electrify.
- Electrical upgrading for 6,435 schools. The file cannot measure this. 24.0% of schools have a UPS and 29.9% a router, a rough measure of how many have wiring and power that a technology package can run on.
What the file cannot say
- The file counts units, not working units, ages or locations. A smart TV in a storeroom and one in a Grade 3 classroom count the same.
- Tablets bought in 2019 and thin clients from the 2012 packages are in the same totals as current devices.
- The file does not record teacher laptops as such, bandwidth, or the eLearning cart packages the plan counts.
- The report excludes the few hundred schools without ICT data.
What this means for school heads
Strand 2.3 of the Philippine Professional Standards for School Heads (PPSSH), “school facilities and equipment”, covers “acquisition, recording, utilization, repair and maintenance, storage, and disposal”. Strand 2.1 asks a school head to manage school data “using technology, including ICT”. The inventory in this file is the record that strand 2.3 refers to. The funding columns are the history of how a school’s previous heads acquired what it has.
A school head who knows that the PTA bought the school’s four smart TVs and the Computerization Program bought the projector knows whom to ask for the fifth TV. In a school without an administrative computer in SY 2023-2024, the Administrative Officer II (AO II) that the plan promises for 2026 will arrive before the machine. The SY 2023-2024 ICT report has computers per learner by division, and the National Education Plan guide has the targets in full.
Frequently asked questions
How many DepEd public schools have a smart TV?
31,524 of 47,813 public schools (65.9%) reported at least one smart TV in SY 2023-2024. 12,958 (27.1%) reported five or more, the package the National Education Plan counts. 83.8% have a television of some kind.
Who paid for the televisions in DepEd public schools?
Other DepEd funds paid for 31.5% of smart TVs, the Computerization Program 18.7%, and local governments and the SEF 14.4%. Parent-teacher associations paid for 13.7%, other sources 13.2% and private donors 7.2%. PTAs paid for 27.7% of LED TVs.
How many DepEd public schools have no computer for administration?
17,708 public schools (37.0%) reported no administrative computer in SY 2023-2024. 11,583 of them have computers for teaching only, and 6,125 have no computer at all.
Download the data
The cleaned, harmonized DepEd files behind this series are free to download in CSV and Parquet, with a codebook and checksums, under the terms of use set out in the release. Download Cleaned DepEd School Data, SY 2017-18 to 2025-26 documents every file and column. The files themselves are at data.nash.com.ph, starting with the README, the SY 2023-24 school master file (CSV, 8.0 MB) and the nine-year enrollment panel (Parquet, 17.2 MB).
More in this series
- DepEd ICT Data SY 2023-2024: Computers and Internet
- DepEd WASH Data SY 2023-2024: Toilets, Water, Electricity
- DepEd School Toilets for Girls, Boys and PWD, SY 2023-2024
- National Education Plan 2026-2035: Guide for School Heads
- DepEd Data for Aspiring School Heads: Where to Start
- For aspiring school heads: PPSSH Domain 2 Through the Data and the full report, Philippine basic education in numbers
Analysis and charts by Mark Anthony Llego for NASH Reviewer. Data: Department of Education ICT, WASH and learner datasets SY 2023-24 (public datasets); EDCOM II, National Education Plan 2026-2035. Charts may be reused only with written permission from support@nash.com.ph.