DepEd’s SY 2023-2024 learner dataset shows who the learners in public schools are. It counts Indigenous Peoples (IP) learners, Balik-Aral returnees, learners in Arabic Language and Islamic Values Education (ALIVE) classes and learners in multigrade classes, and it gives each school’s size. The figures below cover the 47,814 public schools that had learners in SY 2023-2024.
The learner dataset goes beyond the enrollment count. For every school, it records how many learners are IP and how many returned to school after a gap of a year or more (Balik-Aral). It also records how many are in the ALIVE program, how many are served through alternative delivery modes, and how many elementary learners sit in multigrade classes. A school head’s first duty is to know who is in the school, and this file is where that knowledge starts.
The companion report, Philippine basic education in numbers, holds the full method notes. The enrollment trends report for SY 2017-2018 to SY 2025-2026 covers how the headcount moved over nine years.
Key findings
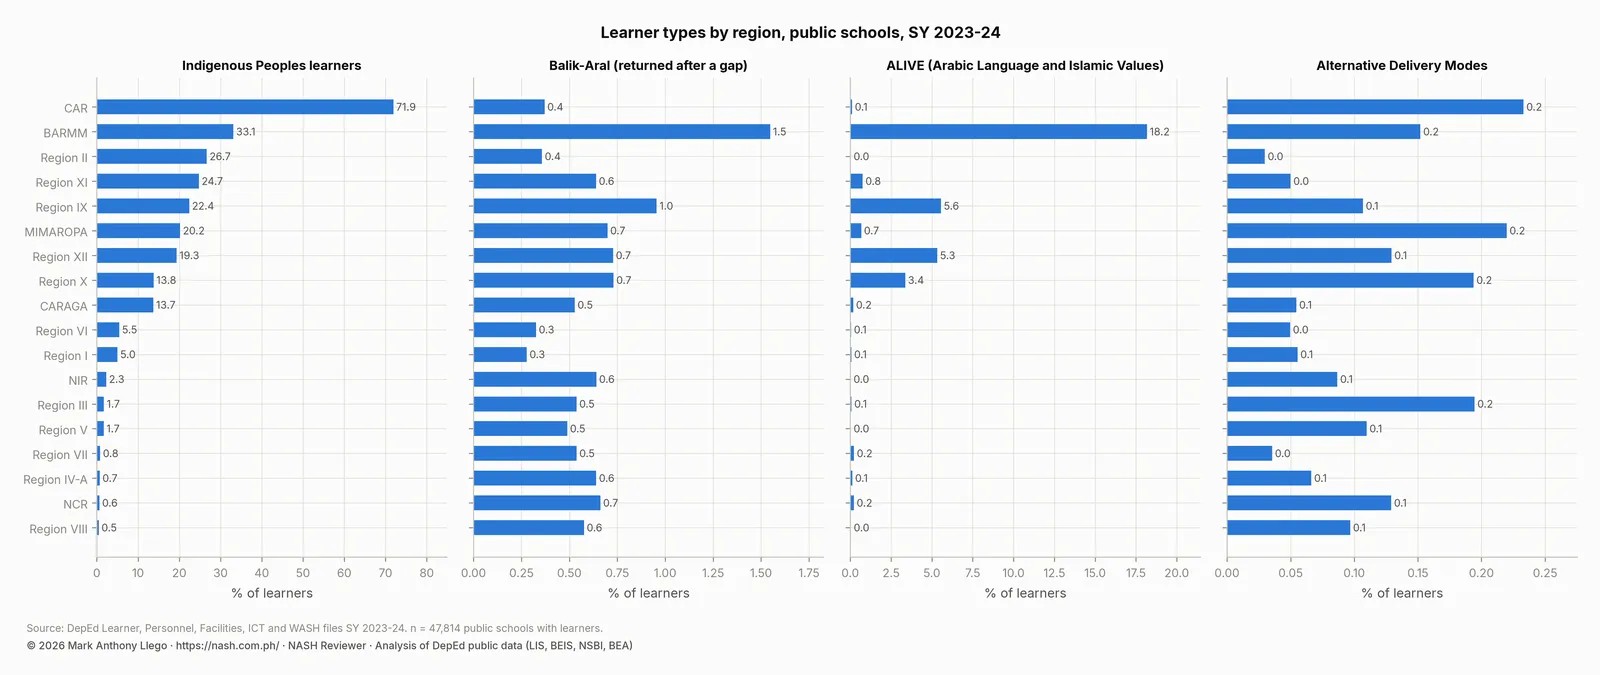
- 2,162,636 public school learners, 9.3% of the total, are Indigenous Peoples (IP). The share runs from 71.9% in CAR and 33.1% in BARMM to under 1% in NCR, Region IV-A, Region VII and Region VIII.
- 329,954 learners (1.4%) are in ALIVE classes, concentrated in BARMM (18.2% of its learners), Region IX (5.6%), Region XII (5.3%) and Region X (3.4%).
- 143,558 learners (0.6%) are Balik-Aral, back in school after a year or more away; BARMM (1.5%) and Region IX (1.0%) have the highest shares.
- Alternative delivery modes reach 24,956 learners (0.1%). The programs exist, but at a small scale.
- 2.0% of public elementary learners are taught in multigrade classes, but 15.2% of public schools offer them. In CAR, 39.7% of schools do, and in Region VIII, 33.1%.
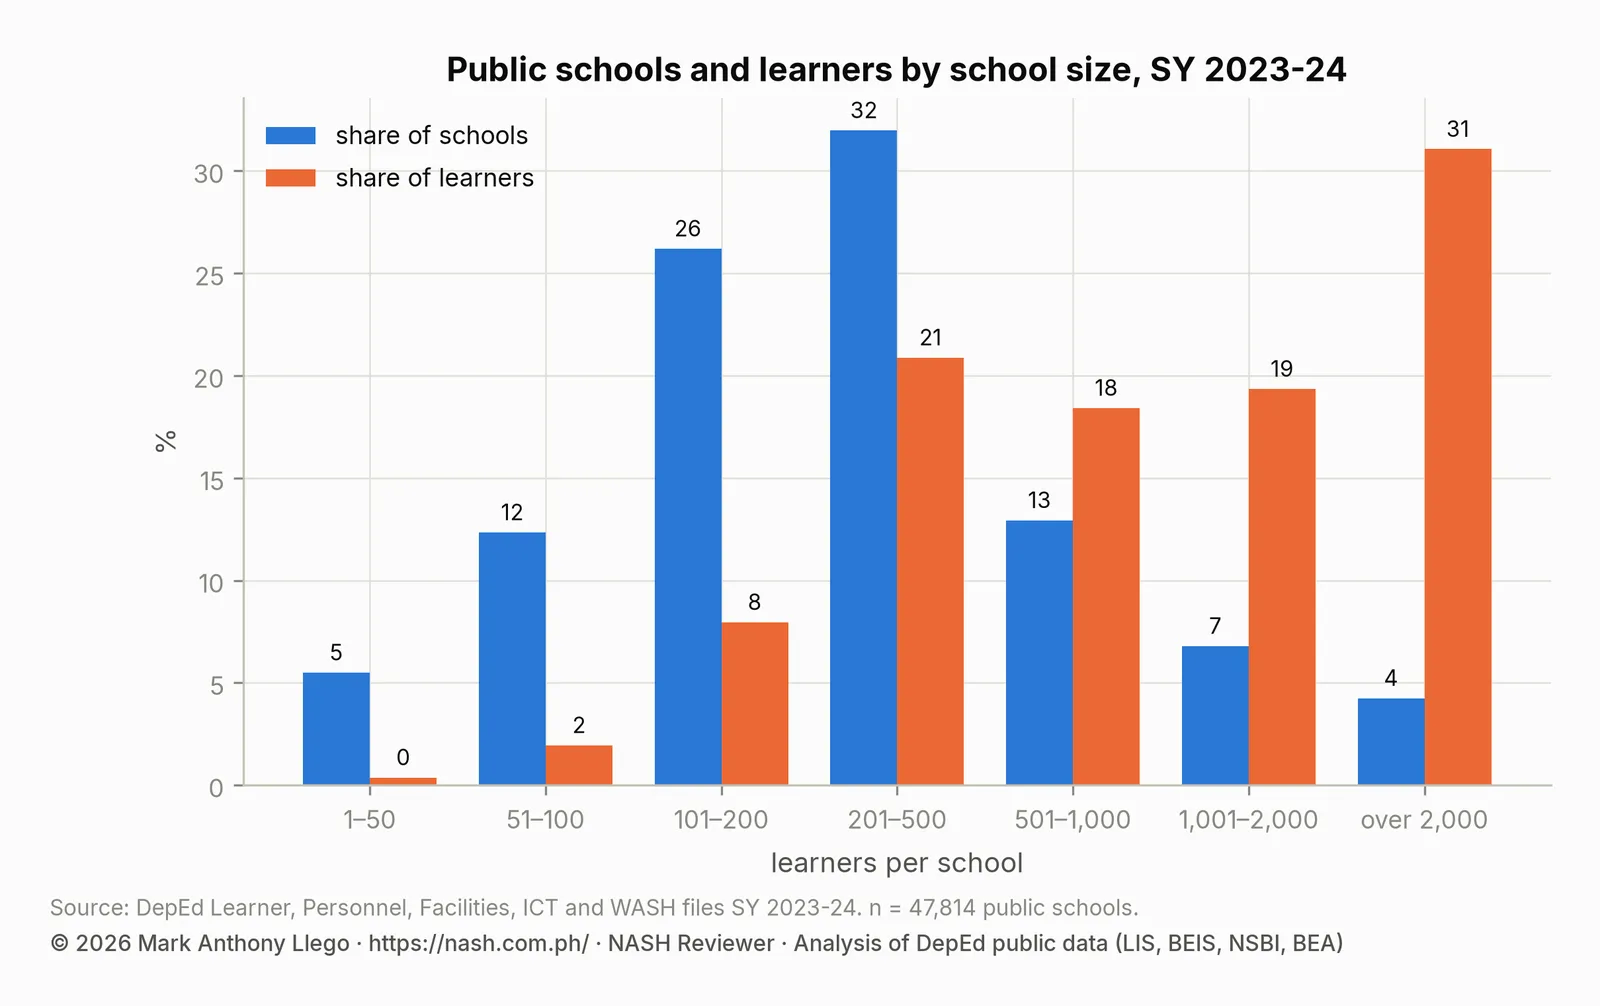
- School size is extremely unequal. The median public school has 232 learners; schools with more than 1,000 learners are 11% of schools and hold 51% of learners.
Indigenous Peoples learners in public schools by region
The learner file counts Indigenous Cultural Communities and Indigenous Peoples (ICCs/IPs) learners by grade and sex. Nationally, 2.16 million public school learners, or 9.3%, are IP. The regional pattern follows the location of ancestral domains. CAR (71.9% of learners), BARMM (33.1%), Region II (26.7%), Region XI (24.7%), Region IX (22.4%), MIMAROPA (20.2%) and Region XII (19.4%) have large IP populations. NCR, Region IV-A, Region VII and Region VIII have fewer than 1%.
The IP share matters for results. In the five regions with assessment data, a higher share of IP learners in a school goes with a lower share of Grade 1 to 3 learners reading at grade level. The association holds after comparing schools within the same division and holding other inputs constant: about −1.7 percentage points per standard deviation of the IP share. The analysis of school inputs and test results has the full model.
The association is a signal that these schools need support, not a judgment of the learners. IP learners are concentrated in remote, small, multigrade schools with the fewest resources.
Balik-Aral, ALIVE and alternative delivery mode learners
Balik-Aral learners finished a grade, stopped schooling for a year or more, and then enrolled in the next grade. They are 0.6% of public school learners nationally, 1.5% in BARMM and 1.0% in Region IX. The shares are small, but these are the learners most at risk of leaving again. A school with 500 learners has three of them on average.
ALIVE adds Arabic language and Islamic values to the regular curriculum for Muslim learners. It reaches 329,954 public school learners. Most of them are in BARMM, where 18.2% of learners are in ALIVE classes, and the rest mostly in Regions IX, XII and X. Elsewhere the share is below 1%.
Alternative delivery modes (ADM) serve 24,956 learners, 0.1% of the total. The file records five modes: distance education for SPED, e-IMPACT, MISOSA, Open High School and school-initiated interventions. No region exceeds 0.25%. The modes exist in the system, but they reach only one learner in a thousand.
| Region | Public schools | Learners | Indigenous Peoples | Balik-Aral | ALIVE | Alternative delivery modes | ES learners in multigrade classes | Schools offering multigrade |
|---|---|---|---|---|---|---|---|---|
| BARMM | 2,155 | 769,022 | 33.1% | 1.55% | 18.2% | 0.15% | 3.4% | 11.2% |
| CAR | 1,844 | 358,204 | 71.9% | 0.37% | 0.1% | 0.23% | 9.9% | 39.7% |
| CARAGA | 2,099 | 700,496 | 13.7% | 0.53% | 0.2% | 0.05% | 3.9% | 20.8% |
| MIMAROPA | 2,382 | 817,395 | 20.2% | 0.70% | 0.7% | 0.22% | 4.0% | 19.7% |
| NCR | 827 | 2,101,985 | 0.6% | 0.66% | 0.2% | 0.13% | 0.0% | 0.6% |
| NIR | 2,231 | 1,134,333 | 2.3% | 0.64% | 0.0% | 0.09% | 0.9% | 7.3% |
| Region I | 2,861 | 1,101,162 | 5.0% | 0.28% | 0.1% | 0.06% | 1.8% | 12.0% |
| Region II | 2,539 | 809,342 | 26.7% | 0.36% | 0.0% | 0.03% | 3.8% | 18.9% |
| Region III | 3,729 | 2,478,610 | 1.7% | 0.54% | 0.1% | 0.19% | 0.2% | 2.6% |
| Region IV-A | 3,564 | 3,188,202 | 0.7% | 0.64% | 0.1% | 0.07% | 0.3% | 4.8% |
| Region IX | 2,993 | 1,106,260 | 22.4% | 0.96% | 5.6% | 0.11% | 3.3% | 16.8% |
| Region V | 3,862 | 1,581,329 | 1.7% | 0.49% | 0.0% | 0.11% | 1.6% | 10.7% |
| Region VI | 2,835 | 1,040,714 | 5.5% | 0.33% | 0.1% | 0.05% | 1.9% | 12.8% |
| Region VII | 2,810 | 1,456,462 | 0.8% | 0.54% | 0.2% | 0.04% | 1.1% | 11.3% |
| Region VIII | 4,179 | 1,141,816 | 0.5% | 0.58% | 0.0% | 0.10% | 8.5% | 33.1% |
| Region X | 2,531 | 1,159,212 | 13.8% | 0.73% | 3.4% | 0.19% | 3.0% | 18.9% |
| Region XI | 2,218 | 1,218,778 | 24.7% | 0.64% | 0.8% | 0.05% | 1.6% | 12.7% |
| Region XII | 2,155 | 1,062,105 | 19.3% | 0.73% | 5.3% | 0.13% | 1.8% | 11.9% |
| Philippines (public) | 47,814 | 23,225,427 | 9.3% | 0.62% | 1.4% | 0.11% | 2.0% | 15.2% |
Multigrade classes in public elementary schools
A multigrade class combines two or more grade levels under one teacher. For elementary schools, the learner file records how many learners are in monograde classes and how many are in multigrade classes. Nationally, 2.0% of elementary learners are in multigrade classes, but 15.2% of public schools offer them. Multigrade classes are a feature of small schools, so they cover many schools and few learners.
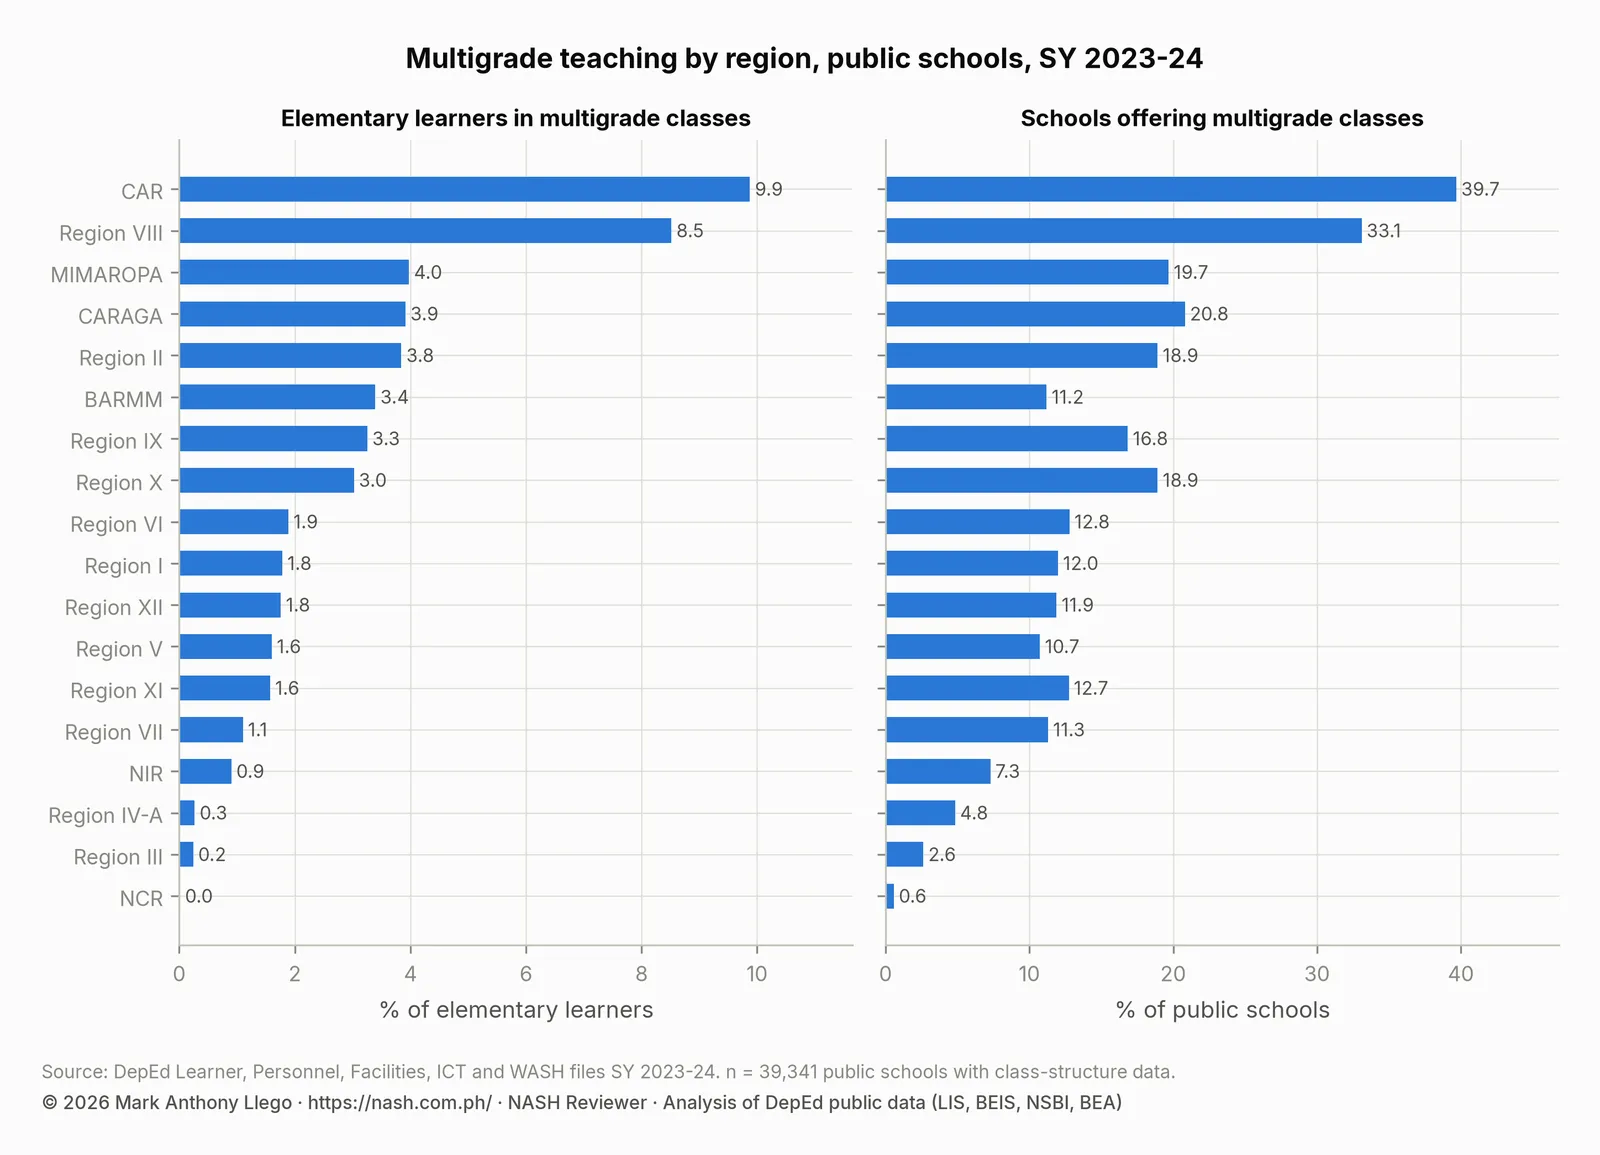
CAR has the most multigrade teaching: 9.9% of its elementary learners and 39.7% of its schools. Region VIII follows with 8.5% of learners and 33.1% of schools. CARAGA, MIMAROPA, Region II and Region X come next, at about 4% of learners and 19% to 21% of schools. NCR, Region III and Region IV-A have almost none.
Multigrade organization is the one input associated with lower test results in every model and every region of the assessed divisions. The association is about −1.2 points on the Grade 3 Early Language, Literacy and Numeracy Assessment (ELLNA) and −1.3 points on the Grade 6 National Achievement Test (NAT) per standard deviation of the multigrade share. That is roughly 4 points between a fully multigrade and a fully monograde school in the same division.
This is an association in observational data, not a measured effect of multigrade teaching, because multigrade schools are also small, remote and poorer. It still marks multigrade schools as the places where support is most needed.
Public school size: median and distribution
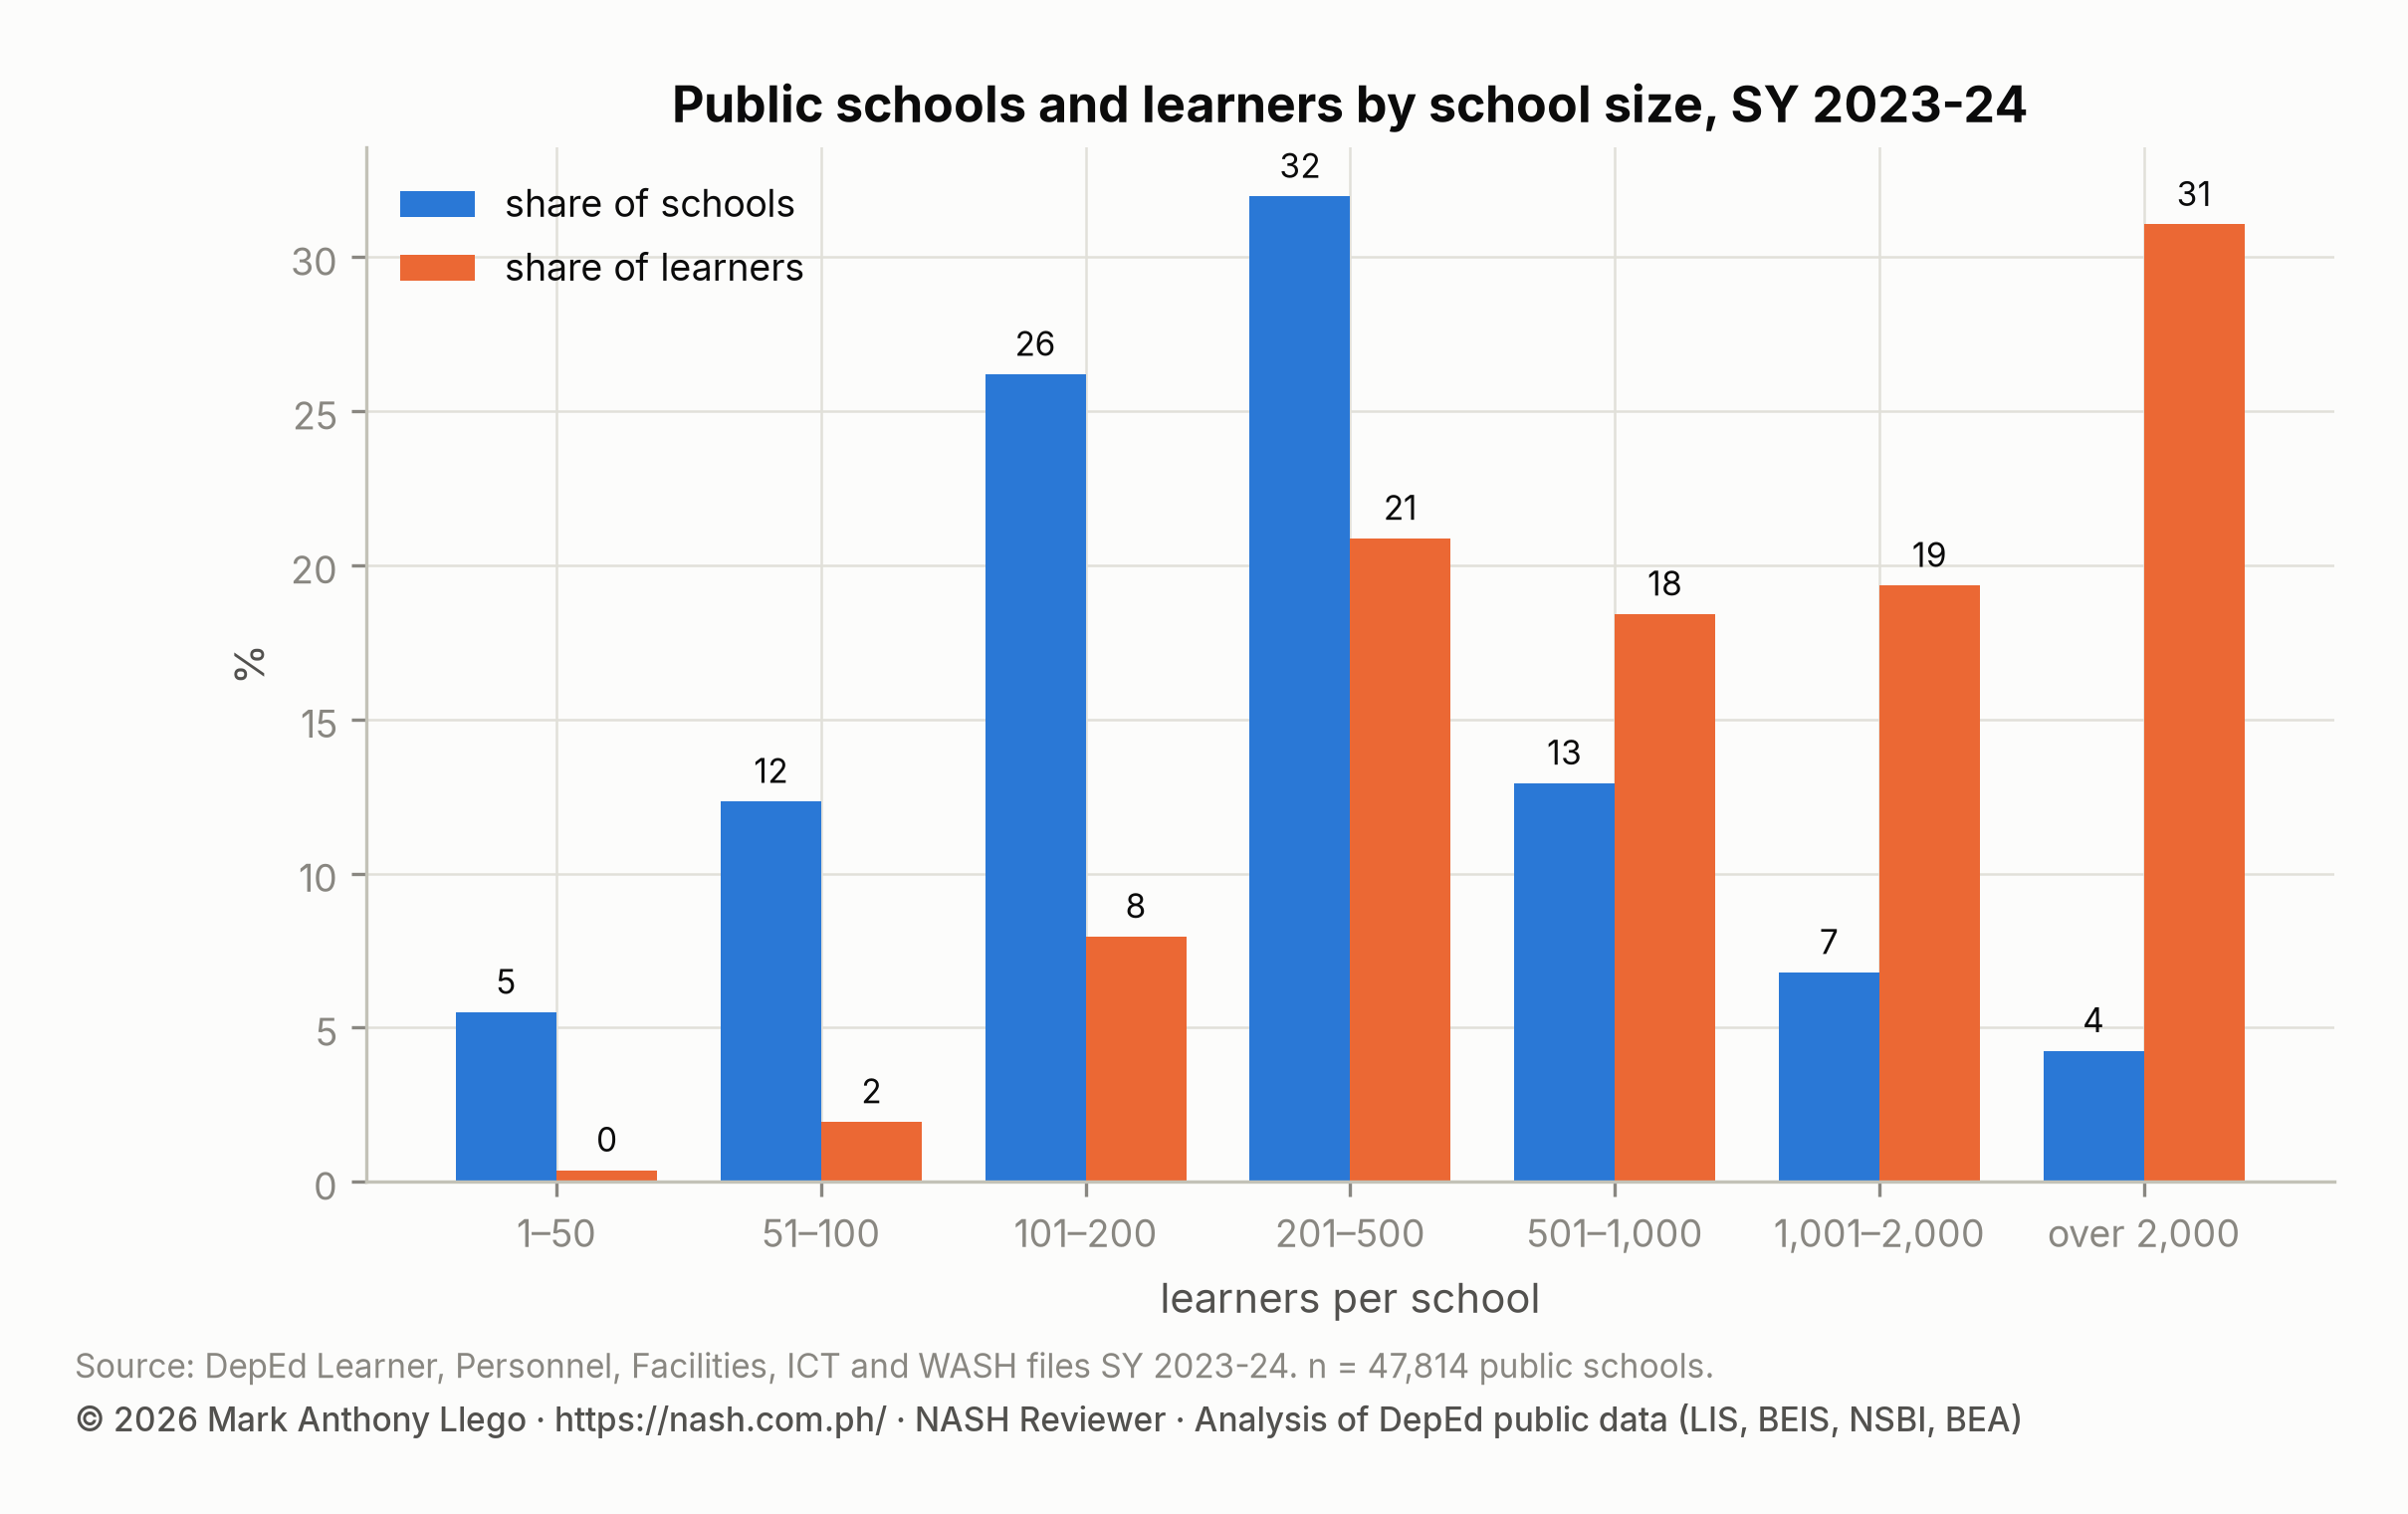
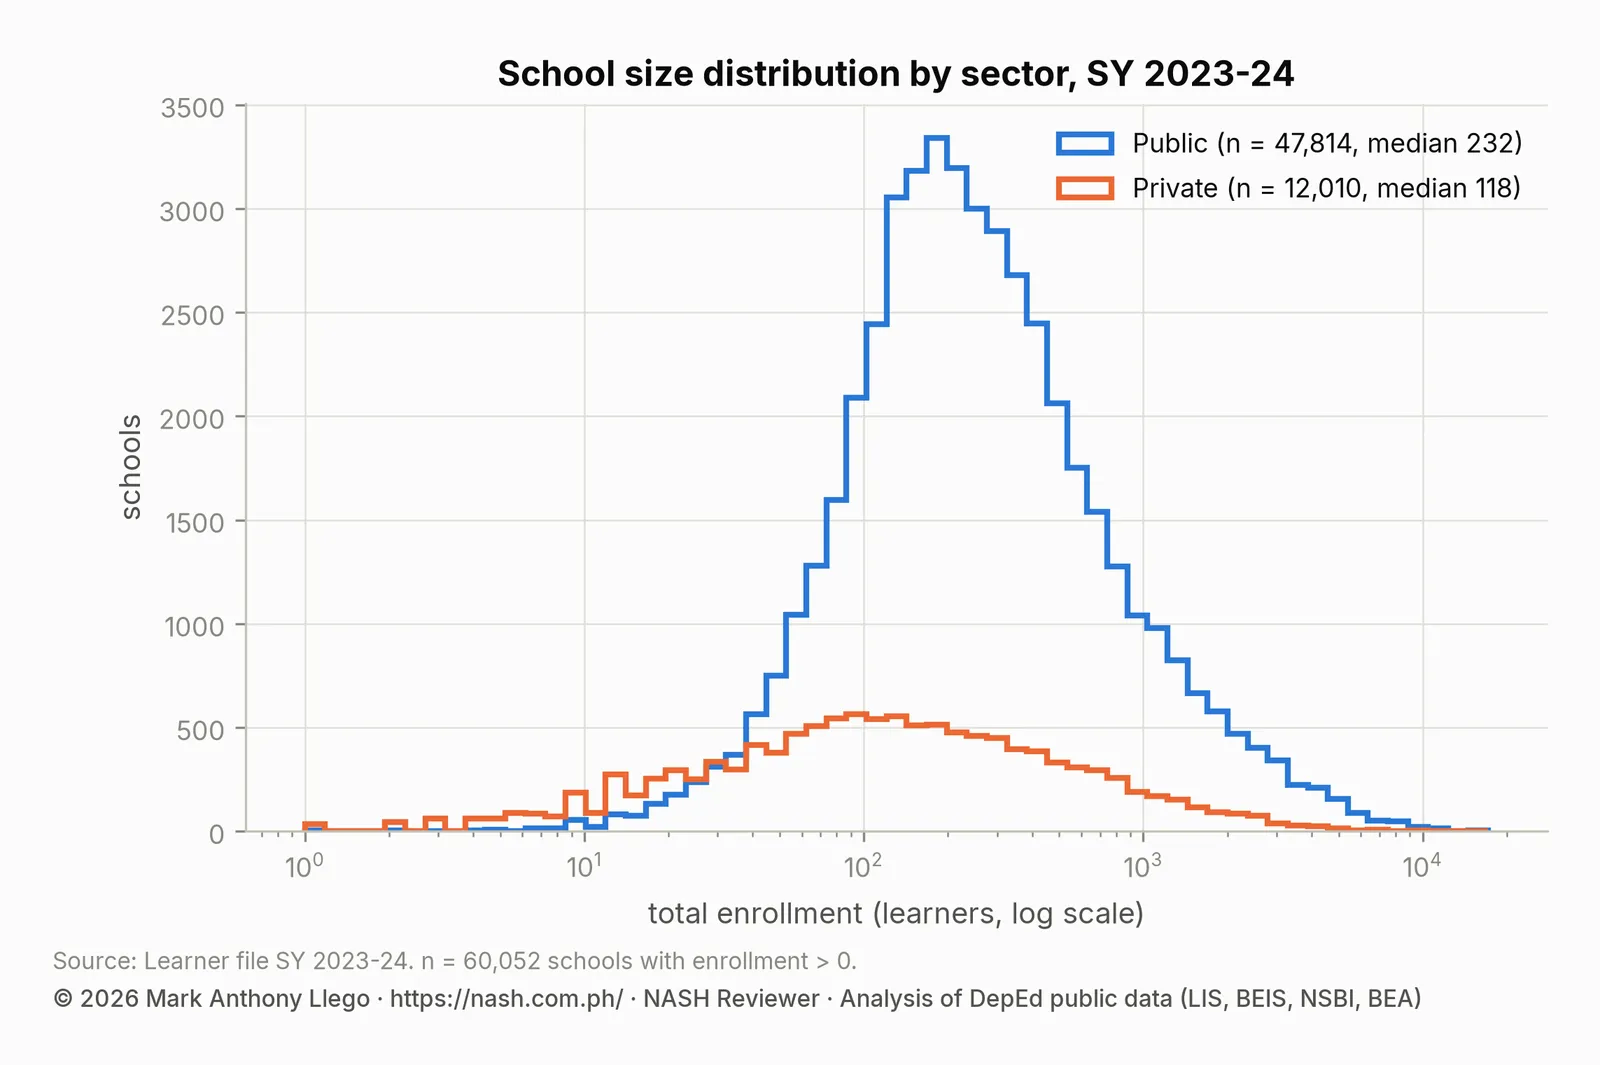
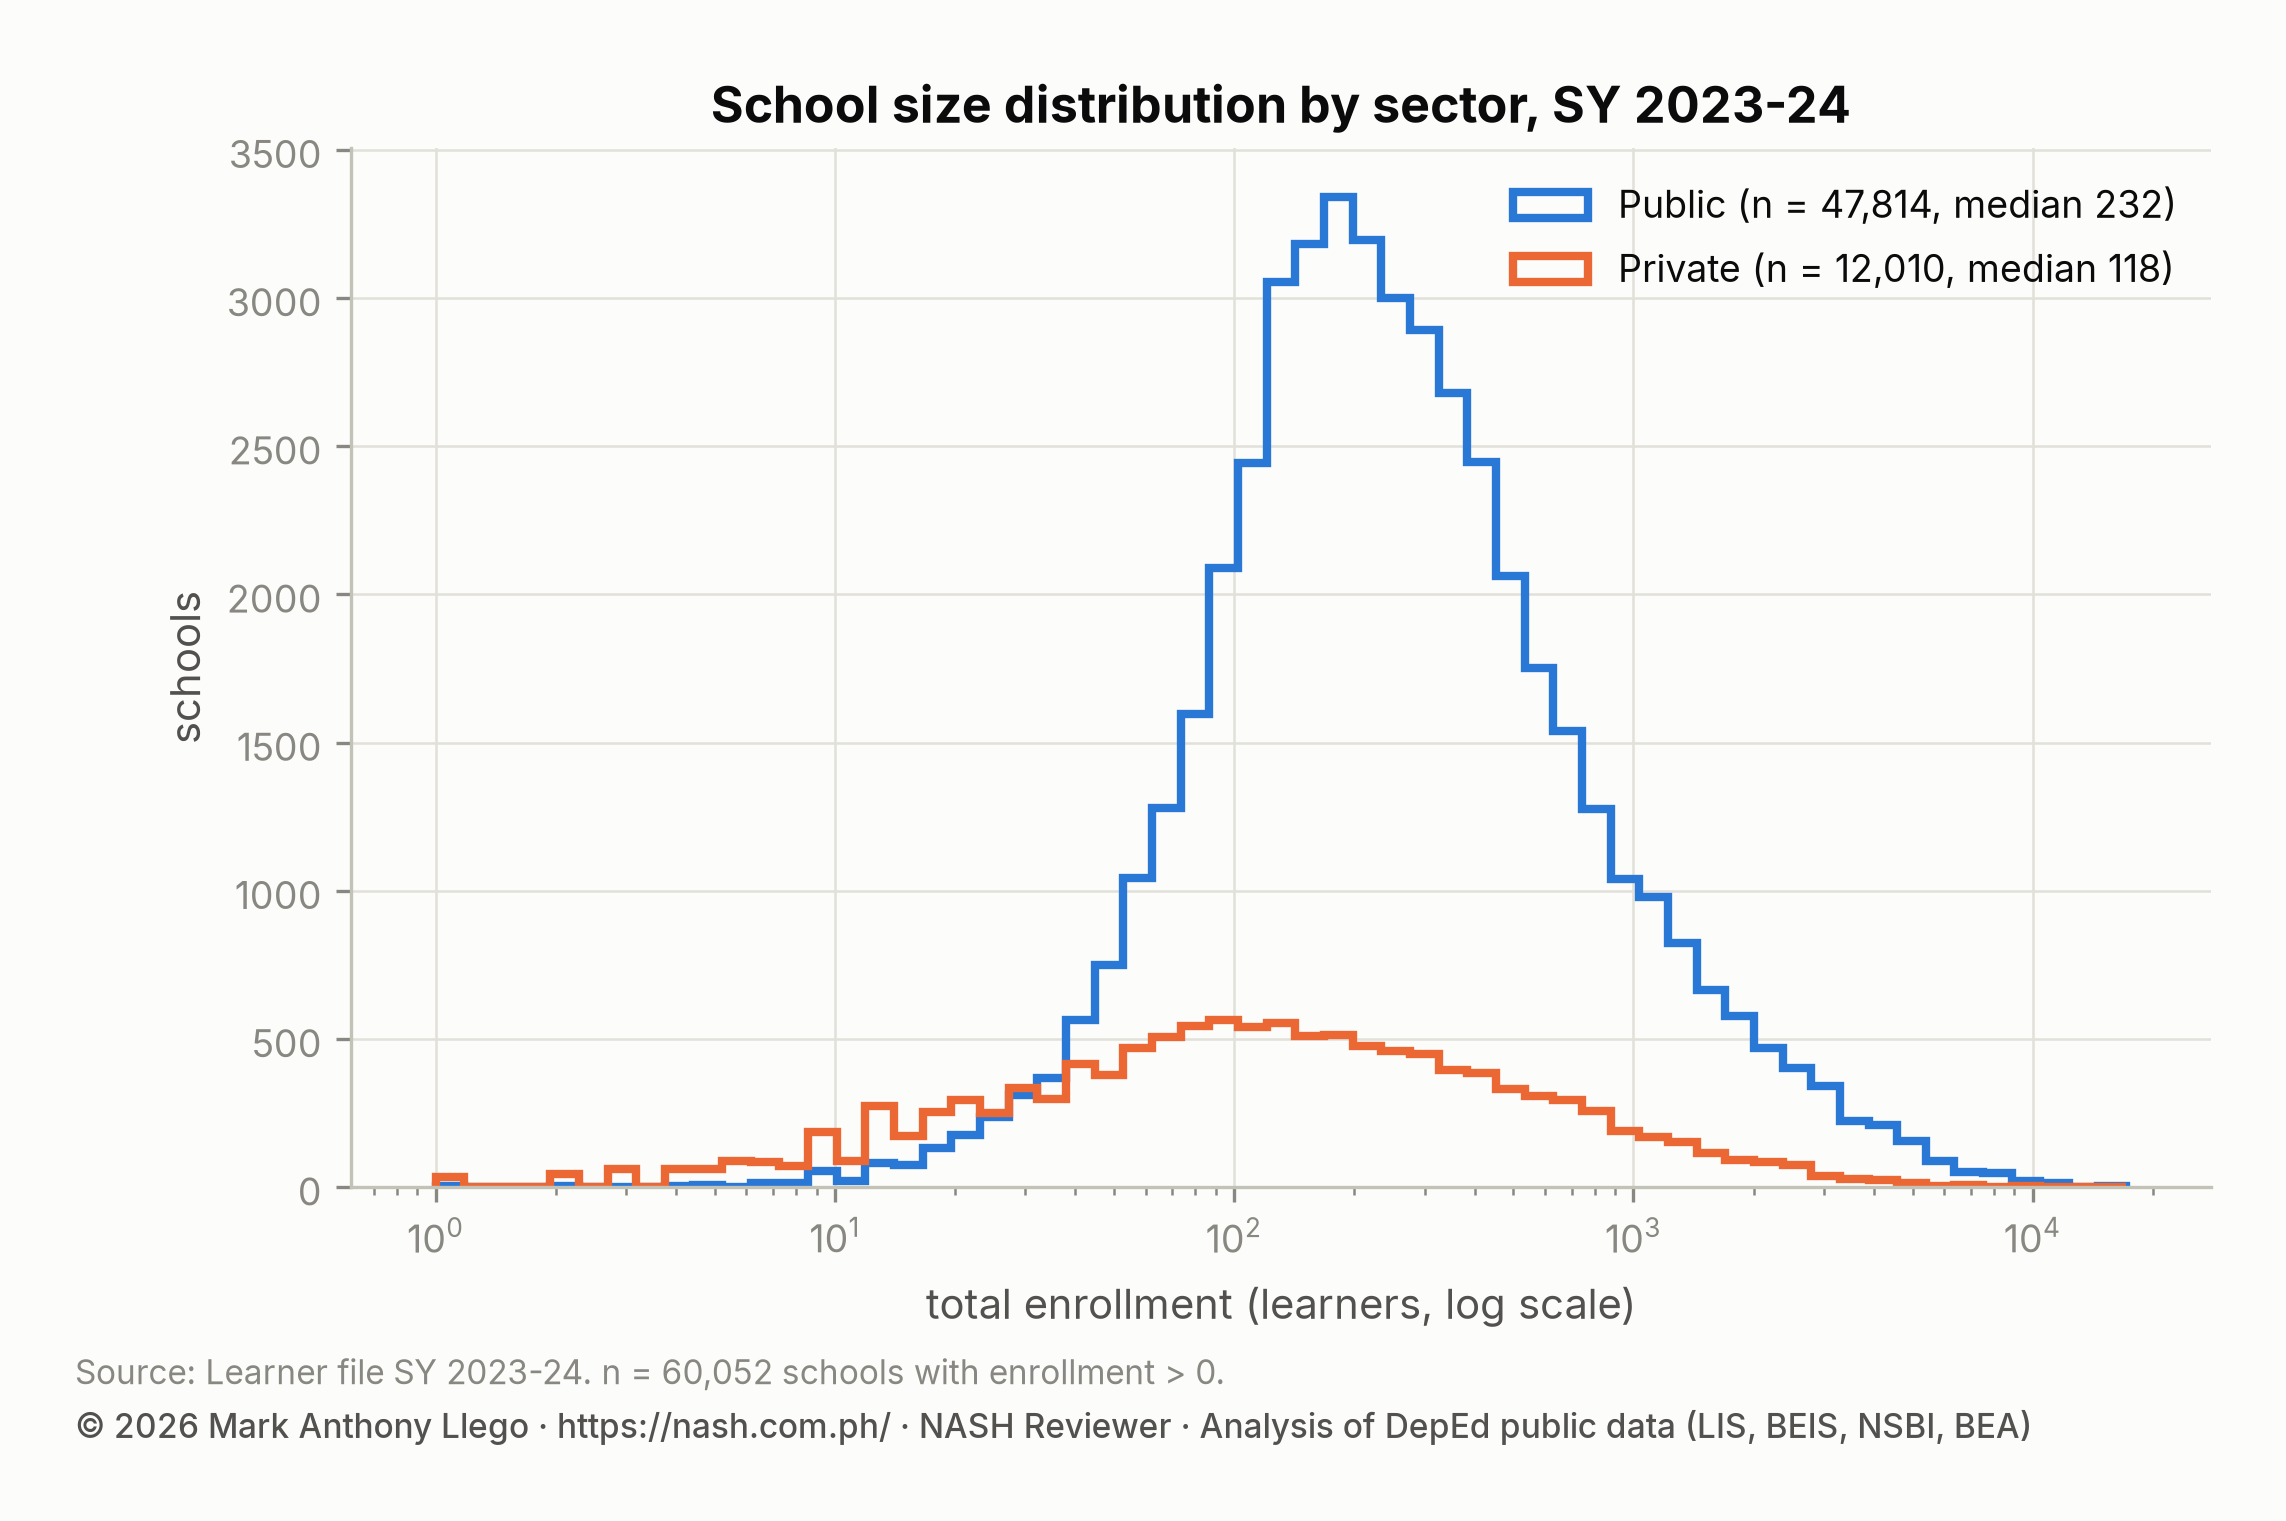
The median public school has 232 learners. The 5th percentile has 48 learners and the 95th has 1,795. Size bands show how unequal this is. Schools with 101 to 500 learners are 58% of schools but hold 29% of learners. Schools with more than 1,000 learners are 11% of schools and hold 51% of learners. The 2,034 public schools with more than 2,000 learners, 4.3% of schools, teach 31% of all public school learners.
| Learners per school | Schools | Share of schools | Learners | Share of learners |
|---|---|---|---|---|
| 1–50 | 2,628 | 5.5% | 87,517 | 0.4% |
| 51–100 | 5,902 | 12.3% | 452,684 | 1.9% |
| 101–200 | 12,528 | 26.2% | 1,848,183 | 8.0% |
| 201–500 | 15,289 | 32.0% | 4,849,705 | 20.9% |
| 501–1,000 | 6,185 | 12.9% | 4,278,461 | 18.4% |
| 1,001–2,000 | 3,248 | 6.8% | 4,494,332 | 19.4% |
| over 2,000 | 2,034 | 4.3% | 7,214,545 | 31.1% |
School size shapes every resource ratio. The national pupil-teacher ratio, computed as DepEd does (all learners divided by all teachers), is 25.5, while the median school has 22.7. The difference arises because the large urban schools that hold most learners are the crowded ones. The same gap appears for classrooms and toilets, as the personnel report, the facilities report and the WASH report for SY 2023-2024 show.
What this means for school heads
- Read the school’s learner profile before its scores. A school with a high IP share, a group of Balik-Aral learners or multigrade classes has a known support need that a test result alone will not explain.
- Multigrade schools are many but small. The data say their results fall behind similar monograde schools. The PPSSH strands on curriculum and teaching are where a school head can close that gap.
- Alternative delivery modes are under-used. Balik-Aral learners are in almost every school, but alternative delivery modes reach 0.1% of learners. There is room to use the modes DepEd already recognizes.
- Large schools carry the shortages. A school with more than 1,000 learners should expect its ratios to be above the regional median.
How these numbers were made
- Source: DepEd’s Learner Data for SY 2023-2024 (the enrollment module plus learner-type counts by grade and sex, and monograde and multigrade counts for elementary). Public schools with at least one learner: 47,814.
- Shares are sums over sums (for example, all IP learners in a region divided by all learners in the region), not averages of school shares.
- The multigrade share is multigrade learners ÷ (monograde + multigrade learners); monograde plus multigrade equals total elementary enrollment in every school that reports class structure.
- Learner-type counts never exceed the matching enrollment cell. Blank class-structure data for 10,824 schools (2,352 of them non-public) are missing, not zero.
- Regions use SY 2025-2026 boundaries so that the figures match the enrollment series.
Limits
Schools report learner types in the Learner Information System (LIS). A learner’s IP or ALIVE status is declared by the learner or recorded by the school, and the file does not say how consistently. The counts are taken at the beginning of the school year. Private schools report the same fields, but this report leaves them out because the resource comparisons in this series are for public schools, the only sector with personnel, facilities and ICT data.
Frequently asked questions
How many Indigenous Peoples learners are in DepEd public schools?
2,162,636 IP learners were in public schools in SY 2023-2024, or 9.3% of all public school learners. CAR (71.9%) and BARMM (33.1%) have the highest shares.
What share of DepEd learners are in multigrade classes?
2.0% of public elementary learners nationally are in multigrade classes, taught in the 15.2% of public schools that offer them. CAR (9.9% of learners) and Region VIII (8.5%) are the highest.
How big is a typical DepEd public school?
The median public school has 232 learners. Schools with more than 1,000 learners are 11% of schools, but they hold 51% of all public school learners.
Download the data
The cleaned, harmonized DepEd files behind this series are free to download in CSV and Parquet, with a codebook and checksums, under the terms of use set out in the release. Download Cleaned DepEd School Data, SY 2017-18 to 2025-26 documents every file and column. The files themselves are at data.nash.com.ph, starting with the README, the SY 2023-24 school master file (CSV, 8.0 MB) and the nine-year enrollment panel (Parquet, 17.2 MB).
More in this series
- DepEd Enrollment Trends SY 2017-2018 to SY 2025-2026
- Enrollment by school year: SY 2017-18, SY 2018-19, SY 2019-20, SY 2020-21, SY 2021-22, SY 2022-23, SY 2023-24, SY 2024-25, SY 2025-26
- DepEd Teachers and School Personnel Data, SY 2023-2024
- DepEd Classroom and School Building Data, SY 2023-2024
- DepEd WASH Data SY 2023-2024: Toilets, Water, Electricity
- DepEd ICT Data SY 2023-2024: Computers and Internet
- NAT Grade 6 Results SY 2023-2024: DepEd Division Scores
- ELLNA Grade 3 Results SY 2023-2024: DepEd Division Scores
- CRLA Results SY 2025-2026: Reading Levels in Grades 1 to 3
- DepEd School Inputs vs Test Results: Multigrade and Internet
- DepEd Open Data Quality: Errors, Blanks and Coverage Limits
- Download Cleaned DepEd School Data, SY 2017-18 to 2025-26
- The full report: Philippine basic education in numbers
Guides for aspiring school heads
- DepEd Data for Aspiring School Heads: Where to Start
- NASH Practice Questions With Answers: 50 Items on the PPSSH
- How to Read DepEd Data: A Guide for Aspiring School Heads
- EDCOM II Final Report: Guide for Aspiring School Heads
- National Education Plan 2026-2035: Guide for School Heads
- NASH Study Guide: DepEd Memorandum 069, s. 2025 and PPSSH
- PPSSH Domain 1: Leading Strategically With DepEd Data
- PPSSH Domain 2: Managing School Operations With DepEd Data
- PPSSH Domain 3: Teaching and Learning With DepEd Data
- PPSSH Domain 4: Developing Self and Others With DepEd Data
- PPSSH Domain 5: Building Connections With DepEd Data
Analysis and charts by Mark Anthony Llego for NASH Reviewer. Data: Department of Education public datasets. Charts may be reused only with written permission from support@nash.com.ph.