In DepEd’s Grade 6 National Achievement Test (NAT) of SY 2023-2024, the pooled mean across the 6,636 assessed schools in 44 divisions is 60.3, below the 75-point proficiency mark. Division means run from 45.8 in Candon City to 74.4 in Calbayog City.
The NAT for Grade 6 is DepEd’s exit assessment for elementary school. It is a multiple-choice test of 21st-century skills that uses English, Science, Mathematics, Filipino and Araling Panlipunan as content. Each school’s result is a mean percentage score (MPS), and 75 is the proficiency mark. DepEd gave the SY 2023-2024 test in April 2024 to a census of schools but to only a sample of learners in each school. It has released school-level results for a “selected set of schools”: 6,636 schools in five regions and 44 divisions.
The sampling design limits what the file can show, so school means need caution. A school mean that rests on six learners is noisy. Every division estimate therefore carries a confidence interval from resampling, and every division ranking carries a rank interval. School means are shrunk toward their division mean before any school-level statement is made. The companion report, Philippine basic education in numbers, holds the method notes. The audit of DepEd’s open data files explains what the “selected set” covers.
Key findings
- The test-taker-weighted Grade 6 NAT mean across the assessed schools is 60.3, below the 75-point proficiency mark. Public schools alone average 61.0. DepEd tested 52,761 learners, a median of 6 per school.
- Region VIII leads at 66.5 and Region IX trails at 53.9. CAR (56.1), Region III (59.1) and Region I (59.3) sit between them. The confidence intervals are about one point wide, so these ranks are not in doubt.
- Division means run from 45.8 in Candon City to 74.4 in Calbayog City. After adjusting for 44 comparisons, 18 divisions sit significantly below the pooled mean and 13 above.
- Science (53.8) and Mathematics (56.4) are the weakest subjects in every region, and Filipino (66.0) is the strongest. Only 10% of assessed schools have a Science mean of 75 or more.
- 27% of test-takers attend a school whose mean is Low Proficient (25–49), 54% Nearly Proficient, 18% Proficient and 0.2% Highly Proficient.
- Shrinking school means toward the division mean moves 18 schools out of the bottom 100. A ranking of raw school means from this file would therefore be wrong about one school in five.
What the DepEd NAT Grade 6 file contains
The NAT file has one row per assessed school. Each row gives the region, the division, the number of test-takers, and the mean percentage scores in Filipino, Mathematics, English, Science, Araling Panlipunan and overall. There are no learner-level scores and no counts by proficiency level.
Of the assessed schools, 5,822 are public and 814 are private, and every school matches DepEd’s SY 2023-2024 school list. The 44 divisions are in CAR, Region I, Region III, Region VIII and Region IX. Inside those divisions the file covers 46% of public schools with Grade 6 learners, and DepEd has not documented the selection rule.
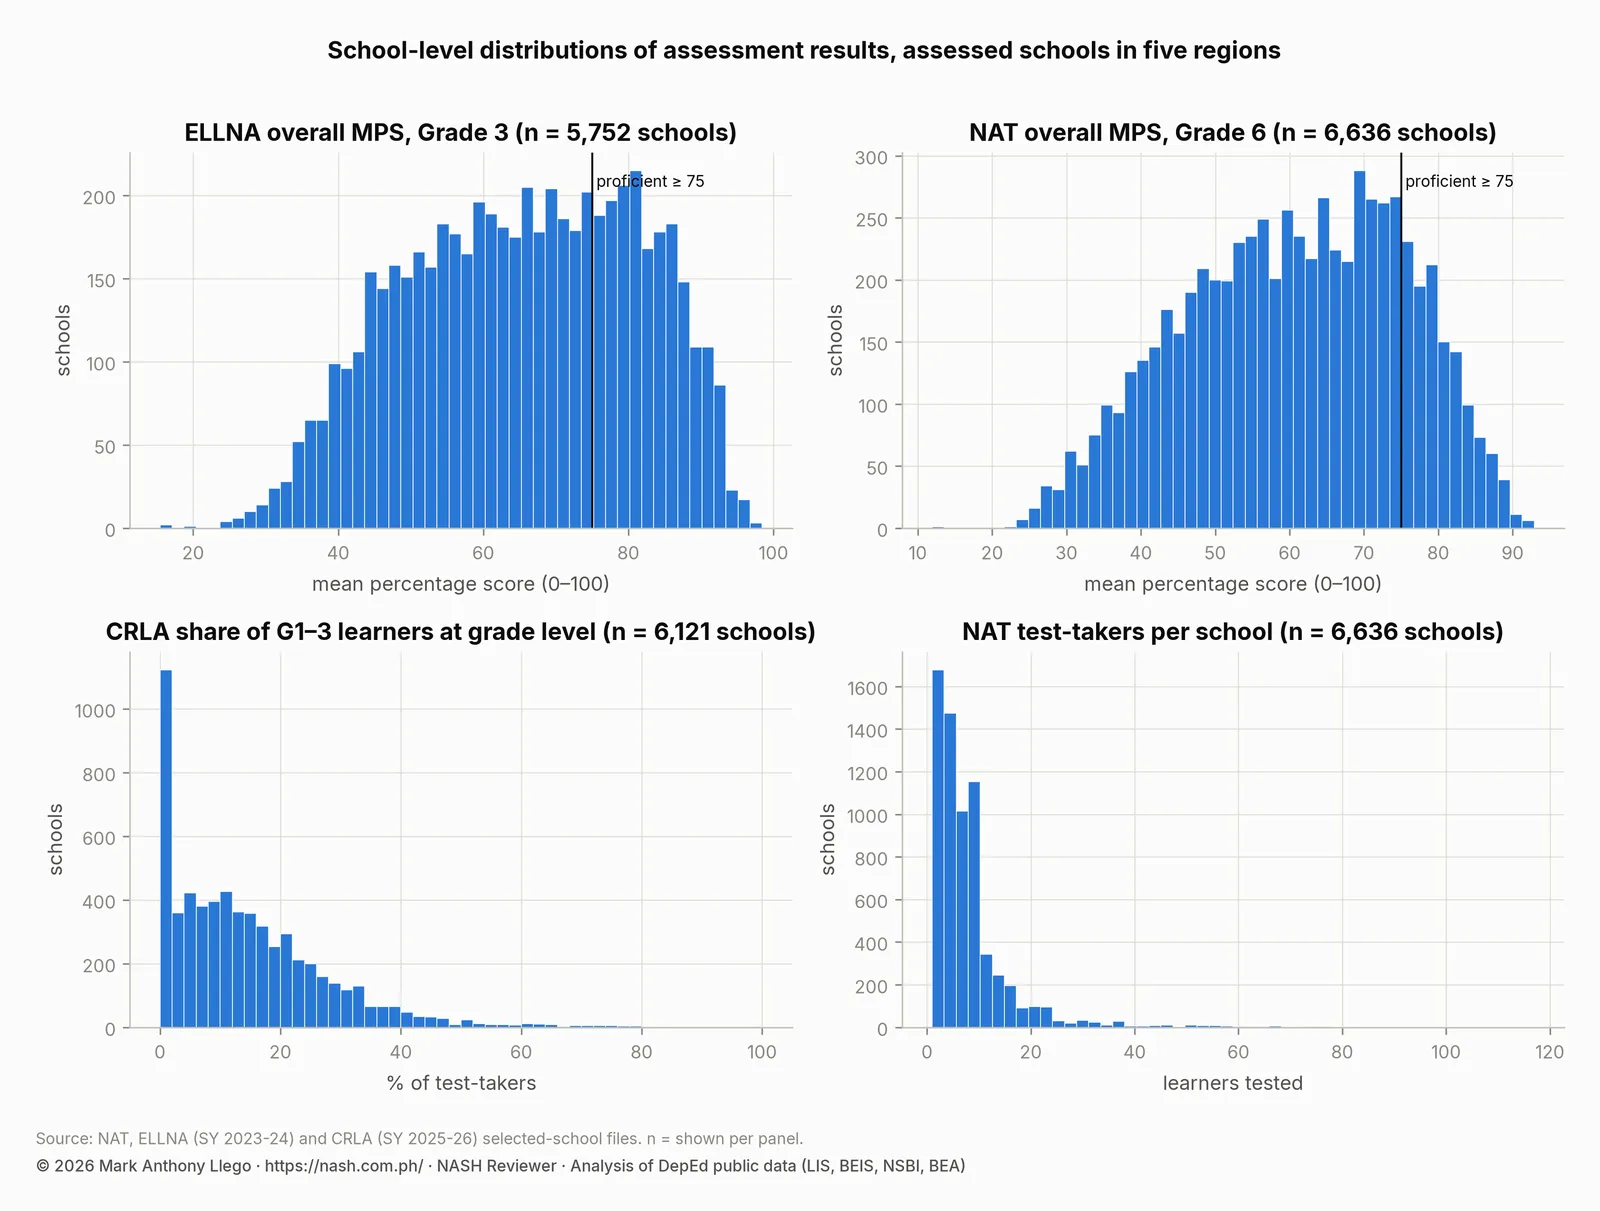
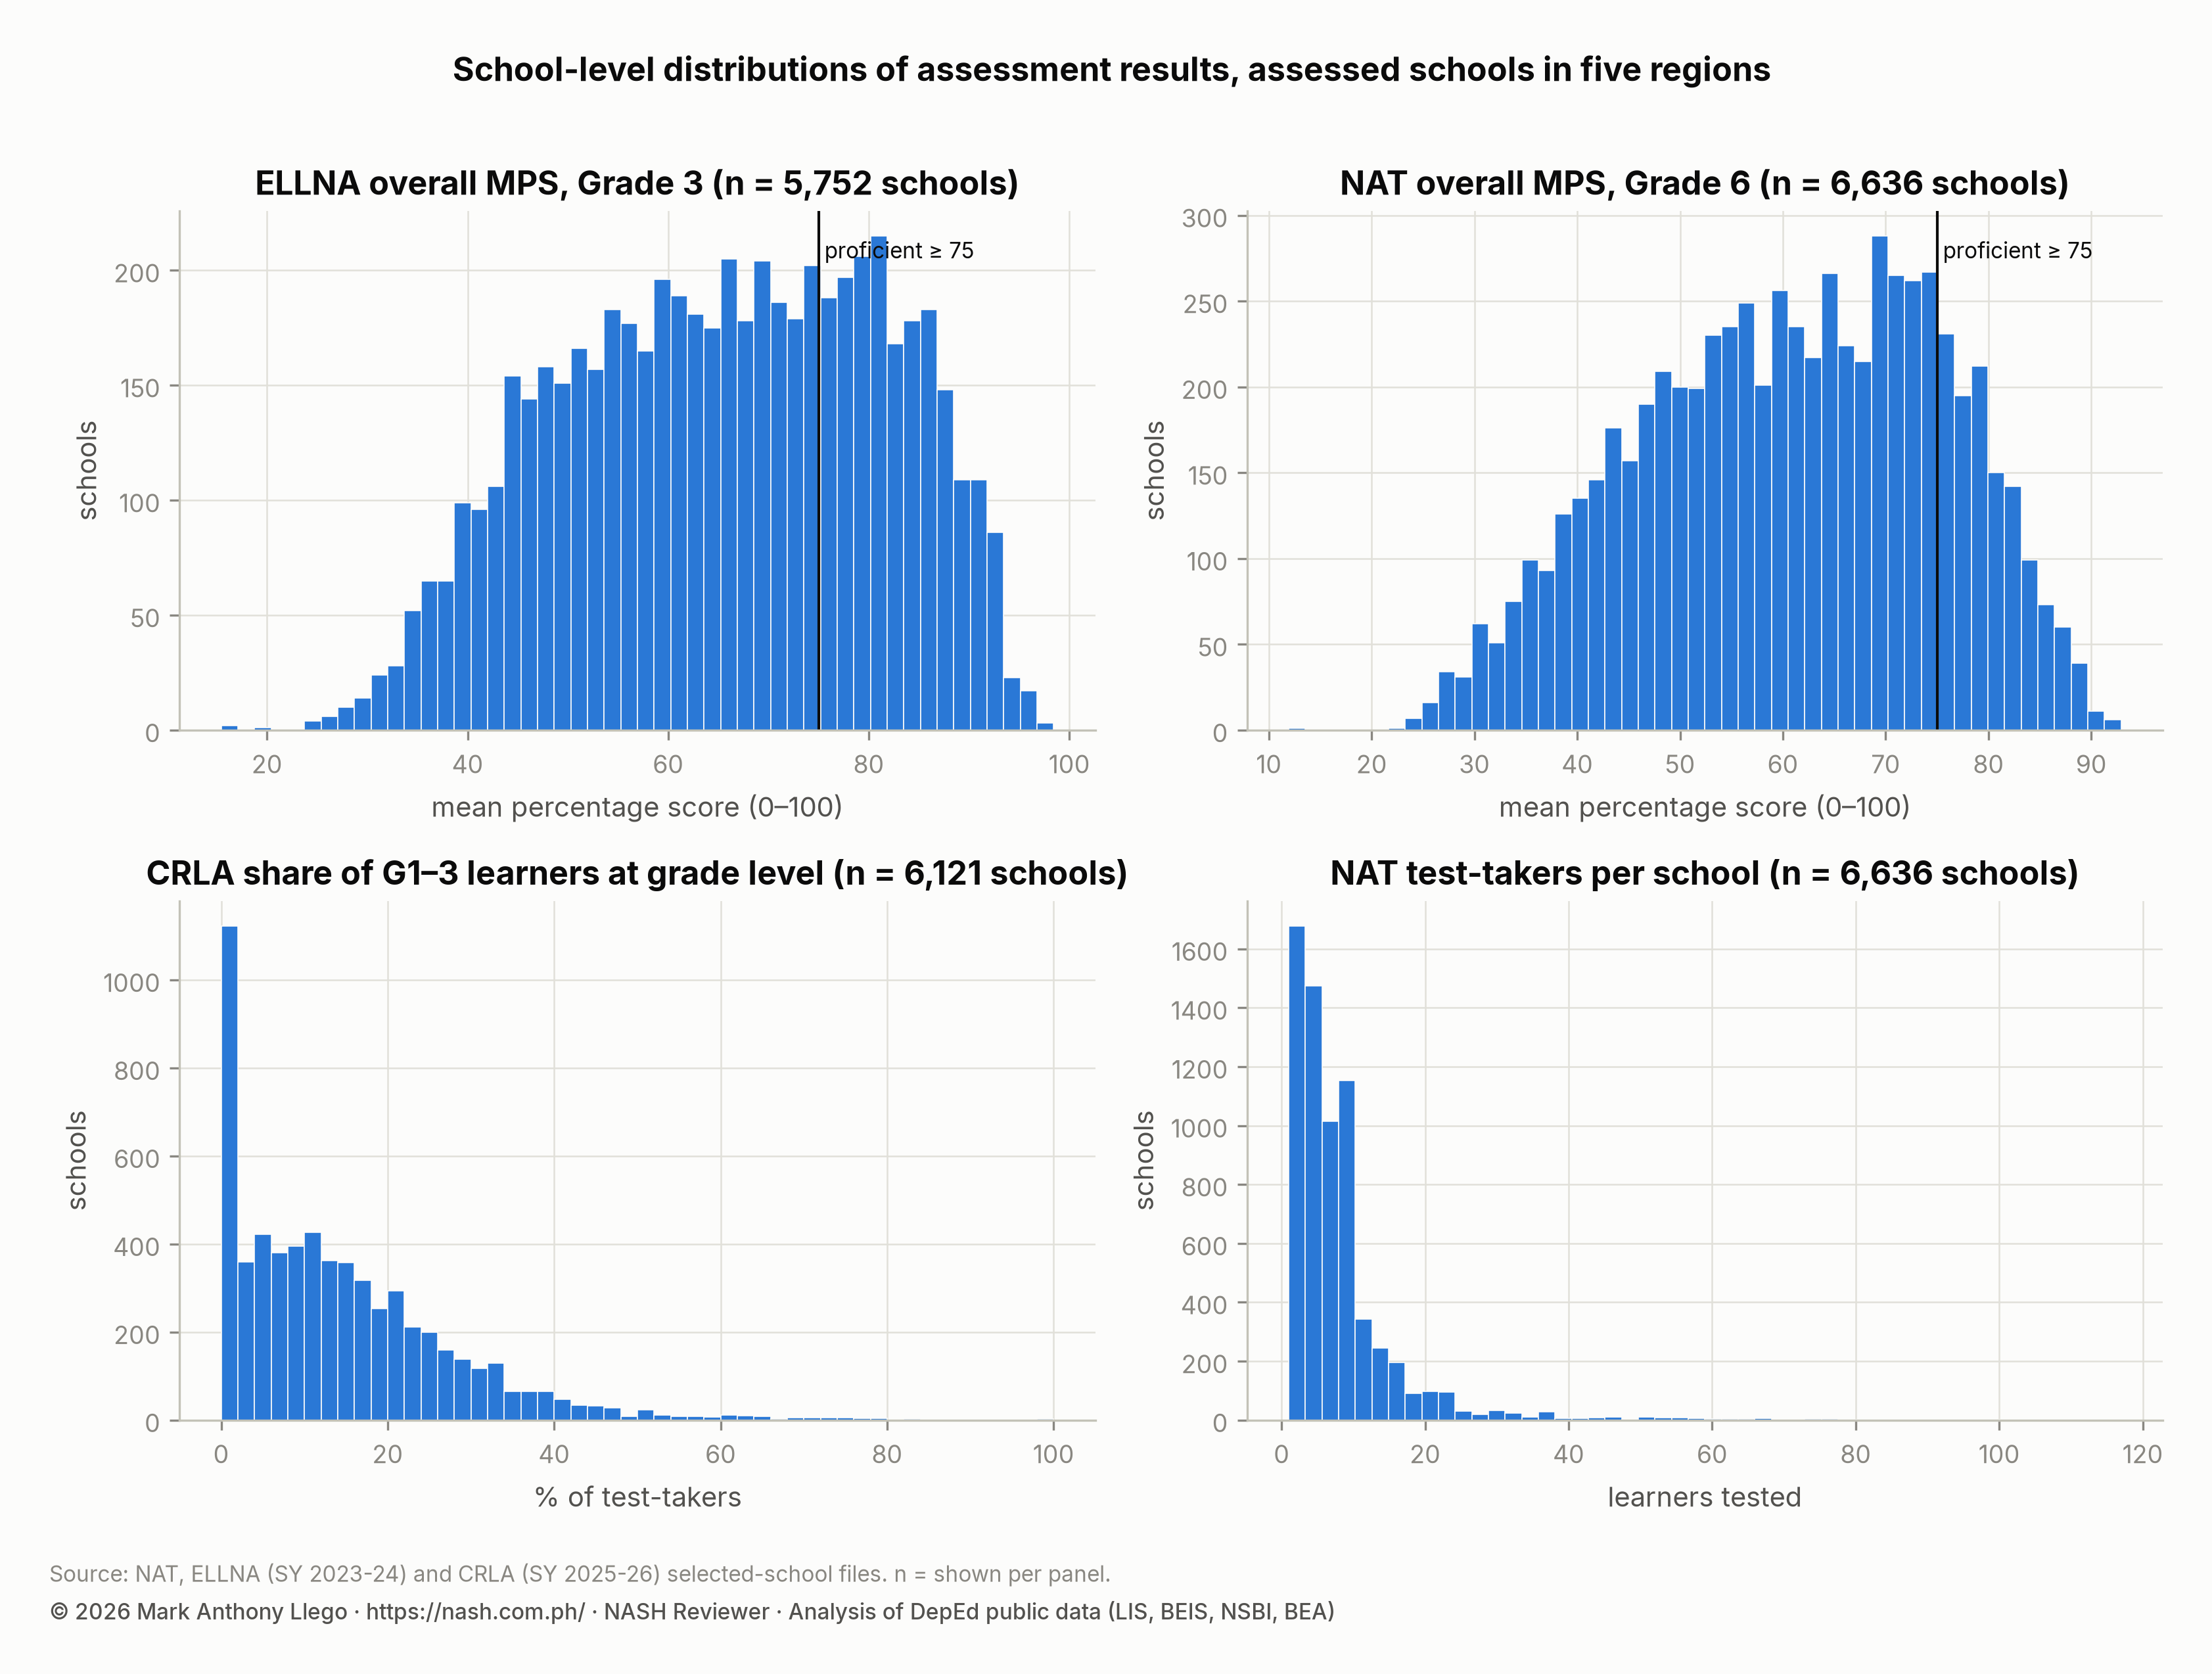
The test-takers panel matters most. The median school tested 6 learners. A quarter of schools tested 3 or fewer, and 5% tested 22 or more. A school mean built on six learners can move several points by chance alone. For that reason, every statement below is made at the division level or after shrinkage.
NAT Grade 6 results by region
Each school is weighted by its test-takers, so the regional figure approximates the mean over tested learners. On that basis, Region VIII scores 66.5 and Region IX scores 53.9. Region I (59.3), Region III (59.1) and CAR (56.1) sit between them. The table gives the 95% intervals, which come from resampling schools within each region 2,000 times. They are about a point wide, and the rank intervals place Region VIII first and Region IX last in every resample.
| Region | Schools | Test-takers | Mean percentage score (95% CI) | Median school | Rank (95% interval) |
|---|---|---|---|---|---|
| CAR | 778 | 3,287 | 56.1 (55.0–57.2) | 57.5 | 4 (4–4) |
| Region I | 1,250 | 10,293 | 59.3 (58.2–60.3) | 60.4 | 2 (2–3) |
| Region III | 1,786 | 21,023 | 59.1 (58.2–60.0) | 59.3 | 3 (2–3) |
| Region IX | 795 | 4,916 | 53.9 (52.6–55.2) | 53.8 | 5 (5–5) |
| Region VIII | 2,027 | 13,242 | 66.5 (65.6–67.4) | 69.8 | 1 (1–1) |
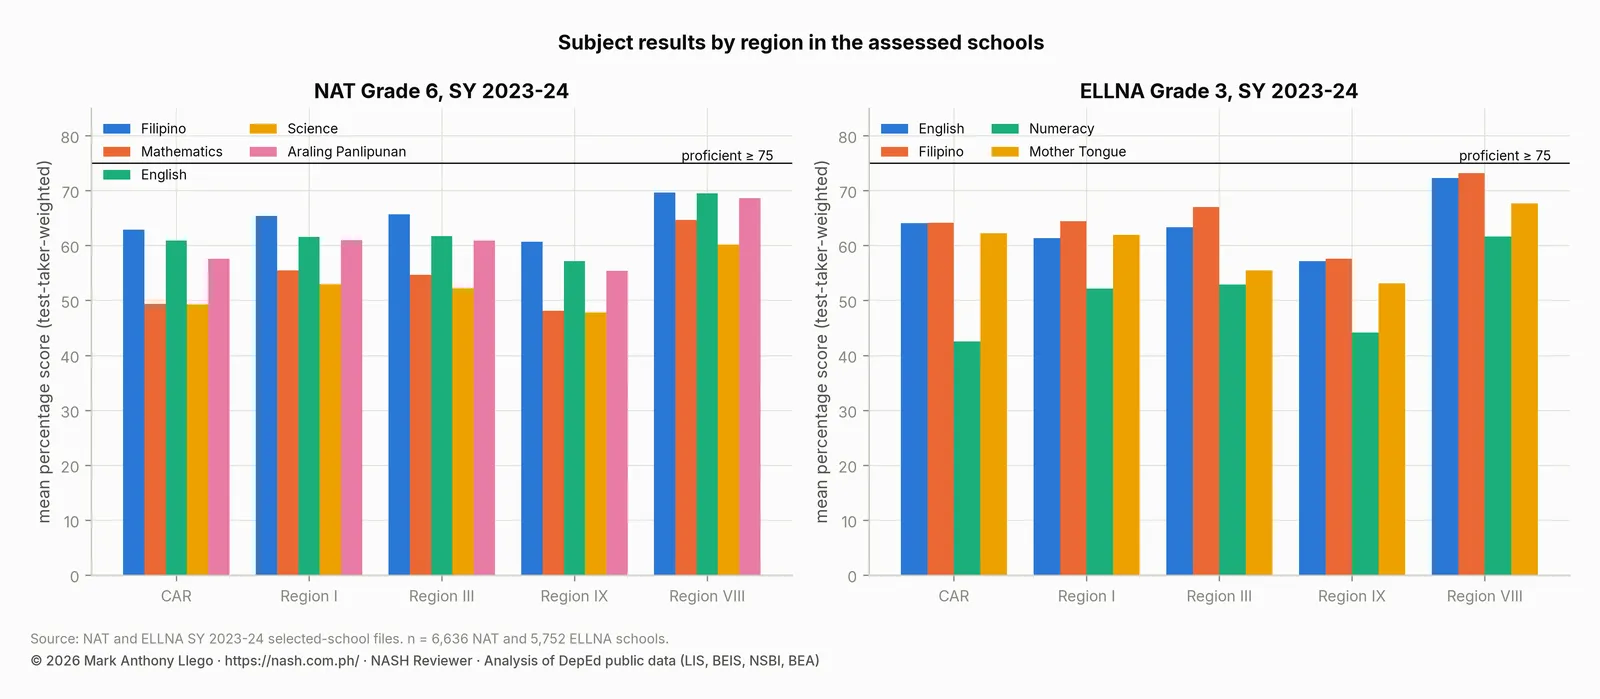
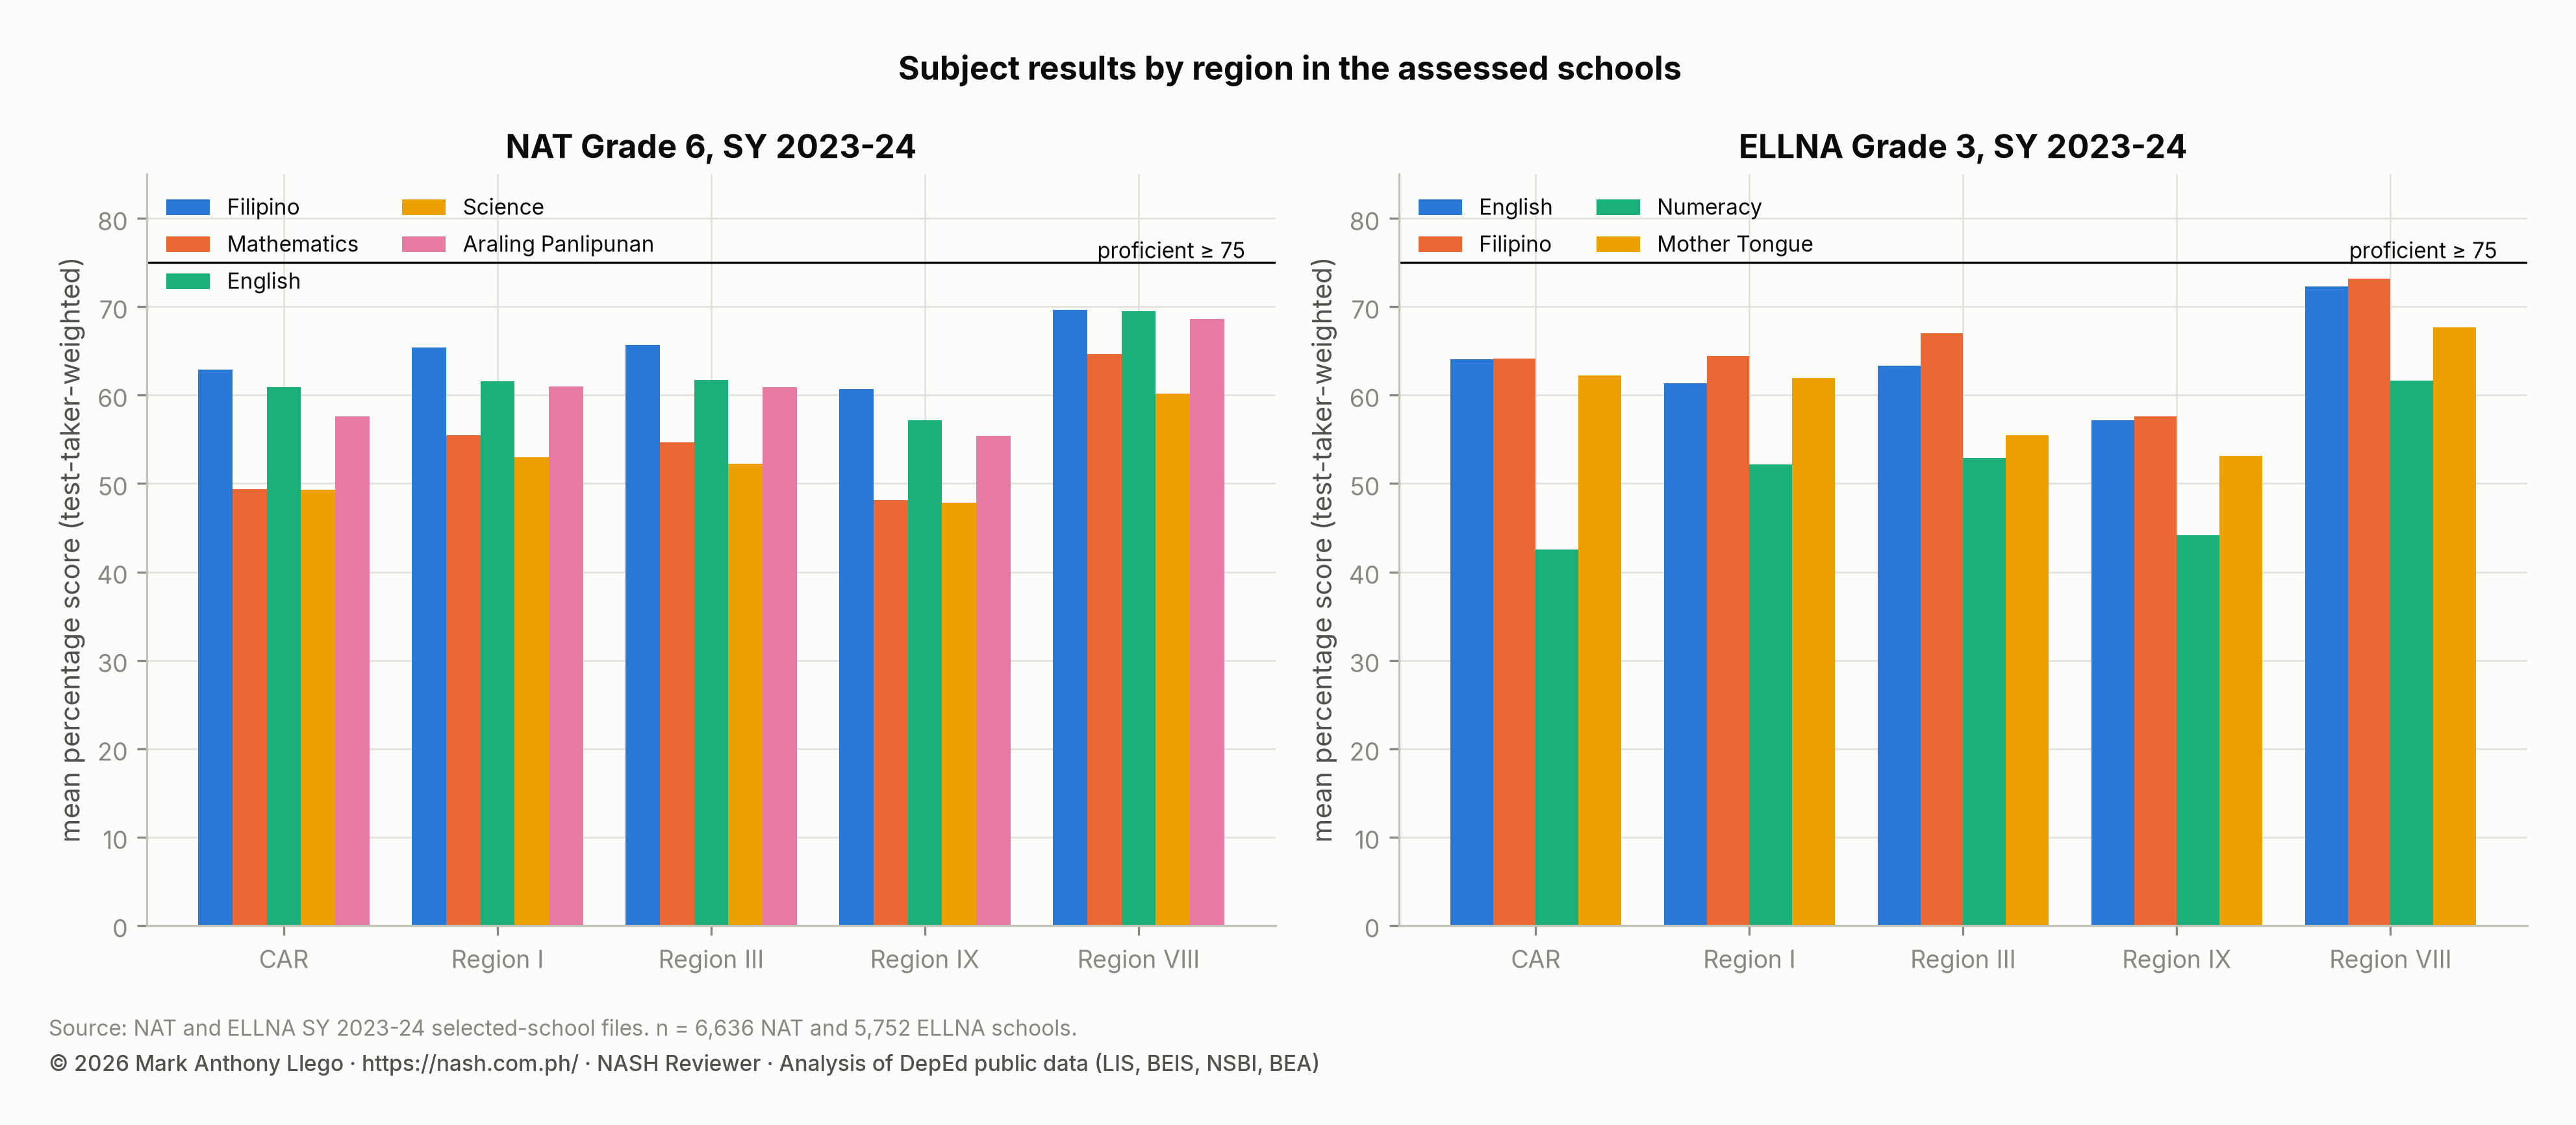
Region VIII leads every subject and Region IX trails every subject. The subject order is the same in every region: Filipino highest, then English and Araling Panlipunan, then Mathematics, with Science lowest. Region IX’s Science mean is 47.9 and its Mathematics mean is 48.1. CAR’s are 49.3 and 49.4. No regional subject mean reaches 75.
| Region | Filipino | Mathematics | English | Science | Araling Panlipunan | Overall |
|---|---|---|---|---|---|---|
| CAR | 62.9 | 49.4 | 60.9 | 49.3 | 57.6 | 56.1 |
| Region I | 65.4 | 55.4 | 61.6 | 53 | 61 | 59.3 |
| Region III | 65.7 | 54.7 | 61.7 | 52.3 | 60.9 | 59.1 |
| Region IX | 60.7 | 48.1 | 57.1 | 47.9 | 55.4 | 53.9 |
| Region VIII | 69.6 | 64.7 | 69.5 | 60.2 | 68.6 | 66.5 |
| All assessed | 66 | 56.4 | 63.2 | 53.8 | 62.1 | 60.3 |
NAT Grade 6 results by division
The spread across the 44 divisions is far wider than the spread across regions. Calbayog City leads at 74.4, followed by Biliran (73.6) and Ilocos Norte (73.5). Candon City is lowest at 45.8, and City of San Jose Del Monte (48.8) is next. The table below lists all 44 divisions with their intervals and ranks. Between-division differences account for 27% of the weighted variance in school means, and between-region differences for 7.5%. Most variation is between schools inside a division.
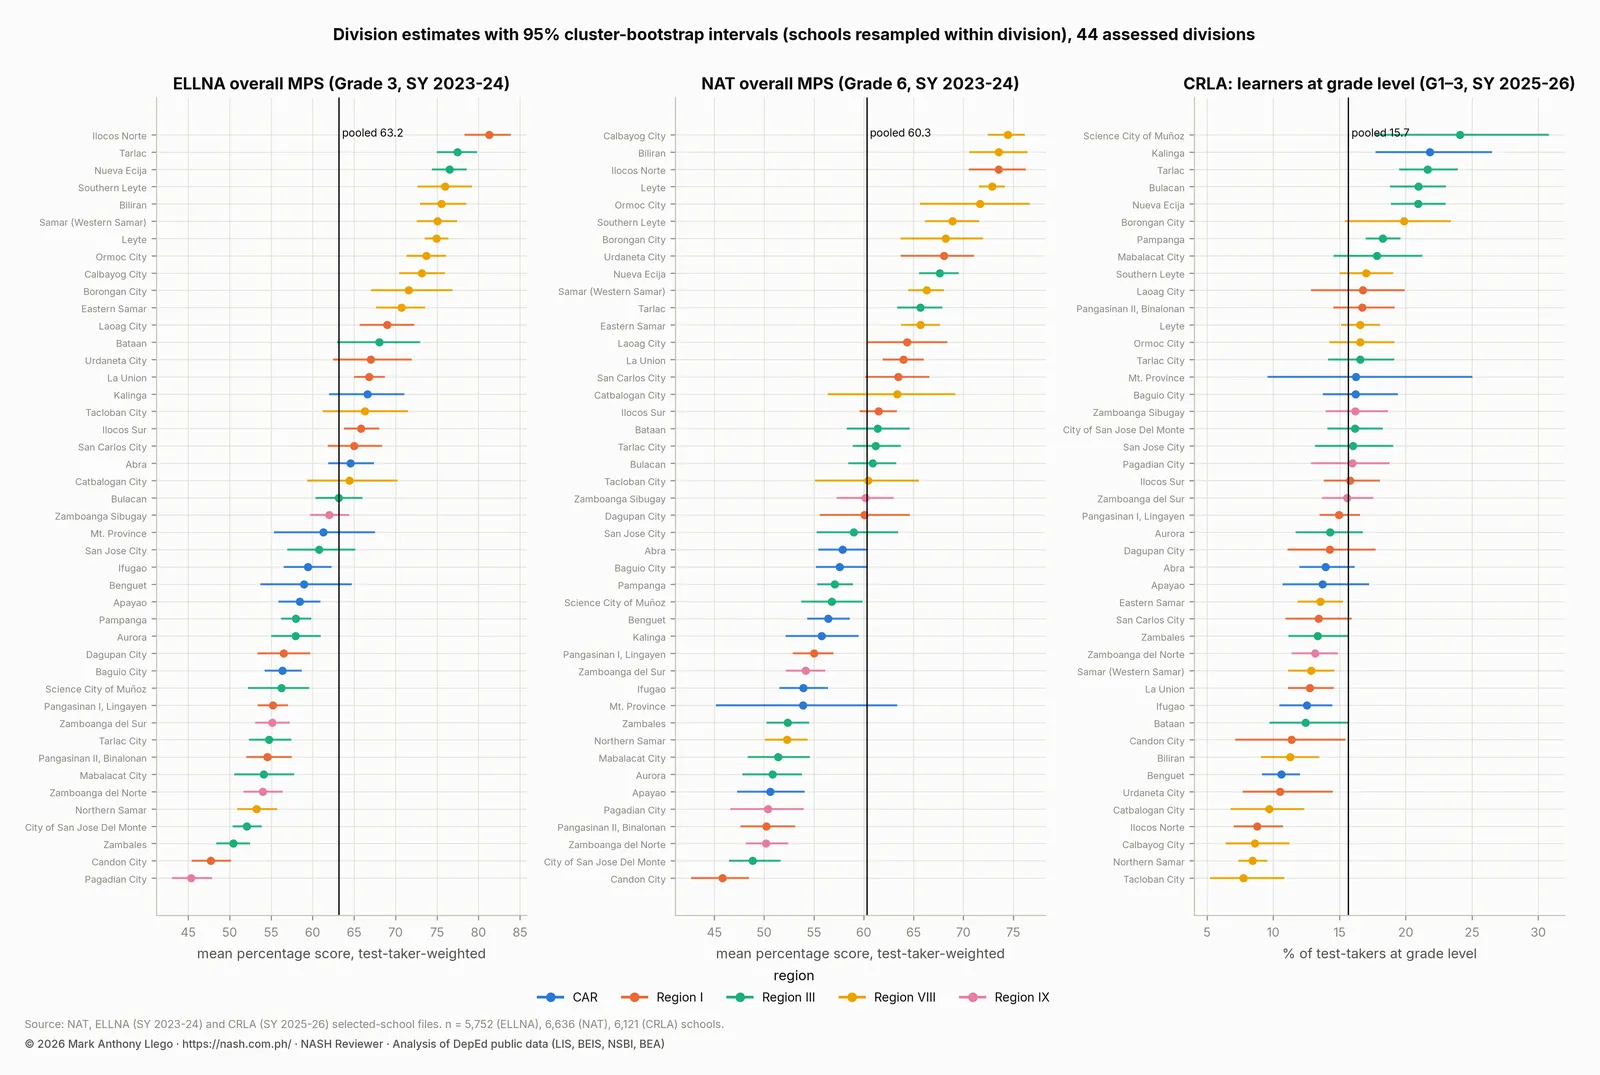
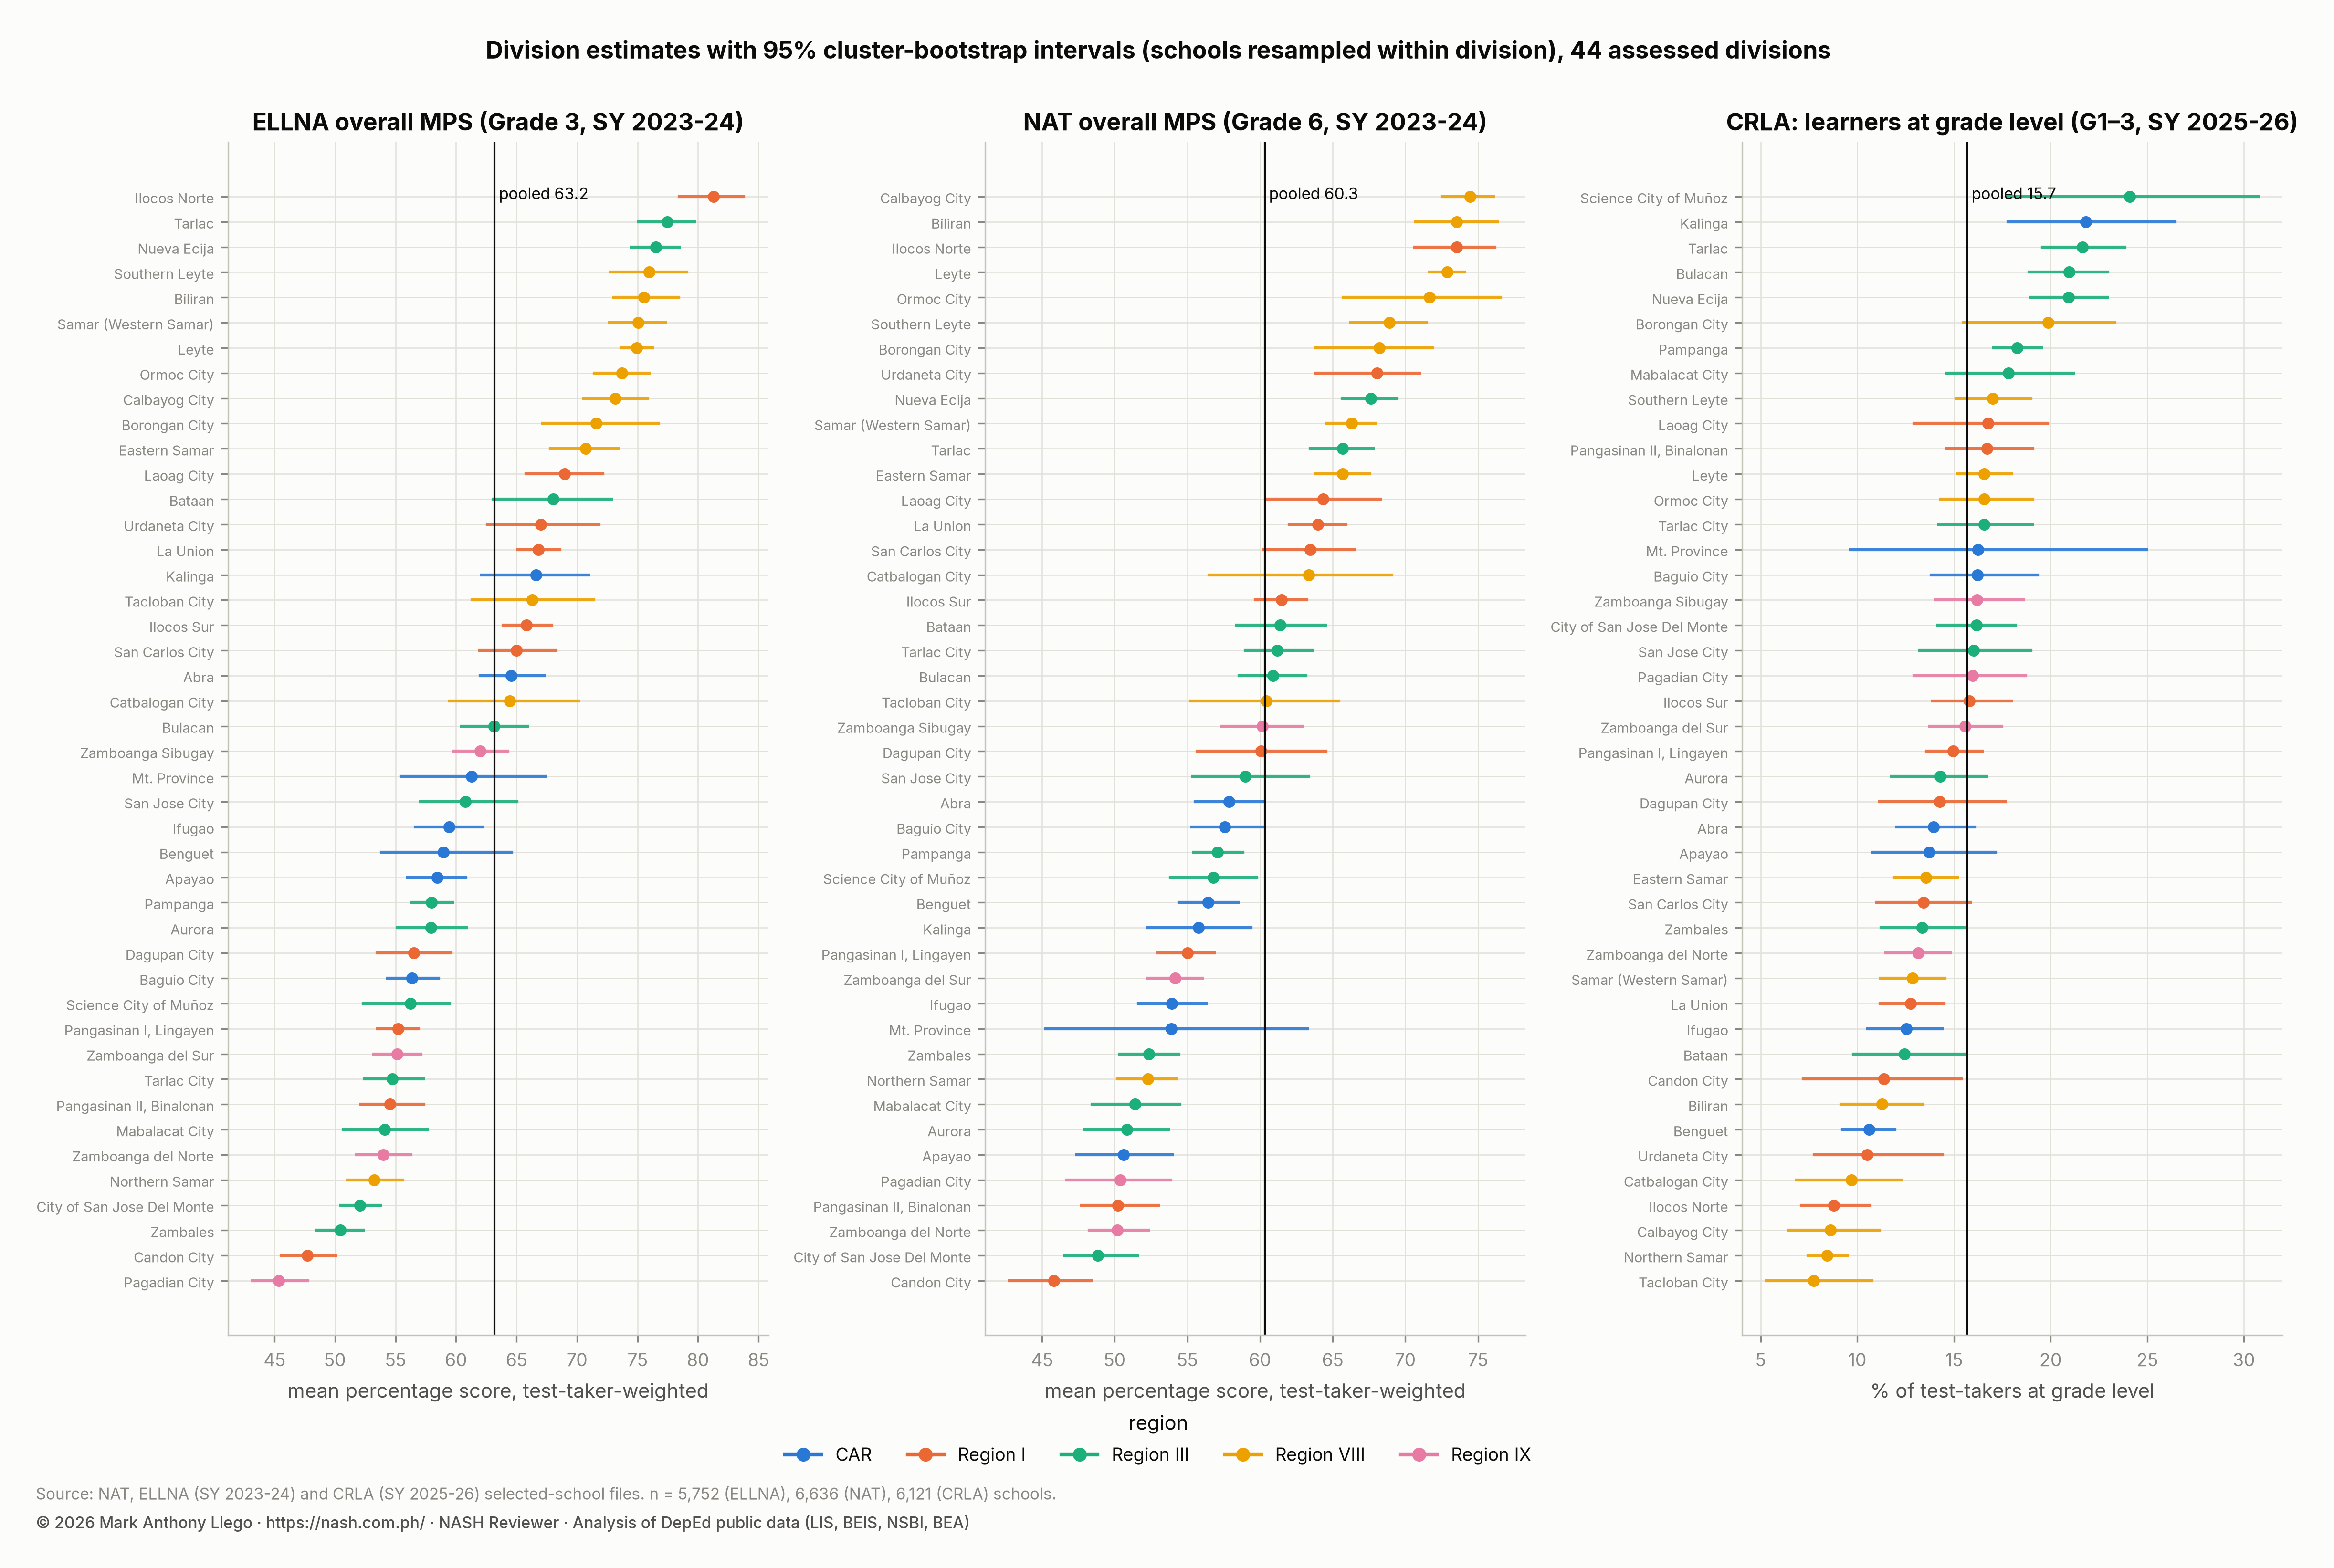
Each division’s mean is compared with the pooled mean of all assessed schools (60.3). The p-values are adjusted for the 44 comparisons with the Benjamini–Hochberg procedure. On that test, 18 divisions are significantly below the pooled mean and 13 are above it. The rank intervals show which ranks are certain. Calbayog City’s rank interval is 1 to 4 and Candon City’s is 43 to 44. A mid-table division such as Bulacan or Tarlac City could sit anywhere across ten places.
| Division (region) | Schools | Test-takers | Mean percentage score (95% CI) | Rank (95% interval) | Difference from pooled mean | Significant (BH 5%) |
|---|---|---|---|---|---|---|
| Calbayog City (Region VIII) | 154 | 1,072 | 74.4 (72.6–76.1) | 1 (1–4) | 14.1 | yes |
| Biliran (Region VIII) | 92 | 725 | 73.6 (70.7–76.3) | 2 (1–5) | 13.2 | yes |
| Ilocos Norte (Region I) | 113 | 710 | 73.5 (70.6–76.2) | 3 (1–5) | 13.2 | yes |
| Leyte (Region VIII) | 537 | 3,361 | 72.9 (71.7–74.1) | 4 (2–5) | 12.6 | yes |
| Ormoc City (Region VIII) | 93 | 921 | 71.7 (65.7–76.6) | 5 (1–11) | 11.4 | yes |
| Southern Leyte (Region VIII) | 131 | 880 | 68.9 (66.2–71.5) | 6 (5–11) | 8.6 | yes |
| Borongan City (Region VIII) | 51 | 395 | 68.2 (63.8–71.9) | 7 (5–14) | 7.9 | yes |
| Urdaneta City (Region I) | 58 | 589 | 68.1 (63.8–71.0) | 8 (5–15) | 7.7 | yes |
| Nueva Ecija (Region III) | 285 | 2,540 | 67.6 (65.7–69.4) | 9 (6–12) | 7.3 | yes |
| Samar (Western Samar) (Region VIII) | 322 | 1,207 | 66.3 (64.6–68.0) | 10 (7–14) | 6 | yes |
| Tarlac (Region III) | 249 | 2,449 | 65.7 (63.4–67.8) | 11 (8–15) | 5.4 | yes |
| Eastern Samar (Region VIII) | 181 | 1,304 | 65.7 (63.8–67.6) | 12 (8–15) | 5.4 | yes |
| Laoag City (Region I) | 49 | 403 | 64.3 (60.5–68.3) | 13 (7–21) | 4 | no |
| La Union (Region I) | 173 | 1,235 | 64.0 (62.0–65.9) | 14 (11–18) | 3.7 | yes |
| San Carlos City (Region I) | 74 | 871 | 63.4 (60.2–66.5) | 15 (10–22) | 3.1 | no |
| Catbalogan City (Region VIII) | 52 | 279 | 63.4 (56.5–69.1) | 16 (6–28) | 3 | no |
| Ilocos Sur (Region I) | 189 | 1,187 | 61.5 (59.7–63.2) | 17 (15–23) | 1.1 | no |
| Bataan (Region III) | 84 | 1,063 | 61.4 (58.4–64.5) | 18 (14–24) | 1.1 | no |
| Tarlac City (Region III) | 119 | 1,462 | 61.2 (59.0–63.6) | 19 (15–24) | 0.9 | no |
| Bulacan (Region III) | 293 | 4,400 | 60.9 (58.5–63.2) | 20 (15–25) | 0.6 | no |
| Tacloban City (Region VIII) | 64 | 502 | 60.4 (55.2–65.4) | 21 (12–31) | 0.1 | no |
| Zamboanga Sibugay (Region IX) | 137 | 1,030 | 60.2 (57.4–62.9) | 22 (16–27) | -0.2 | no |
| Dagupan City (Region I) | 57 | 716 | 60.1 (55.7–64.5) | 23 (14–30) | -0.2 | no |
| San Jose City (Region III) | 61 | 644 | 59.0 (55.4–63.4) | 24 (15–30) | -1.3 | no |
| Abra (CAR) | 160 | 597 | 57.9 (55.5–60.2) | 25 (21–30) | -2.5 | no |
| Baguio City (CAR) | 96 | 732 | 57.6 (55.3–60.2) | 26 (21–31) | -2.8 | yes |
| Pampanga (Region III) | 259 | 3,019 | 57.1 (55.4–58.8) | 27 (23–31) | -3.2 | yes |
| Science City of Muñoz (Region III) | 42 | 329 | 56.8 (53.8–59.8) | 28 (22–33) | -3.5 | yes |
| Benguet (CAR) | 234 | 980 | 56.4 (54.4–58.5) | 29 (24–32) | -3.9 | yes |
| Kalinga (CAR) | 56 | 190 | 55.8 (52.2–59.4) | 30 (23–36) | -4.6 | yes |
| Pangasinan I, Lingayen (Region I) | 303 | 2,643 | 55.0 (53.0–56.8) | 31 (27–35) | -5.3 | yes |
| Zamboanga del Sur (Region IX) | 292 | 1,952 | 54.1 (52.3–56.0) | 32 (29–36) | -6.2 | yes |
| Ifugao (CAR) | 154 | 534 | 53.9 (51.6–56.3) | 33 (29–37) | -6.4 | yes |
| Mt. Province (CAR) | 14 | 34 | 53.9 (45.3–63.2) | 34 (16–44) | -6.4 | no |
| Zambales (Region III) | 136 | 1,284 | 52.3 (50.4–54.4) | 35 (32–40) | -8 | yes |
| Northern Samar (Region VIII) | 350 | 2,596 | 52.3 (50.2–54.2) | 36 (32–40) | -8 | yes |
| Mabalacat City (Region III) | 65 | 967 | 51.4 (48.4–54.5) | 37 (32–43) | -8.9 | yes |
| Aurora (Region III) | 83 | 386 | 50.8 (47.9–53.7) | 38 (33–43) | -9.5 | yes |
| Apayao (CAR) | 64 | 220 | 50.6 (47.4–54.0) | 39 (33–43) | -9.7 | yes |
| Pagadian City (Region IX) | 77 | 862 | 50.4 (46.7–53.9) | 40 (33–43) | -9.9 | yes |
| Pangasinan II, Binalonan (Region I) | 205 | 1,743 | 50.2 (47.7–53.0) | 41 (34–43) | -10.1 | yes |
| Zamboanga del Norte (Region IX) | 289 | 1,072 | 50.2 (48.2–52.3) | 42 (36–43) | -10.1 | yes |
| City of San Jose Del Monte (Region III) | 110 | 2,480 | 48.8 (46.6–51.6) | 43 (37–44) | -11.5 | yes |
| Candon City (Region I) | 29 | 196 | 45.8 (42.8–48.4) | 44 (43–44) | -14.5 | yes |
NAT proficiency levels applied to school means
DepEd’s technical notes define five proficiency bands on the mean percentage score: Not Proficient (0–24), Low Proficient (25–49), Nearly Proficient (50–74), Proficient (75–89) and Highly Proficient (90–100). The file gives school means only, so the bands can be applied to a school’s mean, not to learners. Applied that way, 27% of test-takers attend a school whose mean is Low Proficient, 54% Nearly Proficient, 18% Proficient and 0.2% Highly Proficient. Region VIII has 34% of its test-takers in Proficient schools. CAR has 4%.
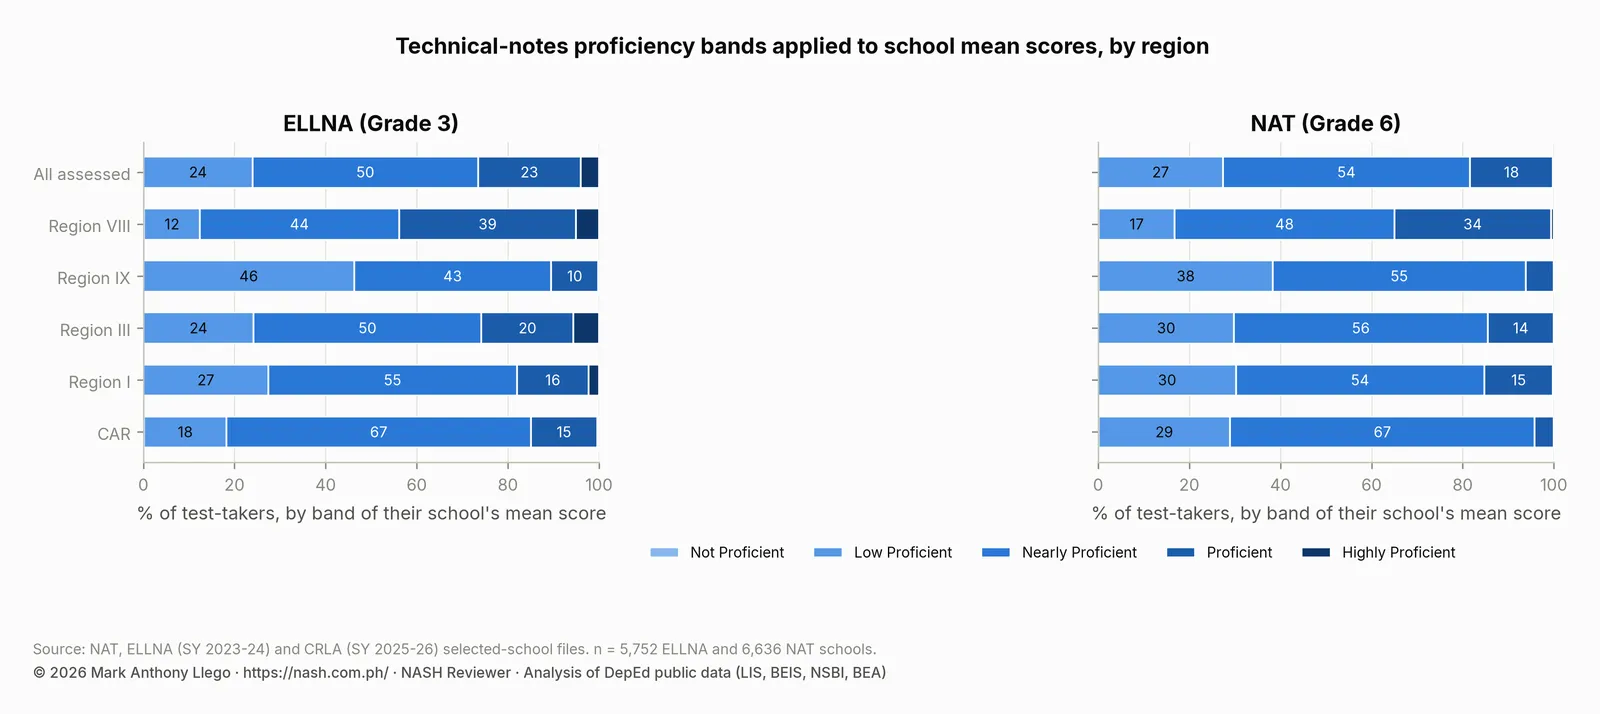
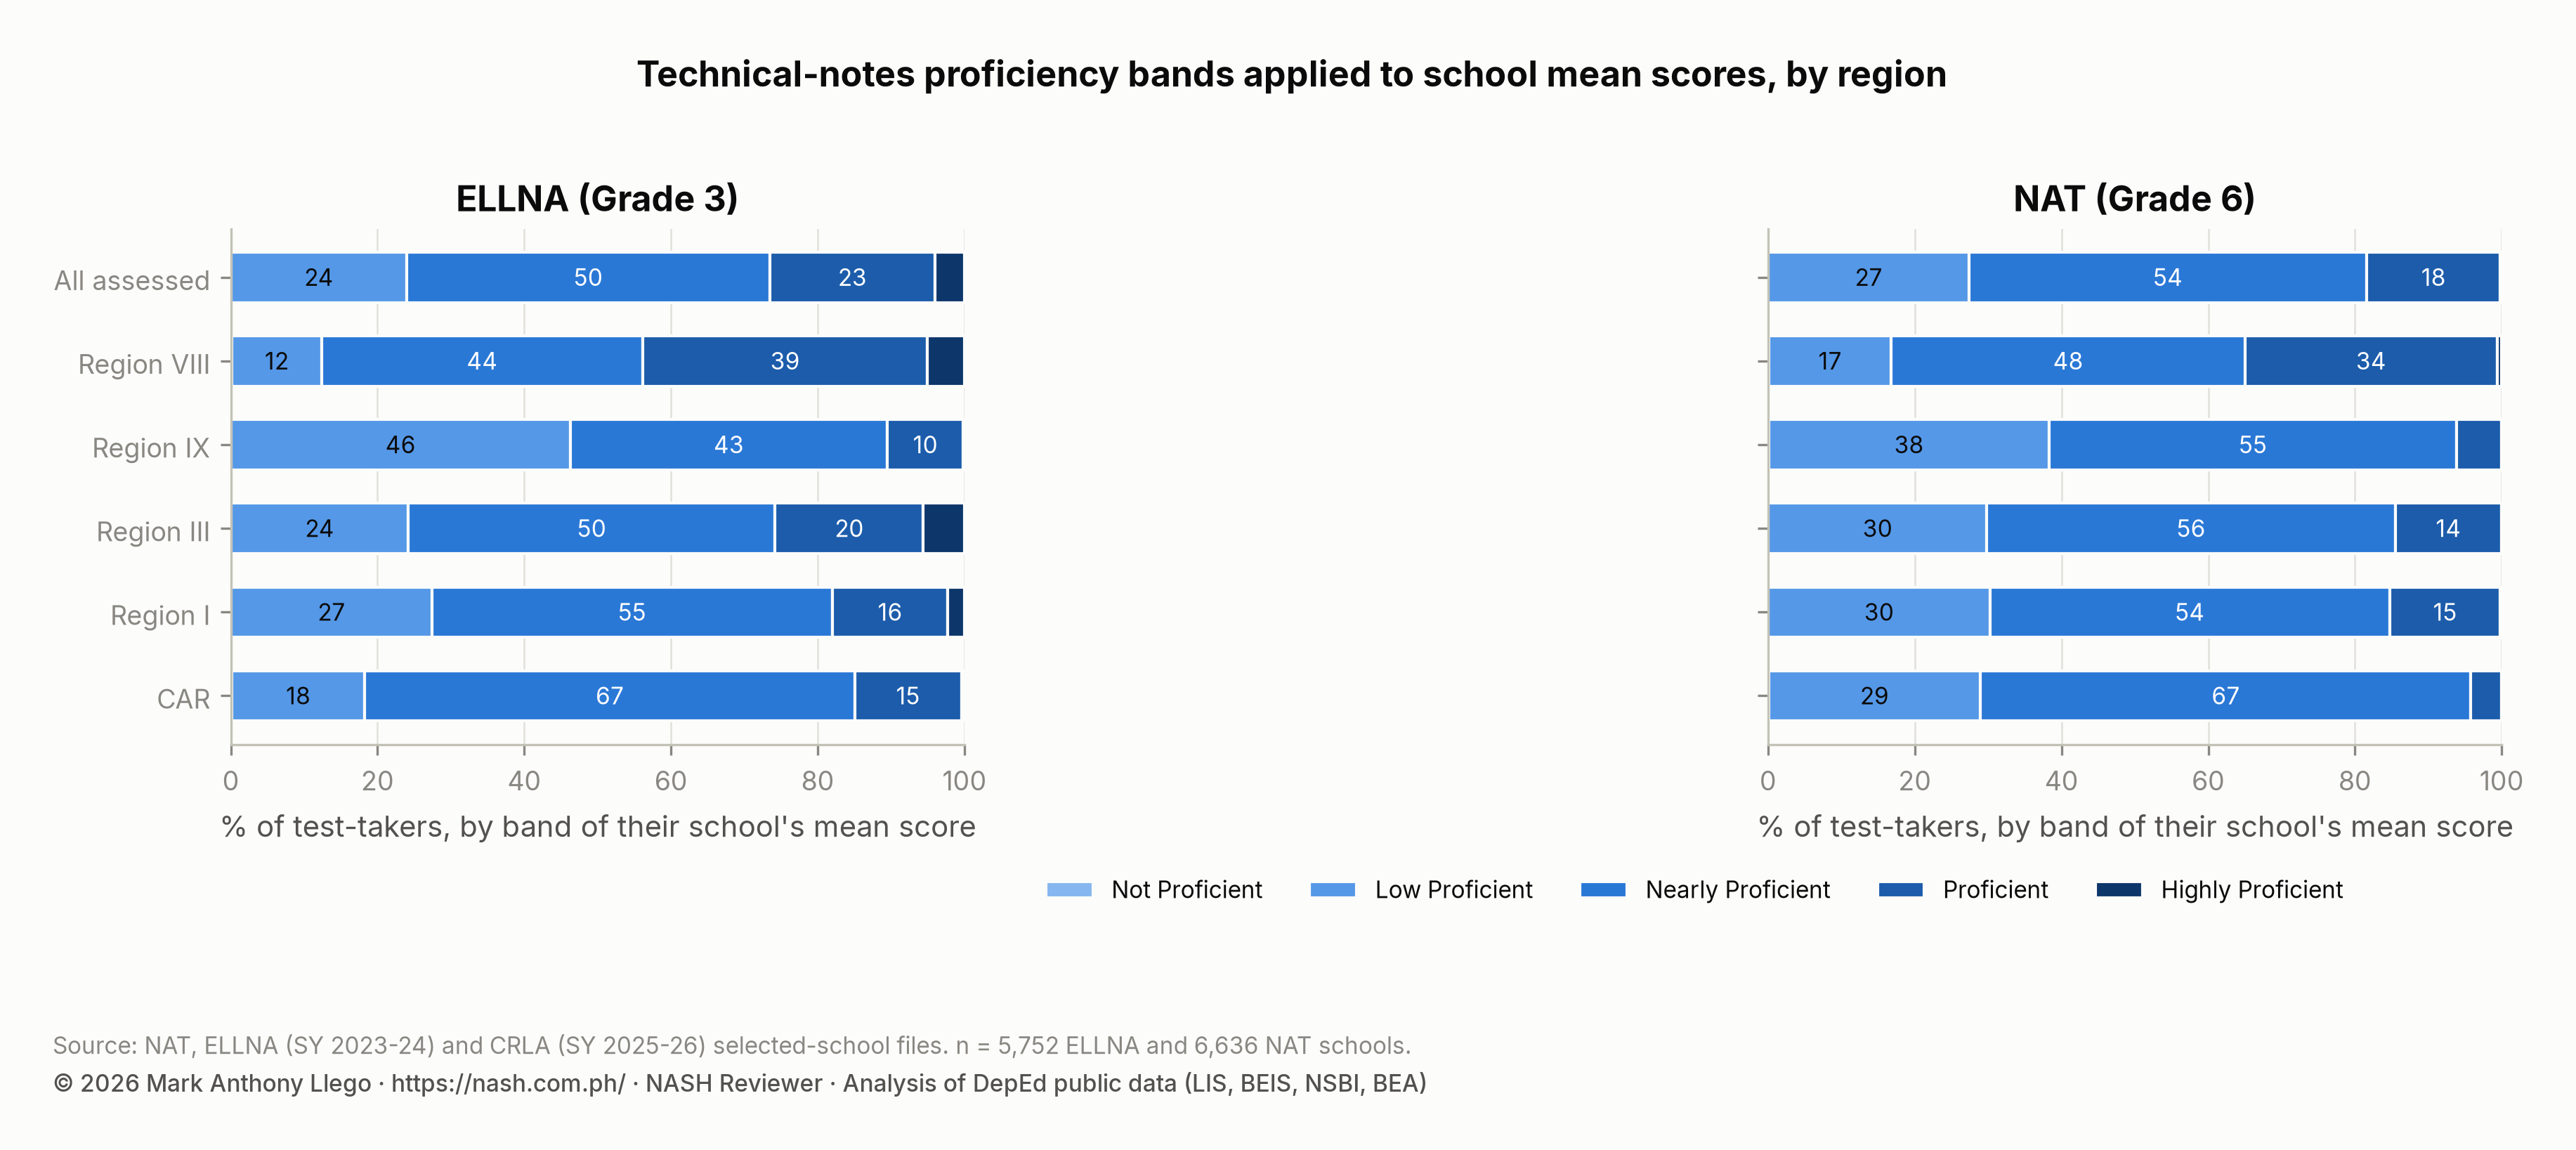
| Region | Not Proficient | Low Proficient | Nearly Proficient | Proficient | Highly Proficient |
|---|---|---|---|---|---|
| CAR | 0.1% | 28.9% | 66.8% | 4.2% | 0.0% |
| Region I | 0.0% | 30.2% | 54.5% | 15.1% | 0.2% |
| Region III | 0.0% | 29.8% | 55.7% | 14.5% | 0.0% |
| Region IX | 0.1% | 38.3% | 55.5% | 6.2% | 0.0% |
| Region VIII | 0.1% | 16.7% | 48.2% | 34.3% | 0.6% |
| All assessed | 0.0% | 27.3% | 54.3% | 18.2% | 0.2% |
These shares describe school means, not the share of proficient learners. A school with a mean of 60 can have many learners above 75 and many below 40. The share of learners at each level cannot be computed from this file. PISA, TIMSS, SEA-PLM and the NAT covers the national proficiency levels that EDCOM II reports for the NAT and ELLNA, alongside the international assessments.
NAT Grade 6 scores by subject
Across the assessed schools, Filipino averages 66.0 and Science 53.8, with English, Araling Panlipunan and Mathematics between them. Only 10% of schools have a Science mean of 75 or more, against 27% in Filipino. The table gives each subject’s weighted mean and the share of schools with a mean of 75 or more.
| Assessment | Component | Schools | Weighted mean (95% CI) | Schools with a mean of 75 or more |
|---|---|---|---|---|
| ELLNA | English | 5,752 | 64.5 (63.9–65.1) | 35% |
| ELLNA | Filipino | 5,752 | 66.9 (66.4–67.4) | 39% |
| ELLNA | Numeracy | 5,598 | 53.6 (52.7–54.5) | 26% |
| ELLNA | Mother Tongue | 3,827 | 62.2 (61.5–62.9) | 31% |
| NAT | Filipino | 6,636 | 66.0 (65.6–66.4) | 27% |
| NAT | Mathematics | 6,636 | 56.4 (55.7–57.1) | 21% |
| NAT | English | 6,636 | 63.2 (62.6–63.7) | 28% |
| NAT | Science | 6,636 | 53.8 (53.2–54.3) | 10% |
| NAT | Araling Panlipunan | 6,636 | 62.1 (61.5–62.7) | 29% |
Small samples and shrinkage of school means
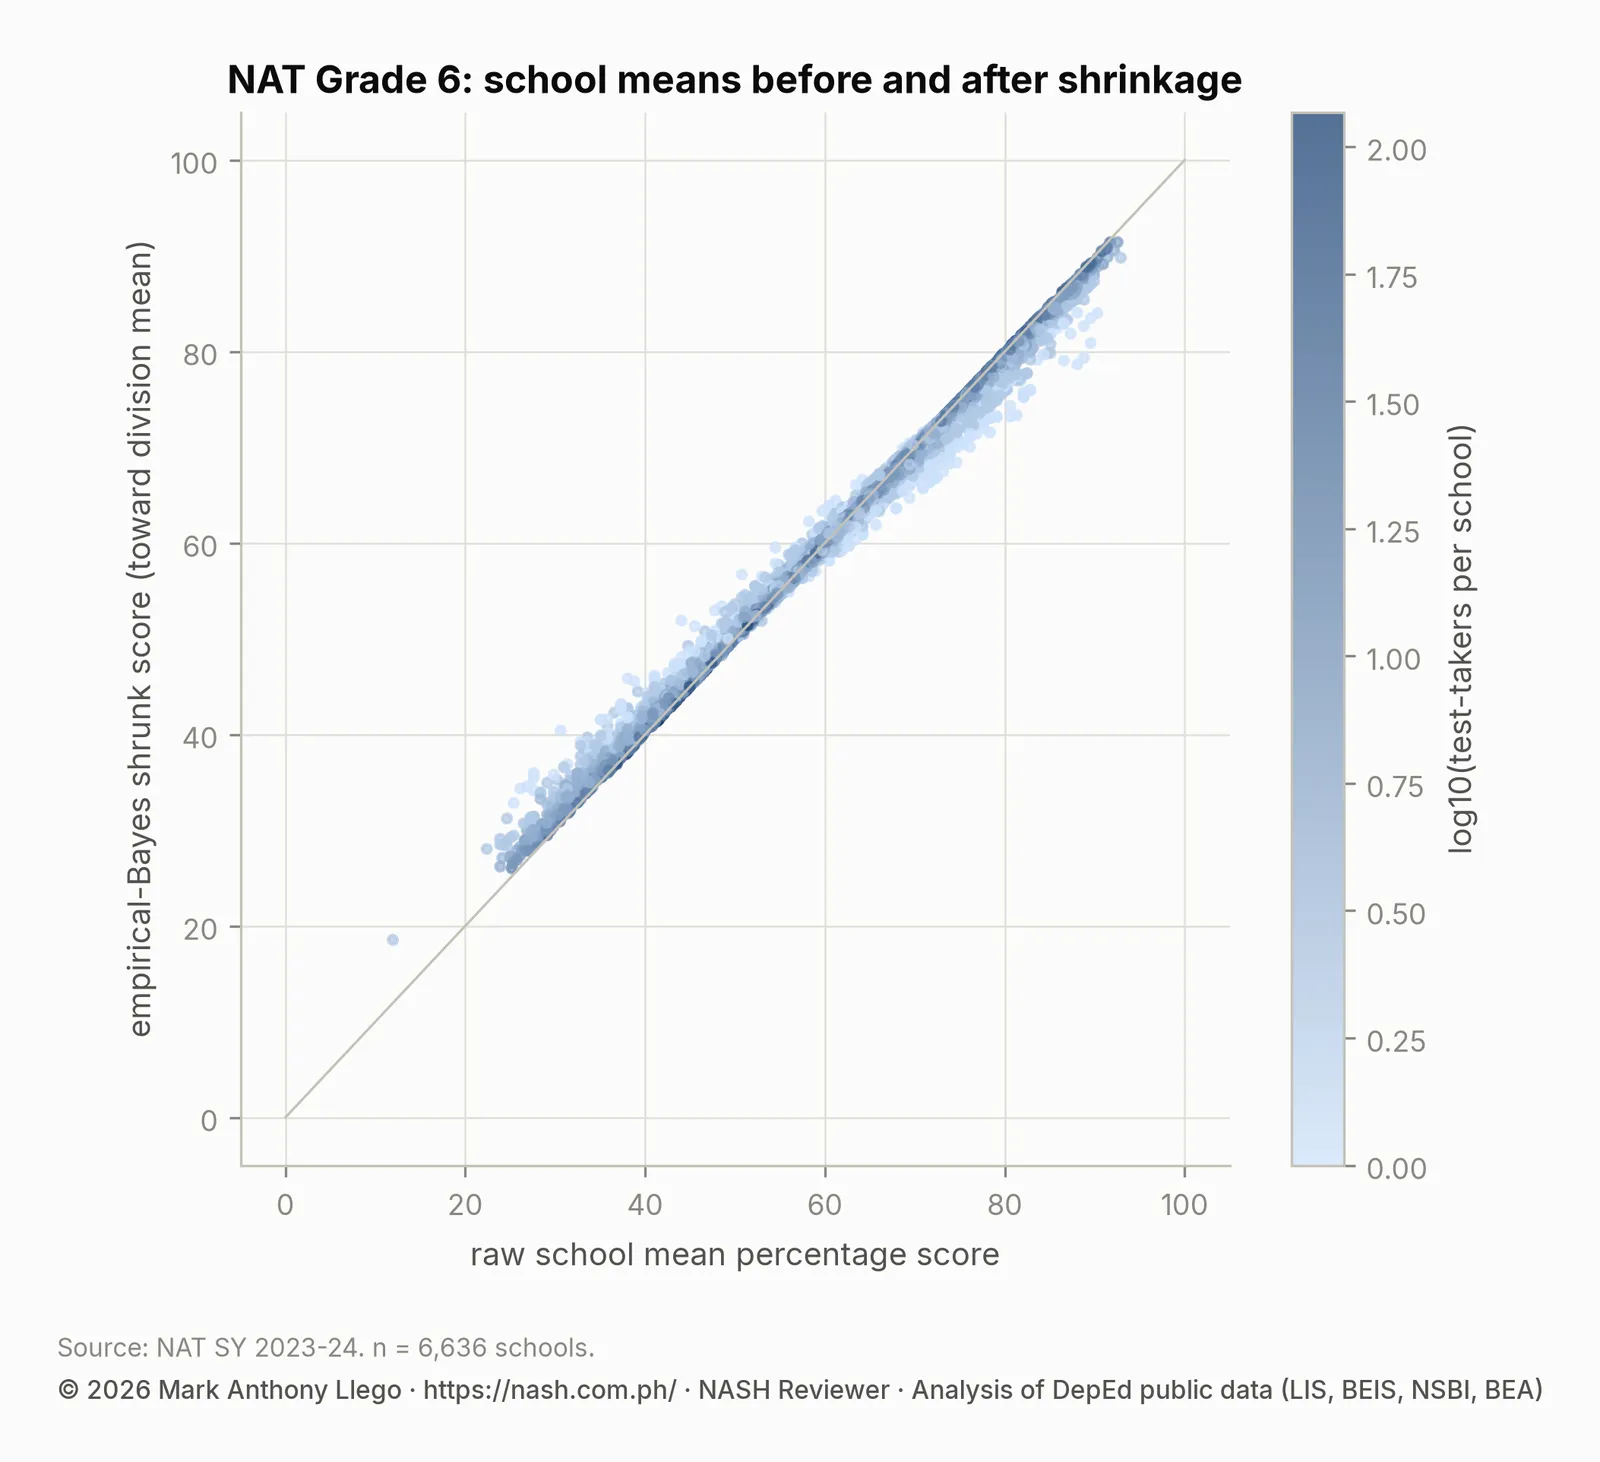
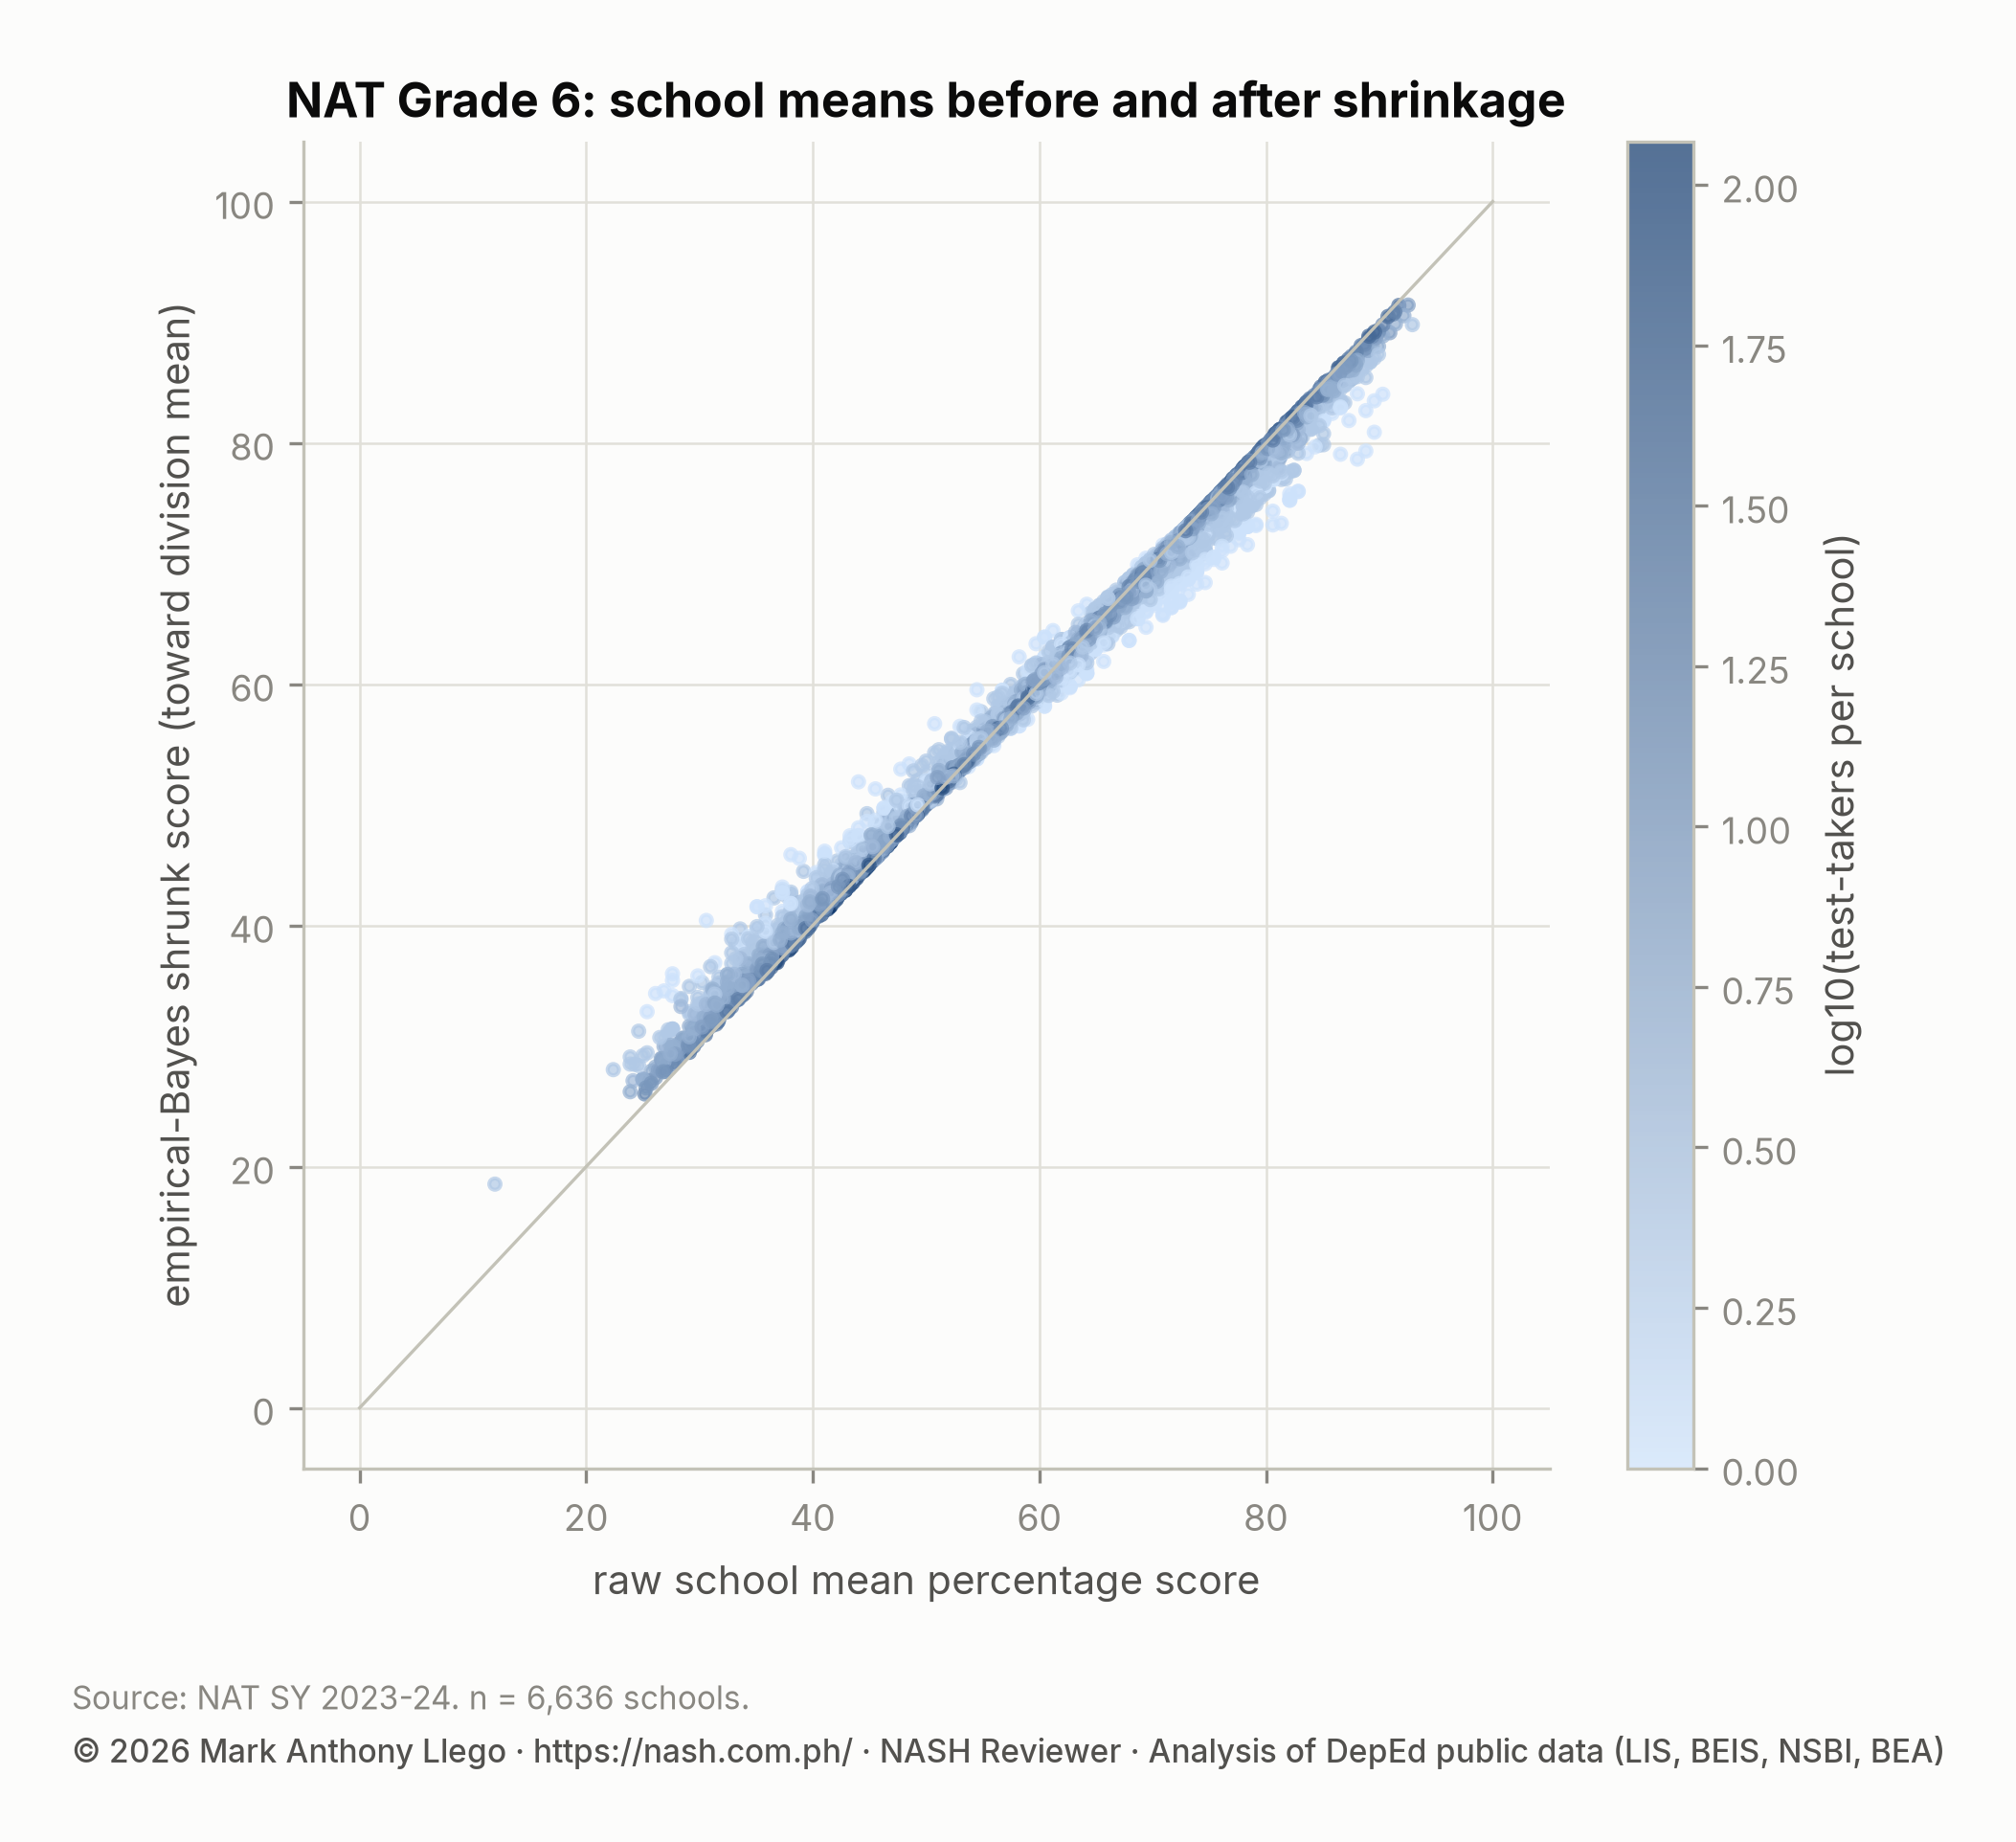
Each school’s mean rests on a few sampled learners, so raw school means overstate how different schools are. An empirical-Bayes estimator pulls each school’s mean toward its division’s mean, and the fewer test-takers a school has, the farther its mean moves. The between-school variance within divisions is about 146 points squared and the per-learner variance is about 54. On those values, a school with 6 test-takers keeps 94% of its own deviation, and a school with 2 keeps less.
The adjustment is small on average: the correlation between raw and shrunk means is 0.997. It does reorder the tails. Of the 100 lowest raw school means, 82 remain in the lowest 100 after shrinkage. The spread of school means falls from 14.6 to 13.7 points.
Division rankings, by contrast, are stable under every alternative estimator. Unweighted means, school medians, shrunk means, public schools only, and dropping schools with fewer than 5 test-takers all correlate with the baseline ranking at 0.955 or better. Between 8 and 10 of the bottom-10 divisions are the same in every variant.
| Assessment | Alternative estimator | Rank correlation with baseline | Bottom-10 divisions in common | Largest rank change |
|---|---|---|---|---|
| ELLNA | unweighted mean | 0.987 | 9 | 7 |
| ELLNA | school median | 0.984 | 9 | 5 |
| ELLNA | weighted mean n ge 10 | 1 | 10 | 1 |
| ELLNA | weighted mean shrunk | 1 | 10 | 0 |
| ELLNA | public only weighted mean | 1 | 10 | 0 |
| NAT | unweighted mean | 0.966 | 10 | 11 |
| NAT | school median | 0.955 | 8 | 16 |
| NAT | weighted mean n ge 5 | 0.991 | 8 | 5 |
| NAT | weighted mean shrunk | 1 | 10 | 0 |
| NAT | public only weighted mean | 0.992 | 10 | 6 |
NAT and ELLNA in the same schools
5,548 schools have both a Grade 6 NAT mean and a Grade 3 ELLNA mean from SY 2023-2024. The two correlate at 0.62 (Spearman), so a school that is weak in Grade 3 tends to be weak in Grade 6 as well. The ELLNA Grade 3 results by division report covers the earlier grade. The CRLA reading levels report explains why the early-reading screen does not agree with either test.
What this means for school heads
- Do not rank schools on raw NAT means from this file. A mean from six learners is too small a sample to rank on. Compare a school with its division and with its own past results, and expect year-to-year swings of several points that carry no meaning.
- Science and Mathematics are the system’s weakest subjects in every region. A school improvement plan that targets those two subjects follows the data as well as the policy.
- Division matters more than region. Where a school sits inside its division explains more of its result than which region it is in. Division-level learning-recovery programs are the right scale.
- The proficiency mark is far off. The pooled mean of 60 is fifteen points below 75. “Nearly Proficient” describes the schools of half of all test-takers.
How these numbers were made
- Source: DepEd’s NAT Grade 6 SY 2023-24 selected-school file (Bureau of Education Assessment), joined to the SY 2023-24 school list on school ID (6,636 of 6,636 matched).
- Regional and divisional means weight each school by its test-takers. 95% intervals resample schools within each group 2,000 times; rank intervals come from the same draws.
- Divisions are compared with the pooled mean by a z-test on the bootstrap standard error, with Benjamini–Hochberg adjustment across the 44 divisions.
- Bands are DepEd’s technical-notes bands applied to school means. Shrinkage is a method-of-moments empirical-Bayes estimator with precision proportional to test-takers.
- Subject means use the same weights; “share of schools with a mean of 75 or more” is unweighted.
Limits
The file covers 44 of the 63 divisions in five regions and about half of the public Grade 6 schools inside them, selected by an unpublished rule. It says nothing about the other 13 regions. DepEd sampled learners within schools and has not described the sampling design. The technical notes caution that test difficulty differs between years, so these results cannot be compared with earlier NAT rounds. The 814 private schools in the file have no input data and are left out of the input models. All results describe the assessed schools.
Frequently asked questions
What was the DepEd NAT Grade 6 mean score in SY 2023-2024?
The mean percentage score was 60.3 across the 6,636 assessed schools in five regions, weighted by test-takers. Public schools alone averaged 61.0. The proficiency mark is 75.
Which DepEd division had the highest NAT Grade 6 score in SY 2023-2024?
Calbayog City in Region VIII had the highest mean at 74.4 (95% interval 72.6 to 76.1). Biliran (73.6), Ilocos Norte (73.5) and Leyte (72.9) followed. Candon City in Region I was lowest at 45.8.
Why are school-level NAT results in the DepEd file unreliable?
Each school’s mean rests on a median of six sampled learners, so it can move several points by chance. Shrinking school means toward their division mean moves 18 of the 100 lowest schools out of the bottom 100, while division rankings barely change.
Download the data
The cleaned, harmonized DepEd files behind this series are free to download in CSV and Parquet, with a codebook and checksums, under the terms of use set out in the release. Download Cleaned DepEd School Data, SY 2017-18 to 2025-26 documents every file and column. The files themselves are at data.nash.com.ph, starting with the README, the SY 2023-24 school master file (CSV, 8.0 MB) and the nine-year enrollment panel (Parquet, 17.2 MB).
More in this series
- DepEd Enrollment Trends SY 2017-2018 to SY 2025-2026
- Enrollment by school year: SY 2017-18, SY 2018-19, SY 2019-20, SY 2020-21, SY 2021-22, SY 2022-23, SY 2023-24, SY 2024-25, SY 2025-26
- DepEd Learner Data SY 2023-2024: IP, ALIVE and School Size
- DepEd Teachers and School Personnel Data, SY 2023-2024
- DepEd Classroom and School Building Data, SY 2023-2024
- DepEd WASH Data SY 2023-2024: Toilets, Water, Electricity
- DepEd ICT Data SY 2023-2024: Computers and Internet
- ELLNA Grade 3 Results SY 2023-2024: DepEd Division Scores
- CRLA Results SY 2025-2026: Reading Levels in Grades 1 to 3
- DepEd School Inputs vs Test Results: Multigrade and Internet
- DepEd Open Data Quality: Errors, Blanks and Coverage Limits
- Download Cleaned DepEd School Data, SY 2017-18 to 2025-26
- The full report: Philippine basic education in numbers
Guides for aspiring school heads
- DepEd Data for Aspiring School Heads: Where to Start
- NASH Practice Questions With Answers: 50 Items on the PPSSH
- How to Read DepEd Data: A Guide for Aspiring School Heads
- EDCOM II Final Report: Guide for Aspiring School Heads
- National Education Plan 2026-2035: Guide for School Heads
- NASH Study Guide: DepEd Memorandum 069, s. 2025 and PPSSH
- PPSSH Domain 1: Leading Strategically With DepEd Data
- PPSSH Domain 2: Managing School Operations With DepEd Data
- PPSSH Domain 3: Teaching and Learning With DepEd Data
- PPSSH Domain 4: Developing Self and Others With DepEd Data
- PPSSH Domain 5: Building Connections With DepEd Data
Analysis and charts by Mark Anthony Llego for NASH Reviewer. Data: Department of Education public datasets. Charts may be reused only with written permission from support@nash.com.ph.