EDCOM II’s three reports find that most Filipino learners fall below minimum proficiency on every assessment the country takes. In the Programme for International Student Assessment (PISA) 2022, 76% to 84% of Filipino 15-year-olds scored below Level 2; in the Southeast Asia Primary Learning Metrics (SEA-PLM) 2024, 14% of Grade 5 learners reached the top reading band; and on the Grade 12 National Achievement Test (NAT) of SY 2023-2024, 0.40% were proficient. The Commission also finds the testing system “over-assessed but under-informed”, and recommends an independent assessment body, streamlined key stage tests moving to computer-based testing where feasible, a stronger Bureau of Education Assessment (BEA) and faster release of results.
This guide is for NASH takers and researchers. EDCOM II is the Second Congressional Commission on Education, created by Republic Act No. 11899. The guide uses its Year One Report (2024), Year Two Report (2025) and Final Report, Turning Point (2026), the stand-alone National Education Plan document, EDCOM’s news releases, and DepEd issuances in force on October 30, 2026.
The tests use different scales, so a number from one test cannot be compared with another’s. The comparison of EDCOM II’s key numbers and the Final Report guide cover the PISA figures and Priority Area 6 in brief; this post goes deeper and adds SEA-PLM, TIMSS and DepEd’s actions since.
Key findings
- PISA 2022: three in four or more were below Level 2: 84% in mathematics, 76% in reading and 77% in science, against OECD averages of 31%, 26% and 24% (Year Two Report, p. 333). In PISA 2025, released after the reports, 21%, 31% and 32% reached Level 2 or above (EDCOM release, September 9, 2026).
- SEA-PLM: the top grew, the bottom did not. Grade 5 learners in the top reading band rose from 10% in 2019 to 14% in 2024, while the lowest band stayed at 27% (Final Report, pp. 148–149).
- The reports print no TIMSS scores. They cite TIMSS 2019 for findings such as shortages of learning materials (Year One Report, p. 84).
- Proficiency is rare on the national tests after Grade 6. At least 30.5% of Grade 3 learners were proficient on the Early Language, Literacy, and Numeracy Assessment (ELLNA) of SY 2023-2024, and 0.40% of 1,611,809 on the Grade 12 NAT of SY 2023-2024 (Final Report, pp. 152–153).
- Too many tests, too late, not linked. The Philippines gives 14 assessments, against an OECD average of four (Final Report, p. 139); of 27 key stage tests due in SY 2016-2017 to SY 2022-2023, 13 were late and 11 never given (Year One Report, p. 102).
- DepEd has moved on parts of the agenda. DepEd Order No. 015, s. 2026 phases out grade transmutation, as EDCOM recommends (Final Report, p. 146), but DepEd Order No. 55, s. 2016 remains the testing framework, and as of October 2026 no issuance has created an independent assessment body.
How did Filipino learners do in PISA 2018 and 2022?
PISA tests 15-year-olds (DepEd Memorandum No. 019, s. 2025, para. 2). EDCOM II itself “stemmed from our country’s dismal performance” in PISA 2018 (Year One Report, p. xlix). In PISA 2022, Filipinos scored “lowest among all ASEAN countries in Math, Reading, and Science, besting only Cambodia”, and “our best learners are comparable only to the average student in Malaysia, Thailand, Brunei, and Vietnam, and correspond to the worst performers in Singapore” (p. xlix).
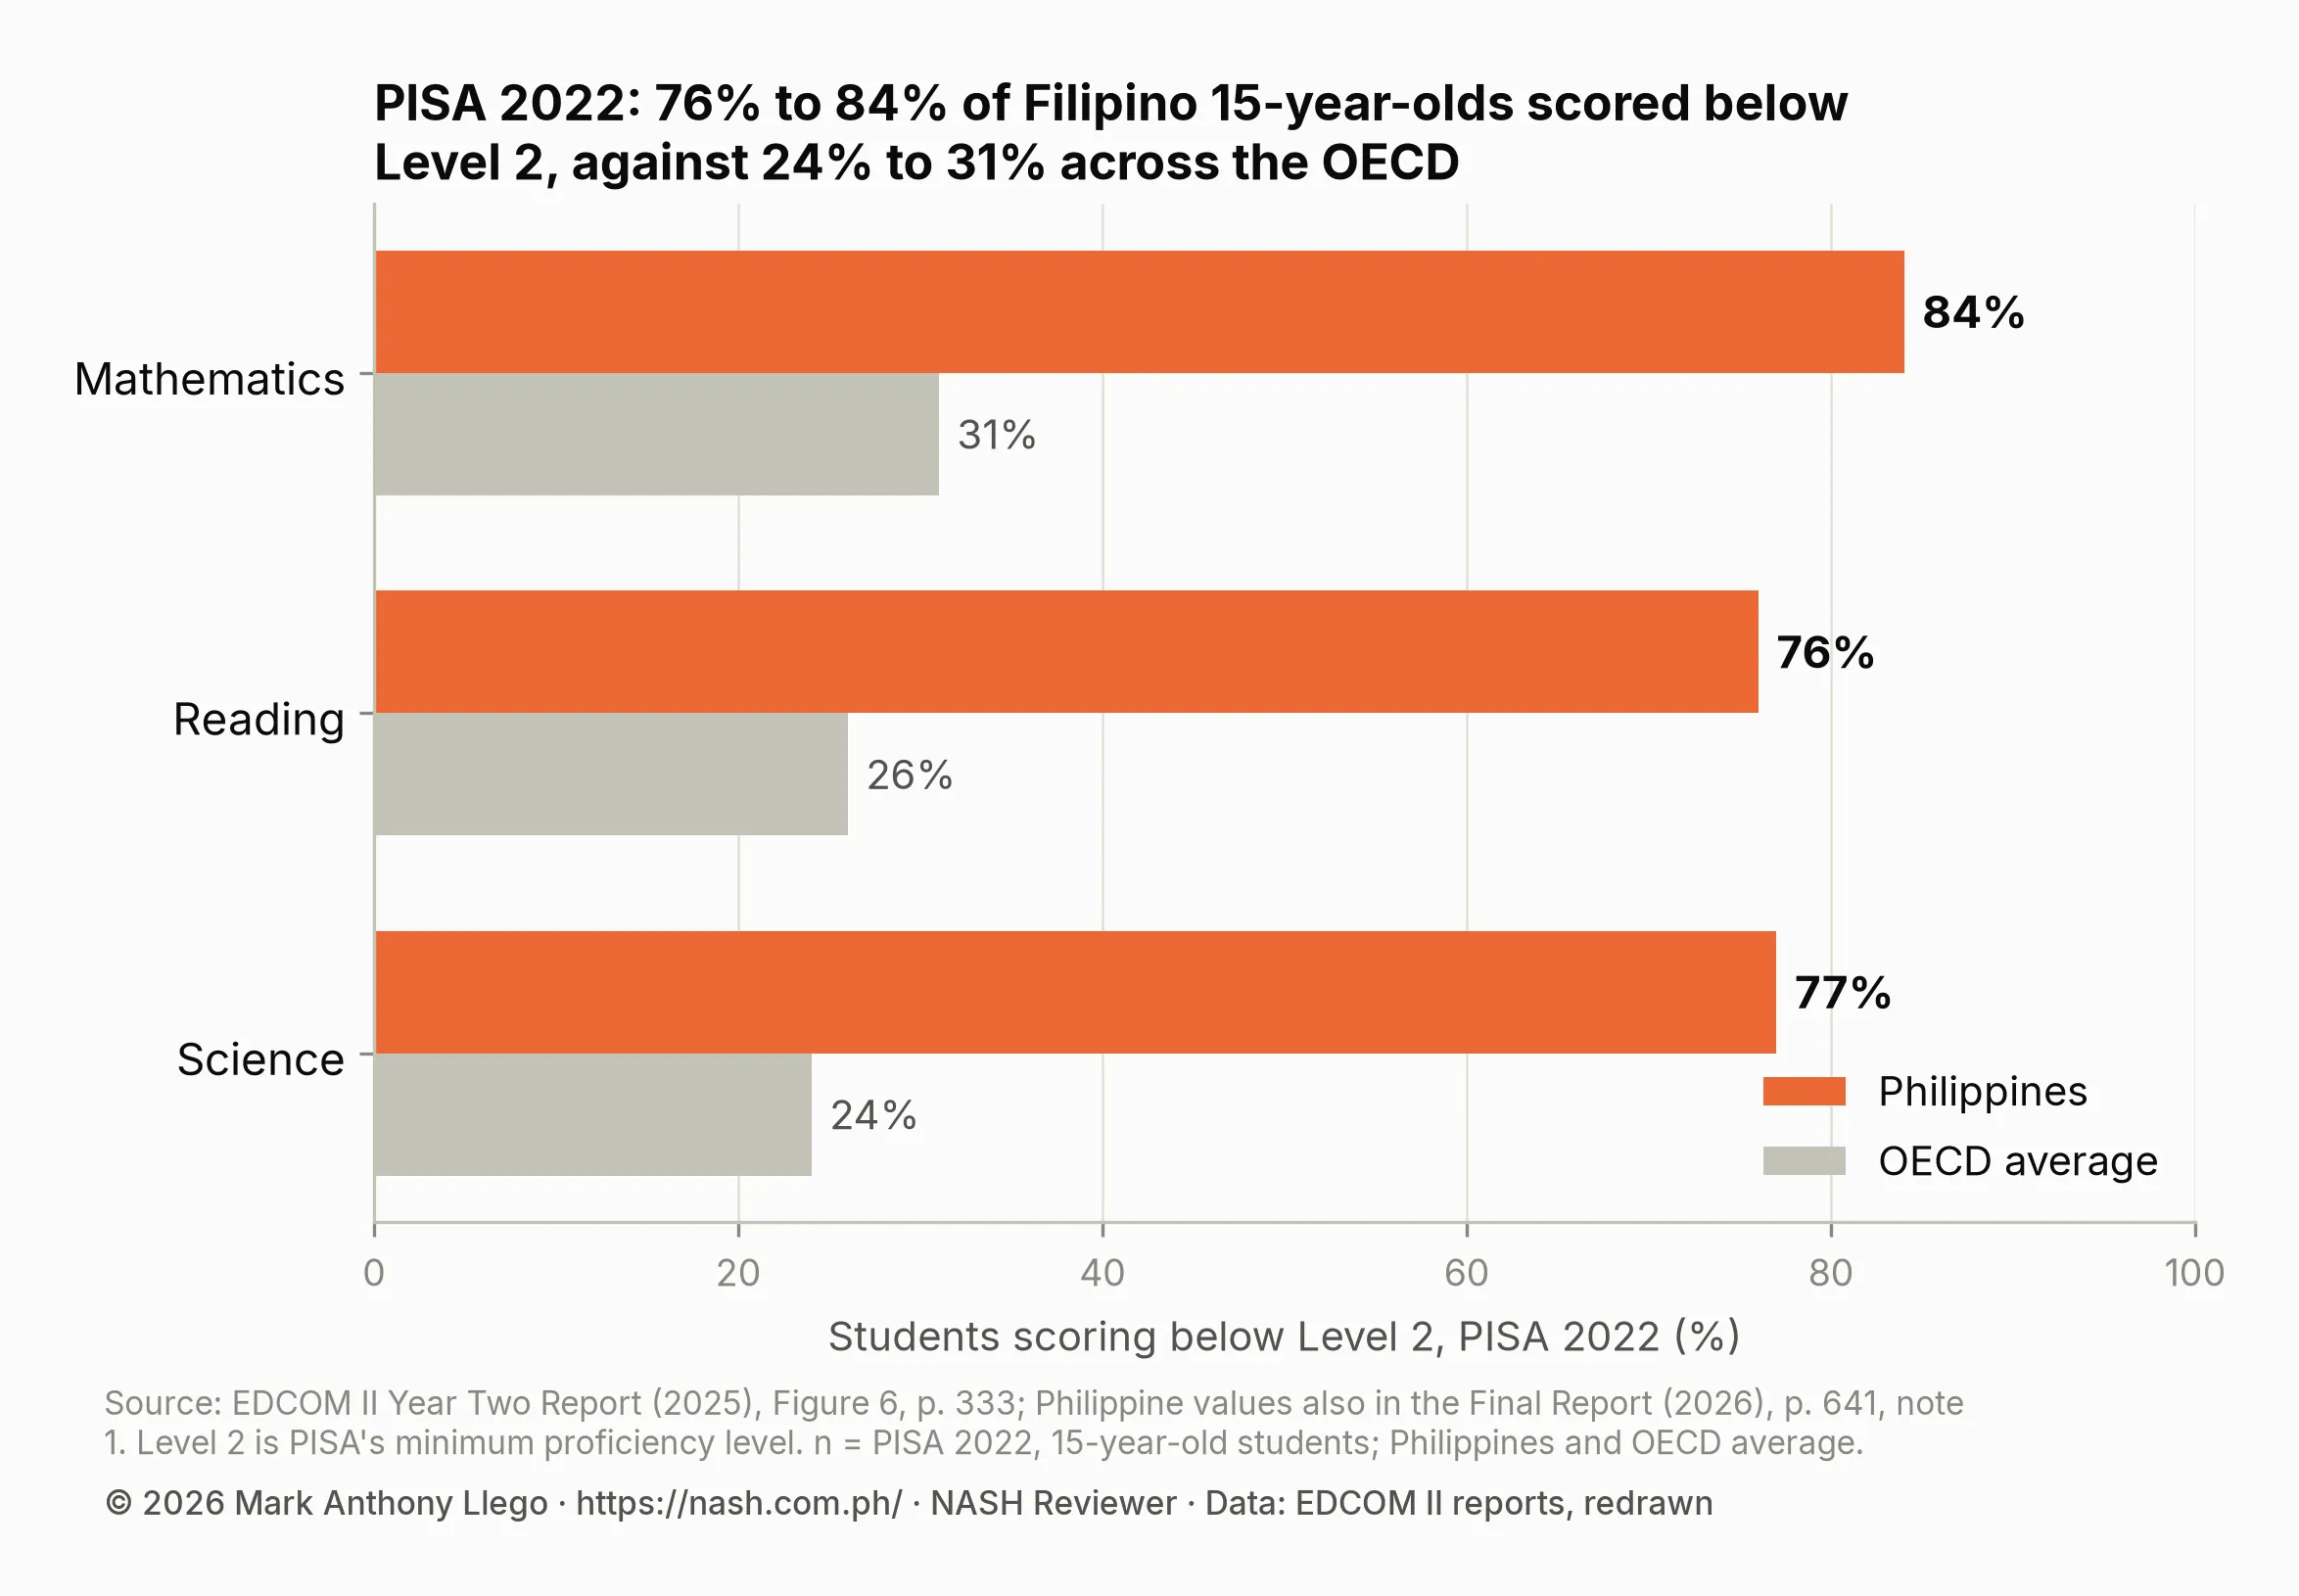
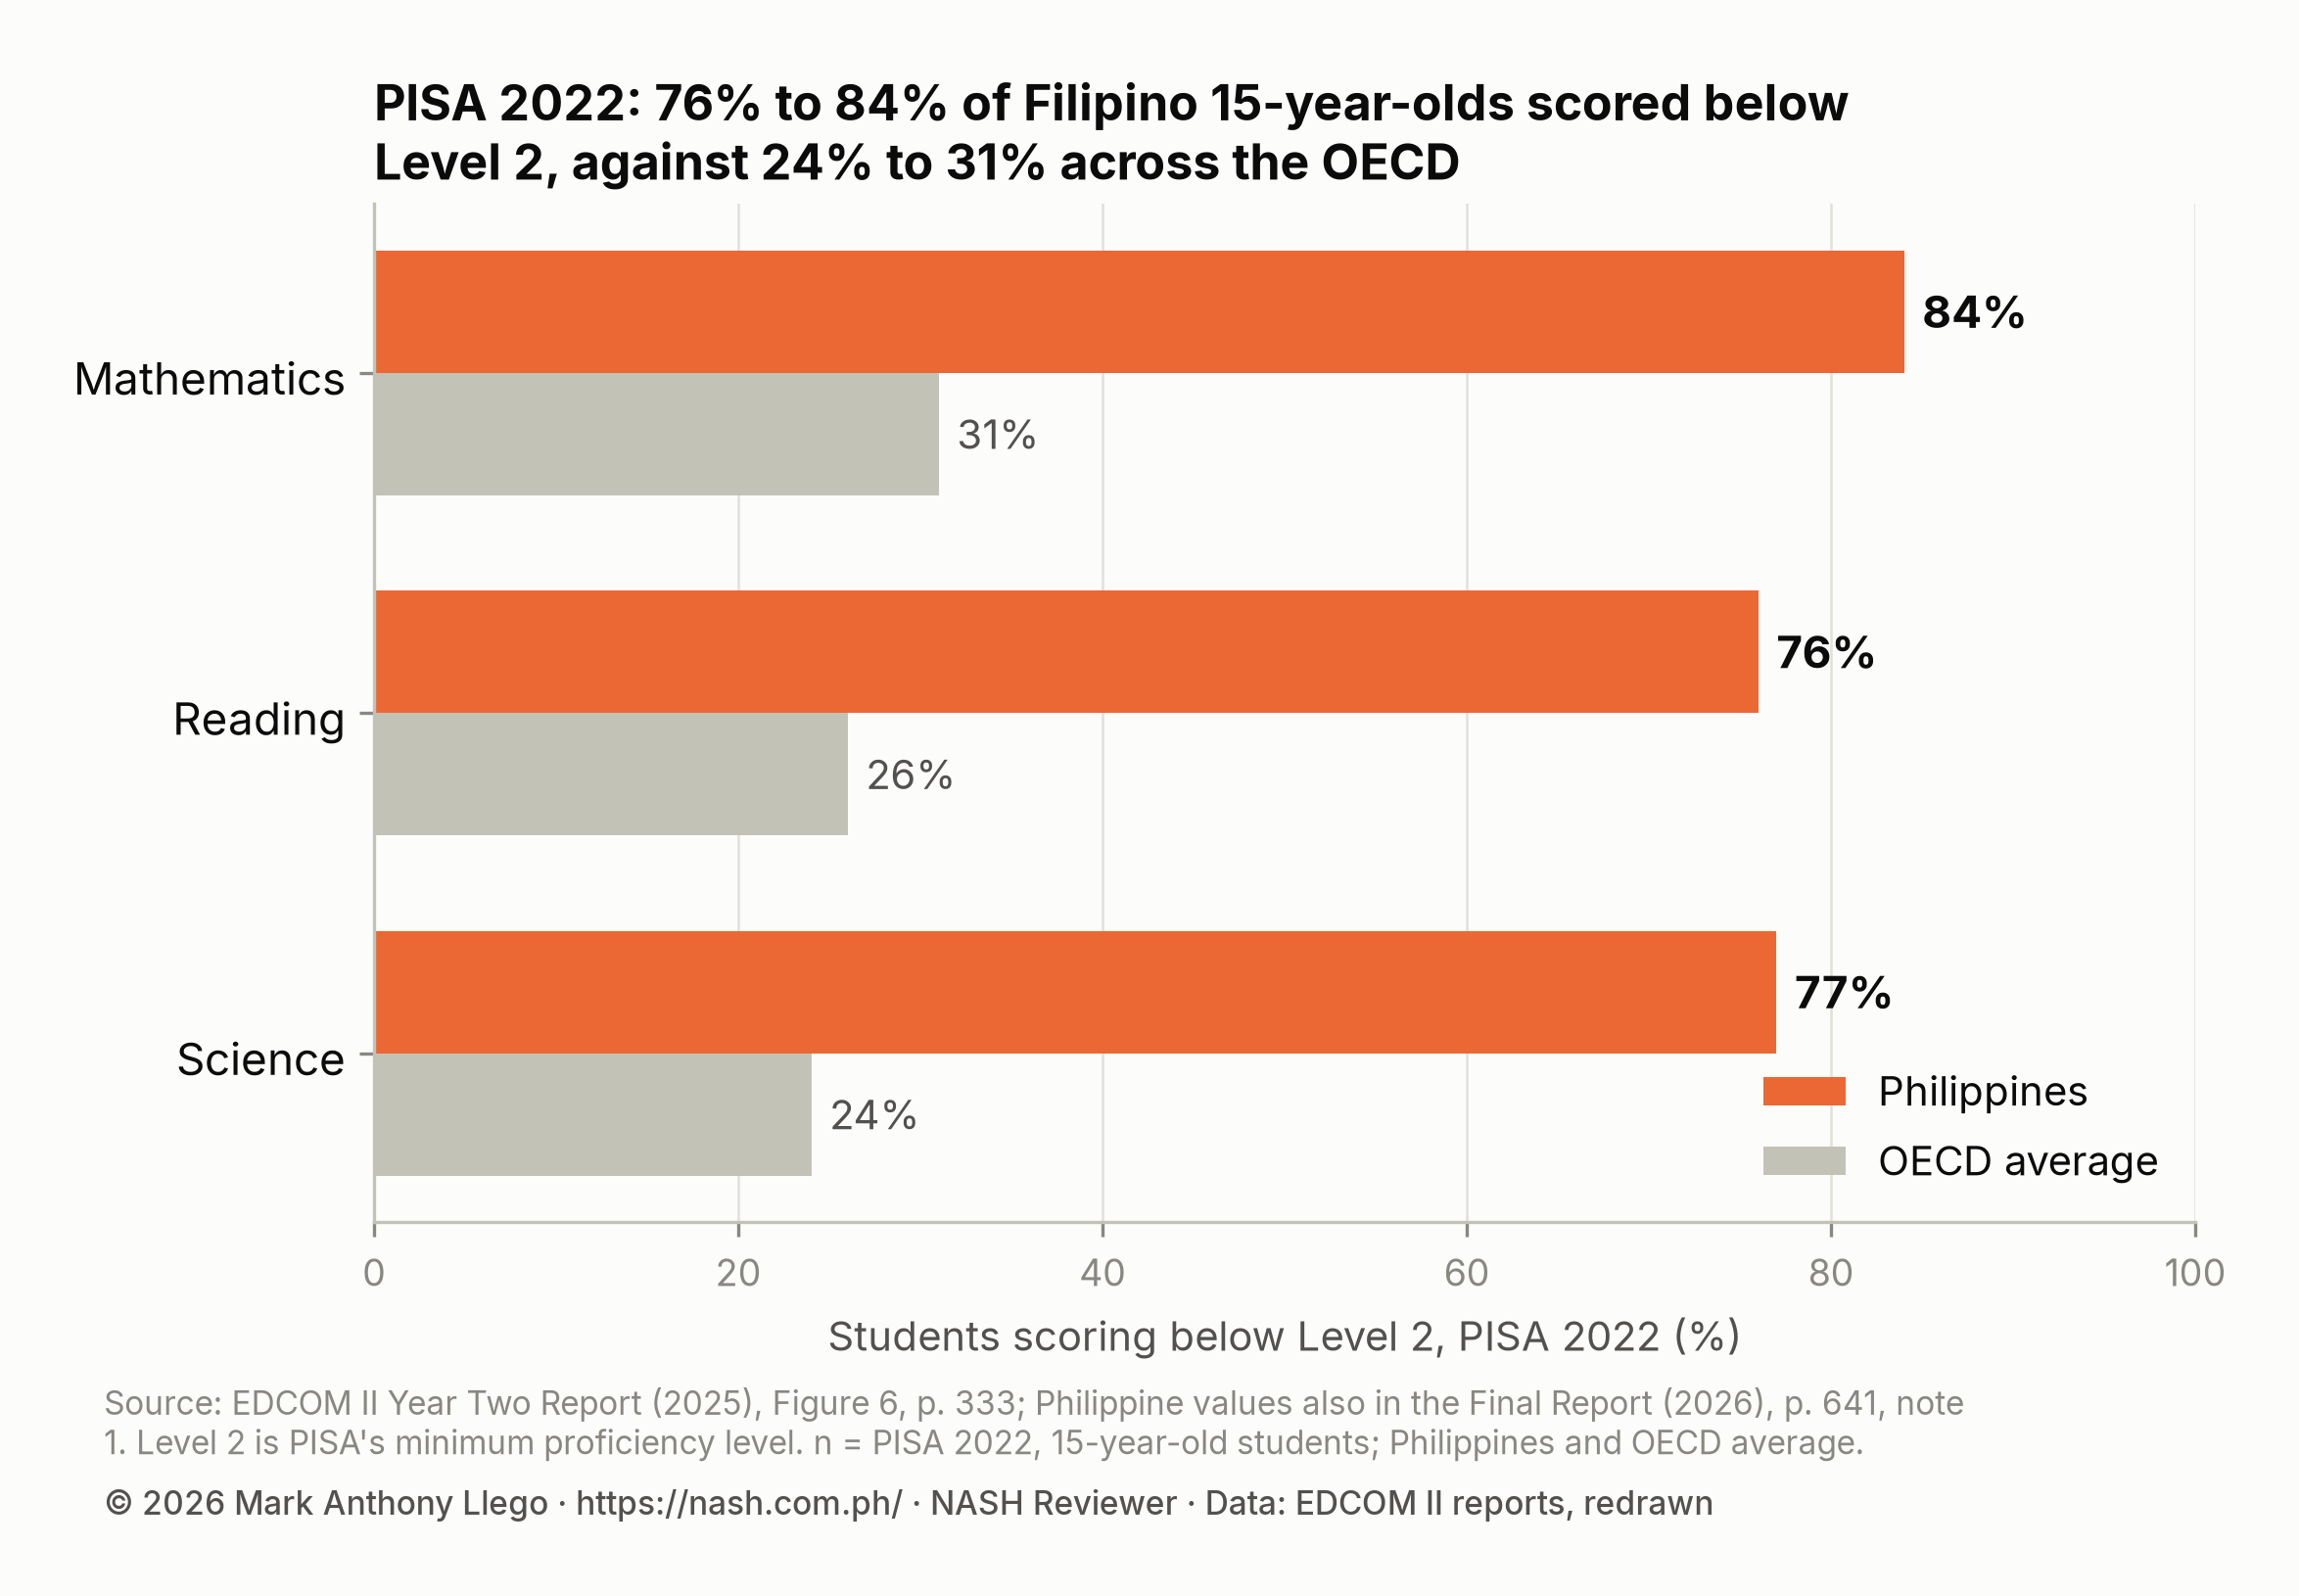
| PISA 2022 | Philippines below Level 2 | OECD average below Level 2 | OECD average at Level 5 or above (top performers) |
|---|---|---|---|
| Mathematics | 84% | 31% | 9% |
| Reading | 76% | 26% | 7% |
| Science | 77% | 24% | 7% |
The OECD’s PISA 2022 country note gives the 9%, 7% and 7% as shares at Level 5 or above. The Philippine values reappear in an essay by Aniceto Orbeta, Vicente Paqueo and Michael Abrigo in the Final Report, as “about 8 in 10” (pp. 640–641), and the Year One Report says that, “similar to 2018, more than 75%” scored below minimum proficiency in all three subjects (p. 81).
The key numbers post covers the 2022 mean scores (355, 347 and 356; Year One Report, p. 275); the country took PISA in 2018, 2022 and 2025 (DM 082, s. 2025, para. 3). The Philippines took PISA 2018 in English, though 94% of its 15-year-olds “primarily speak a language other than English at home” (Year One Report, p. 101).
PISA 2025: results released after the reports
DepEd gave PISA 2025 by computer from March 10 to April 11, 2025 (DM 019, s. 2025, para. 3); the results came out in September 2026. EDCOM called them the country’s “best PISA performance to date” (EDCOM 2, September 8, 2026) and reported scores of 373 in science, 371 in mathematics and 367 in reading, up 17, 16 and 20 points from 2022 (EDCOM 2, September 9, 2026).
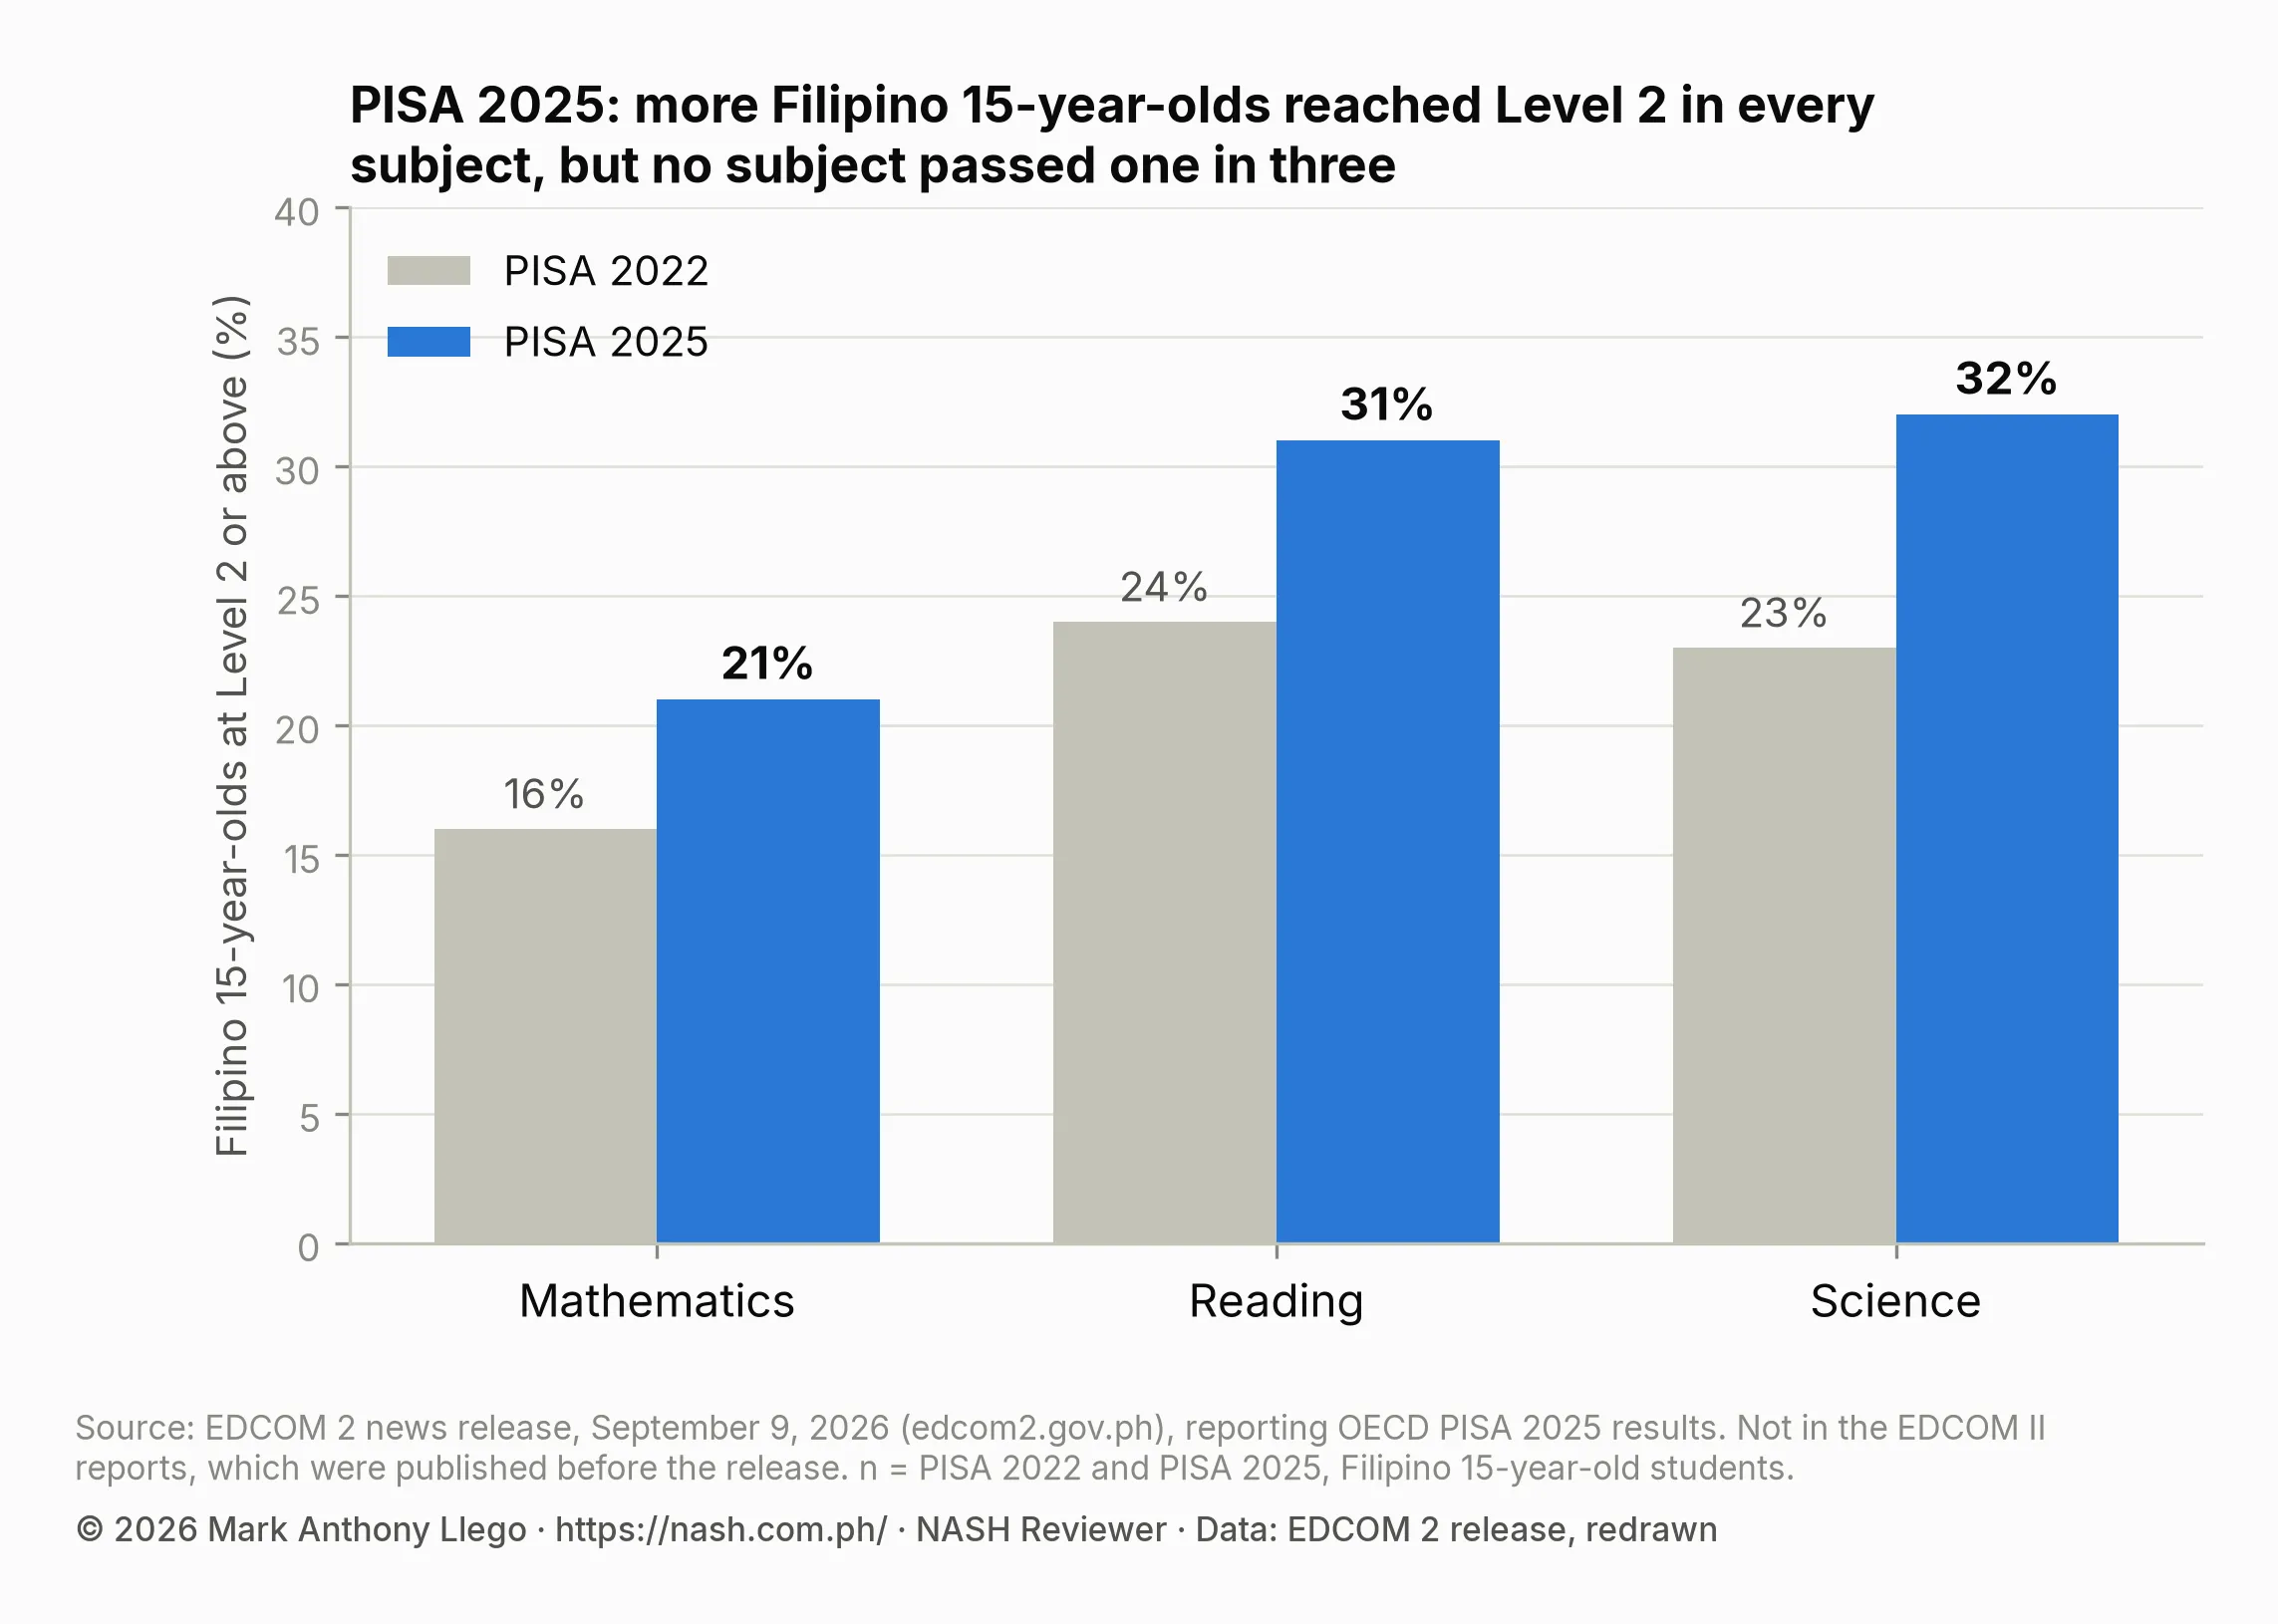
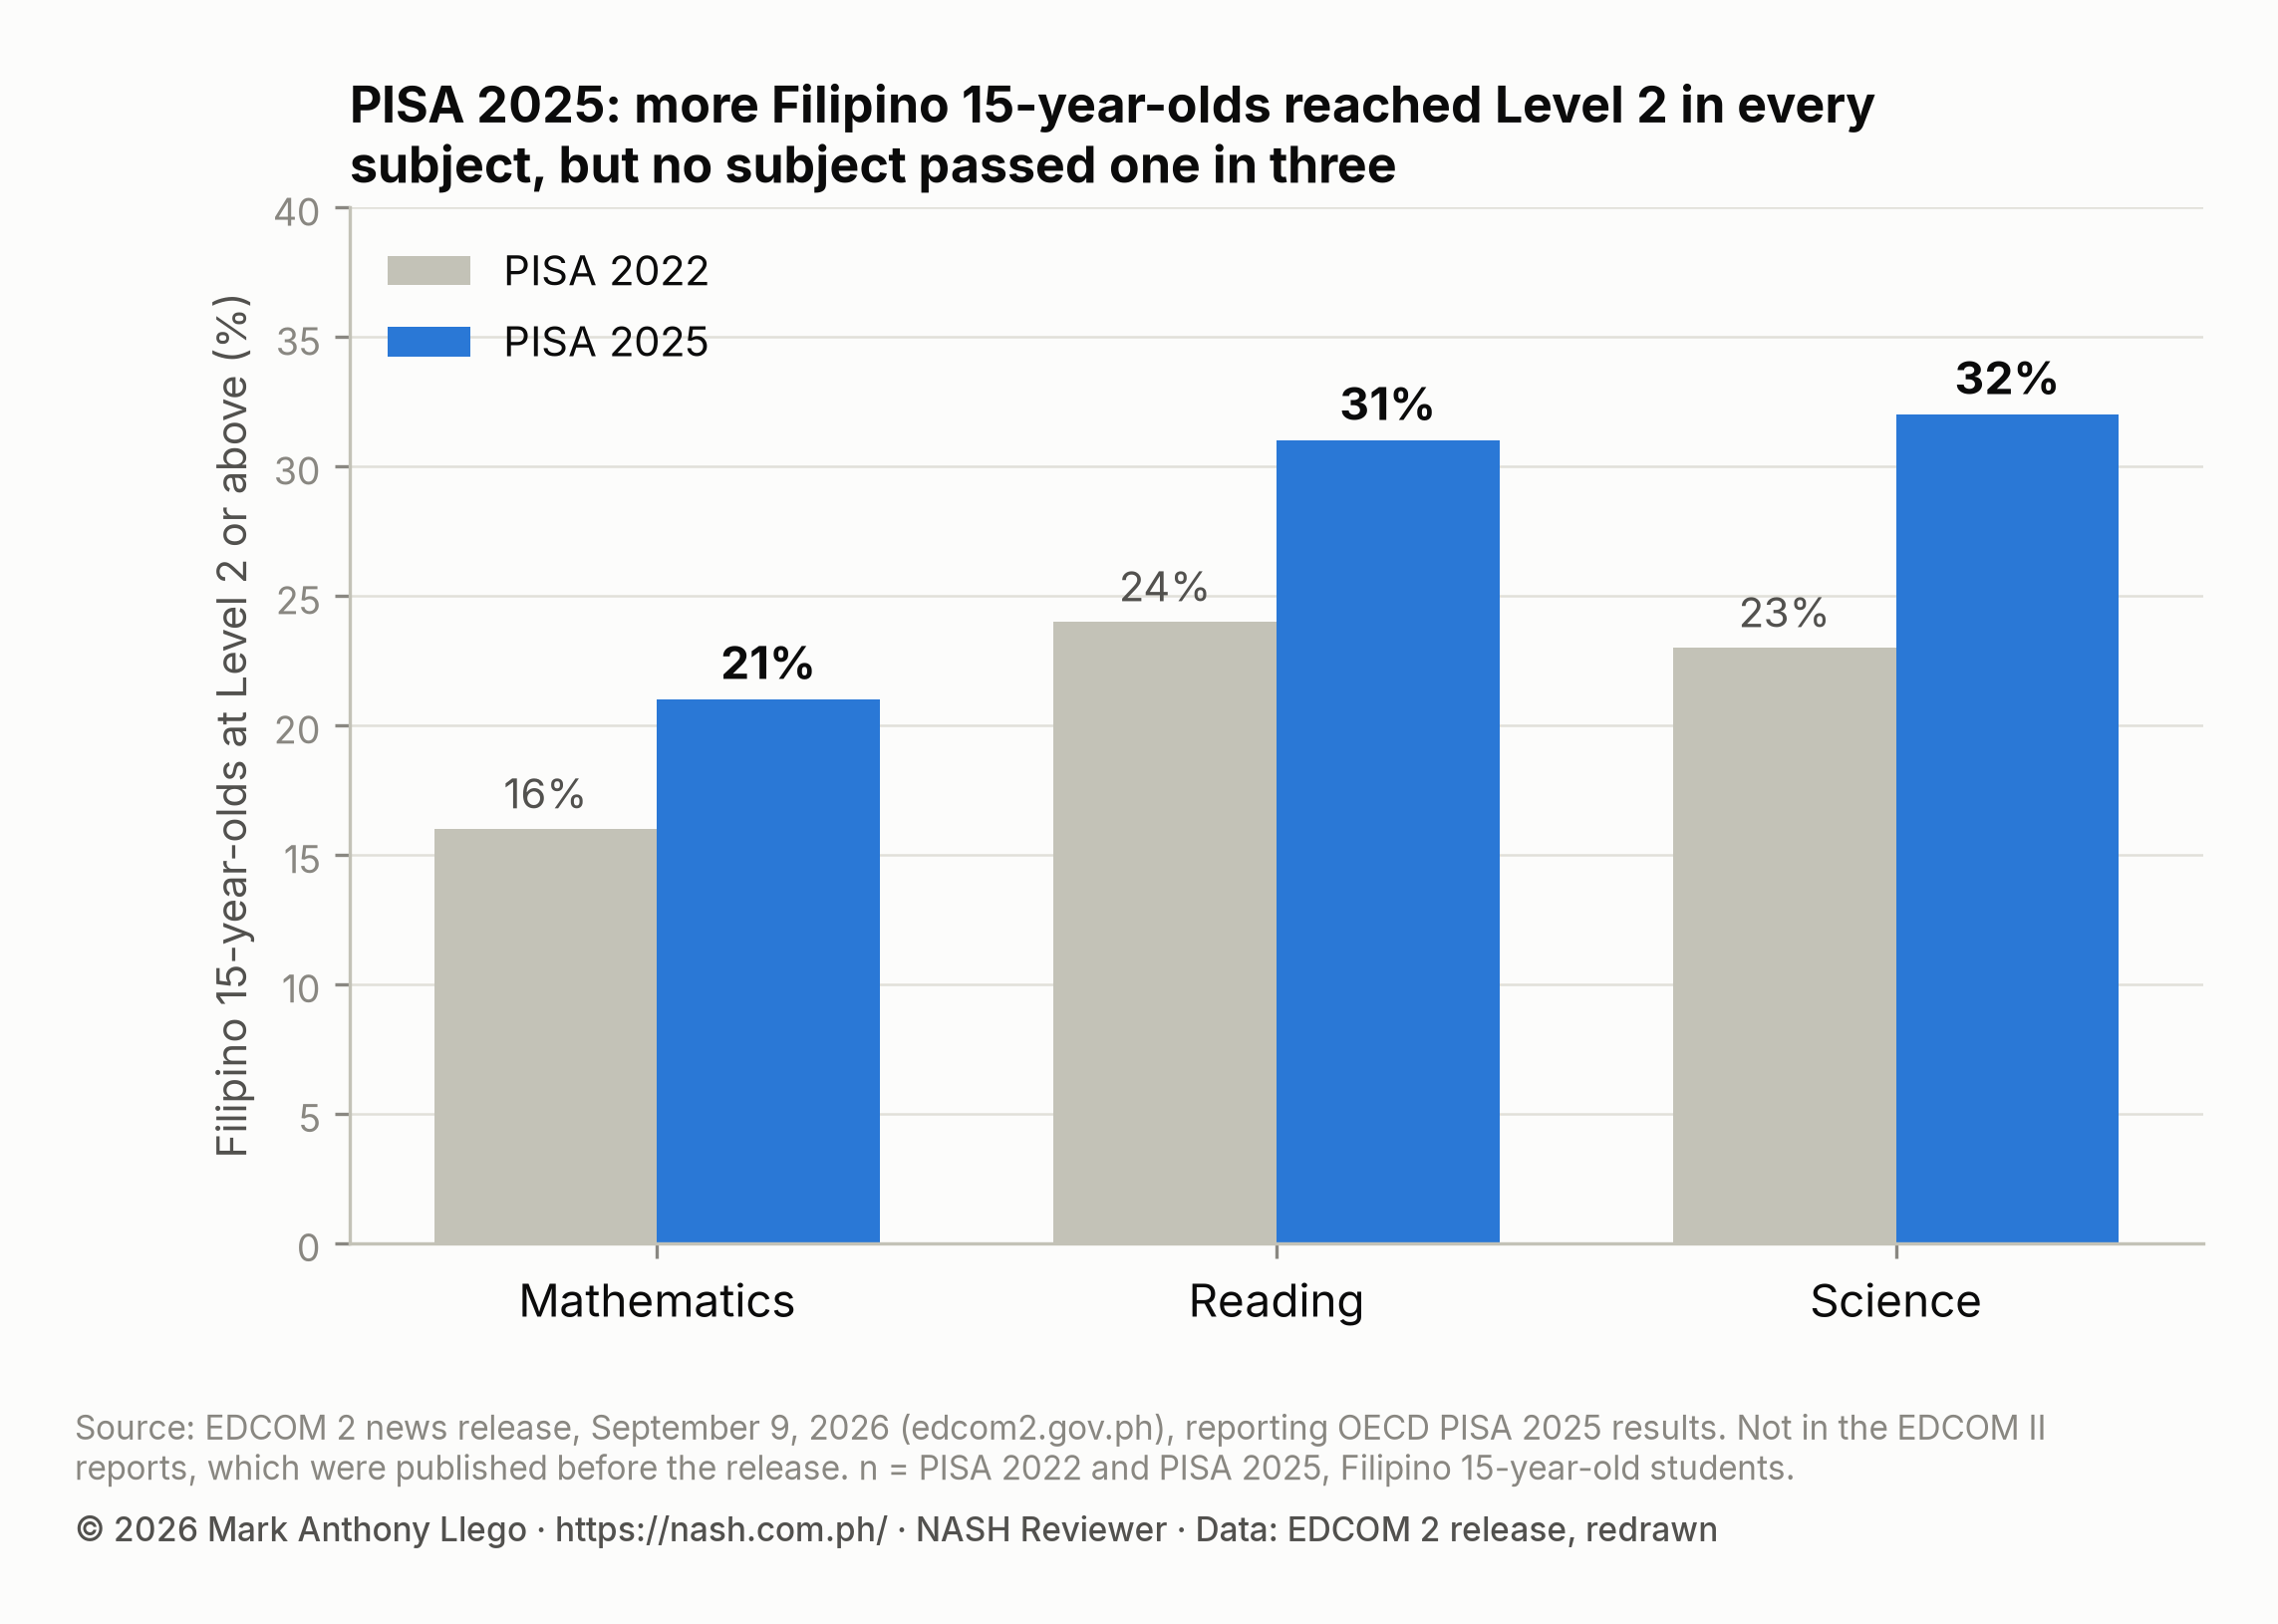
Scores still “trail OECD averages by 109 points in Science, 94 points in Reading, and 92 points in Mathematics” (same release). And compared with 2018, the share below Level 2 “did not change significantly in mathematics”, though it fell 11 percentage points in reading and 10 in science (OECD PISA 2025 country note).
What the EDCOM II reports say about TIMSS
The Trends in International Mathematics and Science Study (TIMSS) tested Filipino Grade 4 learners in 2019 (Year Two Report, p. 334; DM 082, s. 2025, para. 3). No report prints the Philippines’ scores; they use TIMSS for three findings:
- Learning materials. “95% of the participating Grade 4 students were found to be in schools where instruction is affected by shortages of learning materials in both Science and Math” (Year One Report, p. 84).
- Private schools. Orbeta and Paqueo (2022) found private schools scoring higher in PISA 2018 and TIMSS 2019 (Year Two Report, pp. 332, 334); DepEd’s Grade 6 NAT file for SY 2023-2024, which covers 44 divisions in five regions, shows public schools ahead.
- Class suspensions. “TIMSS-based analyses” (Abrigo et al., 2024) find that each additional day of suspension linked to schools used as evacuation centers “results in a 12 to 14% of a standard deviation decline in Grade 4 mathematics and science scores” (Final Report, p. 187).
SEA-PLM 2019 and 2024: Grade 5 reading and mathematics
SEA-PLM tests Grade 5 learners; the Philippines took part in 2019 and 2024 (DM 082, s. 2025, para. 3). SEAMEO and UNICEF released the 2024 results; UNICEF Philippines reported the results for 5,070 Filipino learners on December 18, 2025.
In reading, “the proportion of learners in the lowest proficiency bands (Bands 1–2) declined slightly from 56% in 2019 to 52% in 2024, while the share reaching the highest band (Band 6 and above) rose from 10% to 14%” (Final Report, p. 148).
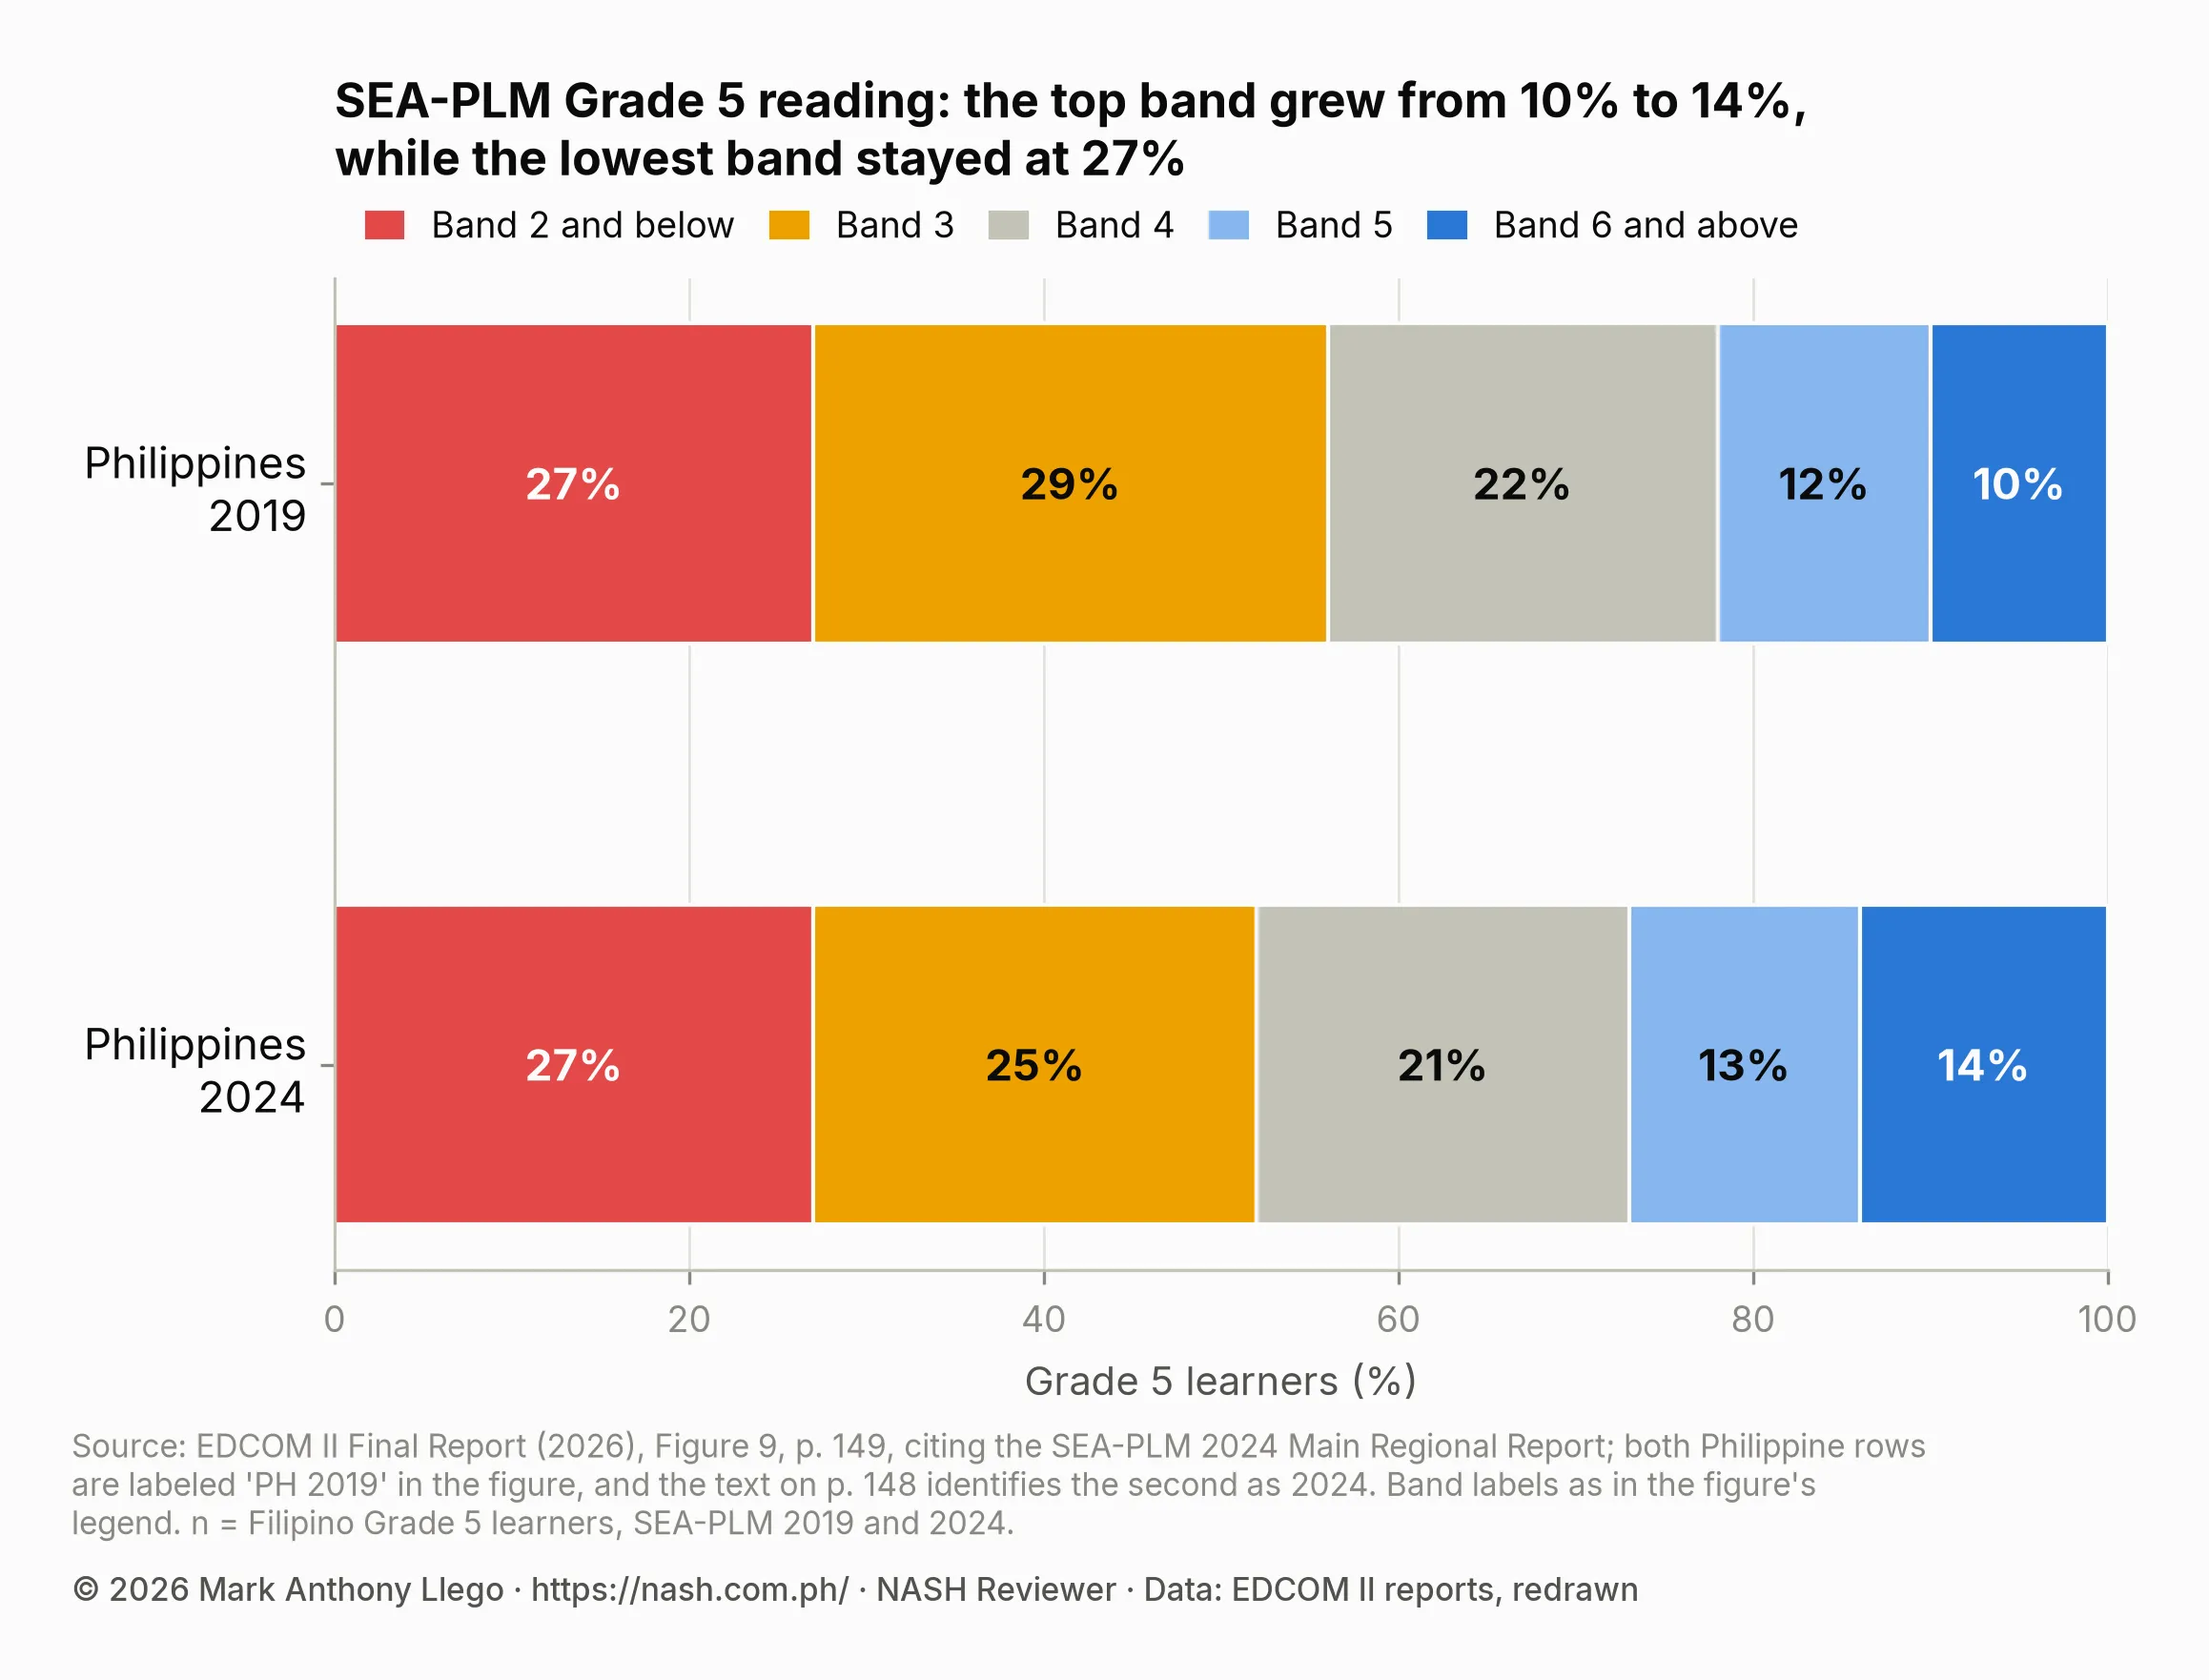
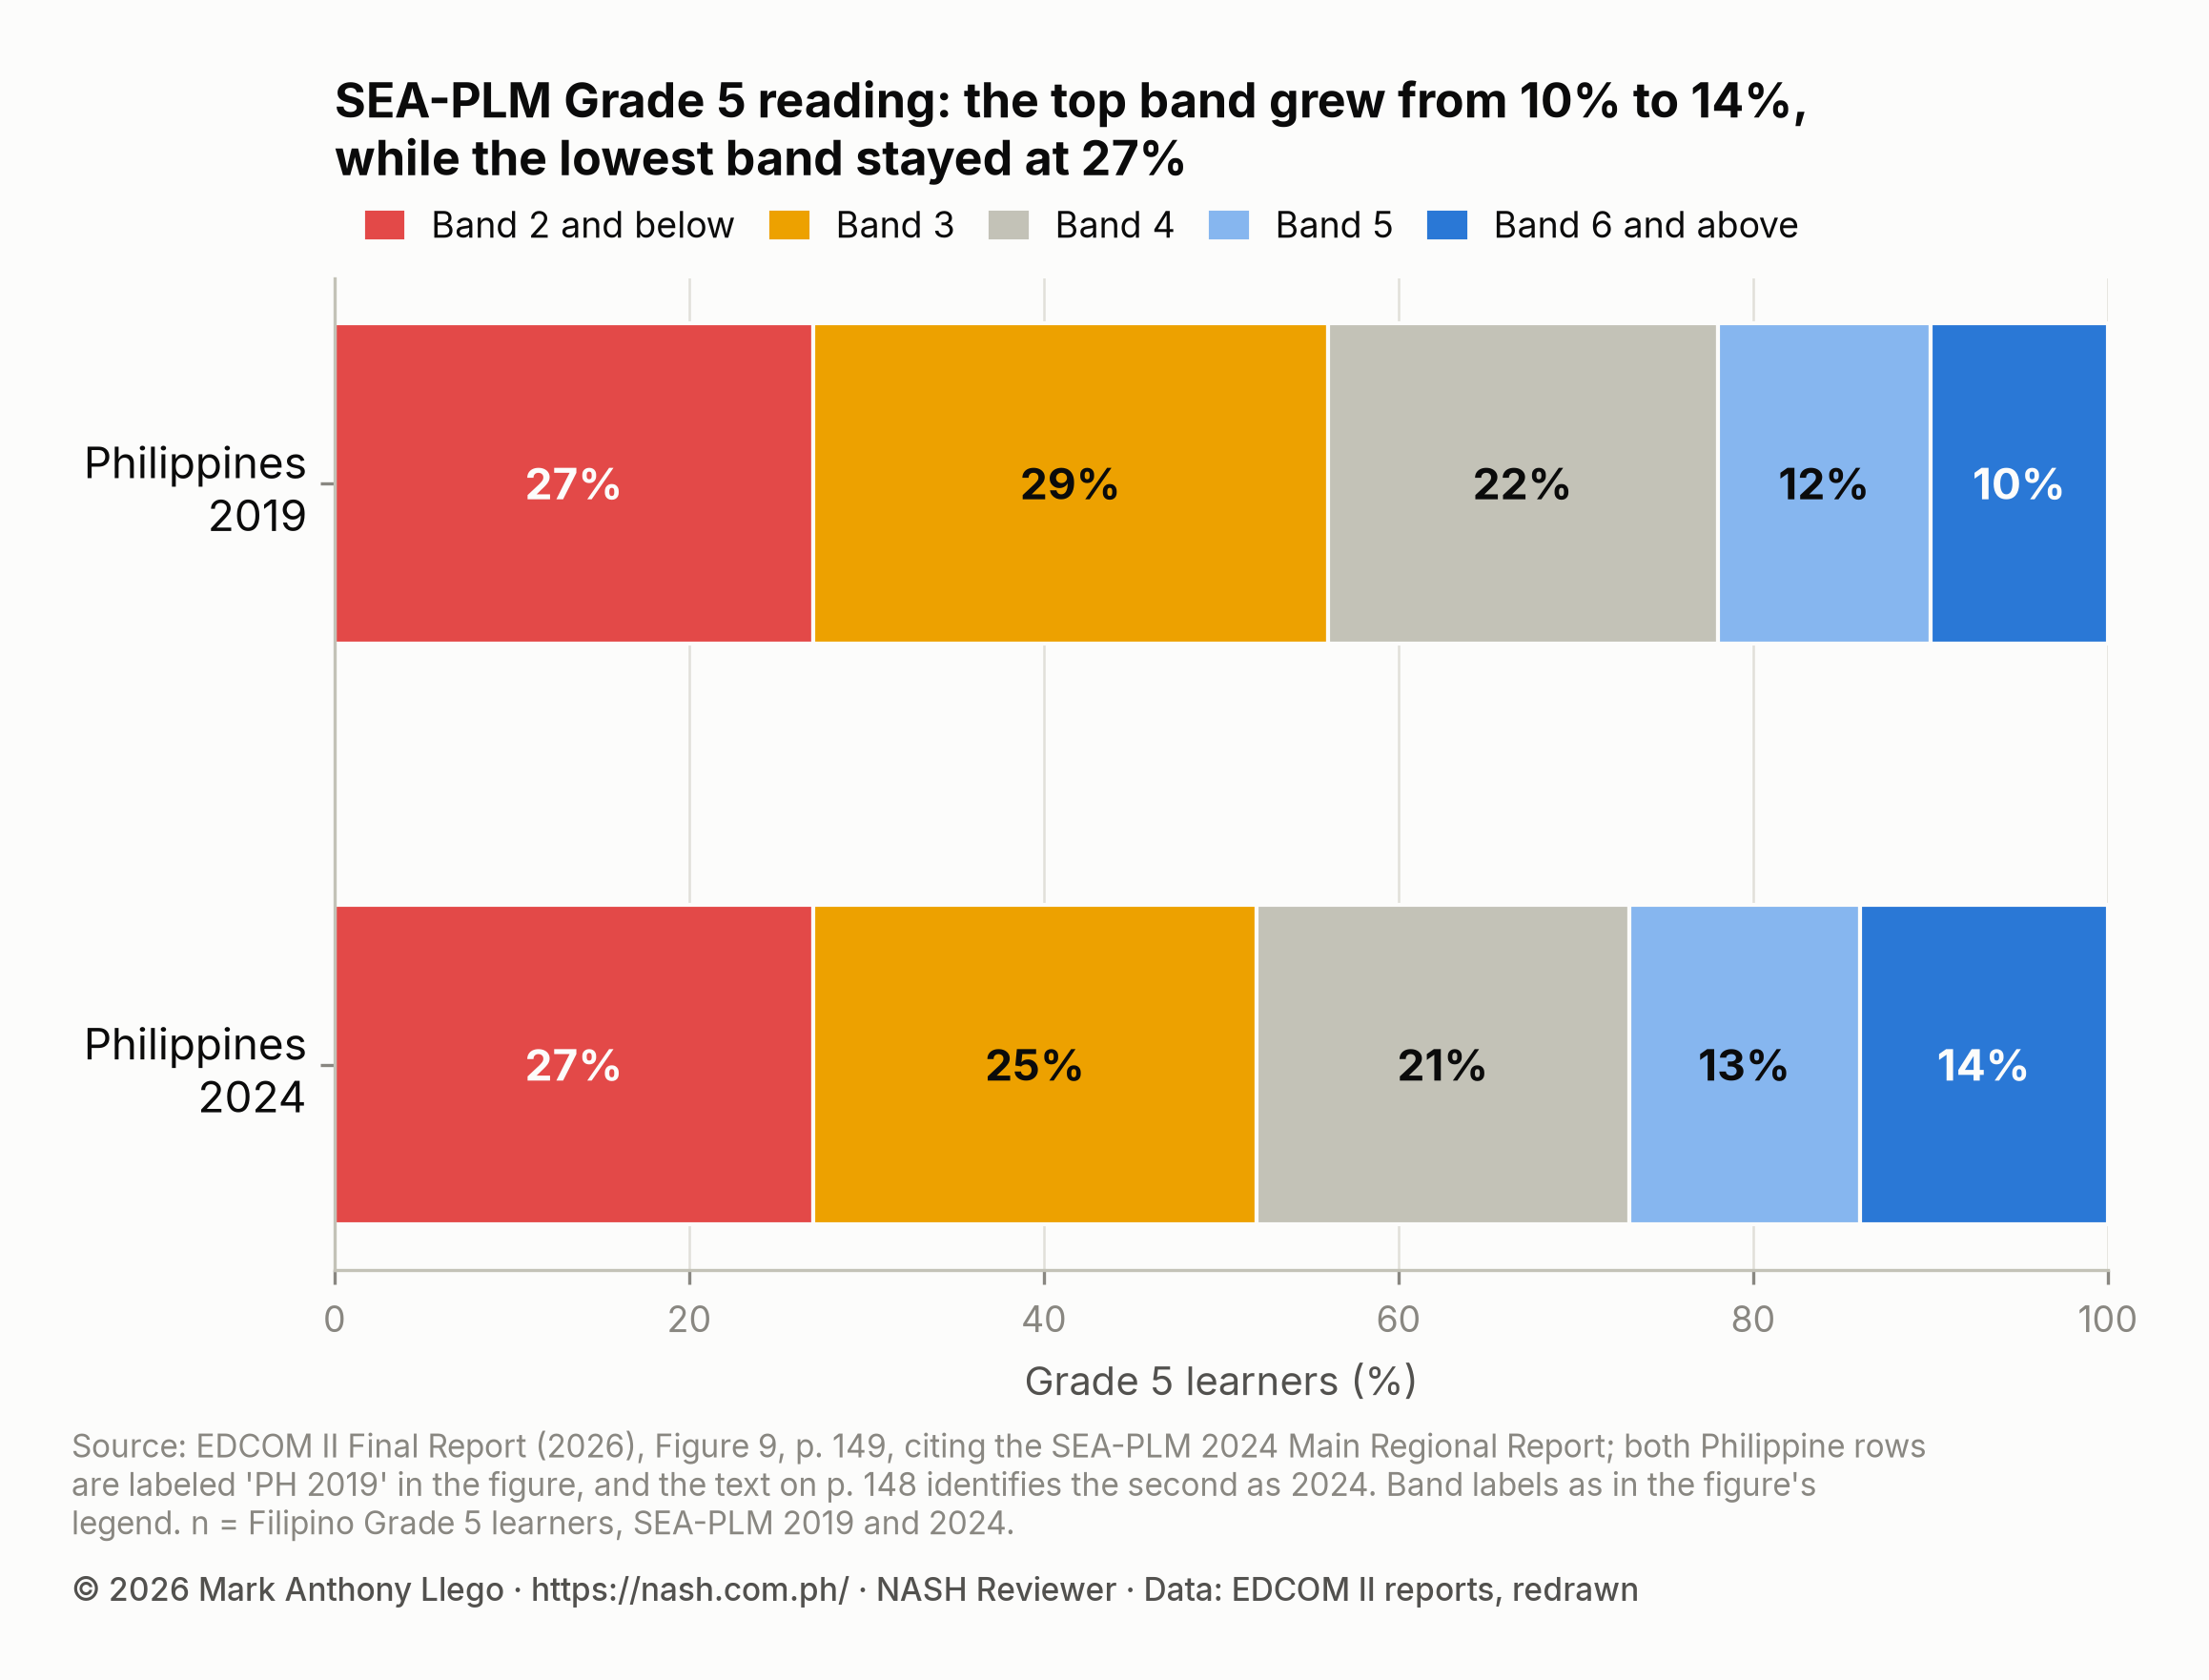
The report’s Figure 9 calls its first segment “Band 2 and below”; the text’s “Bands 1–2” (56%, 52%) equal the first two segments combined, and the report does not reconcile the labels. In mathematics, UNICEF reports learners at Band 6 and above rising from 17 in 100 to 26 in 100.
The Final Report links low scores to poverty, “the strongest predictor of low achievement”, worth “roughly two years of schooling” between the poorest and richest (p. 127), and to grade repetition, which 28% of Grade 5 learners had experienced (p. 150). These are associations, not proof of cause. The language of instruction and mental health and bullying posts cover the related findings.
NAT, ELLNA, CRLA and RMA results in the EDCOM II reports
The BEA runs the ELLNA at Grade 3, the NAT at Grades 6, 10 and 12, the National Career Assessment Examination (NCAE) and placement tests; schools also give diagnostic tools such as the Philippine Informal Reading Inventory (Phil-IRI), the Comprehensive Rapid Literacy Assessment (CRLA) and the Rapid Mathematics Assessment (RMA) (Final Report, pp. 138–139).
How DepEd defines “proficient”
Under DepEd Order No. 55, s. 2016, results are percentage scores and the proficiency level “is at least 75%” (Enclosure, pp. 7, 11). The Final Report prints the levels for the Grade 10 NAT (Table 2, p. 143):
| Level | Mean percentage score |
|---|---|
| Highly Proficient | 90–100 |
| Proficient | 75–89 |
| Nearly Proficient | 50–74 |
| Low Proficient | 25–49 |
| Not Proficient | 0–24 |
“Nearly proficient” is what DepEd considers meeting the “minimum skills” for the key stage (Final Report, p. 152). A PIDS study commissioned by EDCOM found that with formal standard-setting “more students could be considered proficient”, suggesting “the 75% passing mark may be too high to realistically define ‘proficiency’” (EDCOM 2, January 16, 2026).
Grade 3 to Grade 12 on the national tests
Each row is a different test, built on “different blueprints, constructs, and reporting scales” (Final Report, p. 142) and taken by different learners: four separate results, not one cohort’s decline.
| Test (year as labeled in the figure) | Not Proficient | Low Proficient | Nearly Proficient | Proficient | Highly Proficient |
|---|---|---|---|---|---|
| ELLNA, Grade 3 (2024) | 3% | 31% | 36% | 23% | 7% |
| NAT, Grade 6 (2025) | 6% | 38% | 26% | 17% | 2% |
| NAT, Grade 10 (2023) | 4% | 65% | 30% | 1% | not printed |
| NAT, Grade 12 (2023) | 5% | 69% | 25% | 1% | not printed |
Source: EDCOM II Final Report (2026), Figure 13, p. 153, citing DepEd-BEA as of September 2025.
The year labels follow no single rule: other figures date the ELLNA and Grade 12 NAT to SY 2023-2024 (pp. 152–153) and the Grade 10 NAT to SY 2022-2023 (p. 175). For Grade 6 (19.56% proficient, p. 152), EDCOM’s January 16, 2026 release says “the 2024 National Achievement Test”; DepEd gave that test in April 2024 and again in March–April 2025 (DM 016, s. 2024; DM 024, s. 2025). Division results for SY 2023-2024 are in the ELLNA Grade 3 and NAT Grade 6 reports.
The Grade 12 NAT of SY 2023-2024 was a census: of 1,611,809 learners, 6,518 (0.40%) were proficient and 74% “did not meet the minimum level of skills tested” (Final Report, pp. 153–154; DM 016, s. 2024, para. 1). The mass promotion post gives the full table and the start-of-year reading results by grade.
Learners in GIDA, Last Mile, IPEd and Madrasah schools
| School group | Not Proficient | Low Proficient | Nearly Proficient | Proficient | Learners proficient or highly proficient |
|---|---|---|---|---|---|
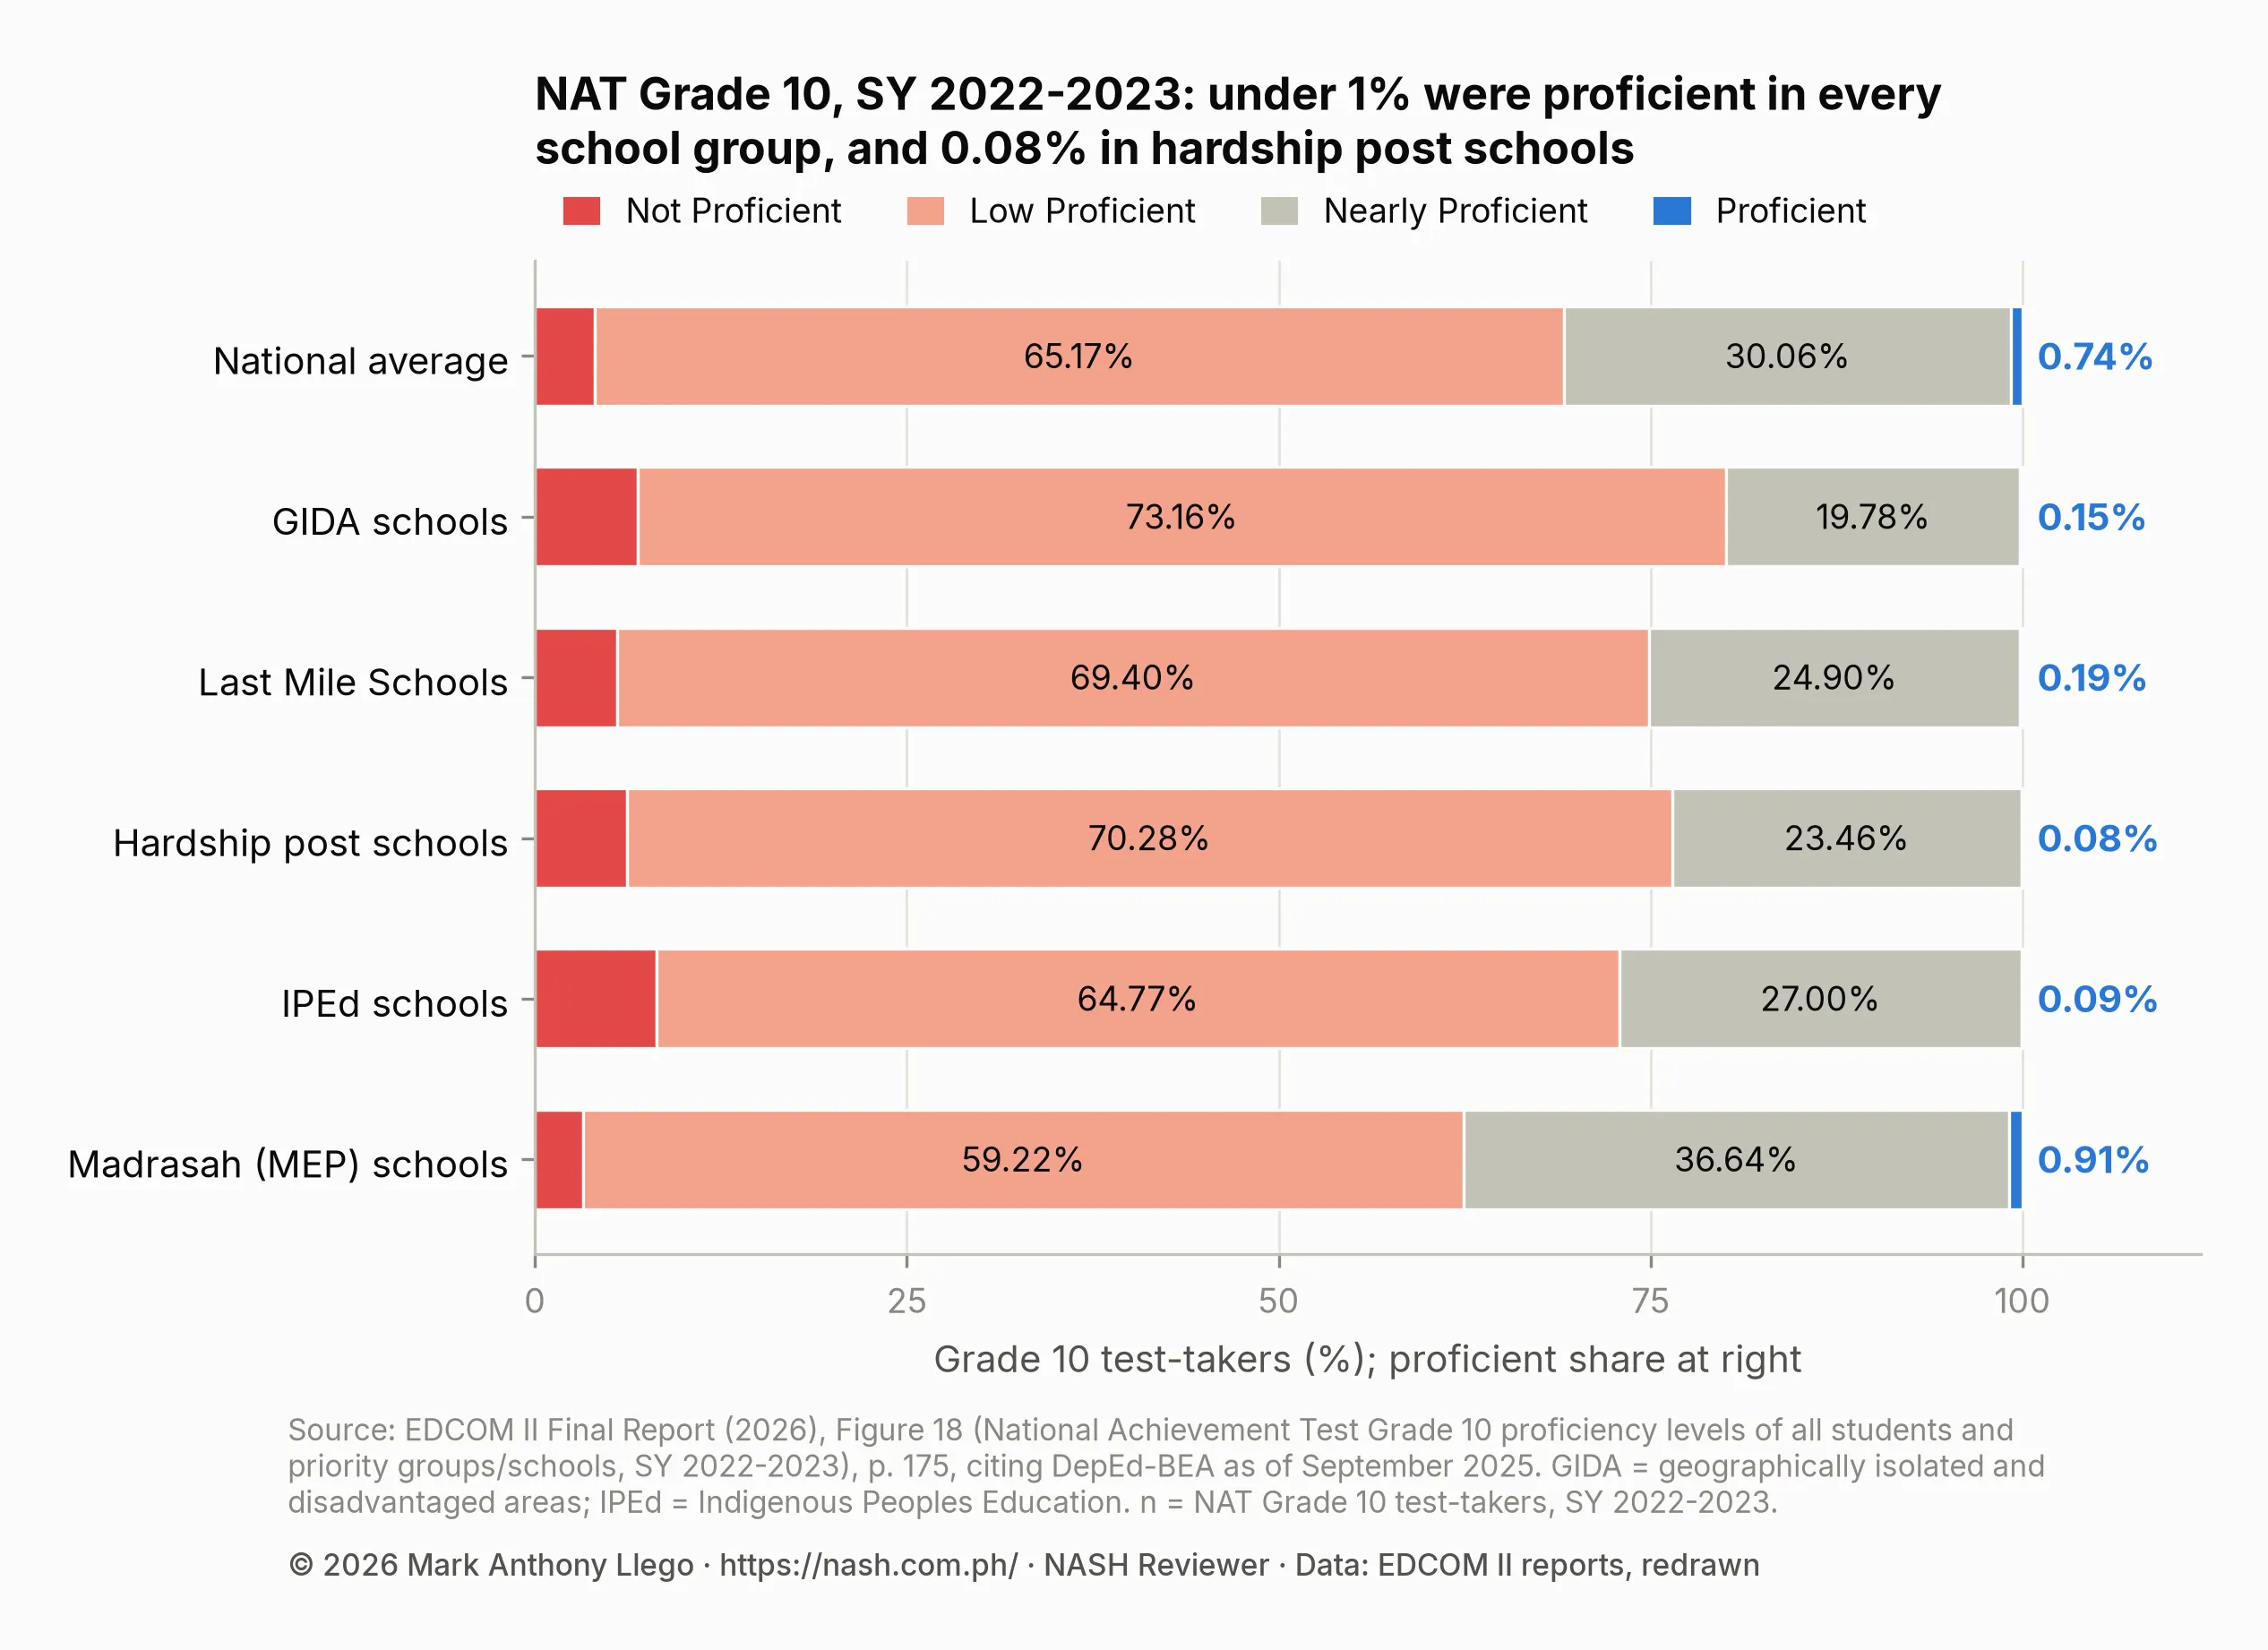
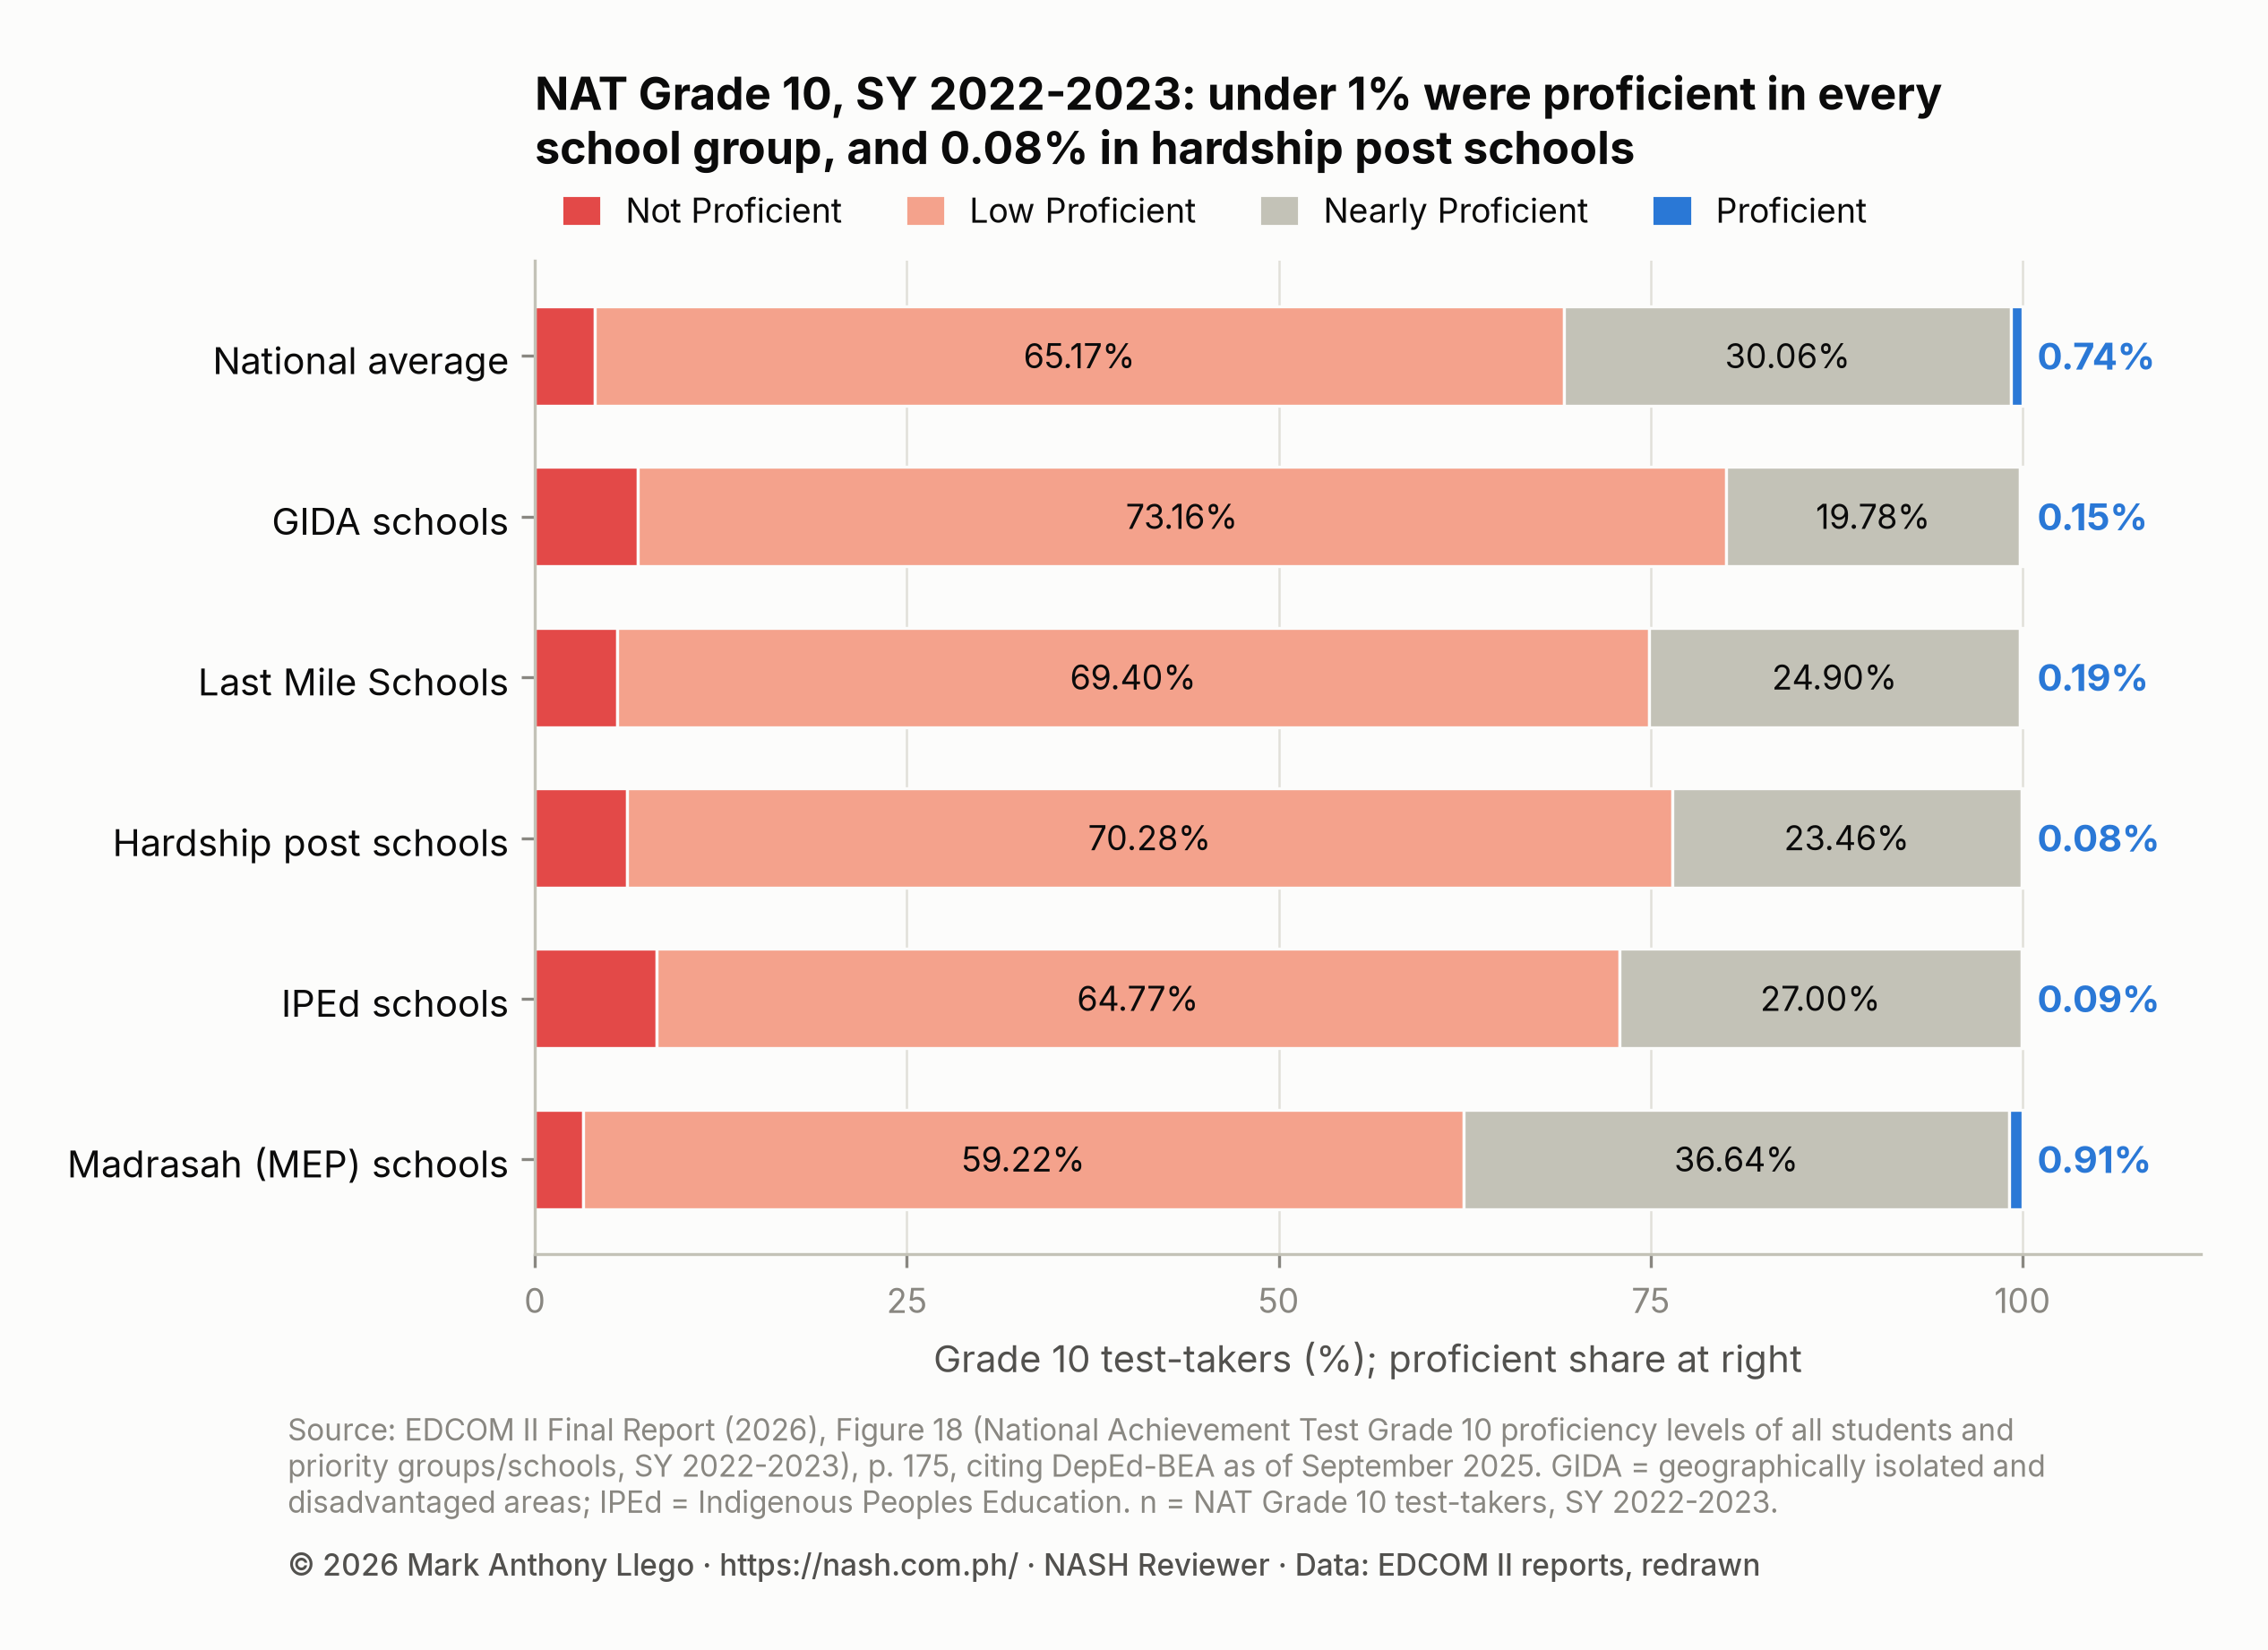
| National average | 4.02% | 65.17% | 30.06% | 0.74% | 2,847 |
| GIDA schools | 6.91% | 73.16% | 19.78% | 0.15% | 69 |
| Last Mile Schools | 5.52% | 69.40% | 24.90% | 0.19% | 42 |
| Hardship post schools | 6.18% | 70.28% | 23.46% | 0.08% | 18 |
| IPEd schools | 8.15% | 64.77% | 27.00% | 0.09% | 4 |
| Madrasah (MEP) schools | 3.23% | 59.22% | 36.64% | 0.91% | 133 |
Source: EDCOM II Final Report (2026), Figure 18, p. 175; counts from p. 174. GIDA: geographically isolated and disadvantaged areas; IPEd: Indigenous Peoples Education.
In Grade 12, 266 of 210,350 learners in the same groups (0.13%) were proficient (p. 154). Do not cite Figure 15, the Grade 12 breakdown, row by row: its group rows add to 104% to 112%, and its Nearly Proficient column repeats Figure 18’s Grade 10 values (pp. 155, 175).
Numbers that do not match
- On p. 152 (also p. 23), “non-proficient students” rise “from 30% in Grade 3 (ELLNA) to as high as 74% in Grade 12 (NAT)”, yet the same paragraph counts Grade 3’s “69.5% non-proficient (or those scoring 74 and below)”: two meanings of one term.
- EDCOM’s January 16, 2026 release gives 1.36% for Grade 10, against the Final Report’s 0.74% (pp. 152, 175), and its headline gives 0.47% for Grade 12, against 0.4% in its text.
What EDCOM II found wrong with the assessment system
Priority Area 6, “Measurement of Learning Outcomes”, runs through all three reports (Year One Report, pp. 94–114; Year Two Report, pp. 104–107; Final Report, pp. 138–147). The Final Report finds that national assessments “have become irregular, fragmented, and largely compliance-driven” (p. 138).
Too many tests
The Final Report counts “14 assessments currently implemented in the Philippines” against an OECD average of four (p. 139). Regional and division tests, discontinued in 2012 and allowed again in 2022, “lack standardized policy guidelines” (Year One Report, pp. 96, 98). The verdict: “over-assessed but under-informed” (Final Report, p. 140).
Results that arrive late
| Key stage tests, SY 2016-2017 to SY 2022-2023 | Number |
|---|---|
| Should have been administered | 27 |
| Administered late | 13 |
| Not administered (pandemic and procurement) | 11 |
Source: EDCOM II Year One Report (2024), p. 102; 24 of the 27 “encountered problems” (p. xxvii). The data and transparency post charts these counts.
Procurement problems “often cause delays in test administration” (Year One Report, p. 102), and results released after year-end tests “are no longer useful” (p. 106). The Final Report finds delays that “often stretch to two or three years”, though one testing coordinator received SY 2022-2023 results by December 2023: “at least it’s not years apart anymore” (p. 145). DepEd’s own rule for the ELLNA is release “not later than three months after the examination” (DO 55, s. 2016, Enclosure, p. 4).
Tests that are not linked to each other or to the curriculum
“There is no established correspondence or conceptual alignment” across DepEd’s diagnostic, national and international assessments, so results “cannot be meaningfully compared or used to validate each other” (Final Report, p. 140, citing the PIDS study of Santos et al., 2025). ELLNA item difficulty shifted between 2018 and 2022 without “consistent item anchoring or equating”, many 2022 Grade 6 NAT items “exhibit problematic parameters” (p. 141), and the ELLNA and three NATs “remain psychometrically distinct” (p. 142). The test process “does not allow for a thorough checking of the alignment between the implemented and tested curricula” (Year One Report, p. 106).
Results that do not reach the classroom
“Results often arrive late, are not linked to structured interventions, and rarely inform resource allocation or instructional adjustments” (Final Report, p. 140). The reports add four problems:
- Reporting. The BEA reports mean percentage scores only (Year One Report, p. 106).
- Equity. PIDS found “no systematic mechanism” in DepEd to disaggregate results for Last Mile, Indigenous Peoples, 4Ps and ALIVE learners (Final Report, p. 144).
- No response. After the 0.40% Grade 12 result, “no corresponding large-scale policy or program shift was initiated” (p. 144).
- Capacity. The BEA had 55 positions, 19 unfilled (Year One Report, p. 108), and its psychometric work rests on “a very small group of specialists” (Final Report, p. 142).
What EDCOM II recommends on national assessment
The Final Report’s executive summary lists four recommendations for this priority area (p. 26):
- “Establish an independent assessment body to strengthen governance and accountability.”
- “Rationalize the assessment system by streamlining key-stage tests and shifting to computer-based testing where feasible.”
- “Enhance institutional capacity of the Bureau of Education Assessment for assessment design, implementation, analysis, and use.”
- “Strengthen alignment between classroom, diagnostic, and system-level assessments, and accelerate the timely release and transparent dissemination of results to enable action by schools, LGUs, parents, and civil society.”
The chapter’s ten recommendations add the detail (pp. 145–147):
- Independence. Autonomy “comparable to national statistical offices or certification bodies”.
- Four key stage tests. At Grades 3, 6, 10 and 12, each tied to that key stage’s competencies.
- Grading. Reform the grading system, including “phasing out the transmutation table” of DO 8, s. 2015, which “converts very low raw scores into passing grades” (p. 146).
- One framework. Align “CRLA, RMA, Phil‑IRI, ELLNA, NAT, and participation in SEA‑PLM, TIMSS, and PISA”.
- Use in schools. Checkpoints during the year, teacher training, and “incorporating diagnostic results into school improvement planning”.
- Equity and speed. Equity reporting for Last Mile, IP Education, 4Ps and ALIVE learners, and results “potentially within the same school year”.
The stand-alone National Education Plan document adds two items not in the Final Report’s text: disaggregating CRLA and RMA results for groups such as Indigenous Peoples, multigrade schools and 4Ps beneficiaries (p. 31), and a National Education Coordination Authority that would “conduct independent assessments” (p. 102). Both documents ask Congress to create that authority to coordinate “assessments of learners and teachers” (Final Report, p. 499; plan document, p. 99).
Targets set on assessment results
The National Education Plan turns several tests into targets (Final Report, pp. 444–447, 457–458; National Education Plan document, pp. 27–30, 46); the National Education Plan guide gives the rest, including the Phil-IRI and equity targets.
| Outcome | Baseline | 2028 | 2031 | 2035 |
|---|---|---|---|---|
| CRLA: Key Stage 1 at grade level, end of year | 47.74%, SY 2024-2025 | 75% | 90% | 95% |
| RMA: Key Stage 1 numeracy at grade level, end of year | 40.49%, SY 2024-2025 | 65% | 75% | 85% |
| ELLNA: Grade 3 at least proficient | 30.52%, SY 2023-2024 | 50% | 70% | 90% |
| NAT Grade 12: at least proficient | 0.4%, 2024 | 30% | 60% | 90% |
Source: EDCOM II Final Report (2026), pp. 444–447, 457–458; same values in the plan document (pp. 27–30, 46).
The Final Report’s collective accomplishments on assessment (p. 67) are DepEd’s commitment “to review and rationalize its assessments policy”, school-level results through Project BUKAS, CRLA and Phil-IRI “fully implemented” to Grade 10, and a literacy survey revised “to include comprehension”. They include no independent body and no streamlined key stage tests.
What DepEd’s current issuances say about national assessment
DO 55, s. 2016 is still the framework
DepEd Order No. 55, s. 2016, the Policy Guidelines on the National Assessment of Student Learning for the K to 12 Basic Education Program, sets the purposes of national assessment, from public accountability to guiding “decisions on instructional practices” (para. 3). Its main rules:
- Who and when. The order places the ELLNA “at the end of Grade 3” (para. 4.a), but its enclosure schedules it for “Grade 4 learners three weeks after the first day of classes”, with schools sampled at random (Enclosure, p. 6).
- Stakes. “Exit Assessment results is not a requirement for graduation” (p. 8).
- Duration. The order “will remain in force and in effect until SY 2023-2024 … unless sooner repealed, amended, or rescinded” (para. 7).
DepEd still uses it: the memoranda for the ELLNA, the NCAE and the Grade 12 NAT of SY 2025-2026 all cite DO 55, and DM 014, s. 2026 applies its test-security sanctions (para. 9). As of October 2026, no issuance has replaced it. EDCOM notes that the BEA “relies almost exclusively on DO 55 s. 2016 as its reference framework” (Final Report, p. 141).
DepEd Order No. 29, s. 2017 covers the international tests, and its Section 5 says school improvement plans “should always be based on insights gained from studying data” (Enclosure, p. 3). DepEd Order No. 027, s. 2022 made the SY 2023-2024 tests “the new national assessment baseline”, to be “regularly administered every three years” (paras. 6, 8).
The SY 2026-2027 assessment calendar
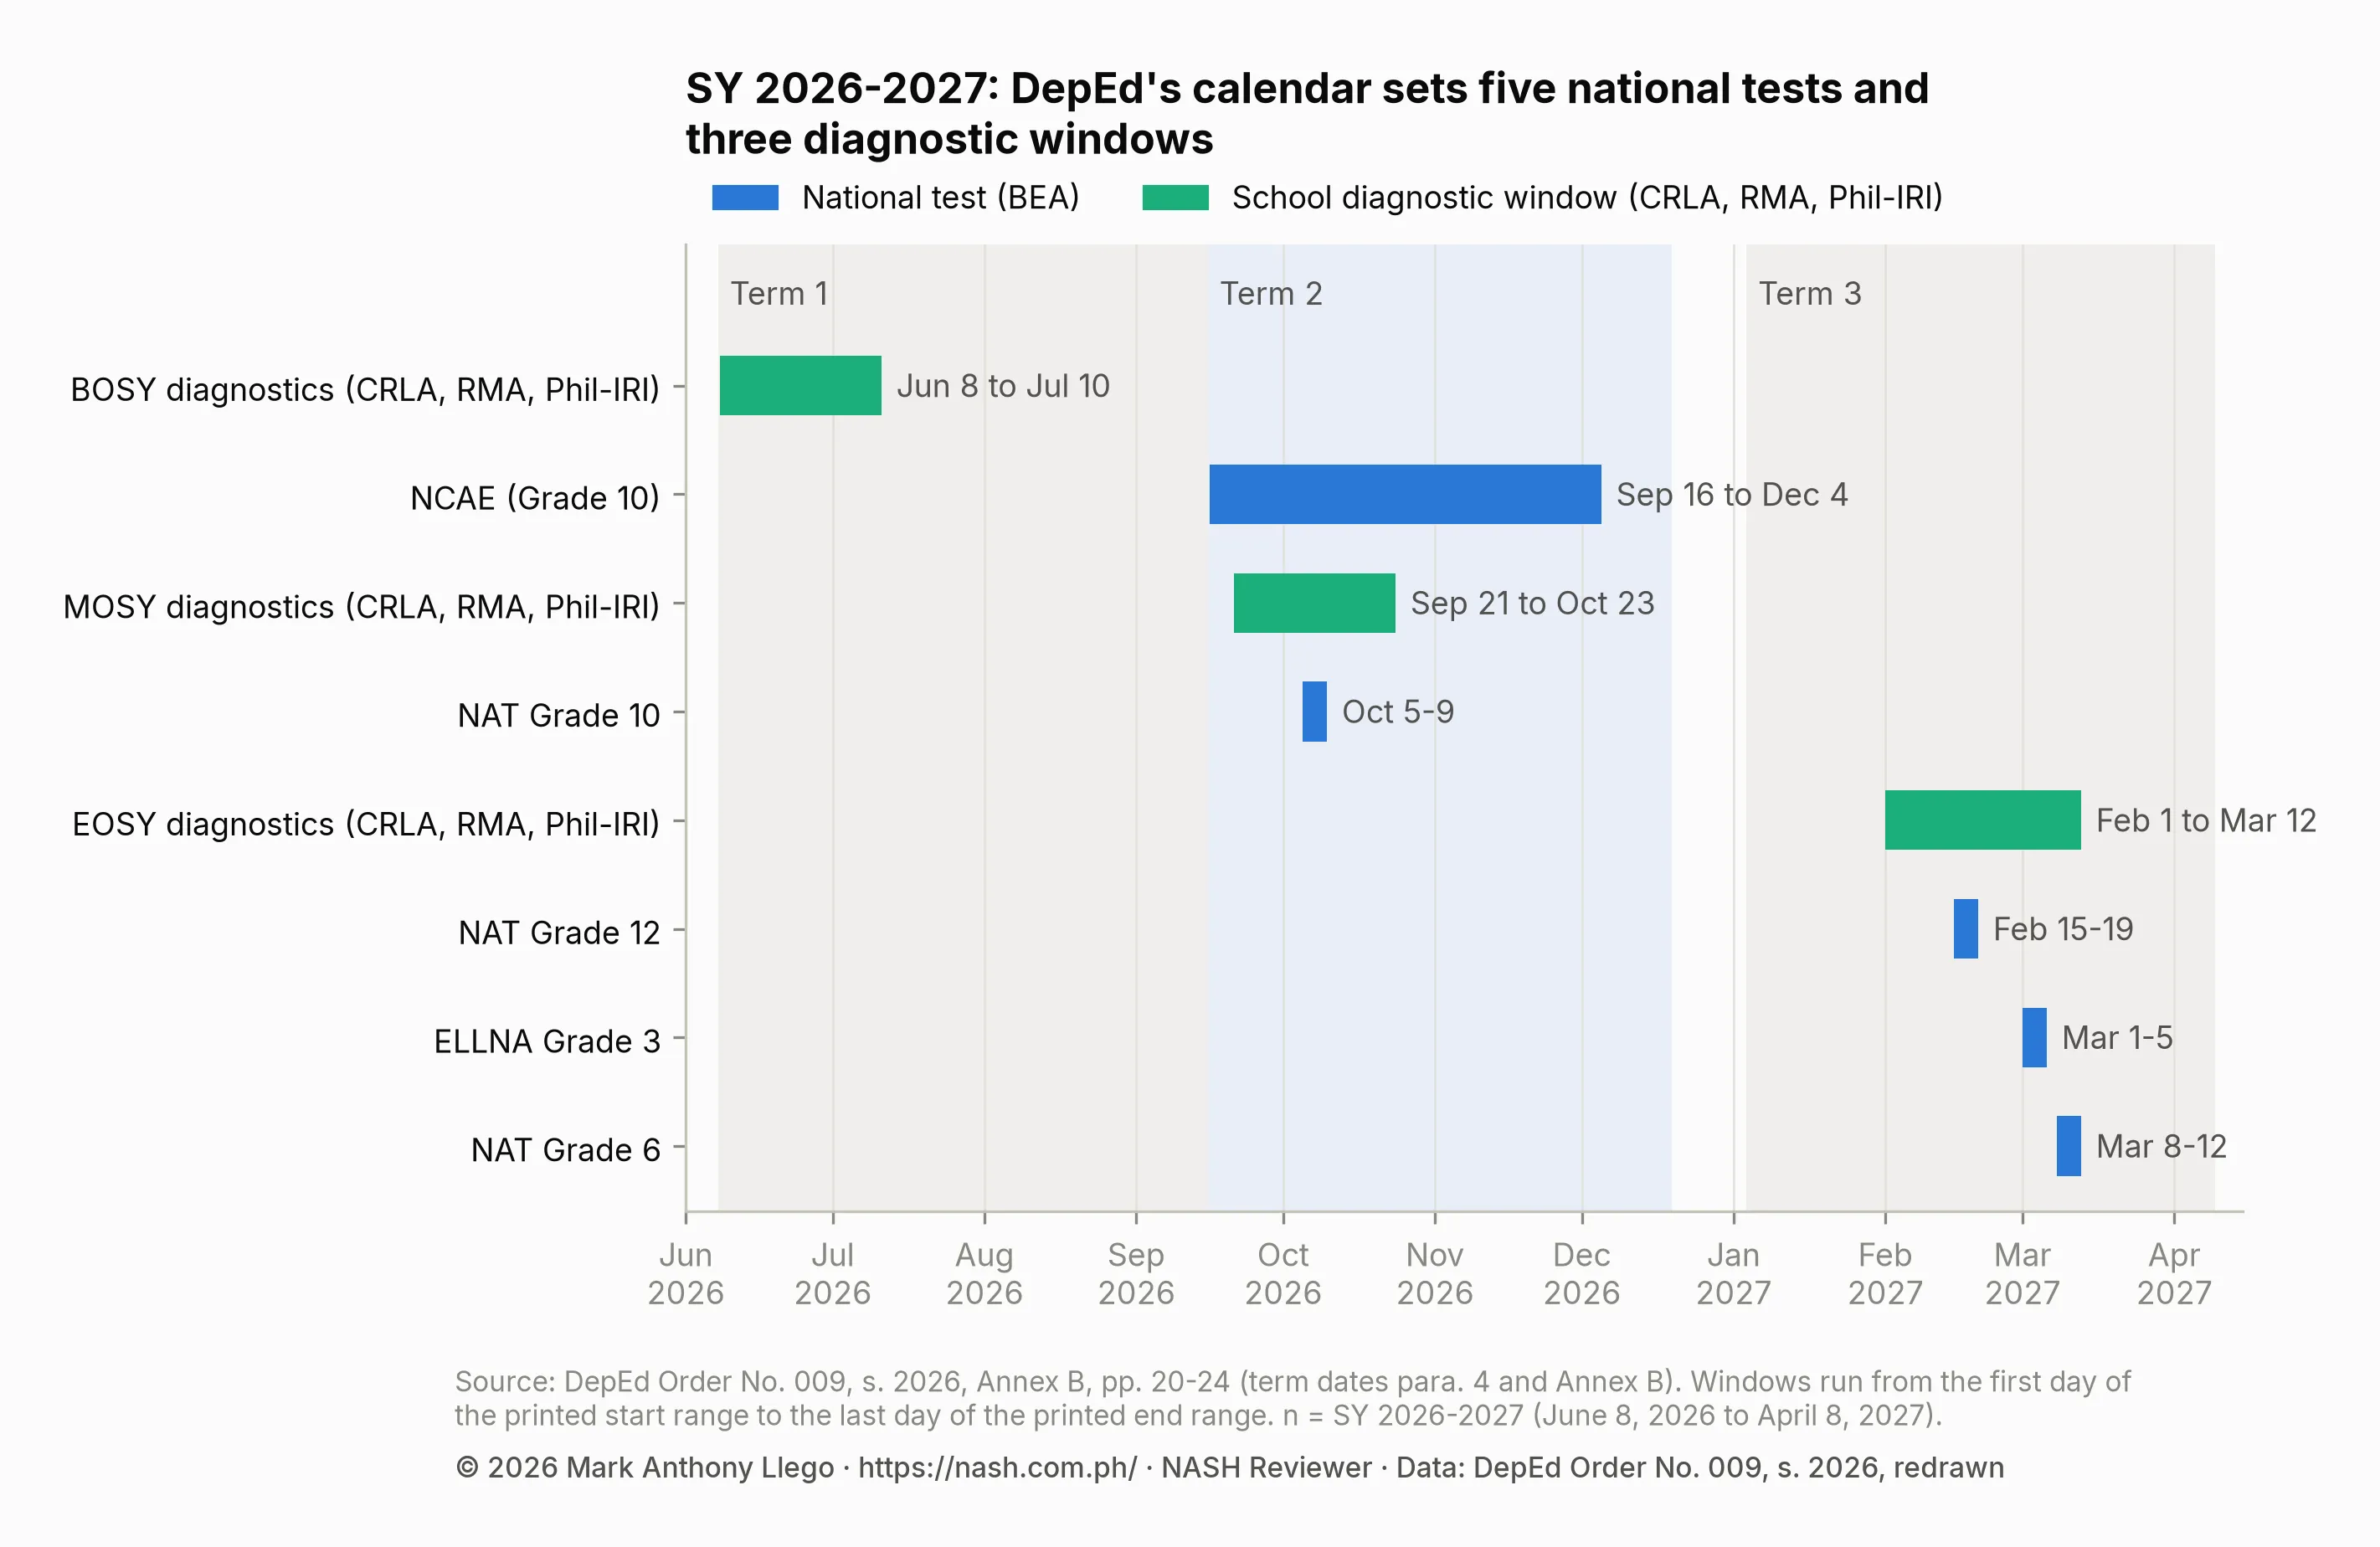
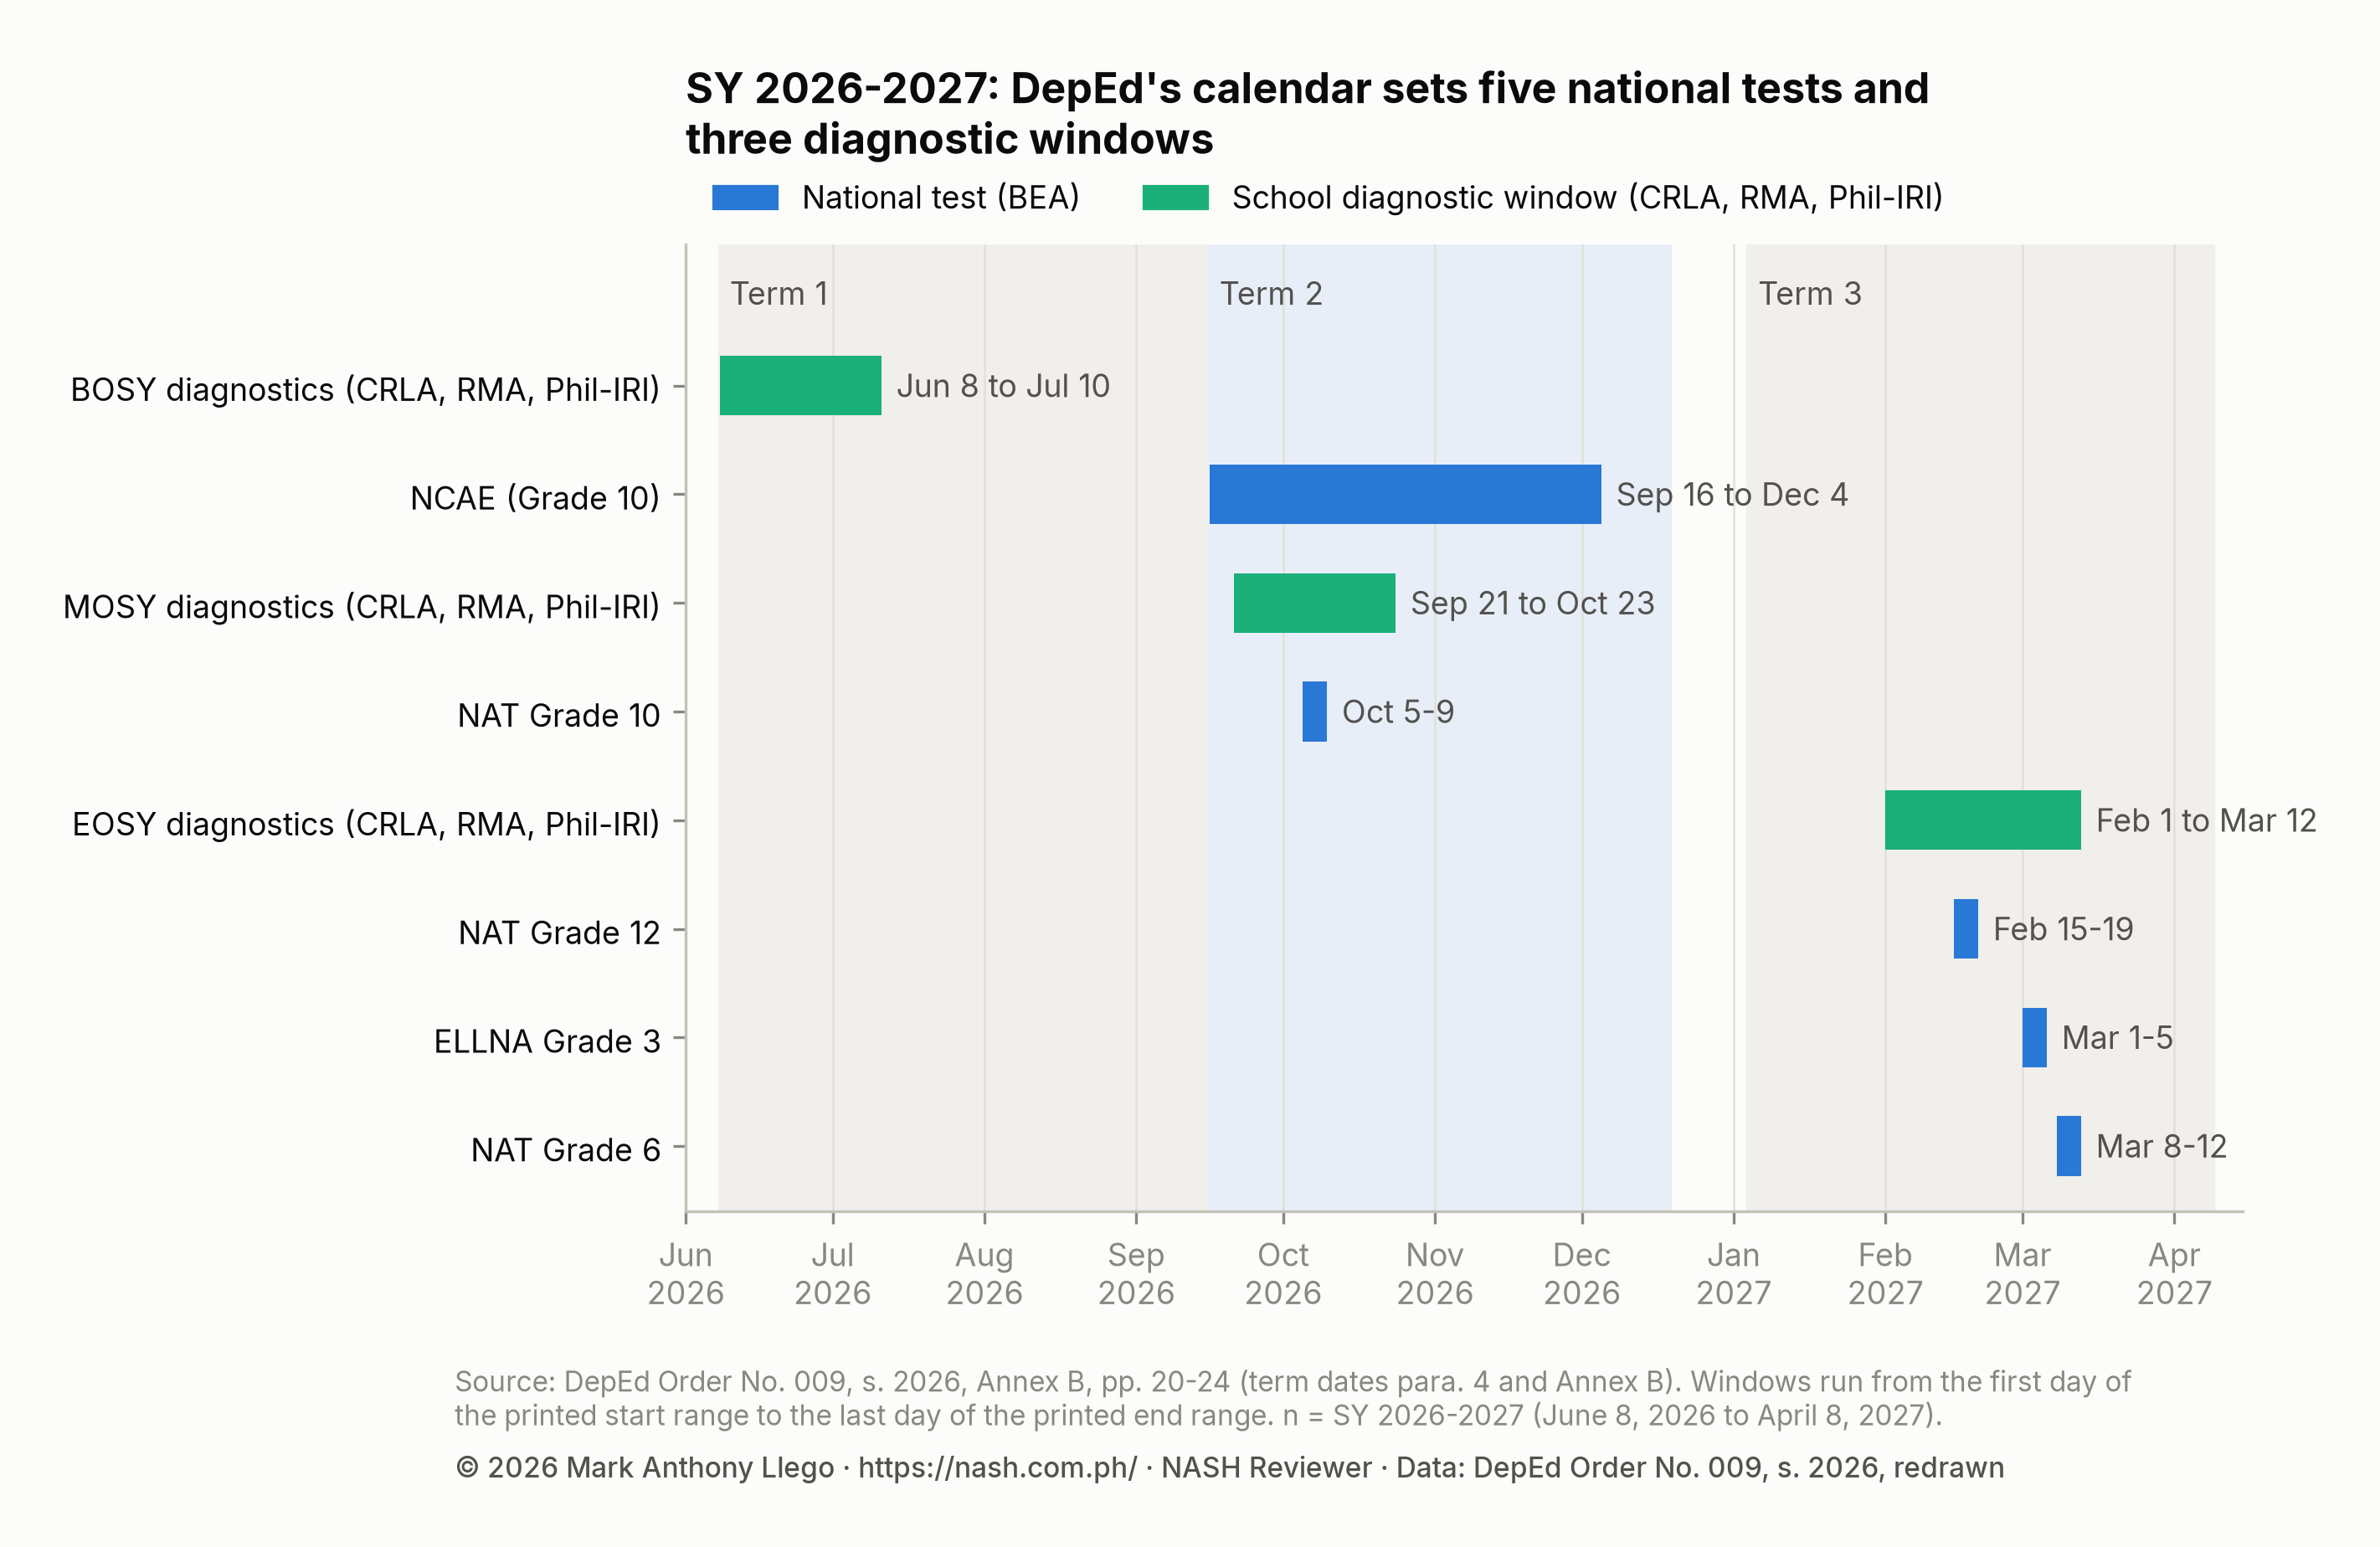
DepEd Order No. 009, s. 2026, which repealed DO 012, s. 2025, asks the BEA to schedule national tests with “minimal disruptions to non-participating learners” (para. 29), and its Annex B sets this year’s dates.
| Assessment | SY 2026-2027 dates |
|---|---|
| Beginning-of-year CRLA, RMA, Phil-IRI | Window opens June 8–11, closes July 10, 2026 |
| NCAE (Grade 10 only) | September 16 to December 4, 2026 |
| Middle-of-year CRLA, RMA, Phil-IRI | Opens September 21–25, closes October 19–23, 2026 |
| NAT Grade 10 | October 5–9, 2026 |
| End-of-year CRLA, RMA, Phil-IRI | Opens February 1–5, closes March 8–12, 2027 |
| NAT Grade 12 | February 15–19, 2027 |
| ELLNA Grade 3 | March 1–5, 2027 |
| NAT Grade 6 | March 8–12, 2027 |
What changed in 2025 and 2026
| Issuance | What it does |
|---|---|
| DO 015, s. 2026 | Repeals DO 8, s. 2015; an adjusted transmutation table in SY 2026-2027 (70 becomes 75), and none for Key Stages 2 to 4 from SY 2027-2028 (order para. 6; paras. 48, 50); a “non-high-stakes Grade 3 checkpoint assessment” (para. 66) |
| DM 087, s. 2025 | ELLNA, November 3–7, 2025, for “all Grade 4 public elementary learners”, on paper, in English and Filipino (paras. 1, 3–4) |
| DM 108, s. 2025 | Computer-based NCAE for all Grade 10 learners, December 2025 to January 2026 (paras. 1, 3) |
| DM 014, s. 2026 | Computer-based Grade 12 NAT, March 9–18, 2026, for learners in sampled public and private schools (paras. 1, 3) |
| DM 016, s. 2026 | New literacy and numeracy assessments for Grade 11 in Quarter 4 of SY 2025-2026, citing “a critical gap in systematic data” on Key Stage 4 (paras. 2–3) |
| DO 017, s. 2026 | The BEA “shall align” its tests with the Strengthened SHS curriculum (para. 27.e) |
None of these issuances cites EDCOM. The grading change matches its recommendation (the DO 015 guide explains it). The computer-based tests are in line with it too (Final Report, p. 146), though DepEd had given the Grade 12 NAT by computer to a sample in June 2022 (DO 027, s. 2022, para. 1). The Grade 11 assessment matches EDCOM’s call for literacy tests “including Grades 11 and 12” (p. 155); it also adds a test to a system EDCOM calls “overcrowded” (p. 139). The ELLNA has also moved: Grade 3 in April 2024, Grade 4 in November 2025, and Grade 3 in March 2027.
What this means for school heads
Schools give the tests and decide whether anyone uses the results. Five practices follow.
1. Know which tests your school gives, and when
Put the Annex B dates in the school calendar, confirm which classes are sampled, and keep untested classes teaching (DO 009, s. 2026, para. 29). For computer-based tests, check equipment early; DM 014, s. 2026 let schools borrow units from partner schools (para. 6).
2. Read each result on its own scale
A Grade 6 class mostly at Nearly Proficient has met DepEd’s minimum skills (Final Report, p. 152). Do not compare a CRLA share with an ELLNA or NAT result (p. 140), or read one NAT against the next as a trend; the NAT “is not designed to compare learner performance over time and across key stages” (January 16, 2026 release). See the analysis of the same schools on the three tests and the guide to reading a school’s CRLA results.
3. Act on the diagnostics within the school year
National results are system snapshots; the CRLA, RMA and Phil-IRI are what a school can act on this year. DepEd Order No. 018, s. 2025 uses them to place learners in the Academic Recovery and Accessible Learning (ARAL) Program (paras. 35–36), so build the ARAL list as soon as the beginning-of-year window closes. Review later results in Learning Action Cell sessions, compare your school with the CRLA results for SY 2025-2026, and carry the findings into the School Improvement Plan, as DO 29, s. 2017 asks. The Domain 3 guide covers the indicators.
4. Watch the learners the system does not separate
The Final Report found no systematic mechanism in DepEd to report results by equity group (p. 144), but a school can sort its own CRLA and RMA results by the groups the plan document lists, such as Indigenous Peoples, 4Ps beneficiaries and feeding program recipients (p. 31), and by grade repetition, a strong predictor of low SEA-PLM scores (Final Report, p. 150).
5. Add no tests you do not need, and report problems
Teachers told EDCOM that test tasks “consume significant instructional time yet rarely inform their teaching strategies” (Final Report, p. 144), so ask what decision a new school-wide test would change before adding one. Report test-administration problems to the division instead of settling them quietly (Year One Report, p. 108), and share results plainly with teachers, parents and the Local School Board (Final Report, p. 147). The Domain 1, Domain 2 and Domain 5 guides cover the related indicators.
How the NASH may test this
Under DepEd Memorandum No. 069, s. 2025, the NASH covers “conceptual and situational critical thinking questions” aligned with the PPSSH, “using the SOLO (Structure of the Observed Learning Outcome) taxonomy as an underpinning framework” (para. 3). The two items below are original practice items, scored 3 (Relational), 2 (Multistructural), 1 (Unistructural) or 0 (Prestructural).
Question 1
Indicator 3.5.1, Learning assessment. Career Stage 1, Situational, Moderate.
At a learning action cell session, teachers review three results: 62% of Grade 3 learners read at grade level on the end-of-year CRLA, the largest Grade 3 group on the ELLNA is Low Proficient, and most Grade 6 learners are Nearly Proficient on the NAT. One teacher says the CRLA proves the reading problem is solved; another says the NAT is meaningless because its results came late. What should the school head do?
- A. Report the CRLA result as the school’s reading outcome, since it is the most recent and most favorable.
- B. Treat each result on its own scale and purpose: use the CRLA and Phil-IRI learner lists to plan reading support now, and the ELLNA and NAT skill profiles to adjust instruction in the grades below.
- C. Average the three results into one school literacy score for teachers to improve.
- D. Use the CRLA lists to plan reading support, and set aside the ELLNA and NAT because their results arrive late.
Answer and explanation
Best answer: B. Points: A = 0, B = 3, C = 1, D = 2.
- A (0 points, Prestructural). Picking the most favorable number misreads all three tests.
- B (3 points, Relational). It ties each tool to its purpose and does not compare across scales.
- C (1 point, Unistructural). It combines tests that “cannot be meaningfully compared” (Final Report, p. 140).
- D (2 points, Multistructural). Acting on the CRLA is right, but it discards what the system tests show.
Why. EDCOM II found the tests “psychometrically distinct” and their results too often unused (Final Report, pp. 140, 142); DO 29, s. 2017 asks for plans “based on insights gained from studying data”.
Indicator 3.5.1: Demonstrate knowledge and understanding of learning assessment tools, strategies and utilization of results consistent with curriculum requirements.
Sources: EDCOM II Final Report (2026), pp. 140–142, 152; DepEd Order No. 29, s. 2017, Section 5.
Question 2
Indicator 1.4.1, Research and innovation. Career Stage 1, Conceptual, Moderate.
After the PISA 2025 results, a teacher says the country “has fixed its learning crisis” and proposes ending reading remediation for Grades 7 and 8. Which response best uses the evidence?
- A. Agree, since PISA results apply to every school.
- B. Explain that PISA 2025 shows national gains but most Filipino 15-year-olds still below Level 2, and decide on remediation from the school’s own Phil-IRI results for Grades 7 and 8.
- C. Reject the proposal because international tests in English do not apply to Filipino learners.
- D. Explain the same about PISA 2025, and keep remediation for every Grade 7 and 8 learner without checking the school’s data.
Answer and explanation
Best answer: B. Points: A = 0, B = 3, C = 1, D = 2.
- A (0 points, Prestructural). A national sample cannot decide a school’s program, and the claim misstates the results.
- B (3 points, Relational). It reads PISA accurately and decides from the school’s own evidence.
- C (1 point, Unistructural). Language of testing is a real issue (Year One Report, p. 101), but it does not make the results irrelevant.
- D (2 points, Multistructural). It reads PISA correctly but ignores the school’s evidence.
Why. In PISA 2025, 21% of Filipino students reached Level 2 in mathematics, 31% in reading and 32% in science (EDCOM release, September 9, 2026). PISA describes the system; the Phil-IRI describes the school’s learners.
Indicator 1.4.1: Identify relevant research findings from reliable sources in facilitating data-driven and evidence-based innovations to improve school performance.
Sources: EDCOM 2 news release, September 9, 2026; EDCOM II Year One Report (2024), p. 101; DepEd Order No. 018, s. 2025, para. 35.
Nothing in this guide reproduces or predicts examination content.
Frequently asked questions
How did the Philippines do in PISA 2022?
In PISA 2022, 84% of Filipino 15-year-olds scored below Level 2 in mathematics, 76% in reading and 77% in science, against OECD averages of 31%, 26% and 24% (EDCOM II Year Two Report, p. 333). EDCOM calls the result “similar to 2018” (Year One Report, p. 81).
Did the Philippines improve in PISA 2025?
Yes. EDCOM reports scores of 373 in science, 371 in mathematics and 367 in reading, up 17, 16 and 20 points from 2022, with 32%, 21% and 31% at Level 2 or above (release of September 9, 2026). The three EDCOM II reports came out before these results.
What is SEA-PLM, and how did Filipino Grade 5 learners do?
SEA-PLM is a Southeast Asian assessment of Grade 5 learners, taken by the Philippines in 2019 and 2024. In reading, the top band rose from 10% to 14% while the lowest band stayed at 27% (EDCOM II Final Report, pp. 148–149).
What does “nearly proficient” mean on the NAT?
It is a mean percentage score of 50 to 74 (EDCOM II Final Report, Table 2, p. 143), which DepEd treats as meeting the “minimum skills” for the key stage (p. 152). Proficient starts at 75% (DepEd Order No. 55, s. 2016); a PIDS study cited by EDCOM suggests that mark may be too high.
Is the NAT now computer-based?
The Grade 12 NAT of SY 2025-2026 was given by computer on March 9–18, 2026, in sampled schools (DepEd Memorandum No. 014, s. 2026), as was the NCAE (DM 108, s. 2025); DepEd had already given the Grade 12 NAT by computer to a sample in June 2022 (DO 027, s. 2022, para. 1). The ELLNA of SY 2025-2026 stayed on paper (DM 087, s. 2025).
Download the data
- assessments-pisa-2022-below-level-2.csv: PISA 2022 shares below Level 2, Philippines and OECD average, and OECD shares at Level 5 or above (Year Two Report, Figure 6, p. 333; Final Report, p. 641).
- assessments-pisa-level-2-2022-2025.csv: shares at Level 2 or above in PISA 2022 and 2025, with 2025 mean scores and changes (EDCOM 2 release, September 9, 2026).
- assessments-sea-plm-reading-bands.csv: Filipino Grade 5 learners by SEA-PLM reading band, 2019 and 2024, with notes on the figure’s labels (Final Report, Figure 9, p. 149; p. 148).
- assessments-nat-grade-10-groups.csv: NAT Grade 10 proficiency levels in SY 2022-2023 by school group, with counts of proficient learners (Final Report, Figure 18, p. 175; p. 174).
- assessments-calendar-sy-2026-2027.csv: dates of national tests and diagnostic windows in SY 2026-2027, with the printed entries (DepEd Order No. 009, s. 2026, Annex B, pp. 20–24).
The CSVs and charts may be reused only with written permission: email support@nash.com.ph. The numbers themselves come from the EDCOM II reports, which you can cite directly.
How to cite this post
Llego, M. A. (2026, October 30). PISA, TIMSS, SEA-PLM and the NAT: What EDCOM II Found. NASH Reviewer. https://nash.com.ph/blog/pisa-timss-sea-plm-nat-edcom-ii
The EDCOM II reports:
- Second Congressional Commission on Education. (2024). Miseducation: The failed system of Philippine education (EDCOM II Year One Report). https://edcom2.gov.ph/media/2024/02/EDCOM-II-Year-One-Report-PDF-022924.pdf
- Second Congressional Commission on Education. (2025). Fixing the foundations: A matter of national survival (EDCOM II Year Two Report). https://edcom2.gov.ph/media/2025/01/EDCOM-2-Year-2-Report-Fixing-the-Foundations-2025.pdf
- Second Congressional Commission on Education. (2026). Turning point: A decade of necessary reform (2026–2035) (EDCOM II Final Report). https://edcom2.gov.ph/media/2026/01/EDCOM-II-Y03-for-web-012626_final.pdf
- Second Congressional Commission on Education. (2026). The National Education Plan (2026–2035) [Part of Turning point: A decade of necessary reform, EDCOM II Final Report]. https://edcom2.gov.ph/media/2026/01/EDCOM-II_Y03_National-Education-Plan.pdf
Sources
- EDCOM II, Final Report (2026), pp. 23, 26, 67, 127, 138–155, 174–175, 187, 444–447, 457–458, 499, 640–641.
- EDCOM II, The National Education Plan (2026–2035) (2026), pp. 27–31, 46, 99, 102.
- EDCOM II, Year Two Report (2025), pp. 104–107, 332–334.
- EDCOM II, Year One Report (2024), pp. xxvii, xlix, 81, 84, 94–114 (cited: 96, 98, 101–102, 106, 108), 275.
- EDCOM 2, Student proficiency rates plunge from 30% in Grade 3 to 0.47% in Grade 12, January 16, 2026.
- EDCOM 2, Statement from EDCOM 2 on the release of the PISA 2025 results, September 8, 2026.
- EDCOM 2, PISA gains celebrated; continued reforms urged, September 9, 2026.
- OECD, PISA 2022 Results (Volumes I and II), Country Notes: Philippines, 2023.
- OECD, PISA 2025 Results (Volume I), Country Notes: Philippines, 2026.
- UNICEF Philippines, Latest SEA-PLM 2024 reveals more learners in the Philippines reaching higher proficiency in math and reading, but disparities remain, December 18, 2025.
- DepEd Order No. 55, s. 2016, Policy Guidelines on the National Assessment of Student Learning for the K to 12 Basic Education Program, paras. 3, 4.a, 7; Enclosure, pp. 4, 6–8, 11.
- DepEd Order No. 29, s. 2017, Policy Guidelines on System Assessment in the K to 12 Basic Education Program, Enclosure, p. 3 (Sections 4–5).
- DepEd Order No. 027, s. 2022, Conduct of Rapid Assessment in School Year 2021-2022 for Learning Recovery as well as in Preparation for the 2024 Baseline System Assessment, paras. 1, 6, 8.
- DepEd Order No. 018, s. 2025, Implementing Guidelines of the Academic Recovery and Accessible Learning Program, paras. 35–36.
- DepEd Order No. 009, s. 2026, Guidelines on the Implementation of the Three-Term School Calendar in Basic Education, para. 29 and Annex B.
- DepEd Order No. 015, s. 2026, Revised Guidelines on Classroom Assessment, Grading System, and Awards and Recognition for the K to 12 Basic Education Program, order para. 6; Enclosure, paras. 48, 50, 66.
- DepEd Order No. 017, s. 2026, Strengthened Senior High School Curriculum, para. 27.e.
- DepEd Memorandum No. 016, s. 2024, Administration of the ELLNA, NAT for Grade 6 and NAT for Grade 12 for School Year 2023-2024, para. 1.
- DepEd Memorandum No. 019, s. 2025, Administration of the Programme for International Student Assessment 2025 Main Survey, paras. 2–3.
- DepEd Memorandum No. 024, s. 2025, Administration of the National Achievement Test for Grade 6 for School Year 2024–2025, para. 1.
- DepEd Memorandum No. 082, s. 2025, Creation of the International Large-Scale Assessment National Steering Committee, para. 3.
- DepEd Memorandum No. 087, s. 2025, Administration of the Early Language, Literacy, and Numeracy Assessment for School Year 2025-2026, paras. 1, 3–4.
- DepEd Memorandum No. 108, s. 2025, Administration of the Computer-Based National Career Assessment Examination for School Year 2025-2026, paras. 1, 3.
- DepEd Memorandum No. 014, s. 2026, Administration of the Computer-Based National Achievement Test for Grade 12 for School Year 2025-2026, paras. 1, 3, 6, 9.
- DepEd Memorandum No. 016, s. 2026, Administration of the Senior High School Literacy and Numeracy Assessments for Grade 11 Learners in School Year 2025-2026, paras. 2–3.
- DepEd Memorandum No. 069, s. 2025, Administration of the National Assessment for School Heads for Fiscal Year 2025, para. 3.
- DepEd Order No. 024, s. 2020, National Adoption and Implementation of the Philippine Professional Standards for School Heads (indicators 1.4.1 and 3.5.1).
The EDCOM II series
The reports:
- What EDCOM II Achieved, 2023-2025: Laws, Budgets, Policies
- EDCOM II’s Three Reports: How the Key Numbers Changed
- EDCOM II Final Report: Guide for Aspiring School Heads
- National Education Plan 2026-2035: Guide for School Heads
- 100 Years After the Monroe Report: Education Commissions
- Is the Philippines Spending Enough on Education?
- Education Data, Transparency and Research: EDCOM II
Learners and learning:
- Mass Promotion and Lost Instructional Time: EDCOM II
- PISA, TIMSS, SEA-PLM and the NAT: What EDCOM II Found (this post)
- Mother Tongue After RA 12027: Language of Instruction
- Why DepEd Bought Only 27 Textbook Titles in 2012-2023
- RA 12080, Bullying and School Mental Health: EDCOM II
- RA 11650 and Learners With Disabilities: EDCOM II Findings
- Senior High School and Jobs: EDCOM II Workforce Findings
Schools, teachers and governance:
- Teacher Workload and Accountability: EDCOM II Findings
- Local School Boards and the Special Education Fund
- Local Education Models in EDCOM II: What the Evidence Shows
- Education in the Bangsamoro: EDCOM II Findings for BARMM
Written by Mark Anthony Llego for NASH Reviewer. Sources: EDCOM II Year One (2024), Year Two (2025) and Final (2026) Reports and the National Education Plan document (2026); EDCOM II news releases, 2026; OECD PISA country notes; UNICEF Philippines; DepEd Orders No. 55, s. 2016, 29, s. 2017, 027, s. 2022, 018, s. 2025, 009, s. 2026, 015, s. 2026 and 017, s. 2026; DepEd Memoranda No. 016, s. 2024, 019, 024, 069, 082, 087 and 108, s. 2025, and 014 and 016, s. 2026. Charts may be reused only with written permission from support@nash.com.ph.