On DepEd’s Grade 6 National Achievement Test (NAT) for SY 2023-2024, the same test in the same year, the 814 private schools averaged 53.2 points and the 5,822 public schools 61.0, weighted by test-takers, and the gap is absent in only one subject, English.
The Early Language, Literacy and Numeracy Assessment (ELLNA) and Comprehensive Rapid Literacy Assessment (CRLA) files contain only public schools. The NAT file is different. Alongside the public schools, it lists private schools in the same five regions and 44 divisions. Each school has the same school-level mean percentage scores (MPS) by subject and the same count of test-takers. It is the one place in DepEd’s open data where the two sectors can be compared this way.
The comparison does not go the way most people would expect. Only 3.4% of private schools reached a mean of 75, the proficiency mark, against 20.7% of public schools. The gap is present in four of the five subjects and in 31 of the 35 divisions with enough private schools to compare. It also appears in every band of school size and test-taker count.
Key findings
- Private schools averaged 53.2 on the SY 2023-2024 Grade 6 NAT and public schools 61.0, weighted by test-takers. Only 3.4% of private schools reached the 75-point proficiency mark, against 20.7% of public schools.
- The gap survives every check the file allows. Within the same division it is 6.8 points (95% interval 9.6 to 4.0). With shrunk school means it is 5.8, and with school size and test-taker controls it is 6.3.
- English is the one subject with no gap. The within-division difference is −0.3 points (interval −3.0 to +2.5), and 19.4% of private schools reach 75 in English. Private schools trail by 12.2 points in Araling Panlipunan and 10.4 in Filipino.
- Private schools score lower in 31 of the 35 divisions with at least five private schools, and higher in four. The largest regional gap is in Region VIII, 14.0 points.
- The file cannot settle selection. The 814 private schools are 58% of private schools with Grade 6 learners in the covered divisions, chosen by an unpublished rule, and the file has no learner characteristics.
Private vs public NAT Grade 6 means
| Sector | Schools | Test-takers | Test-takers per school (median) | Mean score, test-taker weighted | Median school mean | Mean of shrunk school means | Schools with a mean of 75 or more | Schools with a mean below 50 | Median learners in school |
|---|---|---|---|---|---|---|---|---|---|
| Public | 5,822 | 47,917 | 6 | 61 | 63.2 | 61.5 | 20.7% | 24.1% | 169 |
| Private | 814 | 4,844 | 5 | 53.2 | 53.7 | 54.4 | 3.4% | 36.5% | 168 |
The private schools in the file score lower on every summary measure. Their median school mean is 53.7 against 63.2. Their school means are also less spread out, with a standard deviation of 11.0 points against 14.8. The private distribution is therefore not the public distribution with a longer left tail. It is shifted lower as a whole. 36.5% of private schools have a mean below 50, against 24.1% of public schools.
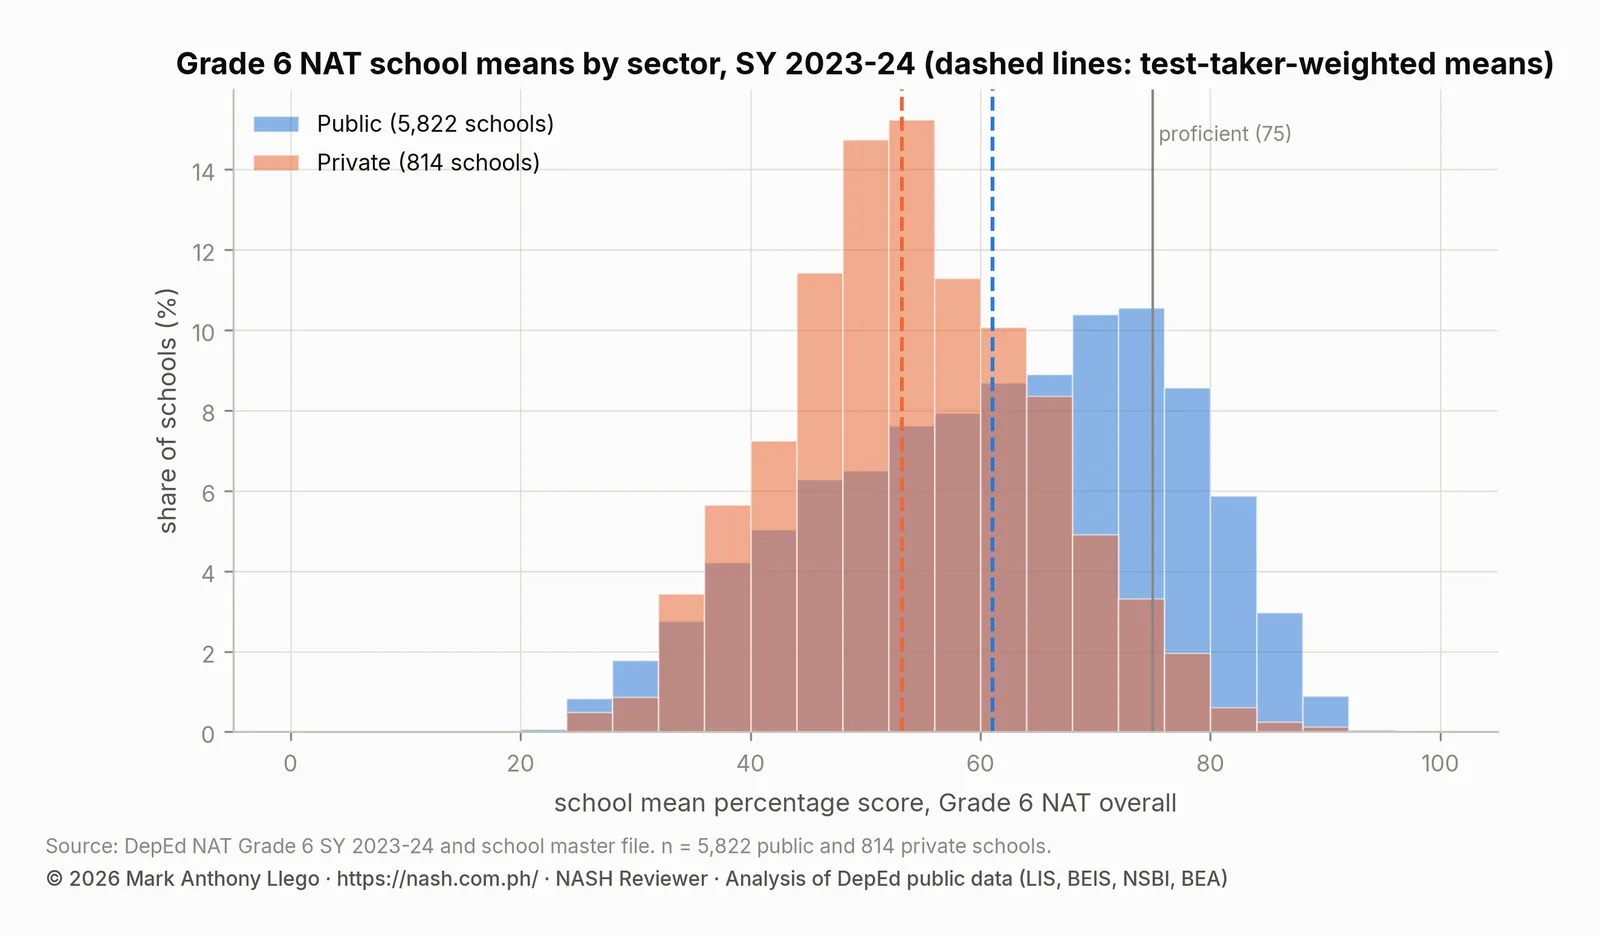
In DepEd’s proficiency bands, 60.1% of private schools are Nearly Proficient, 36.5% Low Proficient and 3.4% Proficient. Public schools are 55.1% Nearly Proficient, 24.0% Low Proficient and 20.5% Proficient.
| Sector | Not Proficient | Low Proficient | Nearly Proficient | Proficient | Highly Proficient |
|---|---|---|---|---|---|
| Public | 0.2% | 24.0% | 55.1% | 20.5% | 0.2% |
| Private | 0.0% | 36.5% | 60.1% | 3.4% | 0.0% |
Private vs public NAT scores by subject
| Subject | Public mean | Private mean | Difference, private minus public | Public schools at 75 or more | Private schools at 75 or more |
|---|---|---|---|---|---|
| Overall | 61 | 53.2 | -7.9 | 20.7% | 3.4% |
| Filipino | 66.9 | 56.5 | -10.4 | 29.5% | 4.9% |
| English | 63.3 | 62 | -1.3 | 29.6% | 19.4% |
| Mathematics | 57.2 | 48.5 | -8.7 | 23.4% | 5.0% |
| Science | 54.4 | 47.6 | -6.8 | 11.2% | 2.0% |
| Araling Panlipunan | 63.2 | 51 | -12.2 | 31.6% | 7.1% |
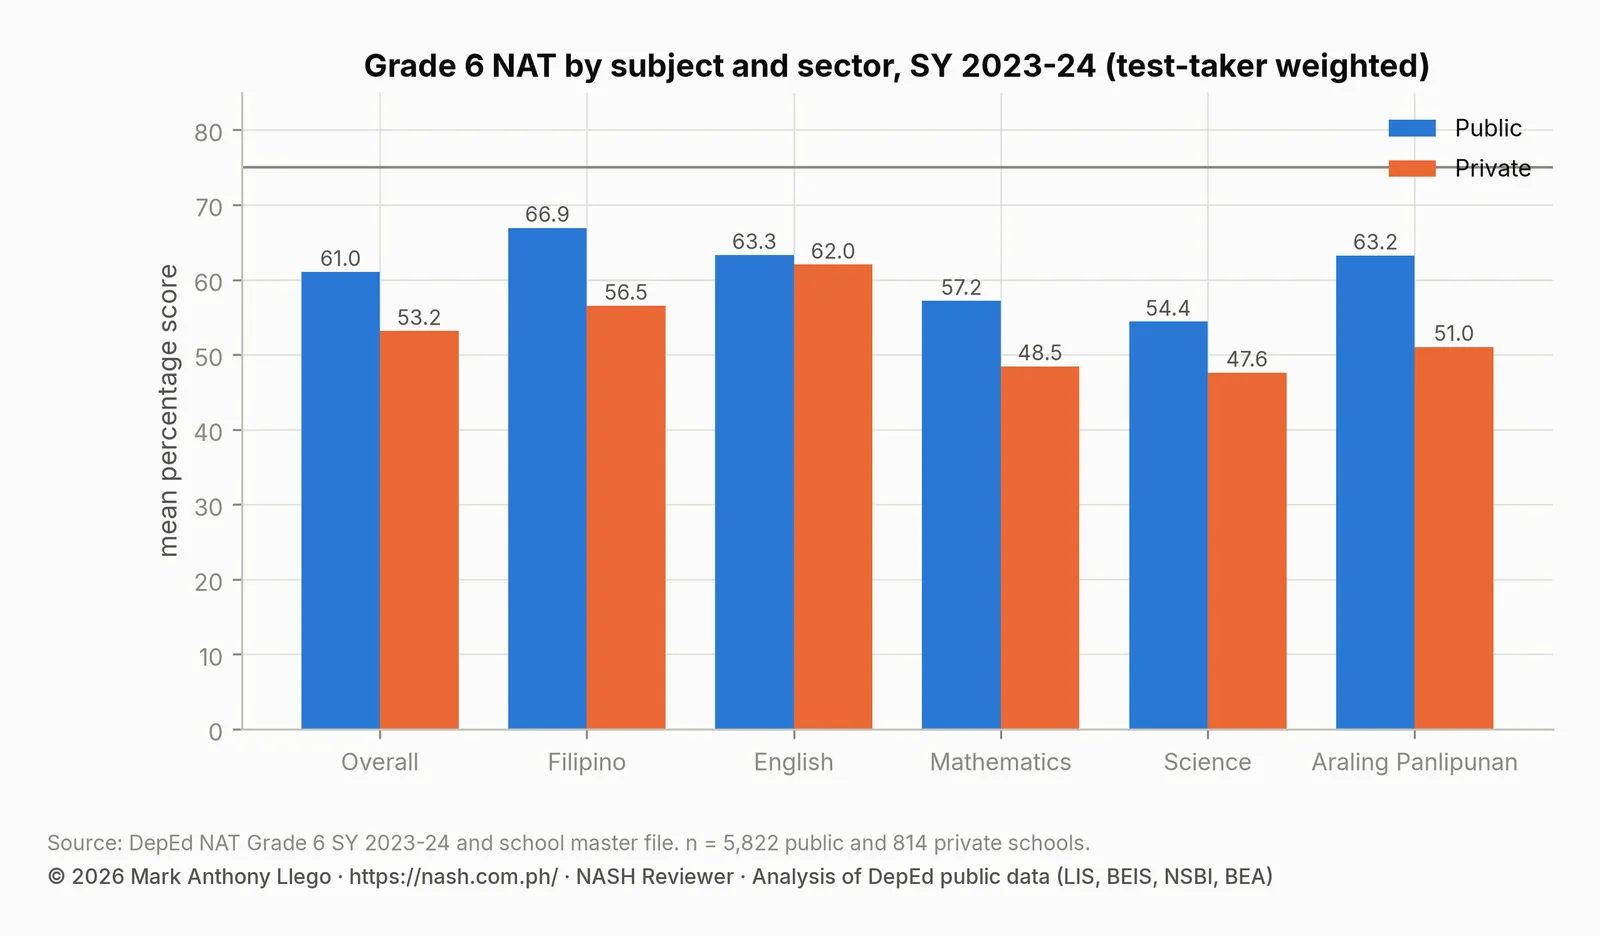
The gap is not uniform across subjects, and the pattern is informative. Private schools trail by 12.2 points in Araling Panlipunan and 10.4 in Filipino, with smaller gaps in Mathematics and Science. In English the raw difference is 1.3 points. Once schools are compared with others in the same division, the English difference is −0.3 points with an interval from −3.0 to +2.5, which is no difference at all. In English, 19.4% of private schools reach a mean of 75, the only subject in which the private share is in double digits.
The two subjects with the largest gaps, Filipino and Araling Panlipunan, are the two taught and tested in Filipino. The file cannot say why. What it shows is that the private schools in this sample are not weak in every subject: they are at par in English and well behind in everything else.
Checks for sampling noise, division and school size
A Grade 6 NAT school mean rests on about six sampled learners: a median of 6 in public schools and 5 in private schools. A single school’s mean is therefore noisy, and the NAT Grade 6 results by division report puts the 95% margin at about six points. Noise does not create a difference between two groups of hundreds of schools, but three other things could. Private schools may be concentrated in weaker divisions, the private schools in the file may be smaller, and the file’s private schools may be an unrepresentative selection. The table below works through the checks.
| Comparison | Private minus public | 95% interval |
|---|---|---|
| Raw difference of test-taker-weighted means | -7.9 | |
| Within the same division, weighted by test-takers | -6.8 | -9.6 to -4.0 |
| Within division, unweighted school means | -6.2 | -8.5 to -4.0 |
| Within division, shrunk school means | -5.8 | -7.9 to -3.8 |
| Within division, adjusting for school size and test-takers | -6.3 | -9.0 to -3.6 |
| Within division, Overall | -6.8 | -9.6 to -4.0 |
| Within division, Filipino | -10.1 | -12.0 to -8.1 |
| Within division, English | -0.3 | -3.0 to +2.5 |
| Within division, Mathematics | -7.2 | -11.1 to -3.4 |
| Within division, Science | -5.7 | -8.5 to -2.8 |
| Within division, Araling Panlipunan | -10.7 | -13.8 to -7.7 |
Comparing each private school only with public schools in its own division, weighted by test-takers, leaves a gap of 6.8 points with a 95% interval from 9.6 to 4.0. The empirical-Bayes shrunk school means from the NAT report pull every small-sample mean toward its division mean and so remove most of the sampling noise. Using them leaves a gap of 5.8 points. Adding school size and the number of test-takers as controls leaves 6.3. The gap is somewhat smaller than the raw 7.9 because private schools are more common in the weaker divisions of Region III and Region I. Most of it remains.
The gap also holds within every band of test-taker count and school size. Private schools with 1 to 5 test-takers average 55.0 against 61.6 for public schools with the same count. With 11 to 20 test-takers, the figures are 51.5 against 62.1. By school size, private means rise from 50.9 in schools with 100 learners or fewer to 56.3 in schools with more than 1,000. Public means run from 59.7 to 62.4. The larger private schools do better than the small ones, and they still trail public schools of every size.
| Test-takers in the school | Public schools | Public mean | Private schools | Private mean |
|---|---|---|---|---|
| 1–5 | 2,724 | 61.6 | 429 | 55 |
| 6 | 737 | 61.2 | 104 | 53 |
| 7–10 | 1,142 | 60.6 | 184 | 52.9 |
| 11–20 | 871 | 62.1 | 95 | 51.5 |
| 21–50 | 285 | 62.3 | 2 | 63.2 |
| over 50 | 63 | 55.1 | 0 |
| Learners in the school | Public schools | Public mean | Private schools | Private mean |
|---|---|---|---|---|
| 1–100 | 1,576 | 59.7 | 261 | 50.9 |
| 101–200 | 1,752 | 62.2 | 190 | 53.1 |
| 201–500 | 1,629 | 62.4 | 201 | 53.6 |
| 501–1,000 | 580 | 62.3 | 96 | 54.7 |
| over 1,000 | 285 | 58.8 | 66 | 56.3 |
Selection is the one check the file cannot complete. Of the 1,392 private schools with Grade 6 learners in the 44 covered divisions, 814 (58%) are in the NAT file. Of 11,530 public schools with Grade 6 learners, 5,822 (50%) are. The coverage rates are similar, but nothing in the file says how the schools were chosen or whether the private schools that took the test are typical of private schools. They do tend to be small: 32% have 100 learners or fewer, against 27% of the public NAT schools.
Private vs public NAT gap by region and division
| Region | Public schools | Private schools | Public mean | Private mean | Difference | Private share of NAT schools |
|---|---|---|---|---|---|---|
| CAR | 687 | 91 | 56.5 | 53.2 | -3.3 | 11.7% |
| Region I | 1,094 | 156 | 59.9 | 52.7 | -7.2 | 12.5% |
| Region III | 1,344 | 442 | 60 | 53.4 | -6.5 | 24.7% |
| Region IX | 758 | 37 | 54 | 51.7 | -2.3 | 4.7% |
| Region VIII | 1,939 | 88 | 67.1 | 53.1 | -14 | 4.3% |
The gap is largest in Region VIII, at 14.0 points. There, public schools have the highest NAT mean of the five regions, 67.1, and private schools average 53.1. The gap is smallest in Region IX (2.3 points) and CAR (3.3). Region III has the most private schools in the file, 442, a quarter of all NAT schools there, and a 6.5-point gap.
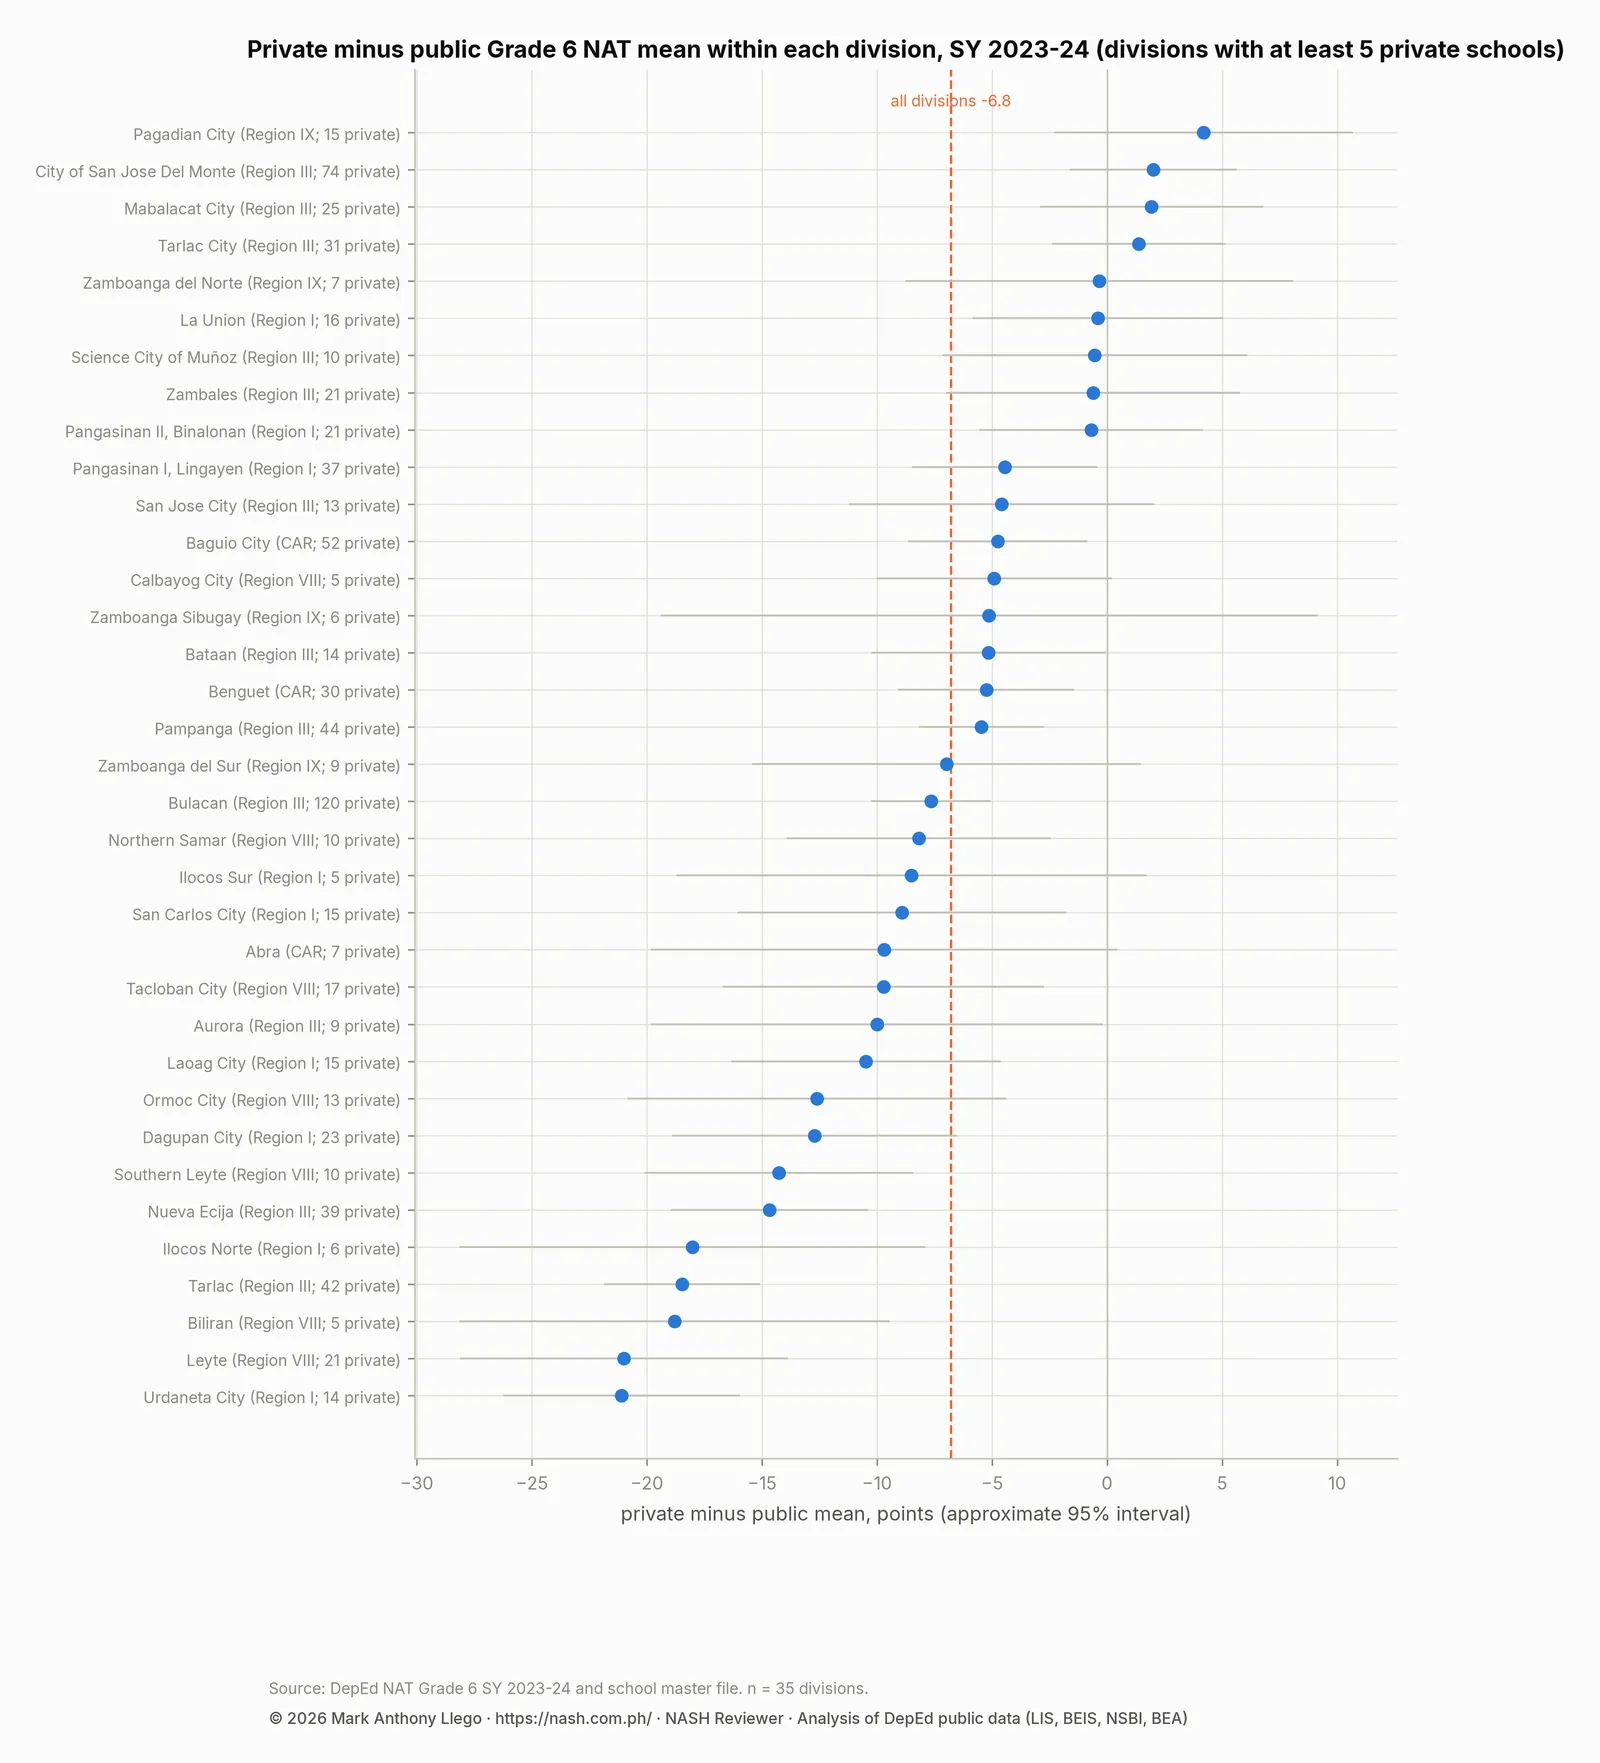
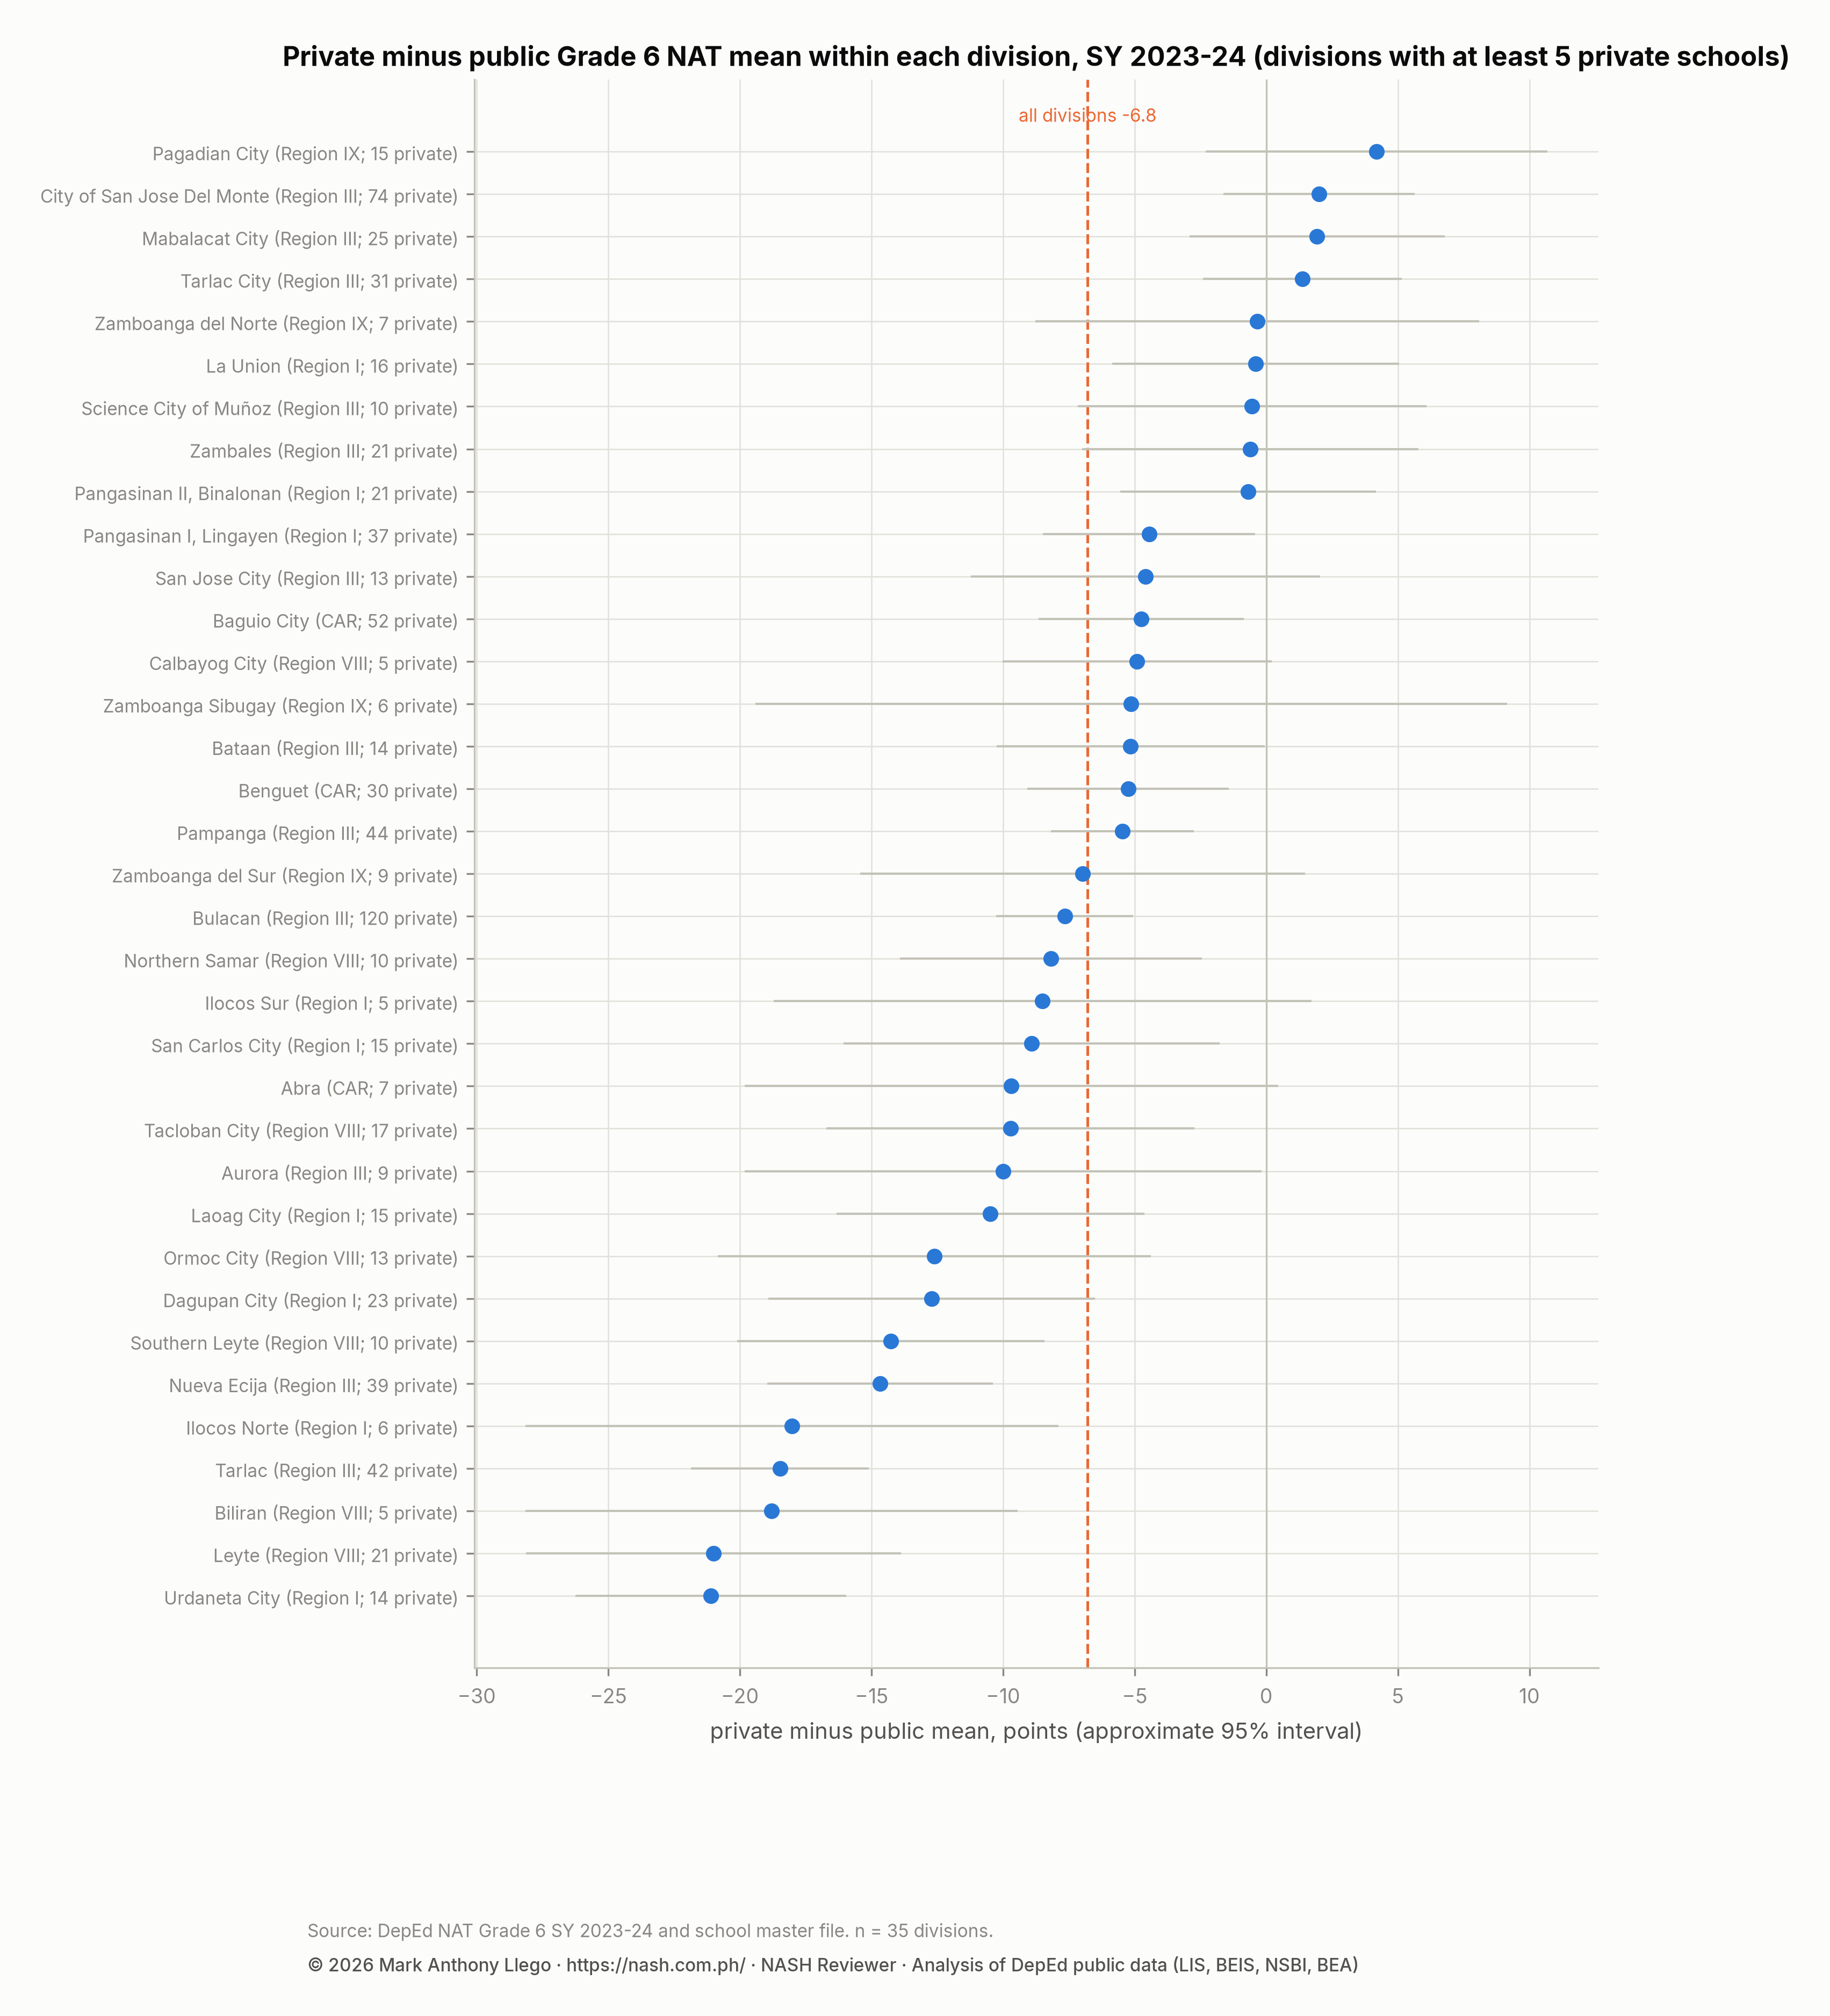
Thirty-five divisions have at least five private schools in the file. Private schools score lower in 31 of them and higher in four. In 20 divisions the difference is large enough that its approximate 95% interval excludes zero; none of the four reversals is. The largest gaps are in Urdaneta City (−21.1 points), Leyte (−21.0), Biliran (−18.8), Tarlac (−18.5) and Ilocos Norte (−18.0). In all five, public schools score in the high sixties or low seventies.
Private schools score higher in four divisions: Pagadian City (+4.2), the City of San Jose del Monte (+2.0), Mabalacat City (+1.9) and Tarlac City (+1.4). In all four, public schools score in the low fifties or sixties. Bulacan has 120 private schools in the file, the most of any division, and a gap of 7.7 points. Baguio City, with 52, has a gap of 4.7.
| Division | Region | Public schools | Private schools | Public mean | Private mean | Private minus public | Approximate 95% interval |
|---|---|---|---|---|---|---|---|
| Urdaneta City | Region I | 44 | 14 | 70.2 | 49.1 | -21.1 | -26.2 to -16.0 |
| Leyte | Region VIII | 516 | 21 | 73.6 | 52.6 | -21 | -28.1 to -13.9 |
| Biliran | Region VIII | 87 | 5 | 74.2 | 55.4 | -18.8 | -28.2 to -9.4 |
| Tarlac | Region III | 207 | 42 | 67.8 | 49.3 | -18.5 | -21.9 to -15.1 |
| Ilocos Norte | Region I | 107 | 6 | 74.3 | 56.3 | -18 | -28.2 to -7.9 |
| Nueva Ecija | Region III | 246 | 39 | 69.2 | 54.5 | -14.7 | -19.0 to -10.4 |
| Southern Leyte | Region VIII | 121 | 10 | 69.8 | 55.6 | -14.3 | -20.1 to -8.4 |
| Dagupan City | Region I | 34 | 23 | 62.9 | 50.1 | -12.7 | -18.9 to -6.5 |
| Ormoc City | Region VIII | 80 | 13 | 72.7 | 60.1 | -12.6 | -20.8 to -4.4 |
| Laoag City | Region I | 34 | 15 | 66.6 | 56.1 | -10.5 | -16.3 to -4.6 |
| Aurora | Region III | 74 | 9 | 52.1 | 42.1 | -10 | -19.8 to -0.2 |
| Tacloban City | Region VIII | 47 | 17 | 62 | 52.3 | -9.7 | -16.7 to -2.7 |
| Abra | CAR | 153 | 7 | 58.4 | 48.7 | -9.7 | -19.8 to +0.4 |
| San Carlos City | Region I | 59 | 15 | 64.4 | 55.5 | -8.9 | -16.1 to -1.8 |
| Ilocos Sur | Region I | 184 | 5 | 61.7 | 53.2 | -8.5 | -18.7 to +1.7 |
| Northern Samar | Region VIII | 340 | 10 | 52.6 | 44.4 | -8.2 | -13.9 to -2.5 |
| Bulacan | Region III | 173 | 120 | 62.2 | 54.5 | -7.7 | -10.3 to -5.0 |
| Zamboanga del Sur | Region IX | 283 | 9 | 54.4 | 47.4 | -7 | -15.4 to +1.5 |
| Pampanga | Region III | 215 | 44 | 57.6 | 52.2 | -5.5 | -8.2 to -2.7 |
| Benguet | CAR | 204 | 30 | 57 | 51.8 | -5.2 | -9.1 to -1.4 |
| Bataan | Region III | 70 | 14 | 61.8 | 56.6 | -5.2 | -10.2 to -0.1 |
| Zamboanga Sibugay | Region IX | 131 | 6 | 60.3 | 55.2 | -5.1 | -19.4 to +9.2 |
| Calbayog City | Region VIII | 149 | 5 | 74.5 | 69.6 | -4.9 | -10.0 to +0.2 |
| Baguio City | CAR | 44 | 52 | 59.1 | 54.4 | -4.7 | -8.7 to -0.8 |
| San Jose City | Region III | 48 | 13 | 59.8 | 55.2 | -4.6 | -11.2 to +2.0 |
| Pangasinan I, Lingayen | Region I | 266 | 37 | 55.4 | 50.9 | -4.5 | -8.5 to -0.4 |
| Pangasinan II, Binalonan | Region I | 184 | 21 | 50.3 | 49.6 | -0.7 | -5.5 to +4.2 |
| Zambales | Region III | 115 | 21 | 52.4 | 51.8 | -0.6 | -7.0 to +5.8 |
| Science City of Muñoz | Region III | 32 | 10 | 56.9 | 56.4 | -0.5 | -7.2 to +6.1 |
| La Union | Region I | 157 | 16 | 64 | 63.6 | -0.4 | -5.9 to +5.0 |
| Zamboanga del Norte | Region IX | 282 | 7 | 50.2 | 49.9 | -0.3 | -8.8 to +8.1 |
| Tarlac City | Region III | 88 | 31 | 61 | 62.4 | 1.4 | -2.4 to +5.2 |
| Mabalacat City | Region III | 40 | 25 | 51.2 | 53.1 | 1.9 | -2.9 to +6.8 |
| City of San Jose Del Monte | Region III | 36 | 74 | 48.4 | 50.5 | 2 | -1.6 to +5.6 |
| Pagadian City | Region IX | 62 | 15 | 49.9 | 54.1 | 4.2 | -2.3 to +10.7 |
What the file cannot settle
- Who took the test. DepEd samples about six Grade 6 learners per school. If private schools’ samples were drawn differently, the comparison would be biased. The same is true if the learners who took the test in private schools were a different mix from those in public schools. The file does not reveal the direction of any such bias.
- Which private schools are in the file. The 814 schools are 58% of the private schools with Grade 6 learners in the covered divisions. The selection rule is not published.
- What the private schools are. The file distinguishes sectarian from non-sectarian schools but not fee levels, curricula or whether a school follows the K to 12 curriculum the NAT is aligned to. The English result suggests that the language of instruction matters, but the file cannot confirm it.
- Whether learners differ. The file has no learner characteristics. A private school whose learners arrive with less preparation, or that admits learners public schools would not, could score lower for reasons that have nothing to do with teaching.
What the file does settle is narrower and still worth knowing. On this test, in this year and in these divisions, being a private school did not predict a higher score. In most divisions it predicted a lower one.
What this means for school heads
For public school heads, the result removes an excuse and adds a responsibility. The excuse is that private schools would always outscore a public school in the same town. In 31 of 35 divisions they did not. The responsibility is the English result. English is the one subject in which private schools matched public schools, which means public schools have no lead in it. The Philippine Professional Standards for School Heads (PPSSH) asks a Career Stage 1 school head to “set achievable and challenging learning outcomes” (indicator 3.4.1) from evidence like this. It asks a Career Stage 2 head to “utilize learning outcomes in developing data-based interventions” (3.4.2). The EDCOM II Final Report guide for aspiring school heads explains why the Commission wants an assessment system in which such comparisons can be made every year rather than once.
For anyone comparing sectors, the result shows that a school’s sector is a weak predictor of its results. Its division, its size and the six learners who happened to be sampled matter more. The guide How to Read DepEd Data covers the margin of error on a six-learner mean.
Frequently asked questions
Do private schools score higher than public schools on the DepEd NAT Grade 6?
No, not in the SY 2023-2024 Grade 6 file. The 814 private schools averaged 53.2 points, weighted by test-takers, against 61.0 for 5,822 public schools. Within the same divisions the gap is 6.8 points, and it appears in 31 of the 35 divisions with at least five private schools.
Is the private-public NAT gap caused by school size or sampling?
No. Small size does not explain it, because private schools trail public schools of every size and every test-taker count. Sampling noise does not explain it, because shrunk means that remove most of the noise leave a 5.8-point gap. The file cannot say whether the private schools in it are typical of private schools, or whether their sampled learners are typical.
In which NAT subject are private schools at par with public schools?
English is the one subject at par. The within-division difference is −0.3 points with an interval that includes zero. 19.4% of private schools reach a mean of 75 in English, against 3.4% on the overall test.
Download the data
The cleaned, harmonized DepEd files behind this series are free to download in CSV and Parquet, with a codebook and checksums, under the terms of use set out in the release. Download Cleaned DepEd School Data, SY 2017-18 to 2025-26 documents every file and column. The files themselves are at data.nash.com.ph, starting with the README, the SY 2023-24 school master file (CSV, 8.0 MB) and the nine-year enrollment panel (Parquet, 17.2 MB).
More in this series
- NAT Grade 6 Results SY 2023-2024: DepEd Division Scores
- Do the Same DepEd Schools Lag on the ELLNA, NAT and CRLA?
- ELLNA Grade 3 Results SY 2023-2024: DepEd Division Scores
- DepEd School Inputs vs Test Results: Multigrade and Internet
- DepEd Open Data Quality: Errors, Blanks and Coverage Limits
- DepEd Data for Aspiring School Heads: Where to Start
- For aspiring school heads: How to Read DepEd Data and the full report, Philippine basic education in numbers
Analysis and charts by Mark Anthony Llego for NASH Reviewer. Data: Department of Education NAT Grade 6 results SY 2023-24 and school characteristics SY 2023-24 (public datasets). Charts may be reused only with written permission from support@nash.com.ph.