Most of the variation between schools in CRLA results lies between schools in the same division, not between divisions or regions. In the end-of-year CRLA for SY 2025-26, 65% of the variation between schools in the share of struggling readers sits between schools within a division (95% interval 57% to 71%), 22% between divisions in the same region (17% to 26%) and 13% between regions (6% to 25%). Two schools picked at random from the same division differ in their odds of struggling by a median factor of 3.19, against 1.95 for two divisions in a region and 1.68 for two regions.
The results are those of 5,127,670 learners in 38,679 public schools on the EDCOM II early-childhood (ECCD) dashboard as of 10 May 2026. A three-level model separates real differences from the chance swings of small schools and splits what remains across the three levels. The answer holds in every grade and language: across all learners and the five grade-and-language blocks, the share lying between schools in the same division ranges from 65% to 70%.
Key findings
- Of the variation between schools in the share of struggling readers, 65% (95% interval 57% to 71%) lies between schools in the same division, 22% (17% to 26%) between divisions in the same region and 13% (6% to 25%) between regions.
- The median odds ratio between two schools in the same division is 3.19 (95% interval 3.15 to 3.23), against 1.95 (1.83 to 2.09) between two divisions in a region and 1.68 (1.40 to 2.14) between two regions.
- The division and region intervals overlap, so the data cannot firmly rank those two levels; the probability that divisions vary more than regions is 0.90. Both hold clearly less than the schools within a division.
- The pattern is the same in all five grade-and-language blocks, where the school share ranges from 69% to 70%. In those blocks, the median odds ratio between two schools in a division runs from 3.74 in Grade 1 Mother Tongue to 3.91 in Grade 3 English, against 3.19 for all learners.
- On the scale the model works on, 41% of all the variation in learners’ underlying propensity to struggle lies between schools (regions, divisions and schools together); the rest lies among learners in the same school.
- Every fit passed standard convergence checks: the largest R-hat is 1.007 and the smallest effective sample size 455.
CRLA variation: school, division or region?
Shares of struggling readers differ at every level. Among regions they range from NCR (5.3%) to BARMM (23.4%); among divisions, from 0.1% to 46.3%. Schools spread wider still. A struggling reader is a learner at Low Emerging or High Emerging, and each learner is counted once: Grade 1 by the Mother Tongue result, Grade 2 by Filipino and Grade 3 by English. Nationally, 10.0% of learners are struggling readers; CRLA End-of-Year Results SY 2025-26: All 18 Regions gives the national and regional picture.
These raw ranges cannot say at which level the differences sit, for two reasons. First, levels are nested: a region’s share averages its divisions, and a division’s share averages its schools, so a gap between two regions may simply reflect a few divisions inside them. Second, raw school shares mix real differences with chance. A school that assessed a handful of learners can show a very high or very low share by luck alone, as How to Read a School’s CRLA Results Fairly explains.
The question matters for planning. If most of the difference lay between regions, regional averages would describe schools well. If it lies between schools in the same division, a division’s average hides most of the differences among its schools, and support has to be aimed at schools.
How the three-level model splits the variation
The model works on the log-odds scale, where a share of struggling readers becomes the logarithm of its odds (the share divided by one minus the share). Each school’s log-odds is built from four parts: an overall level, a shift for its region, a shift for its division within the region, and a shift for the school within its division. The model assumes each set of shifts follows a normal distribution and estimates how widely each set is spread.
Chance is handled separately. The model treats each school’s count of struggling readers as a binomial draw from the school’s underlying rate, so the noise of small schools is not mistaken for real differences. The spread it estimates at the school level is the variation left after that noise is accounted for.
For all learners, the standard deviations on the log-odds scale are 0.54 for regions, 0.70 for divisions within a region and 1.21 for schools within a division. Variances (squared standard deviations) add up across levels, so each level’s share of the variation between schools is its variance divided by the sum of the three. That share is a version of the variance partition coefficient used in multilevel analysis.
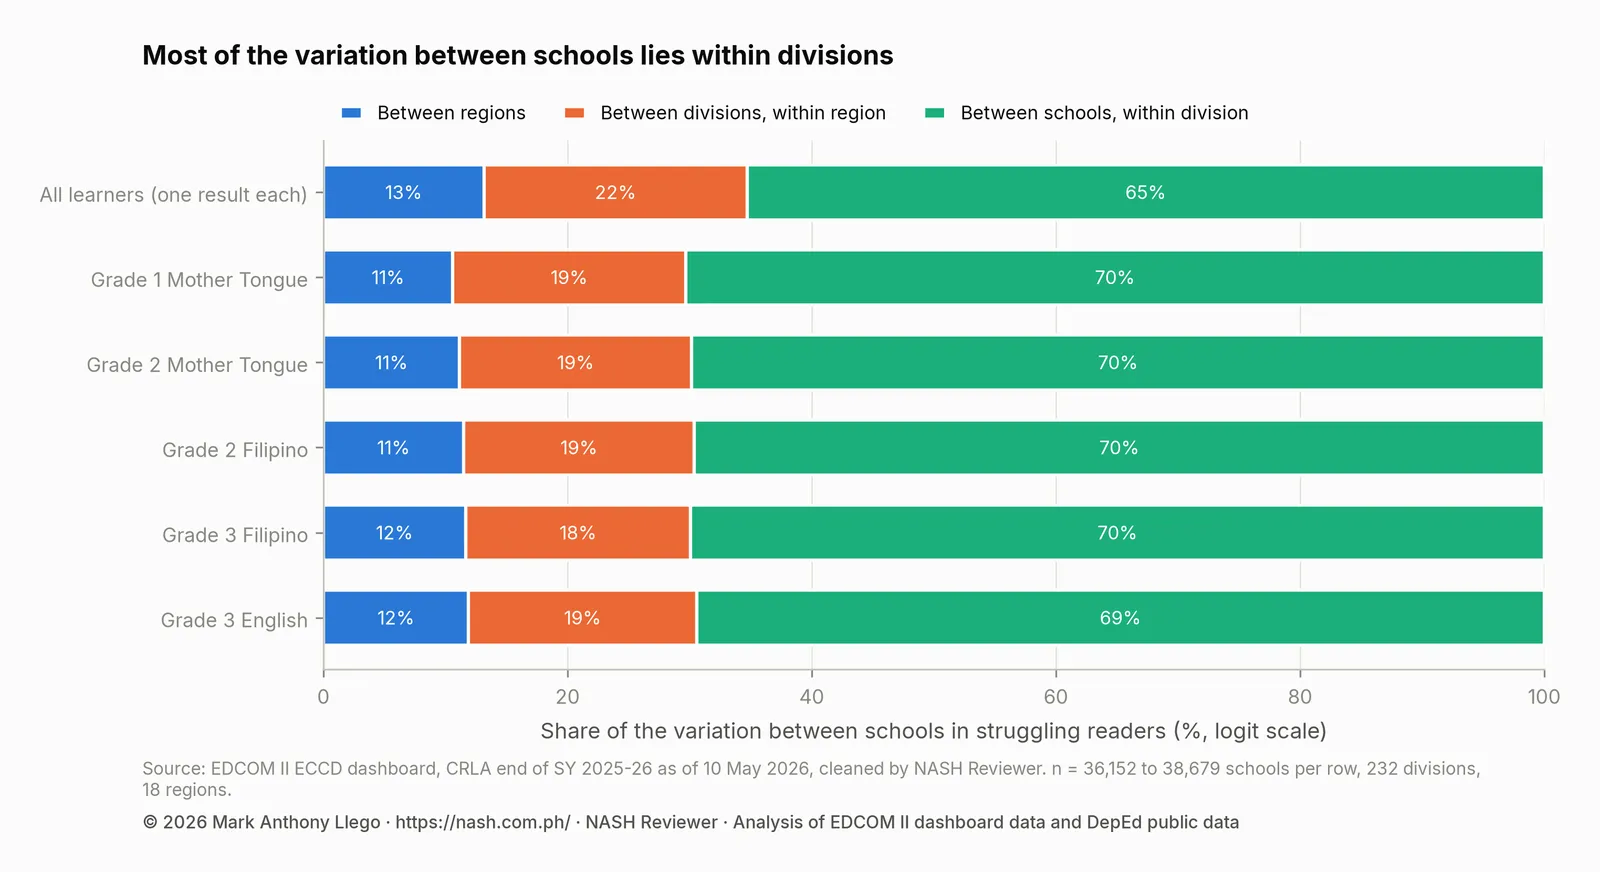
For all learners, 65% of the variation between schools lies between schools in the same division. Divisions within a region account for 22% and regions for 13%. The region interval is wide, 6% to 25%, because there are only 18 regions to learn its spread from. Because the three shares add up to the whole, that uncertainty also widens the interval of the school share, 57% to 71%, even though the school-level spread itself is pinned down closely: its median odds ratio, described next, has an interval of 3.15 to 3.23.
Median odds ratios: how far apart two schools, divisions or regions are
Shares of variance are hard to picture. The median odds ratio (MOR), introduced by Larsen and colleagues (2000) and explained for a wider audience by Larsen and Merlo (2005) and Merlo and colleagues (2006), turns a standard deviation on the log-odds scale into an odds ratio that people can read. Pick two units at random from the same level, put the one with the higher odds of struggling first, and divide its odds by the other’s. The MOR is the median of that ratio over all such pairs. A median odds ratio of 1 means no difference at that level.
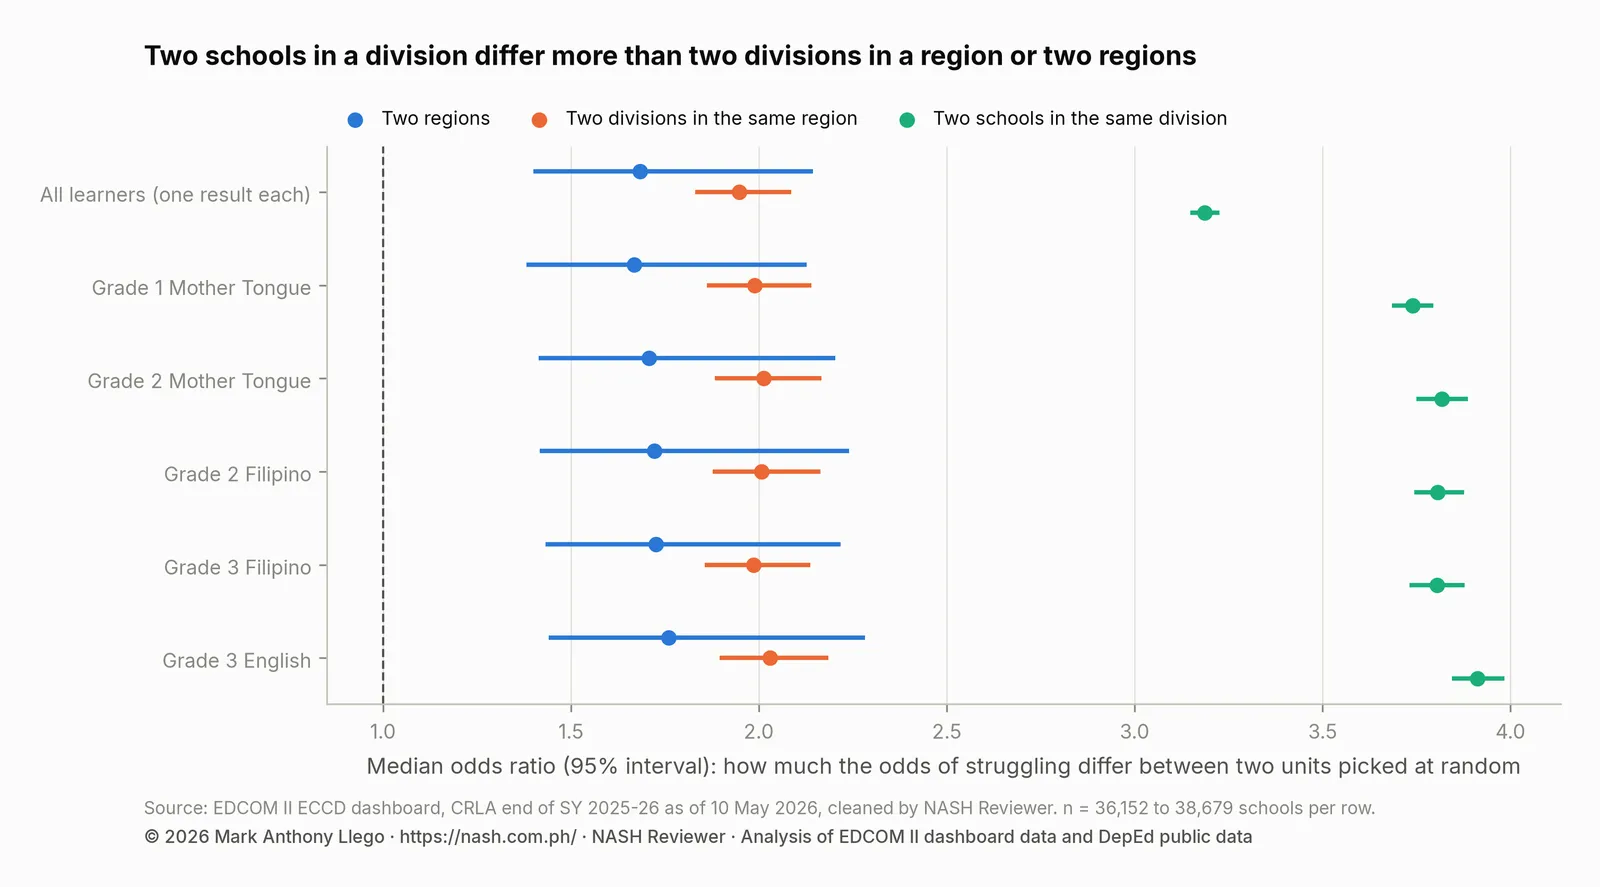
For all learners, two schools picked at random from the same division differ in their odds of struggling by a median factor of 3.19 (95% interval 3.15 to 3.23). Two divisions in the same region differ by 1.95 (1.83 to 2.09), and two regions by 1.68 (1.40 to 2.14). In every block, the school interval lies wholly above the division and region intervals.
The MOR describes a typical pair, not the extremes: half of all pairs of regions differ by more than 1.68 and half by less, and the lowest and highest regions are among the furthest apart. The table gives the MOR for each level and block.
| Grade and language | Median odds ratio, region (95% interval) | Median odds ratio, division (95% interval) | Median odds ratio, school (95% interval) |
|---|---|---|---|
| All learners (one result each) | 1.68 (1.40–2.14) | 1.95 (1.83–2.09) | 3.19 (3.15–3.23) |
| Grade 1 Mother Tongue | 1.67 (1.38–2.13) | 1.99 (1.86–2.14) | 3.74 (3.68–3.79) |
| Grade 2 Mother Tongue | 1.71 (1.41–2.20) | 2.01 (1.88–2.17) | 3.82 (3.75–3.89) |
| Grade 2 Filipino | 1.72 (1.42–2.24) | 2.01 (1.88–2.16) | 3.81 (3.74–3.88) |
| Grade 3 Filipino | 1.73 (1.43–2.22) | 1.99 (1.86–2.14) | 3.80 (3.73–3.88) |
| Grade 3 English | 1.76 (1.44–2.28) | 2.03 (1.90–2.19) | 3.91 (3.84–3.98) |
The division MOR deserves attention too. Two divisions in the same region typically differ by a factor of about 1.95 in their odds of struggling, after their region’s level is taken into account. Divisions differ substantially, even though schools within them differ more.
The same pattern in every grade and language
Each of the five grade-and-language blocks was fitted on its own: Grade 1 Mother Tongue, Grade 2 Mother Tongue, Grade 2 Filipino, Grade 3 Filipino and Grade 3 English. A block counts only the schools that assessed learners in it, so the number of schools differs slightly from block to block. The table gives each level’s share of the variation between schools, with 95% intervals, and the share of all variation that lies between schools.
| Grade and language | Schools | Region: share of between-school variation (95% interval) | Division: share of between-school variation (95% interval) | School: share of between-school variation (95% interval) | Between-school share of all variation (latent scale) |
|---|---|---|---|---|---|
| All learners (one result each) | 38,679 | 13% (6%–25%) | 22% (17%–26%) | 65% (57%–71%) | 41% |
| Grade 1 Mother Tongue | 38,234 | 11% (5%–21%) | 19% (16%–23%) | 70% (62%–76%) | 45% |
| Grade 2 Mother Tongue | 36,152 | 11% (5%–21%) | 19% (15%–23%) | 70% (62%–75%) | 46% |
| Grade 2 Filipino | 37,227 | 11% (5%–23%) | 19% (15%–23%) | 70% (61%–75%) | 46% |
| Grade 3 Filipino | 37,589 | 12% (5%–22%) | 18% (15%–22%) | 70% (61%–76%) | 46% |
| Grade 3 English | 37,860 | 12% (5%–22%) | 19% (15%–22%) | 69% (61%–75%) | 47% |
The split barely moves. Counting all learners and the five blocks, the school share ranges from 65% to 70%, the division share stays near a fifth and the region share a little above a tenth. The division estimate is the larger of the two in every fit, and the probability that divisions vary more than regions ranges from 0.89 to 0.93 across the blocks. Languages and grades differ in how many learners struggle, as CRLA by Language: Mother Tongue, Filipino and English shows, but not in where the variation sits.
The school-level spread is larger in each single block than for all learners together. The school MOR is 3.74 in Grade 1 Mother Tongue, 3.81 in Grade 2 Filipino and 3.91 in Grade 3 English, against 3.19 for all learners. This is what one would expect if each grade’s results in a school have a part of their own, such as one class, its teacher or the day the screen was given, which partly cancels out when three grades are pooled. These data cannot test that reading directly, and other readings cannot be ruled out, such as the model’s weaker fit to schools with no struggling reader, which are more common when a block has fewer learners per school.
How much of the difference between learners lies between schools
The shares above split only the variation between schools. A second question is how much of all the variation, including the differences among learners in the same school, lies between schools. On the model’s underlying scale, 41% does: 5% between regions, 9% between divisions within a region and 27% between schools within a division. The rest lies among learners who share a school. So the 65% share earlier is a share of this 41%, not of all variation.
The underlying scale needs a word of explanation. For a yes-or-no outcome such as struggling or not, a common approach imagines an underlying propensity to struggle for each learner on a continuous logistic scale. On that scale the variance among learners in the same school is fixed at pi squared over three, the variance of the standard logistic distribution, and each of the three between-school variances (region, division and school) is divided by the total of all four. Snijders and Bosker (2012) describe this approach; Goldstein, Browne and Rasbash (2002) compare it with other methods.
The between-school share is also the intraclass correlation: the correlation, on the underlying scale, between two learners in the same school. A learner’s school, with its division and region, goes with a large part of the differences among learners, but most of the variation lies among learners who share a school.
What this means for school heads
- Compare with your division, but expect a wide spread. The division average hides most of the differences among its schools. A school well above or below its division’s share is common, not exceptional; read it with its interval before drawing conclusions.
- Aim support at schools, not only at divisions or regions. With 65% of the variation between schools lying inside divisions, a division’s average is a poor guide to which schools need support most. Where Struggling Readers Are Concentrated compares ways of choosing schools.
- Do not dismiss the division and region levels. A typical MOR of 1.95 between divisions in the same region is a large difference. Division and regional differences, which may reflect language, resources and poverty, go with real differences in a school’s starting point.
- Look to other schools in your division for practices worth examining. Schools in the same division share its policies and supervisors, yet their results differ widely. Schools with lower shares are a natural place to start asking what they do differently, keeping in mind that their learners may differ too.
- Do not read the school level as school quality. The school level includes learners’ home language, family circumstances, attendance and how the screen was given and recorded, as well as teaching. It shows where differences sit, not what causes them.
How these numbers were made
The data cover public schools in the 18 regions, with Sulu in Region IX and the Negros Island Region as its own region, and 232 divisions. Each school is one row: its count of struggling readers out of the learners it assessed, in all three grades together (Grade 1 Mother Tongue, Grade 2 Filipino and Grade 3 English, each learner once) or in one block.
The model is a Bayesian binomial model with a logit link and normal effects for regions, divisions within regions and schools within divisions. School effects are centered within each division, so the division effect carries the division’s level. The priors are weakly informative: the overall level is centered near the national share of 10.0%, and the three standard deviations have half-normal priors that allow large differences without favoring them. The model was sampled with the No-U-Turn Sampler (via nutpie) in four chains, keeping 4,000 to 8,000 posterior draws per fit (the Grade 2 Filipino fit kept the fewer; every fit passed the checks below). The all-learners fit is the same fit used in How to Read a School’s CRLA Results Fairly; each block was fitted separately with the same model.
Every share and MOR was computed draw by draw from the posterior, so its 95% credible interval (equal-tailed) carries the uncertainty in all three standard deviations. To get the MOR for a level, multiply its standard deviation by the square root of two and by the upper quartile of the standard normal distribution, then take the exponential. R-hat stays below 1.01 in every fit (the largest is 1.007), so the independent chains agree; the smallest effective sample size is 455, above 400. National and regional shares quoted in this post are population values and carry no sampling intervals.
Limits
These results cover one school year. They show where the variation sat at the end of SY 2025-26, not whether that split is stable over time.
The model has three levels. Differences between districts or municipalities inside a division are counted in the school level, so part of what looks like school-to-school variation may sit between groups of nearby schools; CRLA Reading Hotspots shows that struggling readers cluster in place.
The split is unadjusted: the model includes no language, school size or other inputs. Adding them would move some variation out of each level. CRLA by Language shows that divisions still differ after language and size are taken into account.
The shares depend on the scale. On the log-odds scale they are well defined; on the scale of shares of learners they would differ, and the learner-level variance of pi squared over three is a convention, not a measurement.
The model assumes normally distributed effects. It predicts fewer schools with no struggling reader than are reported, as CRLA Schools With No Struggling Readers: A Data Check discusses. The CRLA is a teacher-administered screen, so differences in how it was given are part of the school level.
Frequently asked questions
Do regions or divisions differ more in CRLA results?
Not firmly. Divisions within a region account for 22% of the variation between schools (95% interval 17% to 26%) and regions for 13% (6% to 25%); the intervals overlap. The probability that divisions vary more than regions is 0.90, so divisions are the likelier of the two, but not certainly. Both account for less than the differences between schools in the same division.
What is a median odds ratio?
It is a way to read the spread at one level as an odds ratio. Pick two units at random, such as two schools in the same division, and divide the higher odds of struggling by the lower. Half of all such pairs differ by more than the median odds ratio and half by less. For two schools in the same division it is 3.19.
Does the large share of variation between schools in the same division mean schools cause the differences?
No. The school level holds everything that differs between schools in the same division: learners’ home languages and backgrounds, attendance, school size, how the screen was given, and teaching. The model shows where differences sit, not why. School Resources and CRLA Reading Results looks at which school inputs go with lower shares of struggling readers.
Why does my division’s average not describe my school?
Because most of the variation between schools lies inside divisions. Two schools in the same division typically differ in their odds of struggling by a factor of about 3.19, so a division’s average is a poor guide to any one school. Use your school’s own estimate and interval from the download below.
Download the data
The cleaned EDCOM II dashboard data behind this series are free to download for personal study; to reuse them, email support@nash.com.ph for written permission first. How the EDCOM Dashboard Data Was Cleaned explains every table and cleaning rule. The files are at data.nash.com.ph: start with the README, then the school table with CRLA results and school inputs (Parquet), the school estimates (CSV), the division estimates (CSV) and the municipal table (CSV). The DepEd school files used for school inputs are described in Download Cleaned DepEd School Data.
Every file, with its rows, columns and checksum, is listed on the EDCOM II CRLA data page. To cite the data: Llego, M. A. (2026). EDCOM II early-childhood dashboard data, cleaned, version 1. NASH Reviewer. https://nash.com.ph/edcom-data
More in this series
- CRLA End-of-Year Results SY 2025-26: All 18 Regions
- CRLA Start vs End of SY 2025-26 in the Same Schools
- CRLA by Language: Mother Tongue, Filipino and English
- How to Read a School’s CRLA Results Fairly
- CRLA Variation: School, Division or Region?
- Where Struggling Readers Are Concentrated
- School Resources and CRLA Reading Results
- CRLA Results in Schools With and Without a Principal
- Action Research and Thesis Topics on Reading (CRLA)
- CRLA Reading Hotspots: A Map of Struggling Readers
- Stunting, Day Care Centers and Early Reading
- Literacy and Nutrition Programs Compared With Need
- CRLA Schools With No Struggling Readers: A Data Check
- How the EDCOM Dashboard Data Was Cleaned
- Regional reports: NCR, CAR, Region I, Region II, Region III, Region IV-A, MIMAROPA, Region V, Region VI, NIR, Region VII, Region VIII, Region IX, Region X, Region XI, Region XII, Caraga, BARMM
- Earlier reports: CRLA Results SY 2025-2026 (DepEd’s selected-school file), Do the Same DepEd Schools Lag on the ELLNA, NAT and CRLA?, DepEd School Inputs vs Test Results, EDCOM II Final Report: Guide for Aspiring School Heads, DepEd Data for Aspiring School Heads: Where to Start
Analysis and charts by Mark Anthony Llego for NASH Reviewer. Data: EDCOM II early-childhood dashboard and Department of Education public datasets. NASH Reviewer is not affiliated with EDCOM II or DepEd. Charts may be reused only with written permission from support@nash.com.ph.